Article Text

Abstract
Background Checkpoint inhibitors (CPIs) such as anti-PD(L)-1 and anti-CTLA-4 antibodies have resulted in unprecedented rates of antitumor responses and extension of survival of patients with a variety of cancers. But some patients fail to respond or initially respond but later relapse as they develop resistance to immune therapy. One of the tumor-extrinsic mechanisms for resistance to immune therapy is the accumulation of regulatory T cells (Treg) in tumors. In preclinical and clinical studies, it has been suggested that tumor trafficking of Treg is mediated by CC chemokine receptor 4 (CCR4). Over 90% of human Treg express CCR4 and migrate toward CCL17 and CCL22, two major CCR4 ligands that are either high at baseline or upregulated in tumors on CPI treatment. Hence, CCR4 antagonism has the potential to be an effective antitumor treatment by reducing the accumulation of Treg into the tumor microenvironment (TME).
Methods We developed in vitro and in vivo models to assess Treg migration and antitumor efficacy using a potent and selective CCR4 antagonist, CCR4-351. We used two separate tumor models, Pan02 and CT26 mouse tumors, that have high and low CCR4 ligand expression, respectively. Tumor growth inhibition as well as the frequency of tumor-infiltrating Treg and effector T cells was assessed following the treatment with CCR4 antagonist alone or in combination with CPI.
Results Using a selective and highly potent, novel small molecule inhibitor of CCR4, we demonstrate that migration of CCR4+ Treg into the tumor drives tumor progression and resistance to CPI treatment. In tumor models with high baseline levels of CCR4 ligands, blockade of CCR4 reduced the number of Treg and enhanced antitumor immune activity. Notably, in tumor models with low baseline level of CCR4 ligands, treatment with immune CPIs resulted in significant increases of CCR4 ligands and Treg numbers. Inhibition of CCR4 reduced Treg frequency and potentiated the antitumor effects of CPIs.
Conclusion Taken together, we demonstrate that CCR4-dependent Treg recruitment into the tumor is an important tumor-extrinsic mechanism for immune resistance. Blockade of CCR4 led to reduced frequency of Treg and resulted in increased antitumor activity, supporting the clinical development of CCR4 inhibitors in combination with CPI for the treatment of cancer.
Statement of significance CPI upregulates CCL17 and CCL22 expression in tumors and increases Treg migration into the TME. Pharmacological antagonism of the CCR4 receptor effectively inhibits Treg recruitment and results in enhanced antitumor efficacy either as single agent in CCR4 ligandhigh tumors or in combination with CPIs in CCR4 ligandlow tumors.
- drug therapy
- combination
- immunotherapy
- lymphocytes
- tumor-infiltrating
- tumor escape
This is an open access article distributed in accordance with the Creative Commons Attribution Non Commercial (CC BY-NC 4.0) license, which permits others to distribute, remix, adapt, build upon this work non-commercially, and license their derivative works on different terms, provided the original work is properly cited, appropriate credit is given, any changes made indicated, and the use is non-commercial. See http://creativecommons.org/licenses/by-nc/4.0/.
Statistics from Altmetric.com
Introduction
In recent years, it has become clear that tumors use various immunomodulatory pathways and recruit suppressive cells as a major mechanism of immune resistance, particularly against tumor-specific effector T cells (Teff).1 2 Cancer immunotherapy with monoclonal antibodies that effectively block PD(L)-1 and CTLA-4 are designed to enhance antitumor immunity and have shown promise in the treatment of patients with solid tumors and hematologic malignancies.3–7 However, only a subset of patients responds to these checkpoint inhibitor treatments with durable clinical benefit, and most patients with cancer fail to respond to the treatment at all or relapse.3 5 The tumor-extrinsic mechanisms of either the primary or the acquired resistance are not fully understood, but evidence points to the accumulation of suppressor cells, such as regulatory T cells (Treg), in the tumor as one such mechanism.8
Naturally suppressive CD4+ Foxp3+ Treg are essential for immune tolerance. Although Treg-mediated suppression of effector cells is important to maintain host self-tolerance,9 the presence of Treg in the tumor microenvironment (TME) has been shown to dampen antitumor immune responses.10 11 In fact, studies revealed that elevated frequencies of Treg at the tumor site correlate with poor clinical outcome, raising the need for a treatment to reduce the number of Treg in the tumor.12–14 The observed increased frequency of Treg cells has been hypothesized to be attributed to the expansion of tumor-resident Treg, conversion from conventional CD4+ T cells, or migration of Treg from the periphery into the TME. Evidence indicates that Treg are actively recruited to the TME by surface receptors that recognize chemokines that are highly expressed within the TME.15 The CC chemokine receptor 4 (CCR4) is expressed on most (>90%) human Treg.16 In patients with various types of cancers, such as ovarian, lung and breast cancer, high levels of CCR4 ligands (CCL17 and CCL22) are produced by tumor cells, tumor-associated macrophages17 and/or dendritic cells (DCs).18 Importantly, recent preclinical and clinical studies demonstrated that the number of intratumoral Treg increased in subjects after treatment with immunotherapies.19 20 However, whether immunotherapies increase levels of CCR4 ligands in the tumor and result in the increased migration of Treg is not well understood.
In this study, we demonstrated that immune resistance in several mouse tumor models, at least in part, is established by producing high levels of the two CCR4 ligands, CCL17 and CCL22, leading to the recruitment of CCR4+ Treg into the TME. This finding is supported by gene expression data from various human tumors, suggesting that high CCL17 and CCL22 gene expression strongly correlates with increased Treg presence as assessed by FOXP3 expression.21 In contrast, there was poor correlation between FOXP3 and other chemokine ligands or transforming growth factor beta (TGF-β) expression, suggesting that Treg accumulation occurs predominantly through CCR4-mediated recruitment. A selective and potent small molecule CCR4 inhibitor (CCR4-351) effectively blocked migration of Treg into the tumor and increased single-agent antitumor efficacy in CCR4 ligandhigh mouse tumors. Interestingly, treatment with checkpoint inhibitors such as anti-CTLA-4 antibody or other immune stimulators induced CCL17 and CCL22 ligand levels in tumors. Consequently, in these tumors, CCR4 blockade potentiated the antitumor effects of various checkpoint inhibitors.
Materials and methods
Mice
Six-week-old to 8-week-old female C57BL/6, BALB/c, B6.Cg-Foxp3tm2Tch/J (B6 Foxp3GFP) and C.Cg-Foxp3tm2Tch/J (BALB/c Foxp3GFP) mice were obtained from Jackson Laboratory (Bar Harbor, Maine, USA) and housed under specific pathogen-free conditions.
Cells
Mouse pancreatic (Pan02) cells, mouse colon (CT26) cells, mouse mammary carcinoma (4T1) cells, mouse melanoma (B16-F10) cells and the human acute lymphoblastic leukemia cell line (CCRF-CEM) were purchased from the American Type Culture Collection. The MC38 cell line was a kind gift from Dr Holbrook (Department of Medicine, Stanford University). Pan02-OVA cells were engineered by stable transduction of Pan02 cells with pChac-puro plasmid expressing full-length chicken ovalbumin (OVA; LakePharma). All cells were confirmed mycoplasma negative and identity of all cell lines was validated by short-tandem repeat profiling.
CCR4 antagonist
The discovery of the selective and potent small molecule CCR4 inhibitor (referenced as CCR4-351 in this manuscript) is described elsewhere.22 This novel compound was designed, synthesized and characterized at RAPT Therapeutics. In several experiments, an independent CCR4 antagonist highly related to CCR4-351 was used. The potency, selectivity and pharmacokinetic properties of this antagonist are similar to CCR4-351.
Antibodies and reagents
Antibodies and dyes used for surface staining: unless specified, antibodies were purchased from BioLegend, San Diego. Anti-CD45 BV510 (clone 30-F11), anti-CD4 APC-Cy7 (clone RM4-5), anti-CD8 FITC (clone 53-6.7), anti-CD69 PE (clone H1.2F3), anti-PD-1 PE-Cy7 (clone 29F.1A12, BD Biosciences), anti-CCR4 APC (clone 2G12), anti-CCR4 PerCP/CY5.5 (clone L291H4), anti-CCR5 PE (clone HEK/1/85), anti-CCR6 PE (clone G034E3), anti-CCR7 PE (clone G034H7), anti-CXCR3 PE (clone G025H7), anti-CD45RA BV510 (clone HI100), anti-CD45RO Pacific Blue (clone UCHL1), anti-CD25 APC-CY7 (clone BC96), anti-CD127 APC (clone A019D5), anti-CD4 FITC (clone GK1.5) and 7AAD. Reagents and antibodies used for intracellular staining: cells were fixed and permeabilized following the protocol for the FoxP3/Transcription Factor Staining Buffer (eBiosciences). Fixable viability dye eFluor780 (eBiosciences) and anti-FoxP3 APC (clone FJK-16s, eBiosciences). Sample acquisition was performed on either a FACSCanto II or LSR Fortessa X-20 (Becton Dickinson). Data analysis was performed using FlowJo software (Becton Dickinson).
Mouse tumor models
For both the Pan02 and the Pan02-OVA tumor model, 4×10⁶ tumor cells were injected subcutaneously into the lower right flank of female C57BL/6 mice. For the CT26 tumor model, either 2.5×10⁵ or 1×10⁶ cells were subcutaneously injected into female BALB/c mice in the lower right flank. For the B16F10 and MC38 tumor models, 1×10⁶ cells were injected subcutaneously into female C57BL/6 mice in the lower right flank. And for the 4T1 tumor model, 1×10⁶ cells were injected into the mammary fat pad of female BALB/c mice. Tumor volume was measured twice weekly using the formula: V=0.5(A×B2), where A and B are the long and short diameters of the tumor, respectively. Mice were randomized by tumor size into appropriate treatment groups when a tumor volume of 40–70 mm3 was reached. Daily oral dosing with CCR4-351 (once a day orally) or intraperitoneal administration of an antibody began on the day of randomization. For the Pan02-OVA immunization model, mice were immunized intradermally (ID) with 50 µg/mouse EndoFit OVA mixed in incomplete Freund’s adjuvant (InvivoGen) 14 and 7 days prior to tumor cell inoculation. Animals were dosed with either 50 mg/kg CCR4-351 (once a day orally) or intraperitoneal with antibodies: 50 µg/mouse or 100 µg/mouse anti-CTLA-4 (clone 9D9, Bio X Cell) or 50 µg/mouse anti-CD137 (clone LOB12.3, Bio X Cell) antibodies. Dosing frequency for antibodies is indicated in the Results section. Body weight was measured once a week. Endpoints are either tumor volume of 1500 mm3 for the CT26 and MC38 tumor models or 400 mm3 for the Pan02 and Pan02-OVA tumor models.
Flow cytometry analysis of tumor-infiltrating leukocytes
At designated time points post randomization into the various treatment groups, spleen and tumor were harvested for analysis by flow cytometry. The tumor tissue was dissociated into a single cell suspension in tumor digestion media containing Collagenase, Dispase and DNAse (Sigma-Aldrich) on the gentleMACS Octo Dissociator (Miltenyi Biotec). Spleens were dissociated by pressing through a 70 µm filter (Miltenyi Biotec) and red blood cells were lysed with ACK lysis buffer (Gibco, Waltham, Massachusetts, USA). Samples were incubated with TruStain FcX (BioLegend) prior to antibody staining.
Generation of induced mouse and human Treg cells (iTreg)
For mouse-induced Treg (miTreg)
Spleen and lymph nodes were obtained from 6-week-old to 8-week-old B6 Foxp3GFP or BALB/c Foxp3GFP mice and a single cell suspension was prepared. Red blood cells were removed using a 1× ACK lysis buffer (Gibco). CD4 cells were isolated by depleting CD25+ cells using the CD25 MicroBead Kit (Miltenyi Biotec) and subsequent enrichment of CD4 T cells using CD4 T Cell Isolation Kit (Miltenyi Biotech). Cells were cultured in complete Dulbecco’s Modified Eagle’s Medium (Thermo Fisher Scientific) with 1% non-essential amino acids (NEAA), 1% Penicillin-Streptomycin, 100 IU/mL L-glutamine and 10% Fetal Bovine Serum (FBS) (Gibco). The complete media was supplemented with 1× β-Mercaptoethanol (Thermo Fisher Scientific), 5 ng/mL of TGF-β (240-B-010, R&D Systems), 20 ng/mL of IL-2 (402 ML-020, R&D Systems), 10 µg/mL of anti-IFN-γ (BE0055, InvivoGen), 10 µg/mL of anti-IL-4 (BE0045, InvivoGen) and 1 µg/mL anti-CD28 (16-0281-86, Thermo Fisher Scientific) and cultured in 5 µg/mL anti-CD3 (16-0031-85, Thermo Fisher Scientific) coated plates at a concentration of 1×10⁶ cells/mL. On day 3, cells were cultured in RPMI medium with 20 ng/mL IL-2. Cells were harvested on day 7 for studies. Over 90% of iTreg expressed CD25 and GFP.
For human-induced Treg (hiTreg)
Human peripheral blood mononuclear cells (PBMCs) were isolated from buffy coat (Stanford University Blood Bank) using Ficoll-Paque PLUS gradient media (GE Healthcare). HiTreg were generated using a modified protocol from published literature.23 In short, PBMCs were resuspended inflow cytometry staining buffer (phosphate buffered saline (PBS) supplemented with 1% bovine serum albumin (BSA) and 2 mM EDTA) and incubated with Fc block (Trustain FcX, BioLegend) on ice for 10 min. Then human anti-CD25-biotin (13-0259-82, eBioscience) and fluorescein isothiocyanate (FITC) conjugated human anti-CD4 (317408, BioLegend) were added and incubated for 30 min on ice in the dark. CD25− CD4 T cells were enriched by depletion of CD25+ cells and positive selection for CD4 T cells using magnetic beads (130-090-485 and 130-048-701, Miltenyi Biotec). For hiTreg differentiation, 1.5×10⁶ cells/mL were cultured in 24‐well plates precoated with 1 µg/mL anti‐CD3ɛ (OKT-3, Bio X Cell) in complete RPMI medium (1% Penicillin-Streptomycin, 100 U/mL, L-glutamine and 10% FBS; Gibco) supplemented with 1 µg/mL soluble anti‐CD28 (CD28.2, BD Biosciences), 20 ng/mL IL‐2 (202-IL-010, R&D Systems) and 5 ng/mL recombinant human TGF‐β1 (240-B-010, R&D Systems) for 3 days. On day 3, cells were washed and resuspended in complete RPMI medium with 20 ng/mL of IL-2. Cells were harvested on day 7 for further studies. With this protocol, we routinely generated CD4+ T cells of which over 90% expressed CCR4 and 30%–60% expressed Foxp3. HiTreg suppressed CD8+ T cell activation to a level on a per cell basis that was comparable with natural Treg (nTreg) isolated from PBMCs (data not shown).
Treg migration study
Mice were randomized when Pan02 tumor volume ranged between 40 and 70 mm3 and then dosed orally with various concentrations of CCR4-351. Three hours after compound dosing, 5×10⁶ miTreg were injected intravenously via tail vein into tumor bearing mice. Six days later, spleen, tumor and other relevant tissues were harvested and analyzed. For the CT26 Treg migration studies, animals were randomized when tumor volumes were approximately 150 mm3. Mice were dosed intravenously with 50 µg/mouse of anti-CTLA-4 on day of randomization and again 3 days later. CCR4 antagonist dosing began 7 days after randomization. Three hours after CCR4 antagonist dosing began, 5×10⁶ miTreg were injected intravenously via tail vein. To enumerate the number of miTreg within the tumor tissue, a single cell suspension from tumors were prepared and analyzed by flow cytometry.
Isolation of human nTreg
Human PBMCs were isolated from buffy coats using Ficoll gradient centrifugation. nTreg were enriched for CD4+CD25+CD127dim/– cells using Miltenyi kit (130-094-775, Miltenyi Biotec) and the LD/LS columns (Miltenyi Biotec). Purity was determined by flow cytometry. nTreg preparations were >90% pure. The nTreg cells were pelleted and resuspended in human serum at 2×10⁶ cells/mL for use in chemotaxis assays as described below.
Migration of human nTreg in response to CCL17 and CCL22
The chemotaxis assay is performed using the ChemoTX (Gaithersburg, Maryland, USA) migration system with a 5 µm pore size polycarbonate track-etch membrane (cat# 106-5). CCRF-CEM, iTreg or nTreg cells as described above were suspended at 2×10⁶ cells/mL in human or mouse serum (to match species of cell line). Recombinant CCL17 or CCL22 was diluted in Hanks’ Balanced Salt Solution (HBSS) with 0.1% BSA to cover a range of concentrations from 5 pM to 300 nM. Diluted chemokine (29 µL) was placed in the lower wells of the ChemoTX plate. The membrane was placed onto the plate, and 50 µL of the nTreg cell mixture was transferred onto each well of the membrane. In experiments assessing inhibition with CCR4-351, cells are incubated with various concentrations compound for 30 min prior to transfer. The chemotaxis plates were incubated at 37°C, 100% humidity and 5% CO2 for 60 min, after which the polycarbonate membranes were removed, and 15 µL of the ATP-binding agent CellTiter-Glo was added to the lower wells. The amount of luminescence, corresponding to the number of migrated cells, was measured using an EnVision plate reader (PerkinElmer, Waltham, Massachusetts, USA). EC80 values (for ligand) and IC50 values (for compound) were determined by non-linear regression using a four-parameter fit using GraphPad PRISM software.
Cytokine analysis
Mouse tumor tissue samples were lysed in 1 mL lysis buffer (1% TritonX‐100, 50 mM HEPES, pH 7.4) and total protein concentration was determined using Pierce BCA Protein Assay Kit (cat# 23225, Thermo Fischer Scientific). Tissue lysates (200 µL) were assayed for cytokine levels using the Milliplex Map Kit according to protocol (MCYTOMAG-70K, Millipore). Relative protein concentration (pg cytokine/mg tumor lysate) for cytokine analysis was calculated by normalizing measured concentration to total tumor protein. Standards and samples were tested in duplicate wells. Data were analyzed using EMD Millipore’s Milliplex Analyst software (V.5.1).
Expression analysis
Tumor expression data was obtained from The Cancer Genome Atlas (TCGA) project dataset downloaded from UCSC Xena public data hub on June 18, 2017.21 Only solid tumor data was plotted. Crossplots show the median and 25th through 75th percentile range transcript per million (TPM) expression for each tumor type on a log10 scale. Statistics shown are from a Pearson correlation on the log-transformed TPM values.
Results
Chemokines CCL17 and CCL22 are highly expressed in human T cell-inflamed ‘hot’ tumors and correlate with the presence of Treg
Treg accumulation in tumors has been hypothesized to result from either local proliferation of Treg present in the TME, conversion from conventional CD4+ T cells or migration of Treg from the periphery. To understand possible mechanisms of Treg accumulation, we first searched ‘TCGA’ database to identify human tumors that have increased Treg frequencies, as assessed by the common Treg marker FOXP3 gene expression.24 Although activated effector CD8 T cells have also been shown to transiently express FOXP3, due to the low frequency of these cells, we expect the majority of the FOXP3 expression to be from Treg.25–27 In addition, gene expression in cancer tissues was compared with gene expression in normal tissues from the ‘Genotype-Tissue Expression (GTEX)’ database. There is a high correlation between FOXP3 and CD8 expression across many tumor types and normal tissues, though correlation in tumor is higher than in normal (r=0.65 and r=0.47, respectively), suggesting that Treg levels correlate with levels of effector T cells across tissue types (figure 1A). Importantly, there was a high correlation between FOXP3 expression and CCL17 and CCL22 (r=0.53 and r=0.66, respectively) (figure 1B). This correlation supports our hypothesis that accumulation of Treg within the TME is predominantly the result of recruitment via CCR4. Next, we assessed the cell surface expression of a panel of CC-chemokine and CXC-chemokine receptors including CCR4 on natural thymic-derived Treg (nTreg) by flow cytometry. Human PBMCs were stained for all chemokine receptors for which antibodies were available (figure 1C). As described in previous studies, approximately 90% of CD4+CD25 + CD127low nTreg expressed surface CCR4.16 Human nTreg cell populations also expressed chemokine receptors CCR2, CCR5, CCR6, CCR7 and CXCR3 at frequencies ranging between 20% and 70%. Given the high frequency of CCR4 positivity, the frequency of cells expressing chemokine receptors without co-expression of CCR4 was less than 10% (figure 1C). We also assessed expression of chemokine receptors on mouse nTreg and observed a similar chemokine expression signature although the frequency of each chemokine receptor varied from human and only 40%–50% of mouse Treg expressed CCR4 (online supplemental figure 1A).
Supplemental material
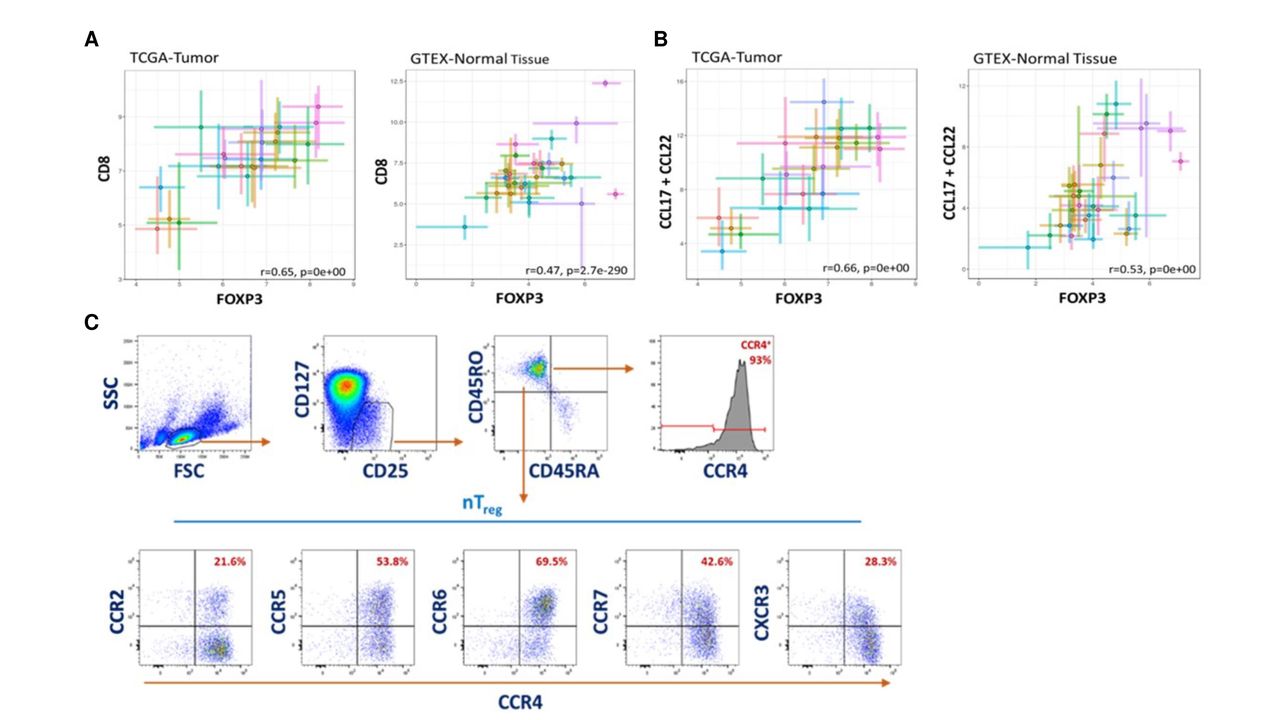
Chemokines CCL17 and CCL22 are highly expressed in human ‘hot’ tumors and have strong correlation with Treg recruitment. Messenger RNA (mRNA) expression analysis in human tumor patient samples (TCGA database) and normal tissue (GTEX database). Each cross plot indicates a specific type of tumor (left) or tissue (right). (A) Correlation plot of CD8 and FOXP3 expression in tumor (left graph) and normal tissue (right graph). (B) Correlation plot of CCL17+CCL22 and FOXP3 expression in tumor (left graph) and normal tissue (right graph). (C) Representative flow cytometry plots of chemokine receptor expression on CD25+ CD127low Treg in PBMCs from three different donors. CCR4, CC chemokine receptor 4; GTEX, Genotype-Tissue Expression; TCGA, The Cancer Genome Atlas.
Since human Treg express chemokine receptors other than CCR4, recruitment could be mediated through other chemokine–chemokine receptor interactions. In addition, it has been described that expression of TGF-β in tumors enhances Treg proliferation and can induce conversion of conventional CD4+ T cells into Treg. Therefore, we evaluated whether FOXP3 expression correlates with other chemokine ligands and TGF-β. Our analysis showed only weak to modest correlation between FOXP3 and TGF-β or other chemokines, except for CCL18, a recently identified ligand for CCR8 (online supplemental figures 1B,C, respectively). There was a good correlation (r=0.52) between FOXP3 and CCL18 in tumors (online supplemental figure 1C). CCR8 is predominantly expressed on tumor-resident (intratumoral) Treg and only on a small percentage of circulating peripheral Treg.15 28 In fact, we performed flow cytometry staining for surface chemokine receptors on circulating thymic Treg (nTreg) from human PBMCs and confirmed the low frequency and low level of surface CCR8 expression on these cells (online supplemental figure 1A). Hence, we believe that it is unlikely that the CCR8/CCL18 axis plays a major role in Treg migration into the tumor. Recent studies have shown a potential functional role for CCR8 on intratumoral Treg outside of migration, such as retention of Treg in the tumor, increased survival and expansion or increased suppressive function.29
In summary, the gene expression analysis from the TCGA and GTEX data sets supports the hypothesis that increased Treg levels in immunologically ‘hot’ tumors are more likely due to high CCL17 and CCL22 expression and the recruitment via CCR4 engagement.
A potent and selective small molecule CCR4 antagonist blocks the in vitro chemotaxis of CCR4+ Treg
To further assess if Treg migration into the tumor is predominantly mediated through CCR4, we developed a potent and selective small molecule antagonist that blocks CCL17 and CCL22 binding to the CCR4 receptor (CCR4 antagonist, CCR4-35122 30). We first generated mouse and human iTreg and determined the EC80 concentrations for human and mouse CCL22 and CCL17 in an in vitro chemotaxis assay (figure 2A). Then, cells were preincubated with different concentrations of CCR4-351 in the presence of 100% serum and chemotaxis was assessed toward CCL22 and CCL17 (figure 2B and online supplemental figure 2B). In the presence of CCR4-351, we observed a dose-dependent inhibition of iTreg chemotaxis towards CCL22 (figure 2B). The average chemotaxis IC50 value across multiple experiments for human and mouse iTreg was approximately 40 nM. CCR4-351 also inhibited CCL17-mediated chemotaxis of CCR4+ CCRF-CEM cells with similar potency to that seen for CCL22-mediated chemotaxis (online supplemental figure 2B). CCR4-351 is highly selective as it only inhibits migration of human iTreg towards the two CCR4 ligands, CCL17 and CCL22, but did not affect migration towards other chemokine ligands (online supplemental figure 2C).

A potent and selective small molecule CCR4 antagonist, CCR4-351, blocks the in vitro chemotaxis of CCR4+ Treg. (A) Induced human (left) and mouse (right) Treg migration towards the CCL22 chemokine. (B) IC50 determination of CCR4-351. Representative data are shown from five independent experiments. hiTreg, human-induced Treg ; miTreg, mouse-induced Treg.
CCR4 blockade reduces Treg cell trafficking into mouse tumors
To establish a murine tumor model for assessing whether Treg migration into tumors can be blocked by CCR4 antagonist, we screened multiple tumor models for their CCL17 and CCL22 expression levels in vivo. Pan02 pancreatic tumors expressed both CCL17 and CCL22 at high levels compared with other tumor types that we tested and were therefore selected as an in vivo tumor model (figure 3A). In order to track and enumerate only newly migrating Treg into the tumor and not tumor-resident Treg, we generated iTreg isolated from syngeneic Foxp3GFP mice. When fully differentiated into iTreg, over 90% of these cells were GFP-positive and 40%–50% of them expressed surface CCR4 (figure 3B). The GFP+ iTreg were adoptively transferred intravenously into Pan02 tumor-bearing animals that were either treated with vehicle or CCR4-351. Numbers of GFP+ Treg per 106 of total live cells in the tumor and periphery were determined by flow cytometry. Treatment with CCR4-351 significantly reduced the number of GFP+ iTreg in the tumor in a dose-dependent manner (figure 3C). At the highest dose of 30 mg/kg, which results in plasma levels corresponding to the IC90 of in vitro Treg migration, CCR4-351 reduced the number of GFP+ Treg in average by over 90% when compared with the vehicle group. The number of GFP+ iTreg in the spleen was only modestly reduced and showed no dose-dependency, with about 26% fewer GFP+ iTreg in all dose groups compared with vehicle control (figure 3C). In comparable studies, we also assessed the number of Treg in the periphery such as blood and skin to further confirm that CCR4 inhibition selectively inhibits migration of Treg to the tumor but not healthy tissue. There was no significant difference in Treg number in the blood and skin in animals dosed with CCR4 inhibitor when compared with the vehicle group (figure 3D). These data suggest that Treg migration into tumors expressing high levels of CCL17 and CCL22 occurs predominantly via CCR4-mediated chemotaxis.

CCR4 blockade significantly reduces Treg trafficking into tumors. (A) Messenger RNA expression of CCL17 (teal) and CCL22 (red) in different mouse tumors. (B) Representative flow cytometry plots showing percent of in vitro generated GFP+ Treg and CCR4 expression prior to transfer into tumor-bearing animals. (C) In vivo Treg migration in Pan02 tumor-bearing mice dosed with CCR4-351. Number of GFP+ Treg in tumor (left) and spleen (right). (D) In vivo Treg migration in the periphery. Number of GFP+ Treg in blood and healthy skin tissue . For statistical analysis, the one-way analysis of variance (Kruskal-Wallis test; non-parametric or mixed) was used. n=8 mice (tumor), n=5 mice (spleen) and n=4 mice (skin and blood) were used in this study. Data is representative from two independent studies.
CCR4 inhibition results in reduced growth of CCL17high CCL22high tumors
To determine the degree of antitumor efficacy that can be achieved by blocking CCR4+ Treg migration into tumors, we used the CCL17 high CCL22high Pan02 tumors. However, Pan02 tumors are poorly immunogenic and respond poorly to treatment with immune modulatory agents. To increase the immunogenicity of this tumor model, Pan02 cells were engineered to stably express chicken OVA (Pan02-OVA). In addition, mice were immunized intradermally with OVA on days −14 and −7 prior to Pan02-OVA inoculation to increase the number of OVA-specific T cells. Animals were randomized at an average tumor volume of 60 mm3 and dosed daily with CCR4-351, weekly with an anti-CTLA-4 (figure 4A) or an agonistic CD137 (4-1BB) antibody (online supplemental figure 3), or a combination of CCR4-351 and CTLA-4 or CD137 antibodies. The anti-CTLA-4 antibody clone used here was previously reported not to deplete Treg.31 When compared with the vehicle group, treatment with CCR4-351 alone resulted in significantly reduced tumor growth that was comparable with single-agent treatment with anti-CTLA-4 (figure 4A) or anti-CD137 (online supplemental figure 3). Tumor growth was further reduced when CCR4-351 and anti-CTLA-4 antibody were combined (figure 4A).
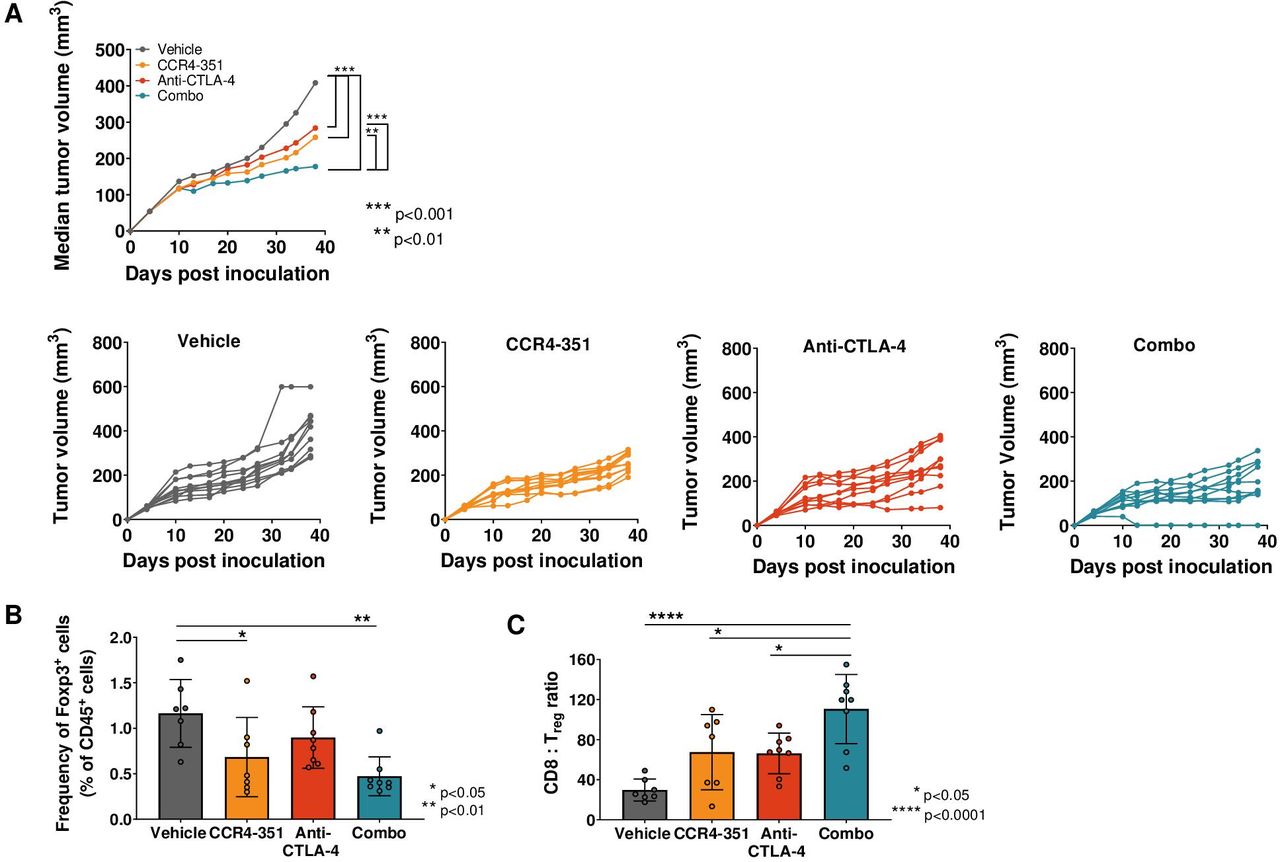
CCR4 inhibition in CCL17high CCL22high tumors showed antitumor efficacy. (A) Tumor efficacy study in Pan02-OVA-bearing mice. Mice (n=10 per group) were randomized on day 5 post tumor inoculation and treated with anti-CTLA-4 antibody (days 5, 9, 13 and 17 post inoculation), CCR4-351 alone (daily dose post randomization) or in combination. Median tumor growth and individual tumor growth plots are shown. Statistical significance from ordinary two-way analysis of variance (ANOVA) with Tukey test. (B, C) Tumors were harvested on day 28 post inoculation and analyzed for (B) Foxp3+ Treg frequency and (C) CD8:Treg ratios in the tumor. For statistical analysis, ordinary one-way ANOVA with Tukey test was used. n=7–8 mice were used in this study. Data is representative of two independent studies.
In a parallel study, we isolated tumors on day 24 post-randomization to assess tumor-infiltrating lymphocytes. As expected, the frequency of tumor-infiltrating Foxp3+ Treg was significantly reduced in animals that received CCR4-351 either as a single agent or in combination with anti-CTLA-4 antibody (figure 4B) when compared with the vehicle group. When compared with the vehicle group, mice that were treated with CCR4-351 or anti-CTLA-4 antibody had significantly increased tumor CD8+ T cell:Treg ratios (figure 4C), an important correlate of antitumor immune activity. CD8+ T cell:Treg ratio was highest in the CCR4-351/anti-CTLA-4 combination group.
CCR4 inhibition leads to antitumor efficacy in combination with checkpoint inhibitor in CCL17low CCL22low tumors
Treg accumulation in tumors has been reported in patients receiving immune-based therapies.19 20 To assess whether CCR4 inhibition can potentiate efficacy of an immune-based therapy in tumors where CCL17 and CCL22 levels are low at baseline, mice bearing CT26 colon (CT26) tumor were randomized at an average tumor volume of 60 mm3 and treated with vehicle, a daily dose of CCR4 antagonist, twice a week dose of anti-CD137 (4-1BB) antibody or a combination of CCR4 antagonist and anti-CD137 antibody. As hypothesized, we did not observe significantly reduced tumor growth in CT26-bearing animals with CCR4 antagonist treatment alone since CCR4-mediated Treg recruitment in this tumor type is most likely minimal and might not contribute to immune resistance (figure 5A,B). Treatment with anti-CD137 antibody alone resulted in intermediate antitumor activity with no complete tumor regression. Importantly, combination therapy of anti-CD137 with CCR4 antagonist significantly enhanced the antitumor effect and four out of nine mice were tumor-free at the end of the study (figure 5). Treated animals remained tumor free for at least 60 days, including the 30–35 days after treatment was stopped. We then dosed CT26 tumor-bearing mice with anti-CTLA-4 antibody and assessed tumor efficacy in combination with CCR4-351. Treatment with anti-CTLA-4 antibody alone resulted in intermediate antitumor activity and 1 out of 10 mice were tumor free at the end of the study (figure 5C,D). As expected, combination therapy of anti-CTLA-4 with CCR4-351 significantly enhanced the antitumor effect and 6 out of 10 mice were tumor-free at the end of the study (figure 5). Treated animals remained tumor free for more than 60 days, including the 30–35 days after treatment was stopped.
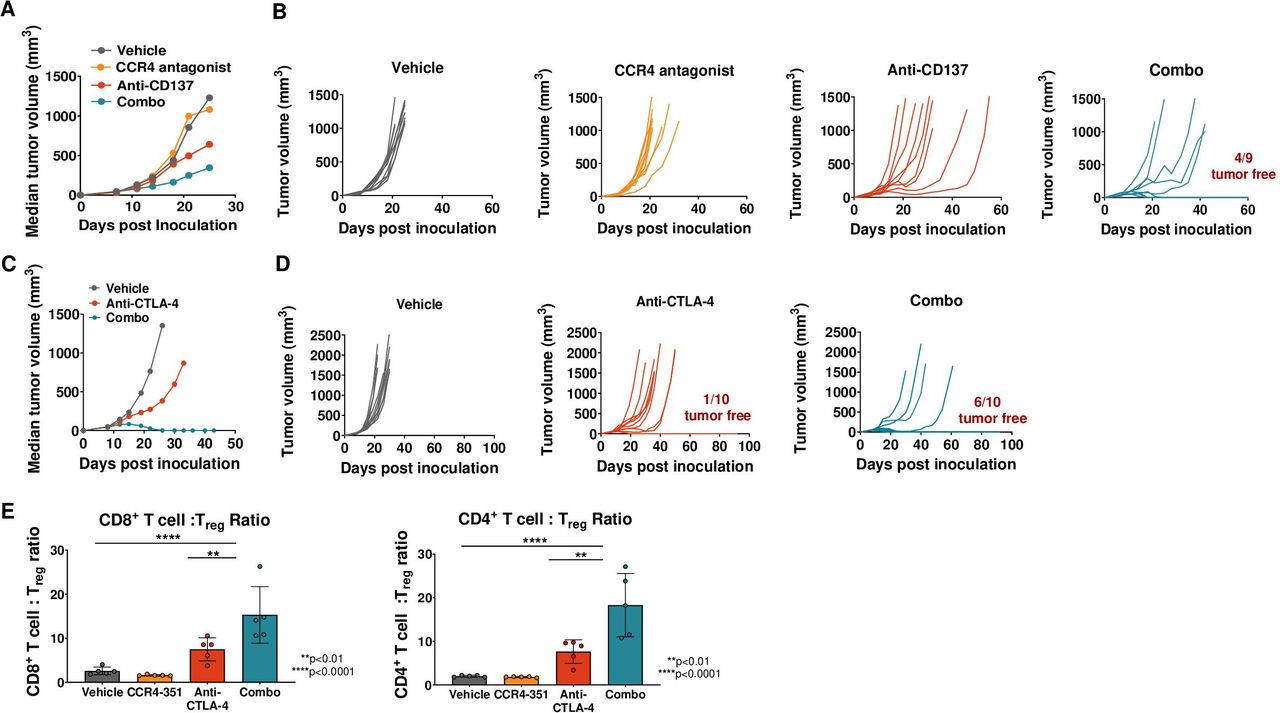
CCR4 inhibition leads to antitumor efficacy in combination with checkpoint inhibitor but not as single agent in CCL17/22low tumors. CT26 tumor-bearing mice were randomized on day 7 or 8 post tumor inoculation (tumor volume 40–70 mm3) and were dosed with anti-CD137 antibody (A, B) or anti-CTLA-4 antibody (C, D) on the days 0, 4, 8 and 12 post randomization. Mice receiving CCR4 antagonist were dosed daily post randomization. Median tumor volume (A, C) or individual tumor growth plots (B, D) are shown (n=10 mice). (E) Analysis of CD4+ and CD8+ T cell ratios to Treg (n=5 mice). For statistical analysis, ordinary one-way analysis of variance with Dunnet’s correction was used. This is representative data from three independent in vivo efficacy studies.
To assess the effector T cell:Treg ratios, CT26 tumors were isolated from animals that were dosed with CCR4-351, anti-CTLA-4 or both. Both, the CD4+ T cell:Treg and CD8+ T cell:Treg ratios were significantly higher in the tumors of animals dosed with the combination of CCR4-351 and anti-CTLA-4 compared with animals dosed with anti-CTLA-4 or CCR4-351 alone or vehicle control (figure 5E). Similarly, activated PD-1+ CD8+ T cell:Treg and CD44+ CD8+ T cell:Treg ratios were highest in the combination group (online supplemental figure 4A).
Combination treatment with CCR4 antagonist and anti-CTLA-4 in CT26 tumor-bearing mice led to increased CD8+ T cell numbers, specific to the CT26 tumor antigen AH-1, when compared with anti-CTLA-4 treatment alone (data not shown). In addition, the generation of a memory T cell population was tested by challenging tumor-free animals with either CT26 cells or 4T1 cells, a mouse breast cancer cell line that expresses relatively low levels of AH-1 antigen and grows in Balb/c animals at a similar rate to CT26. All tumor-free animals inoculated with 4T1 cells demonstrated tumor growth, although tumor growth was slightly slower than in Balb/c mice not previously treated (online supplemental figure 4B and data not shown). In contrast, all tumor-free mice inoculated with CT26 tumor cells remained tumor-free. Taken together, in tumors with low levels of CCL17 and CCL22, CCR4 inhibition enhanced the antitumor effect of anti-CTLA-4 and resulted in long-lasting immunity.
CCR4 ligands are upregulated in tumors following treatment with checkpoint inhibitors
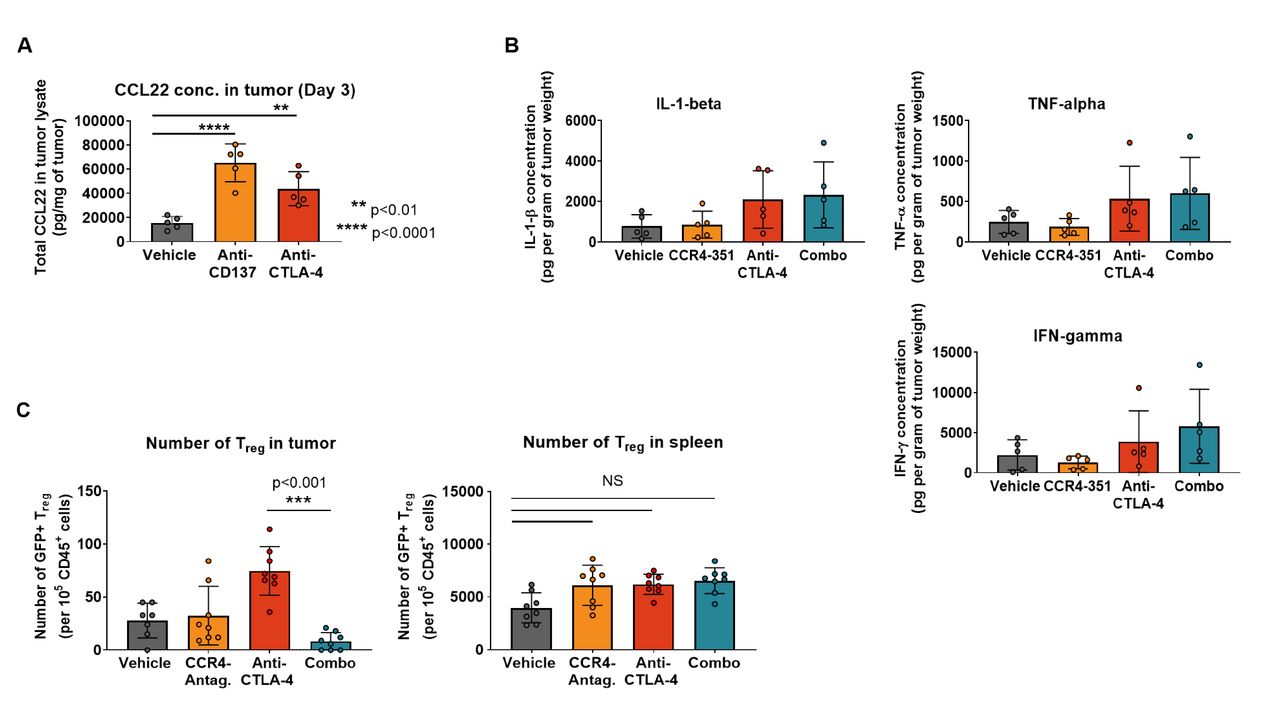
Our observation that an enhanced antitumor efficacy was achieved in CCL17low CCL22low CT26 tumors when combined with agonistic antibody or checkpoint blockade raised the question of whether treatment with these antibodies upregulate CCL17 and CCL22 expression and increase CCR4-mediated Treg migration into tumors. To address this question, mice bearing CT26 tumors received treatment with either vehicle (PBS), agonistic anti-CD137 (4-1BB) or anti-CTLA-4 blocking antibodies and CCR4 ligand levels were assessed in tumor lysates 3 days after antibody treatment. In the vehicle group, CCL22 protein levels in tumors were low while both anti-CD137 and anti-CTLA-4 treatment significantly increased CCL22 levels in tumors (figure 6A). Similar to CT26 tumors, treatment with anti-CTLA-4 antibody also induced upregulation of CCR4 ligand levels in the CCL17low CCL22low MC38 tumors (online supplemental figure 5A). These observations demonstrate that immunomodulatory agents that generate a robust antitumor immune response induce increased expression of CCL17 and CCL22 in the TME.
CCL22 ligand level in tumors is upregulated after CPI treatment in tumors. (A) CCL22 ligand concentration was measured in CT26 tumor lysates after treatment with checkpoint inhibitors or immune agonists days post dose (n=5). (B) Concentration of proinflammatory cytokines in the tumor was measured 3 days post randomization (n=5). (C) Treg migration study in CT26 tumors. Mice were dosed twice with anti-CTLA-4 antibody (on the day of randomization and 3 days later). GFP+ Treg were transferred 7 days post first antibody challenge. CCR4 antagonist treatment started 3 hours prior to Treg transfer. Number of migrated GFP+ Treg in the tumor (left graph) and spleen (right graph) 6 days post cell transfer (n=8). This is representative data from two independent studies. For statistical analysis, the ordinary one-way analysis of variance with Dunnet’s correction was used. CPI, checkpoint inhibitor; IFN-γ, interferon gamma; IL-1β, interleukin 1 beta; TNF-α, tumor necrosis factor alpha.
Proinflammatory cytokines such as interferon gamma (IFN-γ), tumor necrosis factor alpha (TNF-α) and interleukin 1 beta (IL-1β) have been reported to induce CCR4 ligands in dendritic cells and macrophages.32 33 We hypothesized that treatment of tumor-bearing mice with anti-CTLA-4 results in the induction of proinflammatory cytokines and consequently increased levels of the CCR4 ligands. Indeed, protein levels of IFN-γ, TNF-α and IL-1β increased in the tumors of anti-CTLA-4-dosed animals compared with the control group (figure 6B). The increase appears to be selective for the CCR4 ligands since other chemokine ligands for receptors that are expressed on Treg were not elevated (online supplemental figure 5B).
Since CCL17 and CCL22 levels in CT26 tumors increased after treatment with checkpoint inhibitors, we assessed whether we could detect increased recruitment of CCR4+ Treg into tumors following anti-CTLA-4 antibody treatment. CT26 tumor-bearing animals were randomized when tumor volume was between 40 and 70 mm3 and dosed with vehicle, CCR4 antagonist or anti-CTLA-4 antibody alone or in combination to induce CCL17 and CCL22 expression. Seven days after the first antibody treatment, syngeneic GFP+ iTreg generated from BALB/c Foxp3GFP were transferred into the mice followed by 6 days of treatment with either vehicle or CCR4 antagonist. Very few GFP+ Treg migrated into tumors of control mice (figure 6C). As hypothesized, anti-CTLA-4 treatment prior to Treg transfer significantly increased the number of tumor-GFP+ Treg consistent with the observed upregulation of CCR4 ligands. Importantly, this effect was almost completely abrogated in animals that were treated with CCR4 antagonist (figure 6C). Anti-CTLA-4 treatment-induced upregulation of CCR4 ligands and concomitant GFP+ Treg increase were limited to the tumor, with no significant change observed in the spleen (figure 6C). The data suggests that CCR4 inhibition has the potential to increase the effectiveness of checkpoint inhibitor and other immunotherapies.
Discussion
In this study, we show for the first time that pharmacological antagonism of the CCR4 receptor effectively inhibits Treg recruitment and results in enhanced antitumor efficacy as single agent in CCR4 ligandhigh tumors. Furthermore, we demonstrate that adaptive immune resistance to immunotherapies such as an anti-CTLA-4 or anti-CD137 antibodies is, at least in part, mediated via the upregulation of CCR4 ligands in the tumor, and consequently the increased migration of Treg into the TME. Importantly, CCR4 blockade showed synergistic antitumor efficacy with these immunomodulatory agents.
The number of Treg in tumors correlates with poor clinical outcome in various tumor types. How Treg accumulate in the TME is less well understood and it has been hypothesized that local proliferation, conversion from conventional CD4+ T cells or migration contributes to this enrichment in the TME. Our findings from studies in CCR4 ligandhigh mouse tumors demonstrate that accumulation of Treg in the tumor can be mediated predominantly through the CCR4-associated chemokine migration. These results correlate well with previous observations by other research groups34 35 and is furthermore supported by our TCGA data analysis showing the strongest correlation between FOXP3 and the two CCR4 ligands, CCL17 and CCL22, in human tumors. However, it has also been suggested that expansion of tissue-resident Treg or conversion of conventional CD4+ T cells (Tconv) to Treg in the TME could lead to Treg accumulation. Recently, Plitas and colleagues15 compared characteristics of tumor-resident Treg to peripheral and normal tissue-resident Treg by RNAseq and analysis for T- cell receptor (TCR) repertoire. In this study, comparison of TCR repertoires revealed low clonal overlap between normal tissue-resident Treg and tumor Treg subsets, arguing against expansion of tissue-resident Treg or conversion from conventional CD4+ T cells in the TME but rather suggesting the migration of tumor-infiltrating Treg. This finding supports the notion that intratumoral accumulation of Treg is, at least in a subset of tumor types, driven by active recruitment.
One of the major challenges of targeting tumor Treg has been the ability to reduce tumor Treg but to spare Treg in the peripheral/healthy tissues where they are of critical importance to maintain immune tolerance. CCR4 inhibition with CCR4-351 appears to be highly selective in preventing Treg migration into the TME but does not affect Treg in healthy tissues as demonstrated by significantly reduced numbers of Treg in tumors but not in peripheral tissues such as blood, skin or spleen. This finding will likely translate into humans where CCL17 and CCL22 expression is upregulated in many tumor tissues (figure 1B). This will enhance the therapeutic window of CCR4 antagonism compared with strategies that deplete Treg systemically such as a CCR4-depleting antibody.36 In fact, the latter approach has demonstrated various autoimmune side effects including a high frequency of skin rash and occasionally severe Stevens-Johnson syndrome.37
The specificity and potency of our CCR4 antagonist (CCR4-351) were demonstrated in an in vitro Treg chemotaxis assay using CCR4 ligands and other chemokine ligands.22 Both human and mouse Treg migrated towards human CCL17 and CCL22, and consistent with other reports, the number of Treg migrating toward CCL22 was higher.38 The CCR4 antagonist potently blocked migration of both human and mouse Treg at similar potencies (IC50 ~30–40 nM). Importantly, CCR4 inhibition did not show any activity against other surface chemokine receptors on human Treg. Our in vivo Treg migration studies, combined with pharmacokinetic studies,22 led to the conclusion that maximum efficacy with our CCR4 antagonist is achieved with an IC90 target coverage. Plasma levels below IC90 resulted in suboptimal inhibition of Treg migration. Therefore, we project that a maximum efficacy with chemokine-targeted therapy in patients with cancer will be achieved when target coverage reaches IC90.
Redundancy among receptors might be a potential limitation for some chemokine pathway-targeted therapies. To address this, we assessed the potential redundancy of chemokine receptor signaling that mediates Treg trafficking into tumors using the murine pancreatic Pan02 tumor model. Pan02 tumors express high levels of CCL17 and CCL22 but have been reported to also express CCL3, CCL5, CCL20 and CCL19, the ligands for CCR2, CCR5, CCR6 and CCR7.39–41 Pan02-bearing mice treated with the CCR4 antagonist (CCR4-351) had significantly lower tumor GFP+ Treg compared with vehicle control. This suggests that despite the expression of other chemokine ligands, Treg recruitment into the tumor is predominantly driven by CCR4 in this model. Similar findings were demonstrated by other laboratories in different tumor types.12 There are other lines of evidence that the CCR4 pathway is not redundant with other chemokine pathways. This includes the strong correlation of CCL17 and CCL22 expression and the presence of Treg across TCGA compared with the correlation with other potentially important Treg chemokines. Most importantly, CCR4 inhibition was effective at inhibition of tumor growth and enhancing survival of mice with established syngeneic tumors. Although at lower levels compared with Treg, expression of CCR4 has been reported for other immune cells including a subset of CD8+ T cells and natural killer (NK) cells.42–45 Although we did not directly assess whether CCR4 antagonism impacted the trafficking of CD8+ T cells or NK cells into the tumor, we did observe increased frequency of CD8+ T cells and consequently an increase in the CD8+ T cell:Treg ratio as well as enhanced antitumor efficacy in mice that were treated with a CCR4 antagonist. This finding supports the hypothesis that trafficking of critical immune effector cells including CD8+ T cells into the tumor might be regulated by chemokine–chemokine receptor pathways other than CCR4.46
Accumulation of Treg in tumors has been reported in patients who received various treatment modalities such as radiation,47 chemotherapy48 and immune-related therapies such as CPI treatment.19 The CT26 mouse tumor model nicely recapitulated these clinical findings, demonstrating partial antitumor efficacy and increased Treg presence in the TME following anti-CTLA-4 antibody. Following anti-CTLA-4 treatment, Treg accumulation correlated with increased levels of CCR4 ligands in the TME. Importantly, Treg migration was significantly reduced and antitumor response rates were significantly increased in animals where checkpoint treatment was combined with CCR4 blockade. Additionally, more animals were tumor-free at the end of the study with combination of CCR4 antagonism and anti-CTLA-4 compared with either treatment as a monotherapy.
Recent data from patients with metastatic melanoma cancer treated with the anti-PD-1 checkpoint antibody showed increased numbers of effector T cells in responders (including partial and complete responses) compared with non-responders who possibly developed primary resistance to the treatment.19 Interestingly, the number of Treg and macrophages also increased in the same patients that responded to the treatment. This observation raises the question whether cancers treated with immunomodulatory agents recruit Treg by inducing CCR4 chemokines. While this study did not assess the nature of Treg accumulation in the tumor, it is conceivable that CCR4-mediated recruitment led to the increase of Treg. This hypothesis is further supported by increased number of macrophages in the responders, which are a major source for CCL17 and CCL22 production. CCL17 and CCL22 expression by disease-associated macrophages and dendritic cells is induced by proinflammatory cytokines, such as IL-1β, TNF-α and IFN-γ, during an active immune response.32 33 The finding that an active immune response might drive the expression of CCR4 ligands and Treg recruitment is further supported by our TCGA analysis demonstrating a strong correlation between the level of FOXP3, CCR4 ligands and the presence of CD8+ effector T cells. It is noteworthy to mention that our TCGA analysis does not rule out transient FOXP3 expression on activated CD8+ T cells, but as a single gene marker, it is highly correlated with Treg abundance and therefore used as a proxy for Treg frequency.24 Additionally, studies have shown that the frequency of FXP3 expressing CD8+ T cells is low in tumor and peripheral blood.25 26 Therefore, we expect the majority of the FOXP3 expression to be from Treg. In untreated CT26 tumors, where CCL17 and CCL22 expression is low, we detected low levels of inflammatory cytokines. However, treatment with checkpoint inhibitor increased the levels of TNF-α, IFN-γ and IL-1β and consequently levels of CCL17 and CCL22. Elevated expression of CCR4 ligands resulted in increased Treg migration into the tumors. The recruitment of Treg was mainly mediated through CCR4 since CCR4 inhibition effectively blocked Treg migration into the tumors. Our observations provide a plausible mechanism for the increase of Treg in the TME following checkpoint inhibitor therapy and suggest that it could be a major adaptive resistance mechanism to those therapies.19 A comprehensive analysis of CCR4 chemokine levels in patients with cancer that undergo treatment with immunomodulatory agents is required to further advance our understanding on how cancers acquire resistance to treatment.
In summary, CCR4 blockade with a small molecule antagonist may be a safe and effective therapy for patients with cancer. Patients with tumors that have high levels of Treg at baseline and those that are undergoing treatment with checkpoint inhibitors or other treatment modalities that increase Treg migration into tumors would be most likely to benefit from treatment with a CCR4 antagonist.
Acknowledgments
The authors thank Mengshu Xu for her contribution and assistance with the computational analysis.
References
Supplementary materials
Supplementary Data
This web only file has been produced by the BMJ Publishing Group from an electronic file supplied by the author(s) and has not been edited for content.
Footnotes
LAM and SM contributed equally.
Funding This work was funded by RAPT Therapeutics.
Competing interests LAM, AJ, SJ, MZ, OR, JJJ, DP, JS, MB, AW, DW, PDK, GC, BW, DGB and OT are employees and stockholders of RAPT Therapeutics.
Patient consent for publication Not required.
Ethics approval All animal experiments were conducted in compliance with the ‘“GUIDE FOR THE CARE AND USE OF LABORATORY ANIMALS’” and protocols reviewed and approved by RAPT Therapeutics’ Institutional Animal Care and Use CommitteeIACUC.
Provenance and peer review Not commissioned; externally peer reviewed.
Data availability statement All data relevant to the study are included in the article or uploaded as supplementary information. All data relevant to the study are included in the article or uploaded as supplementary information.
Supplemental material This content has been supplied by the author(s). It has not been vetted by BMJ Publishing Group Limited (BMJ) and may not have been peer-reviewed. Any opinions or recommendations discussed are solely those of the author(s) and are not endorsed by BMJ. BMJ disclaims all liability and responsibility arising from any reliance placed on the content. Where the content includes any translated material, BMJ does not warrant the accuracy and reliability of the translations (including but not limited to local regulations, clinical guidelines, terminology, drug names and drug dosages), and is not responsible for any error and/or omissions arising from translation and adaptation or otherwise.