Article Text

Abstract
Background Immunotherapy has emerged as a promising treatment modality for head and neck squamous cell carcinoma (HNSCC). Pembrolizumab, an anti-programmed death 1 antibody, is an immunotherapy agent currently approved for metastatic HNSCC and curative intent clinical trials. Although clinical responses to pembrolizumab are promising, many patients fail to respond. However, it is well known that T cell cytotoxicity and chemotaxis are critically important in the elimination of HNSCC tumors. These functions depend on ion channel activity and downstream Ca2+ fluxing abilities, which are defective in patients with HNSCC. The purpose of this study was to elucidate the effects of pembrolizumab on potassium (K+) channel (KCa3.1 and Kv1.3) activity, Ca2+ fluxes, and chemotaxis in the cytotoxic T cells of patients with HNSCC and to determine their correlation with treatment response.
Methods Functional studies were conducted in CD8+ peripheral blood T cells (PBTs) and tumor infiltrating lymphocytes (TILs) from patients with HNSCC treated with pembrolizumab. Untreated patients with HNSCC were used as controls. The ion channel activity of CD8+ T cells was measured by patch-clamp electrophysiology; single-cell Ca2+ fluxing abilities were measured by live microscopy. Chemotaxis experiments were conducted in a three-dimensional collagen matrix. Pembrolizumab patients were stratified as responders or non-responders based on pathological response (percent of viable tumor remaining at resection; responders: ≤80% viable tumor; non-responders: >80% viable tumor).
Results Pembrolizumab increased K+ channel activity and Ca2+ fluxes in TILs independently of treatment response. However, in PBTs from responder patients there was an increased KCa3.1 activity immediately after pembrolizumab treatment that was accompanied by a characteristic increase in Kv1.3 and Ca2+ fluxes as compared with PBTs from non-responder patients. The effects on Kv1.3 and Ca2+ were prolonged and persisted after tumor resection. Chemotaxis was also improved in responder patients’ PBTs. Unlike non-responders’ PBTs, pembrolizumab increased their ability to chemotax in a tumor-like, adenosine-rich microenvironment immediately after treatment, and additionally they maintained an efficient chemotaxis after tumor resection.
Conclusions Pembrolizumab enhanced K+ channel activity, Ca2+ fluxes and chemotaxis of CD8+ T cells in patients with HNSCC, with a unique pattern of response in responder patients that is conducive to the heightened functionality of their cytotoxic T cells.
- immunotherapy
- head and neck neoplasms
- lymphocytes
- tumor-infiltrating
- programmed cell death 1 receptor
- T-lymphocytes
This is an open access article distributed in accordance with the Creative Commons Attribution Non Commercial (CC BY-NC 4.0) license, which permits others to distribute, remix, adapt, build upon this work non-commercially, and license their derivative works on different terms, provided the original work is properly cited, appropriate credit is given, any changes made indicated, and the use is non-commercial. See http://creativecommons.org/licenses/by-nc/4.0/.
Statistics from Altmetric.com
- immunotherapy
- head and neck neoplasms
- lymphocytes
- tumor-infiltrating
- programmed cell death 1 receptor
- T-lymphocytes
Introduction
Immunotherapy is arising as an effective treatment for many solid tumors, including head and neck squamous cell carcinoma (HNSCC)—the sixth most common cancer worldwide.1 2 Immunotherapy harnesses the immune system and increases the effectiveness of antitumor responses while remaining relatively non-invasive in contrast to conventional treatments.3–5 One immunotherapy modality that has risen to the forefront is antibody-mediated inhibition of programmed death 1 (PD1) receptor, an immune checkpoint, on immune cells.6 Signaling through PD1 is a necessary brake for the immune system to avoid excess activity. It decreases T cell receptor (TCR) signaling and downstream cytokine production and cytotoxicity.6 7 However, many tumors, including HNSCC, take advantage of this biological mechanism in order to suppress antitumor T cell function and evade the immune response by upregulating the PD1 ligand, programmed death ligand 1 (PD-L1).8 9 Anti-PD1 antibodies (αPD1) block the PD1/PD-L1 interaction, prevent the PD1 signaling cascade, and rescue the function of the immune cells.10 In fact, PD1/PD-L1 blockade has been shown to increase cytokine production and CD8+ T cell infiltration into the tumor, ultimately decreasing tumor development.11–15 Indeed, αPD1 is currently approved for use in multiple solid tumors, including HNSCC.10 16 17 However, there is approximately a 60% inherent resistance to αPD1 treatment and only 20%–25% of patients have a durable clinical response.17–19
Recent evidence indicates that tumors with a robust CD8+ T cell infiltration respond better to immunotherapy than poorly infiltrated tumors.20 21 However, there are patients who do not respond to immunotherapy despite substantial T cell tumor infiltration, and this underscores the limitations imposed by the immunosuppressive tumor microenvironment (TME).22 It is indeed well established that to exercise an effective immune surveillance, CD8+ T cells need to be able to infiltrate the tumor and maintain their functional competency within the TME—two limiting steps for successful immunotherapy.
The ability of cytotoxic T cells to migrate, produce cytokines, proliferate, and ultimately perform antitumor functions is under the strict control of ion channels.23–26 Ion channels are located on the plasma membrane of T cells and function largely to regulate the Ca2+ influx necessary for downstream effector functions.23 25 27 28 Two potassium channels in particular, Kv1.3 (a voltage-gated K+ channel) and KCa3.1 (a Ca2+-dependent K+ channel), in human T cells maintain the electrochemical driving force necessary for Ca2+ influx through the CRAC (Ca2+ release-activated Ca2+) channels, which ultimately govern cytokine and granzyme B production, cytotoxicity, and proliferation.27 29 30 Additionally, KCa3.1 functions as a positive regulator of T cell chemotaxis.25 31 Consequently, the blockade or downregulation of these two K+ channels inhibits T cell chemotaxis and function.25 26 30–32
Defects in Kv1.3 and KCa3.1 have been shown to contribute to reduced immune surveillance in HNSCC. The tumor infiltrating lymphocytes (TILs) of patients with HNSCC have reduced Kv1.3 activity and impaired Ca2+ signaling as compared with circulating T cells.29 Additionally, TILs with low Kv1.3 expression have low granzyme B production, indicating functionally incompetent cells.29 Circulating T cells of patients with HNSCC instead have reduced KCa3.1 activity.31 Since adenosine, which accumulates in solid tumors, inhibits KCa3.1 activity, the already impaired KCa3.1 in the HNSCC circulating CD8+ T cells causes these cells to be hypersensitive to adenosine, thereby greatly inhibiting chemotaxis and cytokine production.26 31 33 This mechanism contributes to reducing the infiltration of CD8+ T cells into the tumor as well as their efficacy.31 34 Therefore, T cell function relies heavily on K+ channel activity which, when rescued, could restore the antitumor functions of T cells. In fact, activation of KCa3.1 restores the chemotactic ability of CD8+ T cells from patients with HNSCC in the presence of adenosine and increases interferon-γ (IFNγ) production in murine CD8+ T cells in vitro.31 35 Additionally, in a murine melanoma model, overexpression of functional Kv1.3 channels in tumor-specific T cells increases interleukin (IL) 2 and IFNγ production and leads to decreased tumor burden and increased survival.35 Overall, the activity of K+ channels in T lymphocytes is an accurate indicator of their functional fitness, and interventions that restore it ultimately improve the antitumor response.
Given that we know that K+ channels are important for T cell effector functions, but are defective in the T cells of patients with HNSCC, and that αPD1 potentiates infiltration and effector functions of CD8+ T cells, we hypothesized that ion channels play a role in αPD1-mediated mechanisms of action and resistance in patients with HNSCC.6 7 36 37 Specifically, we hypothesized that αPD1 increases Kv1.3 and KCa3.1 activities, and Ca2+ influx in TILs, thus making these cells more cytotoxic and increasing their ability to produce cytokines. Furthermore, we postulated that αPD1 therapy increases KCa3.1 activity in peripheral blood T cells (PBTs), making these cells less sensitive to adenosine and more capable of infiltrating the tumor. Pembrolizumab (a humanized monoclonal IgG4κ αPD1) has shown efficacy in many cancer types and is currently approved for use in multiple solid tumors including HNSCC.10 16 17 Herein, we investigated the effect of pembrolizumab on K+ channel activity and downstream functions such as Ca2+ fluxing and chemotaxis in the cytotoxic T cells of patients with HNSCC and whether the effects on channels correlate with treatment response.
Materials and methods
Study design and subjects
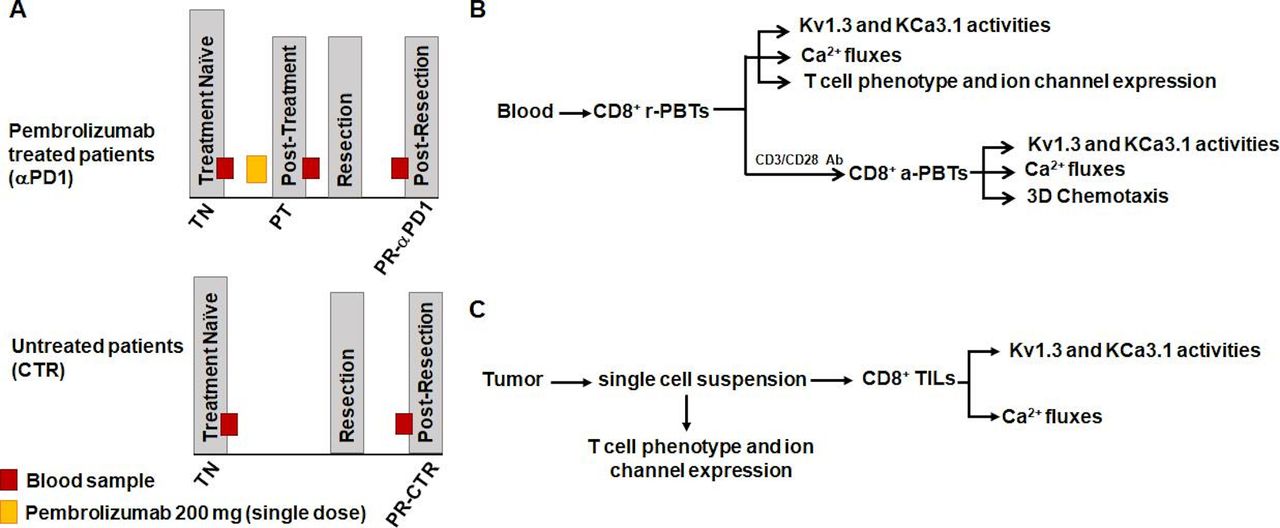
Experiments were conducted in specimens obtained from an ongoing multisite study of treatment-naive patients with HNSCC treated with a single dose of pembrolizumab followed by tumor resection (ClinicalTrials.gov identifier: NCT02641093) or from treatment-naive patients with HNSCC who underwent surgery without immunotherapy (untreated controls). Treatment schemes for both the pembrolizumab and control patients with HNSCC are shown in figure 1A. Eligibility criteria for patient inclusion in the study were a diagnosis of squamous cell carcinoma as confirmed by tissue biopsy; p16 negative in oropharynx; no previous chemotherapy or radiation or surgery; no active infections or any autoimmune disorders or active immunosuppressive disorders; and no current use of systemic steroids. Management of clinical data was completed on RedCap tools hosted by Cincinnati Children’s Hospital Medical Center. Patients were consented and managed by the University of Cincinnati Cancer Center Clinical Trials Office. Informed consent for all patients was collected. Additionally, in pembrolizumab patients, a trained pathologist determined pathological treatment responses using histopathology to compare viable tumor present in the diagnostic tissue biopsy versus the resected tissue specimen. Response percentage was determined by area of treatment effect divided by the total area showing residual viable tumor. Treatment effect was defined as tumor necrosis and/or histiocytic inflammation and giant cell reaction to keratinaceous debris. A treatment responder was defined as an individual who had ≤80% viable tumor remaining at resection (≥20% response); a treatment non-responder was defined as an individual who had >80% viable tumor remaining at resection (<20% response). This cut-off was chosen based on the initial results of the clinical trial associated with our study that defined response as more than 10% pathological treatment effect and showed that the pathological response was associated with robust immune cell infiltration and increased PD-L1/PD-L2 and IFNγ.38 39 Demographics and clinicopathological features of patients in the pembrolizumab and control groups are shown in table 1. For all patients (both the pembrolizumab-treated and untreated controls), we obtained a blood sample at the treatment-naive stage (before pembrolizumab and/or tumor resection), fresh tumor after resection, and a final blood sample post-resection before the start of any adjuvant therapy. In the pembrolizumab group, an extra blood sample was collected 7–21 days after pembrolizumab prior to resection. The experimental protocols for functional studies are defined in figure 1B,C.

Study design scheme and experimental protocol. (A) Samples were collected from patients with head and neck squamous cell carcinoma in an ongoing clinical trial (top; NCT02641093) or from patients undergoing standard of care treatment (bottom) using an institutional review board-approved sample collection protocol. A treatment-naive (TN) blood sample was received from each patient before any treatment. Pembrolizumab patients then received a single 200 mg dose of pembrolizumab infusion. Approximately 1–3 weeks after the infusion, a post-treatment (PT) blood sample was obtained. Patients both in the pembrolizumab and control groups underwent surgical resection of the tumor. Anywhere from 4 to 11 weeks post-resection (PR), patients then had a blood sample drawn prior to adjuvant treatment (chemotherapy/radiation) (pembrolizumab patients: PR-αPD1; control patients: PR-CTR). (B) CD8+ PBTs were isolated from whole blood of pembrolizumab and control patients. Experiments were conducted on both resting (r-PBTs) and activated (a-PBTs) CD8+ PBTs. In r-PBTs, electrophysiology was used to determine KCa3.1 and Kv1.3 activities. Ca2+ fluxes were also measured. Flow cytometry was used to determine T cell phenotype and ion channel expression. In a-PBTs, in addition to K+ channel activity and Ca2+ fluxes, chemotaxis was measured. (C) Surgically resected solid tumors from pembrolizumab and control patients were dissociated and the single-cell suspension was used to determine T cell phenotype and ion channel expression. CD8+ tumor infiltrating lymphocytes (TILs) were then isolated from the remaining single-cell suspension. KCa3.1 and Kv1.3 activities and Ca2+ fluxes were measured in the CD8+ TILs. αPD1, anti-programmed death 1 antibody; PBTs, peripheral blood T cells.
Demographic and clinical data of pembrolizumab and control patients with HNSCC
Reagents and supplies
Phosphate buffered saline (PBS) and rat tail collagen were obtained from Corning; RPMI-1640 medium, penicillin, streptomycin, L-glutamine, and sterile 4-(2-hydroxyethyl)-1-piperazineethanesulfonic acid (HEPES) solution from Gibco; human serum, MgCl2, ethylene glyco-bis(β-aminoethylether)-N,N,N',N'-tetraacetic acid (EGTA), NaCl, KCl, glucose, CaCl2, adenosine, poly-L-lysine, Tween-20 and Triton X-100 from Millipore Sigma; CXCL12 from R&D Systems; fetal bovine serum from ThermoFisher; and ShK-Dap22 from Tocris.
Cell isolation
Peripheral blood mononuclear cells (PBMCs) were isolated from whole blood using Ficoll-Paque PLUS density gradient (GE Healthcare Biosciences).31 CD8+ PBTs were isolated by negative selection using the EasySep Human CD8+ T Cell Enrichment Kit (Stemcell Technologies). CD8+ PBTs were then resuspended in RPMI-1640 medium supplemented with 10% human serum, 200 U/mL penicillin, 200 mg/mL streptomycin, 1 mM L-glutamine, and 10 mM HEPES. CD8+ PBTs were activated with 10 µg/mL plate-bound anti-CD3/CD28 antibody (BioLegend) for 72–96 hours. Fresh cells were used for all assays except flow cytometry. A portion of PBMCs were frozen and stored in liquid nitrogen for subsequent flow cytometry measurements.
Tumor single-cell suspension and TIL isolation
Tumor single-cell suspension was obtained from pieces of surgically resected solid tumors, as described previously.29 Briefly, the tumors were dissected into 2 mm3 fragments and dissociated in C type gentle MACS dissociation tubes (Miltenyi Biotec) with RPMI-1640 medium. The tumor cell suspensions were then filtered through 100 µm sterile nylon mesh, washed twice with PBS+2% fetal bovine serum (FBS) and resuspended in RoboSep Buffer (Stemcell Technologies). A portion of the tumor single-cell suspensions were used for flow cytometry. The remaining portion was used for CD8+ TIL isolation with EasySep Human CD8+ Positive Selection Kit II (Stemcell Technologies). CD8+ TILs were maintained in T cell medium with 10% human serum.
Electrophysiology
KCa3.1 and Kv1.3 currents were recorded from CD8+ T cells by voltage-clamp electrophysiology. The external solution consisted of (in mM) 160 NaCl, 4.5 KCl, 1 MgCl2, 10 HEPES, and pH 7.4 by NaOH. Internal solution consisted of (in mM) 145 K-aspartate, 2 MgCl2, 8.5 CaCl2, 10 EGTA, 10 HEPES, and pH 7.2 TRIS buffer (1 µM free Ca2+ concentration).31 Borosilicate glass (TW150F-4, World Precision Instruments) pipettes (4–5 MΩ resistance) were fabricated using a P-97 horizontal puller (Sutter Instrument). Currents were induced by a voltage-ramp pulse protocol (from −120 to +50 mV for 200 ms; holding potential at −70 mV) every 15 s. Representative currents are reported in online supplemental figure 1A. Currents were recorded and amplified (Axopatch 200B Amplifier, Molecular Devices) and digitalized through a 16-bit A-D/D-A interface (Digidata 1320A, Molecular Devices). Data were acquired using pCLAMP V.8.0 software and low pass-filtered at 2 kHz and digitalized at 100 kHz. The conductance (G) of KCa3.1 channels was calculated as the ratio of the linear fraction of the macroscopic current slope to the slope of ramp voltage stimulus.31 The KCa3.1 slope G was measured in the voltage range between −100 and −80 mV after subtraction of the leak current (online supplemental figure 1A). Kv1.3 G was determined from the same trace at +50 mV (online supplemental figure 1A) after subtraction of the KCa3.1 current extrapolated by linear regression.40 The extrapolation method was verified by recording KCa3.1 and Kv1.3 currents via ramp pulse depolarization (as described earlier) before and after perfusion with the specific Kv1.3 blocker ShK-Dap22 (100 nM).41 Kv1.3 current was determined at +50 mV by subtracting the current remaining after ShK-Dap22 from the current before ShK-Dap22. The Kv1.3 currents obtained with the extrapolation and the Kv1.3 blockade methods were equivalent (online supplemental figure 1B,C). Patients’ electrophysiological data are represented as single cell data from all patients combined. Data from treatment-naive cells for both pembrolizumab and control patients were combined for comparison with the post-treatment data as there were no differences in activated KCa3.1 and Kv1.3 G between the two groups (online supplemental table 1).
Supplemental material
Supplemental material
Calcium measurements
Ca2+ fluxes were measured by a TCR-independent/ion channel-dependent method using the ratiometric Ca2+-sensitive dye Fura-2 as previously described.29 40 42 Briefly, T cells were plated on poly-L-lysine coated coverslips, loaded with 1 µM Fura-2/AM (ThermoFisher), washed and incubated with RPMI-1640 at 37°C for ~30 min. Fura-2 intensity was measured using InCyt-Im2 Ca2+ imaging system (Intracellular Imaging, Cincinnati, Ohio, USA). The following protocol was used. Cells were maintained in Ca2+-free media and then exposed to 1 µM thapsigargin (TG; EMD Millipore) (a sarcoplasmic/endoplasmic Ca2+ (SERCA) pump inhibitor). This intervention depletes the endoplasmic reticulum Ca2+ stores, triggering opening of CRAC channels. Reintroduction of Ca2+ (0.5 mM) in the medium gives rise to an influx of Ca2+ through the CRAC channels.23 Ca2+-free solution had the following composition (in mM): 155 NaCl, 4.5 KCl, 1 MgCl2, 10 HEPES, 10 glucose, 2 EGTA, and pH 7.4. The 0.5 mM Ca2+ solution had the following composition (in mM): 155 NaCl, 4.5 KCl, 2.5 MgCl2, 10 HEPES, 10 glucose, 0.5 CaCl2, and pH 7.4. A standard curve was used to correlate the 340:380 nm wavelength ratio to Ca2+ concentrations. Representative Ca2+ recordings are reported in online supplemental figure 1D. Additionally, because the TILs were isolated via positive selection using CD8+ magnetic beads, we evaluated the effect of beads on Ca2+ fluxes. Ca2+ fluxes were measured, with and without beads, and our findings indicate that there is no significant effect on Ca2+ fluxing between the two isolation methods (online supplemental figure 1E).
Data analysis
Ca2+ fluxing ability was determined as the difference between the intracellular Ca2+ at the peak Ca2+ (after 0.5 mM Ca2+ perfusion) and the baseline (after addition of TG) and reported as ΔCa2+. The single-cell ΔCa2+ values were combined and statistical analysis was performed. Single cell values, rather than average values per patient, were used because the quantity of TILs assessed were very low—sometimes as few as 1 cell per patient. Because of this, there was high statistical power for PBTs, where we recorded up to 100 cells/patient/condition, thus inflating some differences that may not be biologically significant. We found the ΔCa2+ between treatment-naive PBTs of the pembrolizumab and control groups—which enrolled identical patients—to be statistically significant with only a 6% difference. When we analyzed the difference between the 75th percentiles of these patient groups at the treatment-naive stage, we also found a 6% difference—accompanied by an 8% difference at the 25th percentile. We thus set a cut-off of 10% as a significant and meaningful difference of potential true biological value for Ca2+ fluxes. Given this, treatment-naive data from both pembrolizumab and control patients were combined for comparison with the post-treatment data. Additional analysis for TILs included area under the curve (AUC), calculated for the first 637 s after the start of Ca2+ influx, and the shape of Ca2+ response. Based on the latter, responses were categorized as sustained, oscillatory, transient (decrease of Ca2+ back to near baseline), or no response, as described previously.42
3D chemotaxis
Three-dimensional (3D) chemotaxis was measured using μ-Slide Chemotaxis assay (ibidi), as described previously.31 Briefly, CD8+ PBTs incorporated in a type I rat tail collagen gel were added to the central observation chamber of the μ-Slide. To generate a chemokine gradient, 8 μg/mL CXCL12 was added to the migration medium in one reservoir.31 We assessed the effects of adenosine on chemotaxis, by establishing simultaneous adenosine (10 µM) and CXCL12 gradients in a separate chamber.31 The slide was then mounted on the stage of an inverted Zeiss LSM 710 microscope (Carl Zeiss Microscopy) equipped with a 37°C incubator. Cell migration was recorded by time-lapse video microscopy.31 Using the ‘Manual Tracking plugin’ on ImageJ software (National Institutes of Health) 15–20 migrating cells were tracked per condition, and data were analyzed using the Chemotaxis and Migration Tool (ibidi). Chemotactic effect was assessed by measuring the center of mass (COM, the average position along the relevant axis that the cells reached by the end of the experiment). A positive chemotaxis was defined as migration along the CXCL12 gradient (y axis) Y-COM (Y-center of mass) >0.31 In some patients, we also measured the chemotactic parameters of Euclidean distance, accumulated distance, forward migration index (FMI), directness, and velocity.31 43
Flow cytometry
PBMCs frozen in liquid nitrogen were thawed in batches (all time points for each donor and multiple patients when possible) to prevent interassay variation, and stained for Brilliant Violet 786 conjugated mouse anti-human CD8, Allophycocyanin (APC) conjugated mouse anti-human CD127, PerCP-Cy5.5 conjugated mouse anti-human CD45RA, Brilliant Violet 510 conjugated mouse anti-human CD45RO, and eFluor 780 fixable viability dye (eBioscience, ThermoFisher). Surface staining was done for 20 min at room temperature. Subsequently, cells were washed twice, fixed in 1% formaldehyde and kept in the dark at 4°C until acquisition on a flow cytometer. TILs were stained immediately after tumor resection. Cells were stained for viability, washed twice and fixed in 1% formaldehyde in PBS. Cells were washed then stained for CD8, CD127, CD45RA, and CD45RO as above. PBTs or TILs were stained for surface KCa3.1 (6C1/ATTO-488; Alomone Labs) and Kv1.3 (polyclonal; Alomone Labs) primary antibody, followed by a secondary anti-guinea pig (Dy350 goat anti-guinea pig IgG; ThermoFisher), Orai1 (polyclonal; Alomone Labs) primary followed by a secondary anti-rabbit (Alexa Fluor 594 Goat Anti-Rabbit IgG; Jackson ImmunoResearch Laboratories). To stain for intracellular ion channel epitopes, cells were then fixed and permeabilized using eBioscience Foxp3/Transcription Factor Staining Buffer Set (ThermoFisher) as per manufacturer’s instructions. Cells were then stained for transient receptor potential cation channel subfamily M, member 7 (TRPM7) (polyclonal S7425; StressMarq) and Stim1 (polyclonal; Proteintech) primary antibodies, followed by secondary antibodies (Alexa Fluor 594 Goat Anti-Rabbit IgG; Jackson ImmunoResearch Laboratories). Fluorescence minus one (FMO) samples from healthy donor PBMCs were also included in every assay, and representative overlays of unstained cells, FMO staining and full panel staining for each channel are shown in online supplemental figure 2A. All samples were run on a BD LSRFortessa with an internal standard for each series in order to control for interassay variation and were analyzed using the FlowJo software. For flow cytometry analysis, the gating strategy is presented in online supplemental figure 3. CD127 (IL-7 signaling) and CD45RA markers were used to define naive T cells (Tnaive), effector T cells (Teff), effector memory re-expressing CD45RA T cells (Temra), and memory T cells (Tm): Tnaive (CD45RA+/CD127+); Teff (CD45RA−/CD127−); Temra (CD45RA+/CD127−); Tm (CD45RA−/CD127+).44 Samples were analyzed using percentage of cells within gate or using the geometric mean fluorescence intensity (MFI) as compared with MFI of healthy donor controls.
Supplemental material
Supplemental material
Ion channel antibody specificity
Slides prepared from 5 μm formalin-fixed paraffin-embedded (FFPE) sections from a resected HNSCC were deparaffinized according to standard immunohistochemistry protocols. Heat-mediated antigen retrieval was performed in a vegetable steamer by boiling the slides for 20 min in sodium citrate buffer (10 mM sodium citrate, 0.05% Tween-20, pH 6.0). The slides were blocked at room temperature with PBS+10% FBS. For evaluating the specificity of the Orai1 and Stim1 antibodies, slides were incubated with either polyclonal rabbit primary antibody alone or preadsorbed to the specific peptide that was used to generate the antibody (Alomone Labs for Orai1 and Proteintech for Stim1) (1:10 ratio of antibody to peptide) (online supplemental figure 2B,C). All slides were then washed and incubated with Alexa 647 anti-rabbit secondary antibody. Slides were washed and nuclei were stained with 1 μg/mL 4',6'-diamidino-2-phenylindole (DAPI). Slides were visualized at 20× with Zeiss LSM 710 confocal microscope and images were acquired with the Zen software. Specificity of Stim1 antibody was also determined by flow cytometry. Activated healthy donor CD3+ PBTs (1×10⁶ cells/condition) were fixed with 4% paraformaldehyde, permeabilized with PBS+0.2% Triton X-100, and stained with either rabbit anti-human Stim1 antibody alone (Proteintech) or preadsorbed with 10× of the specific antigen (Proteintech) overnight at 4℃. Cells were then washed and stained with Brilliant Violet 421 conjugated anti-rabbit secondary antibody (BioLegend) (online supplemental figure 2C). Data were collected on an LSR II Flow Cytometer (BD Biosciences) and analyzed with FlowJo software (FlowJo). KCa3.1 antibody is a monoclonal conjugated antibody that has been previously used to detect KCa3.1 in PBTs.31 The specificity of the Kv1.3 antibody has been previously reported.29
Statistical analysis
Statistical analyses between the two groups were performed via Student’s t-test or Mann-Whitney rank-sum test if samples failed normality or had unequal variance. Multiple comparisons were performed using one-way analysis of variance (ANOVA) (post-hoc: Holm-Sidak) or Kruskal-Wallis one-way ANOVA on ranks (post-hoc: Dunn’s) with pairwise comparisons. For all statistical tests, p≤0.05 was considered significant. If differences in ΔCa2+ were statistically significant, the percent difference was used to determine if the statistically significant differences were biologically significant (>10% difference) (see Calcium measurements described previously). All statistical tests were performed using SigmaPlot V.13.0 (Systat Software). All statistical tests and p values are reported in the individual figures, tables, and corresponding legends.
Results
Pembrolizumab treatment increases Kv1.3 activity and Ca2+ fluxing ability in CD8+ TILs irrespective of the pathological response to therapy
Herein, we studied the functional effects of pembrolizumab treatment on CD8+ T cells of patients with HNSCC. Untreated patients were used as controls. Treatment schemes and experimental layout are shown in figure 1 and detailed in the Materials and methods section. CD8+ TILs are expected to kill cancer cells; however, their functionality is severely compromised.22 45 We have shown that in HNSCC this is in part due to reduced Kv1.3 activity and Ca2+ fluxing ability.29 Herein, we confirmed that the Kv1.3 activity of TILs of control patients with HNSCC is reduced compared with their PBTs, but we also observed a concomitant reduction in KCa3.1 (online supplemental figure 1A,F), which together contribute to reduced Ca2+ fluxes in TILs (online supplemental figure 1D,G). However, the effect of pembrolizumab on K+ channel function in TILs has not yet been determined. Thus, we performed experiments to determine whether pembrolizumab increased Kv1.3 and/or KCa3.1 activity and Ca2+ fluxes in the TILs. The activity of KCa3.1 and Kv1.3 was determined via whole-cell patch-clamp electrophysiology and is reported as conductance (G) (figure 2A). The KCa3.1 activity did not differ between control and pembrolizumab patient TILs (figure 2B and online supplemental table 1). However, we observed that the Kv1.3 activity in CD8+ TILs of pembrolizumab patients increased as compared with control patients. In fact, Kv1.3 activity was 72% and 180% higher in non-responders and responders, respectively, as compared with TILs of control patients, although the difference between non-responders and responders was not statistically significant. An increase in Kv1.3 activity after treatment could be caused by an increase in Kv1.3 expression due to changes in activation state (Kv1.3 expression increases with activation) and/or a shift in T cell phenotype (autoreactive Teff and Temra express sixfold more Kv1.3 channels than Tnaive and Tm).46–48 However, capacitance measurements—which reflect the size of the cells and thus their activation state—showed no significant differences between TILs from control and pembrolizumab patients (online supplemental table 1). Additionally, flow cytometry experiments revealed no change in either the distribution of memory T cell subsets or Kv1.3 surface expression in TILs of pembrolizumab patients (online supplemental figure 4A–D). Therefore, the increase in Kv1.3 activity in TILs induced by pembrolizumab was not due to an increase in Kv1.3 expression associated with a switch in T cell phenotype.
Supplemental material

Pembrolizumab increases Kv1.3 activity and Ca2+ fluxes in TILs from non-responders and responders. (A) Representative KCa3.1 and Kv1.3 current traces recorded in TILs from control (CTR) and pembrolizumab (αPD1) patients. Currents were normalized for the maximum current recorded at +50 mV. (B) KCa3.1 (left) and Kv1.3 (right) activities reported as conductance (G) from individual TILs from CTR (n=36 and 35 cells, respectively, from 11 patients), non-responder (NR) (n=46 and 45 cells from 10 patients), and responder (R) (n=19 cells from 6 patients) patients. On average we recorded 4–5 cells/patient. Data compared via Kruskal-Wallis one-way ANOVA on ranks (p=0.105 left; p=0.003 right). (C) Representative single-cell intracellular Ca2+ recordings in TILs from CTR and αPD1 patients. The time of TG application is indicated by an arrow. (D) ΔCa2+ in CTR (n=117 cells from 12 patients; average of 10 cells/patient), NR (n=257 cells from 10 patients; average of 26 cells/patient), and R (n=94 cells from 6 patients; average of 16 cells/patient) patients. Data compared via Kruskal-Wallis one-way ANOVA on ranks (p=0.008). (B, D) Data are represented as box plots: the line indicates the median; the lower box is the 25th percentile; the upper box is the 75th percentile; and the whiskers represent the 10th and 90th percentiles. αPD1, anti-programmed death 1 antibody; ANOVA, analysis of variance; TG, thapsigargin; TILs, tumor infiltrating lymphocytes.
Furthermore, since K+ channels control the membrane potential of T lymphocytes and consequently regulate the Ca2+ influx necessary for cytokine and granzyme B production, we compared the Ca2+ fluxes of TILs from pembrolizumab and control patients.23 In these experiments, intracellular Ca2+ was measured using a method which allows bypassing the TCR in order to measure only ion channel/transporter-dependent Ca2+ fluxes that are downstream to antigen presentation and involved in cell proliferation, cytokine production and cytotoxicity.29 40 We observed a variety of Ca2+ responses in TILs, ranging from sustained, transient and oscillatory to no responses, in both control and pembrolizumab-treated groups (online supplemental figure 5). Representative Ca2+ recordings of similar kinetics in control and pembrolizumab TILs are shown in figure 2C. Ca2+ fluxing abilities (reported as ΔCa2+) were 42% and 44% higher in TILs of non-responder and responder patients, respectively, as compared with control TILs (figure 2D and online supplemental table 2). The AUC measured for control TILs (median AUC=90,983 nM*s; n=117) versus TILs of non-responders (median AUC=103,720 nM*s; n=257) and responders (median AUC=102,222 nM*s; n=94) was instead not statistically different (one-way ANOVA on ranks; p=0.280). However, we saw changes in the distribution of the different Ca2+ responses with a shift to sustained Ca2+ fluxes after pembrolizumab treatment both in responders and non-responders (online supplemental figure 5B). Interestingly, the shape of the Ca2+ response determines the downstream signaling, and either a sustained Ca2+ response or a high-frequency oscillation is necessary for nuclear factor of activated T cells (NF-AT) nuclear translocation, which regulates cytokine and granzyme B production.49 Flow cytometry analysis indicated that the changes observed in Ca2+ fluxes were not due to changes in other ion channel expression, including Orai1, Stim1, or TRPM7 (a Ca2+-permeant and Mg2+-permeant channel involved in human T cell motility) (online supplemental figure 4B–D).25 Overall, these data indicate that pembrolizumab treatment increases Kv1.3 activity and Ca2+ fluxing ability in TILs regardless of the treatment response. While these data provide evidence of a beneficial effect of pembrolizumab in TILs, they do not explain the reason as to why some patients respond to therapy while others do not.
Supplemental material
Supplemental material
Pembrolizumab treatment induces a sustained increase in K+ channel activity in circulating CD8+ T cells of responder patients
We conducted electrophysiological experiments to determine whether pembrolizumab treatment increases KCa3.1 and Kv1.3 activities in patients’ CD8+ PBTs. These experiments were conducted in resting and activated PBTs. Herein, we are reporting all the results for activated PBTs. The focus on activated T cells is brought by the fact that the expression and activity of KCa3.1 in resting PBTs are very low and increase in activated cells (online supplemental figure 1A,F and online supplemental table 1) where they regulate chemotaxis and cytokine production.46 50 Furthermore, it is the activated cells that infiltrate the tumor. Results for resting PBTs are only reported in the main figures when we observed significant differences, otherwise they can be found in online supplemental table 1 and online supplemental figure 6. Representative K+ current recordings in activated PBTs are shown in figure 3A. Pembrolizumab treatment increased KCa3.1 activity in activated PBTs by 35% as compared with treatment-naive, while Kv1.3 activity remained unchanged (figure 3B). Further experiments were conducted to determine whether a stimulatory effect of pembrolizumab on K+ channels persists after tumor resection. To this goal, we compared the KCa3.1 and Kv1.3 activities in activated PBTs of post-resection pembrolizumab versus control patients. While we observed no differences in KCa3.1 activity, Kv1.3 activity was 45% higher in post-resection pembrolizumab as compared with control patients (figure 3C). These data indicate that pembrolizumab increases K+ channel activity in CD8+ PBTs, with a distinct immediate upregulation of KCa3.1 followed by a sustained increase in Kv1.3 once the tumor mass is removed.
Supplemental material

Pembrolizumab increases KCa3.1 activity short term and Kv1.3 activity long term in responder PBTs. (A) Representative KCa3.1 and Kv1.3 currents recorded in activated PBTs from pembrolizumab patients at treatment-naive (TN; never received any treatment) and post-treatment (PT; after pembrolizumab) time points. Currents were normalized to PT for the maximum current recorded at +50 mV. (B) KCa3.1 (left) and Kv1.3 (right) activities reported as conductance (G) from TN (n=160 cells from 32 patients) and PT (n=118 cells from 22 patients) activated PBTs. (C) KCa3.1 (left) and Kv1.3 (right) activities (G) from individual post-resection (PR) activated PBTs from control (PR-CTR; PBTs obtained after tumor resection from patients who did not receive pembrolizumab treatment) (n=34 and 33 cells, respectively, from 7 patients) and pembrolizumab (PR-αPD1; PBTs obtained after tumor resection from patients who were treated with pembrolizumab) (n=79 and 78 cells, respectively, from 15 patients) patients. (D) KCa3.1 (left) and Kv1.3 (right) activities (G) from PT activated PBTs from non-responder (NR) (n=68 cells from 12 patients) and responder (R) (n=50 cells from 10 patients) patients and from individual PR activated PBTs from NR (n=44 and 43 cells, respectively, from 8 patients) and R (n=35 cells from 7 patients) patients. (E) Kv1.3 activity (G) from individual PR resting PBTs (r-PBTs) from NR (n=40 cells from 8 patients) and R (n=35 cells from 7 patients) patients. (B–E) Data are represented as box plots: the line indicates the median; the lower box is the 25th percentile; the upper box is the 75th percentile; and the whiskers represent the 10th and 90th percentiles. Data compared using Mann-Whitney rank-sum test. On average we recorded 4–5 cells/patient. αPD1, anti-programmed death 1 antibody; PBTs, peripheral blood T cells.
While these changes have been observed in a mixed population of patients (responders and non-responders combined), we next determined whether these effects were unique to responders. There were no differences in K+ channel activity in activated PBTs between these groups at treatment-naive stage (online supplemental table 1). It was observed that while post-treatment KCa3.1 activity in activated PBTs did not vary between these two groups, Kv1.3 activity was 25% higher in responders as compared with non-responders (figure 3D). Post-resection, there were no differences in either KCa3.1 or Kv1.3 activity in non-responder versus responder patient-activated PBTs (figure 3D). However, the difference in Kv1.3 activity seen at post-treatment persisted post-resection in resting PBTs, in which the Kv1.3 activity was 42% higher in responder than non-responder PBTs (figure 3E,online supplemental table 1 and figure 6). This suggests that pembrolizumab has additional and selective beneficial effects in responder patients. Additionally, capacitance measurements indicate that resting PBTs of responders have higher capacitance than non-responders post-treatment and post-resection (online supplemental table 1), suggesting that a higher activation state may explain a higher Kv1.3 activity in responders.23 Furthermore, flow cytometry experiments revealed a higher amount of memory T cells in the CD8+ PBT population of responders both post-treatment and post-resection (figure 4A). However, there was no change in the distribution of memory T cell subsets post-treatment in non-responders versus responders (figure 4B), while there was a decrease in Temra post-resection (figure 4B). Overall, we did not observe a change in T cell phenotype that could explain the increase in Kv1.3 activity in responders (figure 3D,E). In agreement with these findings, there was no difference in Kv1.3 surface expression in PBT subsets either post-treatment (figure 4C) or post-resection (figure 4D) between responders and non-responders. There was instead an increase in KCa3.1 in Temra and Teff in responders post-resection (figure 4D). However, we measured K+ channel activity in a mixed population of CD8+ T cells and not in these T cell subsets, so we do not know if this KCa3.1 differential expression is associated with a long-term increase in KCa3.1 activity in Teff and Temra PBTs in patients who responded to treatment. Additionally, it is possible that post-transcriptional modifications and/or altered expression of auxiliary subunits may be responsible for the changes in K+ channel activity by pembrolizumab.
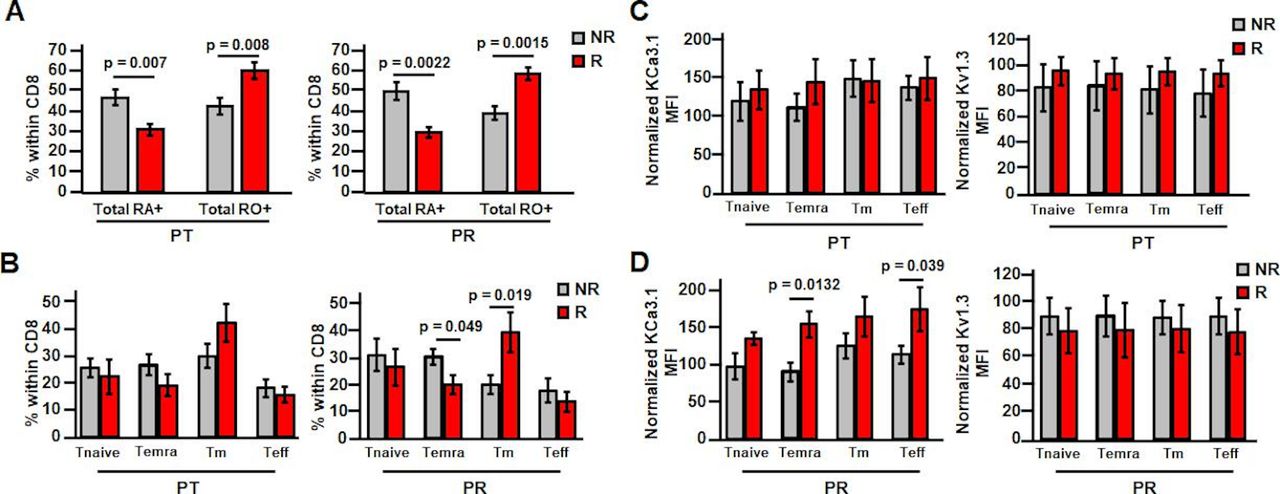
Pembrolizumab increases memory subset percentage in responder PBTs and increases Temra and Teff KCa3.1 expression post-resection. (A) Cells were gated based on the following: live cells, lymphocytes, CD8+ cells and then CD45RO/CD45RA. Percentage of resting PBTs composed of naive (Ra+) or memory (RO+) phenotypes post-treatment (PT; left) (NR patients n=11; R patients n=9) and post-resection (PR; right) (NR patients n=10; R patients n=7) was determined in non-responder (NR) and responder (R) patients. (B) Cells were gated based on the following: live cells, lymphocytes, CD8+ cells and then memory subtypes using CD45RA/CD127. Percentage of PT resting PBTs (left) composed of Tnaive, Temra, Tm, and Teff subsets (NR patients n=10; R patients n=7) was determined in NR and R patients. Percentage of PR resting PBTs (right) composed of Tnaive, Temra, Tm, and Teff subsets (NR patients n=9; R patients n=5) was determined in NR and R patients. (C, D) Cells were gated based on the following: live cells, lymphocytes, CD8+ cells, memory subtypes using CD45RA/CD127 and then ion channel expression (left: KCa3.1; right: Kv1.3). (C) Normalized KCa3.1 MFI (left) (NR patients n=10; R patients n=6) and normalized Kv1.3 MFI (right) (NR patients n=10; R patients n=7) in PT resting PBTs within the Tnaive, Temra, Tm, and Teff subsets were determined in NR and R patients. KCa3.1 data compared using Student’s t-test (Temra, Teff) or Mann-Whitney rank-sum test (Tnaive, Tm). Kv1.3 data compared using Student’s t-test (Tnaive, Temra, Tm) or Mann-Whitney rank-sum test (Teff). (D) Normalized KCa3.1 MFI (left) (NR patients n=9; R patients n=4) and normalized Kv1.3 MFI (right) (NR patients n=9; R patients n=5) in PR resting PBTs within the Tnaive, Temra, Tm, and Teff subsets were determined in NR and R patients. Data compared using Student’s t-test. (A–D) All data are represented as mean±SEM and compared via Student’s t-test unless otherwise indicated. MFI, mean fluorescence intensity; PBTs, peripheral blood T cells; Teff, effector T cells; Temra, effector memory reexpressing CD45RA T cells; Tm, memory T cells; Tnaive, naive T cells.
Overall, these data indicate that pembrolizumab potentiates K+ channel activity in CD8+ PBTs, with a distinct immediate increase in KCa3.1 activity, which in responders is accompanied by an increase in Kv1.3 activity. Since KCa3.1 is necessary for infiltration of CD8+ PBTs into the tumor and both Kv1.3 and KCa3.1 regulate Ca2+ fluxes, experiments were thus conducted to determine whether pembrolizumab changes the Ca2+ fluxing abilities and chemotaxis of PBTs.
Pembrolizumab increases Ca2+ fluxes in circulating CD8+ T cells of responder patients
Ca2+ fluxing abilities for resting and activated PBTs were measured (same protocol as TILs). The ΔCa2+ values and the percent differences in Ca2+ fluxes between different conditions are reported in online supplemental table 2. We considered differences in Ca2+ fluxes ≥10% to be biologically significant (see the Materials and methods section). Pembrolizumab caused a 5% difference in Ca2+ fluxes in activated PBTs from treatment-naive to post-treatment (in a mixed population of patients); however, this difference is considered biologically insignificant (figure 5A–B). Additionally, there were no changes in the Ca2+ fluxes of the control and pembrolizumab patients post-resection (figure 5C). Similar to the K+ channel analysis, we then assessed whether or not there were changes in PBT Ca2+ fluxes that correlated with treatment response. Ca2+ fluxes in activated PBTs of responders were 18% higher post-treatment and 29% higher post-resection as compared with non-responders (figure 5D). Furthermore, we observed no changes in expression of Orai1 and Stim1, the subunits comprising the CRAC channels, in responder and non-responder patients (online supplemental figure 7). Overall, pembrolizumab increases the Ca2+ fluxing abilities of activated PBTs in responder patients, which is a long-lasting effect that persists after tumor resection. Additionally, this effect coincided with the increase in Kv1.3 activity in resting and activated PBTs we observed in responders (figure 3D–E). Moreover, this increase in Ca2+ fluxing ability correlates with increased IFNγ production seen in this cohort of patients.39 While responder patients in this cohort also exhibit higher immune cell infiltration as a result of treatment,38 the effect of pembrolizumab on T cell chemotaxis has not yet been determined.31
Supplemental material

Pembrolizumab increases Ca2+ fluxes in responder PBTs both short term and long term. (A) Representative single-cell intracellular Ca2+ recordings measured in treatment-naive (TN) and post-treatment (PT) activated PBTs from pembrolizumab patients. The time of TG application is indicated by an arrow. (B) ΔCa2+ from TN activated PBTs (n=1745 cells from 34 patients; average of 51 cells/patient) and PT activated PBTs (n=1104 cells from 21 patients; average of 52 cells/patient). This difference is not considered biologically significant. (C) ΔCa2+ from post-resection (PR) activated PBTs from control (PR-CTR) (n=314 cells from 7 patients; average of 45 cells/patient) and pembrolizumab (PR-αPD1) (n=740 cells from 14 patients; average of 53 cells/patient) patients. (D) ΔCa2+ from PT activated PBTs from non-responder (NR) (n=472 cells from 11 patients; average of 43 cells/patient) and responder (R) (n=632 cells from 10 patients; average of 63 cells/patient) and PR activated PBTs from NR (n=350 cells from 7 patients; average of 50 cells/patient) and R (n=390 cells from 7 patients; average of 56 cells/patient) patients. (B–D) Data are represented as box plots: the line indicates the median; the lower box is the 25th percentile; the upper box is the 75th percentile; and the whiskers represent the 10th and 90th percentiles. Data compared using Mann-Whitney rank-sum test. αPD1, anti-programmed death 1 antibody; PBTs, peripheral blood T cells; TG, thapsigargin.
Pembrolizumab treatment increases the chemotactic ability of circulating CD8+ T cells of responder patients
The chemotactic ability of activated PBTs was determined through the use of 3D collagen matrices as described previously.31 KCa3.1 positively contributes to PBT motility and we have shown that pembrolizumab increased KCa3.1 activity in activated PBTs (figure 3B).25 Furthermore, KCa3.1 impacts the inhibitory effect of adenosine on chemotaxis.31 Therefore, we determined whether pembrolizumab improves PBT chemotaxis. Representative trajectories of migratory cells for treatment-naive PBTs are depicted in figure 6A. Each trajectory represents one cell and its movement toward the chemokine gradient—Y-COM, that is, the average movement of the PBTs toward the chemokine along the y-axis (figure 6A). Treatment-naive PBTs from both the control and pembrolizumab groups had similar baseline chemotaxis in the presence of CXCL12 (online supplemental figure 8A). Furthermore, pembrolizumab treatment did not change the chemotaxis in PBTs post-treatment; however, post-resection there was a significant decrease in chemotaxis (figure 6B). This loss of chemotactic ability was not the result of tumor removal as the control PBTs post-resection had chemotaxis similar to their baseline values (figure 6C). Interestingly, this chemotactic impairment was only observed in non-responders (figure 6D), while the responder PBTs maintained their ability to chemotax even after tumor removal (figure 6D). Otherwise, there was no difference in either baseline (treatment-naive) or post-treatment chemotaxis between responders and non-responders (online supplemental figure 8B). We then assessed whether pembrolizumab changed the ability of the PBTs to chemotax in the presence of adenosine. The trajectories of PBTs exposed to CXCL12 (±adenosine) for non-responders and responders are reported in figure 6E and F, respectively. While adenosine reduced the chemotaxis of PBTs by 53% in the mixed population of patients at the treatment-naive stage (Y-COM 93±4.9 µm (n=22) without adenosine vs 41±5.8 µm (n=22) with adenosine), which is in agreement with what has been previously reported,31 the effect of adenosine differed in responders versus non-responders after treatment. The chemotaxis of non-responder PBTs post-treatment was significantly inhibited by adenosine, while the effect of adenosine on responders was no longer significant (figure 6G). The lack of inhibition by adenosine seen in responders is similar to the phenomena seen in healthy donors.31 Detailed analysis of the chemotaxis data was performed on a subset of responders and non-responders post-treatment to determine if other chemotactic properties were altered by adenosine (online supplemental table 3). As previously reported, parameters such as forward migration index in the y-direction, directness, and Euclidean distance were inhibited by adenosine, while velocity and accumulated distance were not affected (online supplemental table 3).31 None of these parameters was inhibited in this subset of responders (online supplemental table 3). However, this beneficial effect of pembrolizumab in responders was not long-lasting as these patients’ PBTs again became sensitive to the inhibitory effects of adenosine post-resection (figure 6H). On the contrary, non-responders lost adenosine sensitivity—which may just reflect their compromised motility shown by their inability to chemotax in the presence of chemokine alone (figure 6D). Overall, these data indicate that pembrolizumab treatment increases the chemotactic ability of PBTs of responder patients, with CD8+ T cells evading adenosine control over chemotaxis post-treatment and maintaining their ability to chemotax post-resection.
Supplemental material
Supplemental material
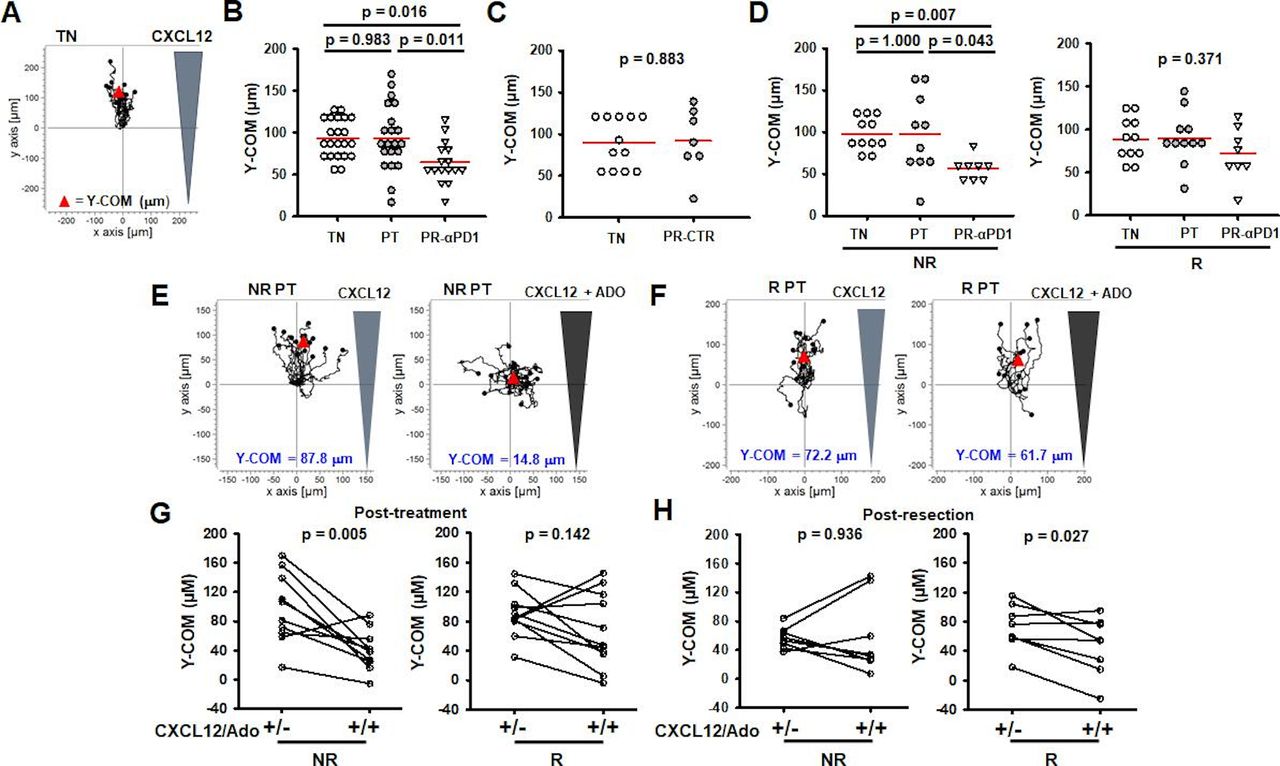
Responder PBTs maintain the ability to chemotax over time. (A) Trajectories of treatment-naive (TN) activated PBTs in the presence of a CXCL12 gradient. Y-COM represented by red triangle. (B) Y-COM measurements of TN (n=22 patients), post-treatment (PT) (n=21 patients), and post-resection (PR) (n=16 patients) activated PBTs from pembrolizumab patients (αPD1). Data are represented as individual data points per patient with mean (red line) and compared using a one-way ANOVA (p=0.007). (C) Y-COM measurements of TN (n=12 patients) and PR activated PBTs (n=7 patients) from control patients (CTR). Data are represented as individual data points per patient with mean (red line) and compared using Student’s t-test. (D) Left: Y-COM measurements of TN (n=11 patients), PT (n=10 patients), and PR-αPD1 (n=8 patients) activated PBTs from non-responder (NR) patients. Right: Y-COM measurements of TN (n=11 patients), PT (n=11 patients), and PR-αPD1 activated PBTs (n=8 patients) from responder (R) patients. Data are represented as individual data points per patient with mean (red line) and compared using Kruskal-Wallis one-way ANOVA on ranks (p=0.006; left) and one-way ANOVA (p=0.371; right). (E) Trajectories of NR activated PBTs in the presence of a CXCL12 gradient (left) or CXCL12 gradient with adenosine (ADO) (right). Y-COM represented by red triangle. (F) Trajectories of R activated PBTs in the presence of a CXCL12 gradient (left) or CXCL12/ADO gradients (right). Y-COM represented by red triangle. (G) Y-COM measurements of PT activated PBTs in NR (n=10 patients) and R (n=11 patients) patients toward CXCL12 or CXCL12/ADO gradient. Data compared using paired t-test. (H) Y-COM measurements of PR activated PBTs in NR (n=8 patients) and R (n=8 patients) patients toward CXCL12 or CXCL12/ADO gradients. Data compared using paired t-test. αPD1; anti-programmed death 1 antibody; ANOVA, analysis of variance; PBTs, peripheral blood T cells; Y-COM, Y-center of mass.
Discussion
Although there is a lot known about PD1 and PD1/PD-L1 interaction, its downstream effects and the mechanism of patient response and resistance are not fully understood. Herein we provide evidence that neoadjuvant pembrolizumab treatment increases the K+ channel activity in both PBTs and TILs of patients with HNSCC. Furthermore, pembrolizumab improves cellular functions downstream to K+ channels, such as Ca2+ signaling and chemotaxis. Additionally, while the beneficial effects of pembrolizumab in TILs occur irrespective of the treatment response, we show that PBTs of responders have a unique pattern of response and are reinvigorated more than those of non-responders. For the sake of clarity, a comprehensive snapshot of the effects of pembrolizumab on CD8+ T cells of responders and non-responders is reported in online supplemental table 4. Because αPD1 treatment is not effective in all patients,19 51 elucidating the mechanism of how pembrolizumab increases T cell function sheds light on patient response and resistance.
Supplemental material
We observed that pembrolizumab increased the Kv1.3 activity along with Ca2+ fluxes in TILs. It has been reported that αPD1 treatment increases Ki67 expression in PD1+ CD8+ T cells and that expression of Kv1.3 in TILs of patients with HNSCC correlates with granzyme B and Ki67 levels.29 37 Therefore, these data indicate that Kv1.3 activation contributes to the increase in TIL cytotoxicity and cytokine release induced by pembrolizumab as Kv1.3 and Ca2+ are upstream to these functions and constitute rate-limiting steps in their fulfillment. However, while pembrolizumab reinvigorates TILs through ion channel activation, this does not seem to be the reason that patients have a treatment response to pembrolizumab, as Kv1.3 activity and Ca2+ fluxes were equally elevated in non-responders and responders.
Our investigations of PBTs point to the effects of pembrolizumab that may contribute to an effective response to therapy. While pembrolizumab increased KCa3.1 activity in PBTs from all patients immediately after treatment, this effect in treatment responders was accompanied by an increase in Kv1.3 activity and Ca2+ fluxes. Additionally, immediately post-treatment we observed that pembrolizumab decreased responder PBTs’ sensitivity to adenosine. At a first glance it appears that there is not a direct link between pembrolizumab-induced increase in KCa3.1 and changes in chemotaxis in the presence of adenosine as non-responders, who also had an increase in KCa3.1 activity, did not show increased chemotactic ability. Other alterations imposed by αPD1 on the processes that govern chemotaxis and/or adenosine signaling must occur in responders that facilitate chemotaxis in the presence of adenosine. However, we cannot exclude that the increase in KCa3.1 induced by αPD1 in responders may also be necessary, yet not sufficient, for an effective chemotaxis. Chemotaxis is a very complex process, and other processes governing chemotaxis and/or adenosine response that were not investigated by us, such as adenosine concentration in the tumor and adenosine signaling or chemokine receptor expression, could be differently altered by αPD1 in responders and non-responders.52 53 Nevertheless, the increase in chemotactic ability in an adenosine-rich environment of responders’ circulating T cells could ultimately allow the cells to better infiltrate the TME, and it is in agreement with data showing that pembrolizumab increases CD8+ T cell density in solid tumors and in this study’s responder patient cohort.15 38 So while there is still a possibility that KCa3.1 may play a role in the improved chemotaxis of responder patients, it is also possible that this channel increase may play another important role: to guarantee the maximal activation response (cytokine release and cytotoxicity) in responders’ activated T cells which requires both KCa3.1 and Kv1.3 activities.54 Interestingly, while the stimulatory effect of pembrolizumab on KCa3.1 was short-lived, there was a long-lasting effect on Kv1.3 particularly in responder patients. After tumor resection, both responders and non-responders increased Kv1.3 activity; however, in responders this effect could already be detected in resting cells and, in activated cells, was accompanied by an increase in Ca2+ fluxing ability. We also observed that responders’ PBTs maintained their ability to chemotax after tumor removal, but the non-responders’ PBTs could no longer chemotax (figure 6). At this time we can only speculate about the functional implications of these increases in Kv1.3 in responders’ PBTs, but it is possible that high Kv1.3 activity primes PBTs of responders to quickly attack and kill circulating cancer cells and small cancer cell clusters (where an adenosine-rich TME is not yet established) after tumor removal. This mechanism may contribute to the long-lasting effects of αPD1. Further investigations are necessary to explore these possibilities. The overall impact, however, of αPD1 treatment we have shown here was to increase K+ channel activity and Ca2+ fluxes in cytotoxic T cells, which could explain the improved antitumor capabilities of these cells reported for patients treated with pembrolizumab. This effect, combined with the improvement of chemotaxis, contributes to the efficacy of αPD1. A model depicting the functional consequences of the responses we have uncovered is shown in figure 7.

Proposed model of cytotoxic T cell function in non-responder and responder patients. Summary of functional aspects in CD8+ T cells of non-responder and responder patients post-treatment and post-resection. In non-responders, post-treatment activated PBTs have increased KCa3.1 activity. Additionally, these activated PBTs are able to chemotax; however, in the presence of adenosine, the chemotaxis is inhibited. In the tumor, the non-responders have low T cell infiltration; however, the T cells that do infiltrate have increased Kv1.3 activity and Ca2+ fluxing ability. After tumor removal (post-resection), the activated PBTs have increased Kv1.3 activity, but these cells are not able to chemotax. On the other hand, in responders, post-treatment activated PBTs have increased KCa3.1 and Kv1.3 activities and Ca2+ fluxing ability. Additionally, these activated PBTs are able to chemotax even in the presence of adenosine. Furthermore, in the tumors of responders, there is higher T cell infiltration and these cells, like the non-responders, have increased Kv1.3 activity and Ca2+ fluxing ability. Moreover, after tumor removal, resting PBTs of responders already have increased Kv1.3 activity and in the activated PBTs the Kv1.3 activity is also increased. Additionally, these cells are able to chemotax, although their chemotaxis is inhibited by adenosine. PBTs, peripheral blood T cells. Created with BioRender.com.
Overall, while it is known that αPD1 increases the functionality of cytotoxic T cells,13–15 this is the first report of a role for ion channels in this response. These data indicate that pembrolizumab elicits an ion channel and functional phenotype in responder patients’ cytotoxic T cells that is conducive to a heightened ability of these cells to chemotax and kill cancer cells, features that persist over time and may contribute to the durable response in these patients. Furthermore, they show that these K+ channels are attractive targets for the development of new cancer immunotherapies to be used in combination with αPD1 therapy.
Acknowledgments
We would like to acknowledge Dr Heather Duncan for her aid with IRB regulatory affairs (Division of Nephrology, Department of Internal Medicine, University of Cincinnati); the clinical coordinators for their assistance in patient sample collection (Clinical Trials Office, University of Cincinnati Cancer Center); and Dr Francis Worden at the University of Michigan for aid in the collection of one patient sample. We would also like to thank Dr Michael Arnold, Dr Martina Chirra, Dr Peter Hajdu and Farhan Z Ilyas for technical assistance. Flow cytometry was completed at Cincinnati Children's Hospital Medical Center in the Research Flow Cytometry Core and the Shriner’s Hospital for Children Flow Cytometry Core. 3D chemotaxis was imaged at the Live Microscopy Core at the Department of Pharmacology and Systems Biology at the University of Cincinnati.
References
Supplementary materials
Supplementary Data
This web only file has been produced by the BMJ Publishing Group from an electronic file supplied by the author(s) and has not been edited for content.
Footnotes
Twitter @vaibhavkumar_g, @ameetchimote
HSN, VSG and AAC contributed equally.
Contributors HSN performed the experiments, analyzed and interpreted the data, and wrote the manuscript. VSG and AAC performed the experiments and contributed to data analysis and manuscript preparation. MAL performed the experiments and analyzed the data. SMP assisted with the experiments. BHH provided expertise in the pathology analysis of tumor specimen. RJ provided expertise in statistical analysis. DH provided expertise in immunology. EMJ designed and supervised the experiments, and provided expertise in tumor immunology. TMW-D directed the clinical trial, supervised specimen procurement, and provided expertise in HNSCC. LC supervised the design, analysis, and interpretation of the experiments, directed the study, provided expertise in ion channels and T cell function, and wrote the manuscript. All authors read and approved the final manuscript.
Funding This work was supported by the Office of the Assistant Secretary of Defense for Health Affairs, through the Peer Reviewed Cancer Research Program, under Award No W81XWH-17-1-0374 (LC, TMW-D, EMJ). Opinions, interpretations, conclusions and recommendations are those of the authors and are not necessarily endorsed by the Department of Defense. The US Army Medical Research Acquisition Activity, Fort Detrick, Maryland is the awarding and administering acquisition office. Additional funding was provided by the National Cancer Institute (CA095286; LC) and the Brandon C Gromada Head & Neck Cancer Foundation (LC) as well as Merck (TMW-D). HSN was supported by NCI T32CA117846. TMW-D was supported by a National Institutes of Health/Translational Science Award KL2 Training Grant TR001426 during a portion of this work. Flow cytometry experiments at the Research Flow Cytometry Core were supported by a grant from the NIH (grant AR070549).
Competing interests TMW-D received funding from Merck to complete the clinical trial.
Patient consent for publication Not required.
Ethics approval The clinical trial (IRB# 2015-6798) as well as sample collection protocols (IRB#s 2014-4755 and 2017-2137) were approved by the institutional review board at the University of Cincinnati and were conducted in accordance with Good Clinical Practice guidelines and the Declaration of Helsinki. Written informed consent was received from all participating patients prior to enrollment.
Provenance and peer review Not commissioned; externally peer reviewed.
Data availability statement Data sharing not applicable as no data sets generated and/or analyzed for this study. All data relevant to the study are included in the article or uploaded as supplementary information.
Supplemental material This content has been supplied by the author(s). It has not been vetted by BMJ Publishing Group Limited (BMJ) and may not have been peer-reviewed. Any opinions or recommendations discussed are solely those of the author(s) and are not endorsed by BMJ. BMJ disclaims all liability and responsibility arising from any reliance placed on the content. Where the content includes any translated material, BMJ does not warrant the accuracy and reliability of the translations (including but not limited to local regulations, clinical guidelines, terminology, drug names and drug dosages), and is not responsible for any error and/or omissions arising from translation and adaptation or otherwise.