Article Text

Abstract
Background Combination treatment with chemotherapy and immune checkpoint inhibitors (ICIs) has demonstrated meaningful clinical benefit to patients. However, chemotherapy-induced damage to the immune system can potentially diminish the efficacy of chemotherapy/ICI combinations. Trilaciclib, a highly potent, selective and reversible cyclin-dependent kinase 4 and 6 (CDK4/6) inhibitor in development to preserve hematopoietic stem and progenitor cells and immune system function during chemotherapy, has demonstrated proof of concept in recent clinical trials. Furthermore, CDK4/6 inhibition has been shown to augment T-cell activation and antitumor immunity in preclinical settings. Therefore, addition of trilaciclib has the potential to further enhance the efficacy of chemotherapy and ICI combinations.
Methods In murine syngeneic tumor models, a schedule of 3 weekly doses of trilaciclib was combined with chemotherapy/ICI regimens to assess the effect of transient CDK4/6 inhibition on antitumor response and intratumor T-cell proliferation and function. Peripheral T-cell status was also analyzed in patients with small cell lung cancer (SCLC) treated with chemotherapy with or without trilaciclib to gain insights into the effect of transient exposure of trilaciclib on T-cell activation.
Results Preclinically, the addition of trilaciclib to chemotherapy/ICI regimens enhanced antitumor response and overall survival compared with chemotherapy and ICI combinations alone. This effect is associated with the modulation of the proliferation and composition of T-cell subsets in the tumor microenvironment and increased effector function. Transient exposure of trilaciclib in patients with SCLC during chemotherapy treatment both preserved and increased peripheral lymphocyte counts and enhanced T-cell activation, suggesting that trilaciclib not only preserved but also enhanced immune system function.
Conclusions Transient CDK4/6 inhibition by trilaciclib was sufficient to enhance and prolong the duration of the antitumor response by chemotherapy/ICI combinations, suggesting a role for the transient cell cycle arrest of tumor immune infiltrates in remodeling the tumor microenvironment. These results provide a rationale for combining trilaciclib with chemotherapy/ICI regimens to improve antitumor efficacy in patients with cancer.
- therapies
- investigational
- drug evaluation
- preclinical
- clinical trials
- phase II as topic
This is an open access article distributed in accordance with the Creative Commons Attribution Non Commercial (CC BY-NC 4.0) license, which permits others to distribute, remix, adapt, build upon this work non-commercially, and license their derivative works on different terms, provided the original work is properly cited, appropriate credit is given, any changes made indicated, and the use is non-commercial. See http://creativecommons.org/licenses/by-nc/4.0/.
Statistics from Altmetric.com
Background
Trilaciclib (G1T28) is a highly potent, selective and reversible cyclin-dependent kinase 4 and 6 (CDK4/6) inhibitor that maintains G1 cell cycle arrest of cells that are dependent on CDK4/6 for regulation of the G1 to S transition. By transiently maintaining G1 arrest of proliferating hematopoietic stem and progenitor cells in the bone marrow during chemotherapy treatment, trilaciclib proactively protects them from chemotherapy-induced damage, leading to faster recovery of neutrophils, red blood cells (RBCs), lymphocytes and platelets after chemotherapy treatment.1 2 In a phase II trial (NCT02499770) evaluating trilaciclib administered prior to etoposide and carboplatin (E/P) therapy in patients with newly diagnosed extensive-stage small cell lung cancer (SCLC), trilaciclib demonstrated myelopreservation across multiple hematopoietic lineages (including neutrophils, RBCs and lymphocytes), resulting in fewer supportive care interventions and dose reductions, an improved safety profile and no detriment to antitumor efficacy.3
In addition to improving the safety of chemotherapy, trilaciclib improved overall survival (OS) among patients with metastatic triple-negative breast cancer (mTNBC) when added prior to gemcitabine and carboplatin.4 Possible mechanisms of trilaciclib-mediated enhanced antitumor efficacy include maintenance of chemotherapy dose intensity (ie, fewer dose reductions), protection of lymphocyte populations and increased immune activation. Trilaciclib and other CDK4/6 inhibitors have been shown to augment antitumor responses in preclinical settings5 by enhancing T-cell activation through modulation of nuclear factor of activated T-cell activity,6 as well as increasing antigen presentation through upregulation of major histocompatibility complex class I and II in CDK4/6-sensitive tumors and myeloid cells.7 8 Additionally, CDK4/6 inhibition can upregulate and stabilize the protein expression of programmed death-ligand 1 (PD-L1) on tumor cells, leading to increased vulnerability of tumors to immune checkpoint inhibitor (ICI) treatment.9 Furthermore, CDK4/6 inhibition reduces a T-cell exclusion and immune evasion gene signature that is predictive of resistance to ICI treatment.10 These results suggest that trilaciclib has the potential to enhance the efficacy of chemotherapy, as well as chemotherapy and ICI combinations.
Chemotherapy and ICI combinations have shown superior benefits compared with chemotherapy or ICI monotherapy in various clinical settings, including non-SCLC, SCLC and TNBC.11–15 The enhanced efficacy by chemotherapy and ICI combinations is likely attributed to various immunostimulatory properties by different classes of chemotherapeutic agents.16–19 However, because chemotherapy indiscriminately kills proliferating cells, the full benefit of chemotherapy plus ICI combinations may not be realized due to the resulting myelosuppression and immunosuppression20 21 that occurs when normal proliferating hematopoietic stem and progenitor cells and immune cells are exposed to chemotherapy. Therefore, addition of trilaciclib to chemotherapy and ICI combinations is a rational approach to maintain and/or enhance immune system function to fully exploit the therapeutic potential of chemotherapy/ICI combination regimens and minimize toxicity. The goal of this study was to evaluate the ability of trilaciclib to enhance antitumor response when combined with chemotherapy plus ICI combinations.
Methods
In vivo tumor studies
Nine-week-old female C57BL/6 (C57BL/6NCrl) and BALB/c mice were implanted subcutaneously with 5×10⁵ MC3822 or CT26 American Type Culture Collection (ATCC) tumor cells, respectively (cell lines supplied by Charles River Laboratories). Two to 3 weeks after tumor injection and prior to treatment start (day 1 of the study), animals with individual tumor volumes from 80 to 120 mm3 were sorted into the appropriate number of treatment groups, with group mean tumor volumes of 100 mm3.
Trilaciclib (100 mg/kg), oxaliplatin (10 mg/kg; Fresenius Kabi USA, Lot 8 760 467A01) or 5-fluorouracil (5-FU; 75 mg/kg, Fresenius Kabi USA, Lot 6113613) were administered intraperitoneally (IP) once weekly for 3 weeks. Anti-PD-L1 (BioXCell, Cat. No. BE0101, clone 10F.9G2, 100 µg/animal, IP) or anti-programmed death-1 (PD-1; BioXCell, Cat. No. BE0146, clone RMP1-14, 5 mg/kg, IP) were given twice per week.
Tumors were measured using calipers twice per week. Each animal was euthanized when its tumor volume reached the 1000 mm3 end point or at last day of the study. A partial response (PR) indicated that the tumor volume was ≤50% of its day 1 volume for three consecutive measurements during the course of the study, and ≥13.5 mm3 for at least one of these three measurements. A complete response (CR) indicated that the tumor volume was <13.5 mm3 for three consecutive measurements during the course of the study. Animals were scored only once during the study for a PR or CR event, and only as CR if both PR and CR criteria were satisfied.
Assessment of in vivo proliferation of immune cell populations
To assess proliferation of immune cells after trilaciclib treatment, MC38 tumor-bearing C57BL/6 mice were treated with vehicle or trilaciclib (100 mg/kg, IP) and after 6–48 hours, were labeled with 5-ethynyl-2’-deoxyuridine (EdU; 200 µg/mouse, IP). To assess proliferation of immune cells in tumors after oxaliplatin plus anti-PD-L1 (OP) or trilaciclib plus oxaliplatin and anti-PD-L1 (TOP) treatments, MC38 tumor-bearing mice were dosed with OP or TOP on day 1 and anti-PD-L1 on day 4 as indicated in figure 1A, with EdU labeling on days 2, 4 and 7. In both assessments, mice were euthanized at 18 hours after EdU dosing, and tumors and spleens were harvested for analysis. Tumors were processed to single-cell suspensions, followed by depletion of dead cells using the Dead Cell Removal Kit (Miltenyi Biotech; catalog number 130-090-101) and enrichment of CD45+ immune cells using the Tumor-Infiltrating Lymphocyte Isolation Kit (Miltenyi Biotech; catalog number 130-110-618) prior to antibody labeling for the following lymphoid and myeloid immune cell populations: CD8+ T cells (CD8+CD4-), CD4+ T-helper (Th) cells (CD8-CD4+FoxP3-), T-regulatory cells (Tregs; CD8-CD4+FoxP3+), natural killer (NK) cells (CD3-NK1.1+), monocytic myeloid-derived suppressor cells (mMDSC; CD11b+Ly6C+Ly6G-), granulocytic MDSC (gMDSC; CD11b+Ly6C+Ly6G+) and macrophages (CD11b+Ly6C-Ly6G-). After cell surface staining, cell samples were fixed and EdU incorporation was detected using the Click-iT Plus EdU kit (ThermoFisher; catalog number C10637–40), followed by flow cytometric analysis. Data were collected on a FACSCalibur (BD Biosciences) and analyzed with FlowJo software (Tree Star).

Addition of trilaciclib to oxaliplatin and αPD-L1 combination therapy, and other multiple chemotherapy and ICI combinations, led to enhanced antitumor activity and durability of response in MC38 and CT26 tumor models. (A) Three dosing schedules were initially tested in the MC38 model. The induction plus maintenance schedule was carried forward in all other experiments in both the MC38 and CT26 models with the substitution of 5-FU for oxaliplatin, or anti-PD-1 for anti-PD-L1 as indicated. (B–D) Tumor growth and overall survival of MC38 and CT26 mice treated with chemotherapy/ICI ±trilaciclib combination therapy (n=10–15 per treatment group). *P≤0.05. 5-FU, 5-fluorouracil; αPD-L1, anti-programmed death-ligand-1; I, induction; ICI, immune checkpoint inhibitor; IM, induction plus maintenance; M, maintenance; OP, oxaliplatin plus anti-programmed death-ligand-1; TOP, trilaciclib plus oxaliplatin and anti-programmed death-ligand-1.
Immune profiling of MC38 tumors and spleens by flow cytometry
Tumors and spleens were harvested on days 5 and 9 from OP-treated and TOP-treated MC38 mice following the induction plus maintenance (IM) treatment schedule indicated in figure 1A. Mouse tumor samples were dissociated according to the manufacturer’s instructions using the gentleMACS protocol Tumor Dissociation Kit (Miltenyi Biotech; catalog number 130-096-730). Single-cell suspensions were subsequently stained with LIVE/DEAD Fixable Aqua Dead Cell Stain Kit (Life Technologies) and Fragment crystallizable receptors were blocked using TruStain FcX (Biolegend) before staining with antibodies for cell surface markers: CD8+ T cells (CD45+CD3+CD11b-CD8+CD4-), CD4+ T cells (CD45+CD3+CD11b-CD8-CD4+), Tregs (CD45+CD3+CD11b-CD8-CD4+CD25+FoxP3+), mMDSC (CD11b+CD3-Ly6C+Ly6G-), gMDSC (CD11b+CD3-Ly6C+Ly6G+) and macrophages (CD11b+CD3-Ly6C-Ly6G-). For FoxP3 staining, cells were permeabilized with Transcription Factor Fixation/Permeabilization buffer (eBioscience) and incubated with anti-FoxP3 antibody. Spleens were processed to single-cell suspension, lysed with ammonium-chloride-potassium buffer to remove RBCs and stained with antibodies: activated CD8+ T cells (CD8+CD4-CD69+), activated CD4+ T cells (CD4+CD8-CD69+) and Tregs (CD4+CD25+FoxP3+). Dead cells were excluded by propidium iodide staining. Antibody clones and vendor information are listed in the online supplemental methods. Data were collected on a FACSCanto II (BD Biosciences) and analyzed with FlowJo software (Tree Star).
Supplemental material
Whole tumor gene expression analysis
Total RNA was isolated from flash-frozen tumors, harvested on days 9 and 17, from vehicle-treated, trilaciclib-treated, OP-treated and TOP-treated MC38 mice following the IM treatment schedule indicated in figure 1A (n=5 per treatment group), using the AllPrep DNA/RNA/miRNA Universal Kit (Qiagen; catalog number 80224). Gene expression analysis was performed using the PanCancer Immune Profiling Panel (NanoString; catalog number XT-CSO-HIP1-12). Count data for panels were normalized to positive control probes for each sample and background corrected using NanoStringQCPro software (Bioconductor). The background-corrected counts were normalized using trimmed mean of M-value normalization and transformed with voom to log2 counts per million with associated precision weights. Significant genes with raw p-value <0.05 and fold change ≥1.3 from each comparison were analyzed for enrichment of Kyoto Encyclopedia of Genes and Genomes pathway membership using a hypergeometric test. Significant genes with each comparison were also analyzed for enrichment of Gene Ontology (GO) terms across all three GO ontologies using a hypergeometric test. For all analyzes, enrichment (p<0.05) was assessed separately for upregulated and downregulated genes. The conditional algorithm implemented in the GOstats R package (Bioconductor) was used to estimate if each term was statistically over-represented; this was performed separately for each ontology and the results merged. Gene expression analysis was performed at EA Genomics/Q2 Solutions (Morrisville, North Carolina, USA), and data analysis was performed at Fios Genomics (Edinburgh, UK).
Peripheral blood immunophenotyping in an SCLC clinical trial
This was a phase 1b (open-label, dose-finding) and phase II (randomized, double-blind, placebo-controlled) study of the safety, efficacy and pharmacokinetics of trilaciclib in combination with E/P therapy for treatment-naïve patients with extensive-stage SCLC (ClinicalTrials.gov identifier NCT02499770). Patients received trilaciclib or placebo prior to E/P on days 1–3 of each cycle.3 During part 2 of the study, whole blood was collected from those patients who received at least four cycles of chemotherapy for analysis of immune subsets by flow cytometry at Covance Central Laboratory Services (CLS). For patients treated with E/P and trilaciclib prior to E/P (T/E/P), samples were collected on day 1 of cycles 1 (C1D1; 30 and 28 samples, respectively), 3 (C3D1; 24 and 27 samples, respectively) and 5 (C5D1; 19 and 22 samples, respectively), and at the post-treatment visit (28 and 19 samples, respectively).
For absolute cell counts of CD4+ T cells, CD8+ T cells and B cells, the TruCount M panel (CLS Formulations, catalog number TCM-01 and TCM-02) containing antibodies against CD45, CD3, CD8, CD4, CD16, CD56, CD14 and CD19 was used. Tregs were analyzed using a panel of antibodies against CD127, C45RO, CD45, CCR4, CD3, CD25, CD4 and HLA-DR (CLS Formulations, catalog number TCSUBT-03). Activated T cells were analyzed using a panel of antibodies against CD38, CXCR3, CD45, CCR6, CD3, CD8, CD4 and HLA-DR (CLS Formulations, catalog number TCSUBT-04). For assessment of ex vivo cytokine production by T cells, whole blood was stimulated with 5 µg/mL staphylococcal enterotoxin B overnight (15–18 hours) in the presence of brefeldin A. Cells were processed and labeled with fluorophore-labeled antibodies against interferon (IFN)-γ, interleukin (IL)−4, IL-2, CD45RA, IL-17A, CD4 and CD8 (CLS Formulations, catalog number THICYT-04) for flow cytometry analysis.
A linear mixed-effect model was fitted on the longitudinal data for absolute count of CD3+ total T cells, CD4+ T cells, CD8+ T cells and CD19+ B cells to assess the effect of treatment on lymphocyte levels over time (table 1). The dependent variable in the model was ‘test result,’ the absolute cell count (cells/µL). The data were restricted to patients who received ≥4 cycles of chemotherapy and considered a random effect, while time (weeks), treatment group (T/E/P or E/P) and their interaction were modeled as fixed effects. The analysis used an unstructured variance–covariance structure, according to the following model:
Effect of E/P and T/E/P treatment on the absolute count of peripheral lymphocytes over time
Test Result ∼ Weeks + Treatment + Weeks : Treatment + PatientID (random effect).
From the model, the slope for each treatment group reflects the trend of change along the time for absolute cell count; hence, the slope difference between treatment groups can be used to evaluate the treatment effect of trilaciclib. The R package lme4 was used to fit a linear mixed-effect model,23 and lmerTest was used to generate p-values for the fitted model.24 All statistical analysis of flow cytometry data was performed by Fios Genomics (Edinburgh, UK).
T-cell receptor β CDR3 sequencing
The T-cell receptor (TCR)β CDR3 regions were amplified and sequenced from purified genomic DNA in human peripheral blood mononuclear cells or murine MC38 tumors using the immunoSEQ Assay (Adaptive Biotechnologies, Seattle, Washington, USA).25 26 The estimated proportion of T cells in peripheral blood mononuclear cells or tumors was calculated as previously described.27 28 To derive the overall clonality score, Shannon entropy was calculated on the clonal abundance of all productive TCR sequences in the data set, and normalized to the range by dividing by the logarithm of the number of unique productive TCR sequences. The clonality score was determined as the inverted value of the normalized entropy value. Expanded T-cell clones (ie, those whose frequencies increased in post-treatment versus pretreatment [C1D1] samples, in a given patient), were computationally identified as previously described.29 A binomial test was used to compute a p value for each clone across the two samples against the null hypothesis that the population abundance of the clone was identical in both samples, and corrected for multiple testing to control the false discovery rate using the Benjamini-Hochberg procedure, employing a significance threshold of adjusted p<0.01. Survival analysis was performed using R packages Survival and Survminer. Statistical analysis was performed using the Cox proportional hazard regression analysis.
Results
Addition of trilaciclib to chemotherapy and ICI combinations enhances antitumor activity in preclinical cancer models with established tumors
To evaluate the effect of trilaciclib on the antitumor immune response when combined with chemotherapy plus ICI, murine subcutaneous syngeneic colon tumor models MC38 and CT26 were used. The dose of trilaciclib was derived from preclinical data and pharmacokinetic/pharmacodynamic modeling of the biologically effective dose in humans.1–3 30 31 Both tumor models were insensitive to trilaciclib treatment alone, as there was no significant change in tumor growth inhibition when tumor-bearing animals were treated with varying schedules of trilaciclib as a single agent. Neither continuous nor intermittent dosing schedules of trilaciclib plus anti-PD-L1 combination treatment improved tumor growth inhibition in either model (Lai et al. online supplemental figure S1).
Supplemental material
TOP combinations substantially enhanced overall response rate and durability of the response compared with the OP groups with all three dosing schedules (table 2; figure 1B–D; online supplemental figure S1C). Specifically, TOP animals had significantly higher rates of CR and prolonged survival on day 100 (table 2). Using the IM dosing strategy, the addition of trilaciclib to OP plus anti-PD-1 or 5-FU plus anti-PD-L1 combinations consistently improved antitumor response and survival (figure 1C; table 2). Although the CT26 tumor model was less sensitive to OP treatment than the MC38 model, TOP-treated CT26 animals dosed with the IM schedule demonstrated higher tumor growth inhibition (figure 1D), more CRs and longer OS compared with OP treatment (table 2). Tumor growth curves for individual animals within each of the treatment groups are provided in online supplemental figure S1D–F. These results demonstrate that trilaciclib can significantly enhance antitumor response of various chemotherapy and ICI combinations in murine models with established tumors.
Addition of trilaciclib to chemotherapy/ICI treatment combinations enhances CR and median OS
Intermittent dosing of trilaciclib modulates the proliferation kinetics of T-cell subsets in the tumor microenvironment
To determine the mechanism by which trilaciclib contributes to an enhanced antitumor response seen in preclinical models, in vivo EdU incorporation was performed in MC38 tumor-bearing mice to identify proliferating intratumor immune cell populations that are sensitive to CDK4/6 inhibition. In untreated tumor-bearing animals, intratumor T cells (CD8+, CD4+ and Tregs), NK cells and mMDSCs were significantly more proliferative compared with their counterparts in the spleen (Lai et al. online supplemental figure S2; figure 2A). Conversely, only a low level of proliferation was present in both intratumor and splenic macrophages (2% and 1%, respectively), and the proliferation status of gMDSCs was similar in spleen and tumor (figure 2A). The proliferation of intratumor immune cell populations was maximally arrested between 12 and 24 hours after one dose of trilaciclib compared with vehicle treatment (figure 2B). This proliferation arrest was transient, as the proportion of EdU+ cells started to recover by 24–48 hours, depending on the immune cell type (figure 2B). These results indicate that trilaciclib treatment causes a transient but reversible proliferation arrest in tumor immune infiltrates, whereas the kinetics of cell cycle arrest and the rate of recovery in their proliferative capacity varies among immune cell types.
Supplemental material
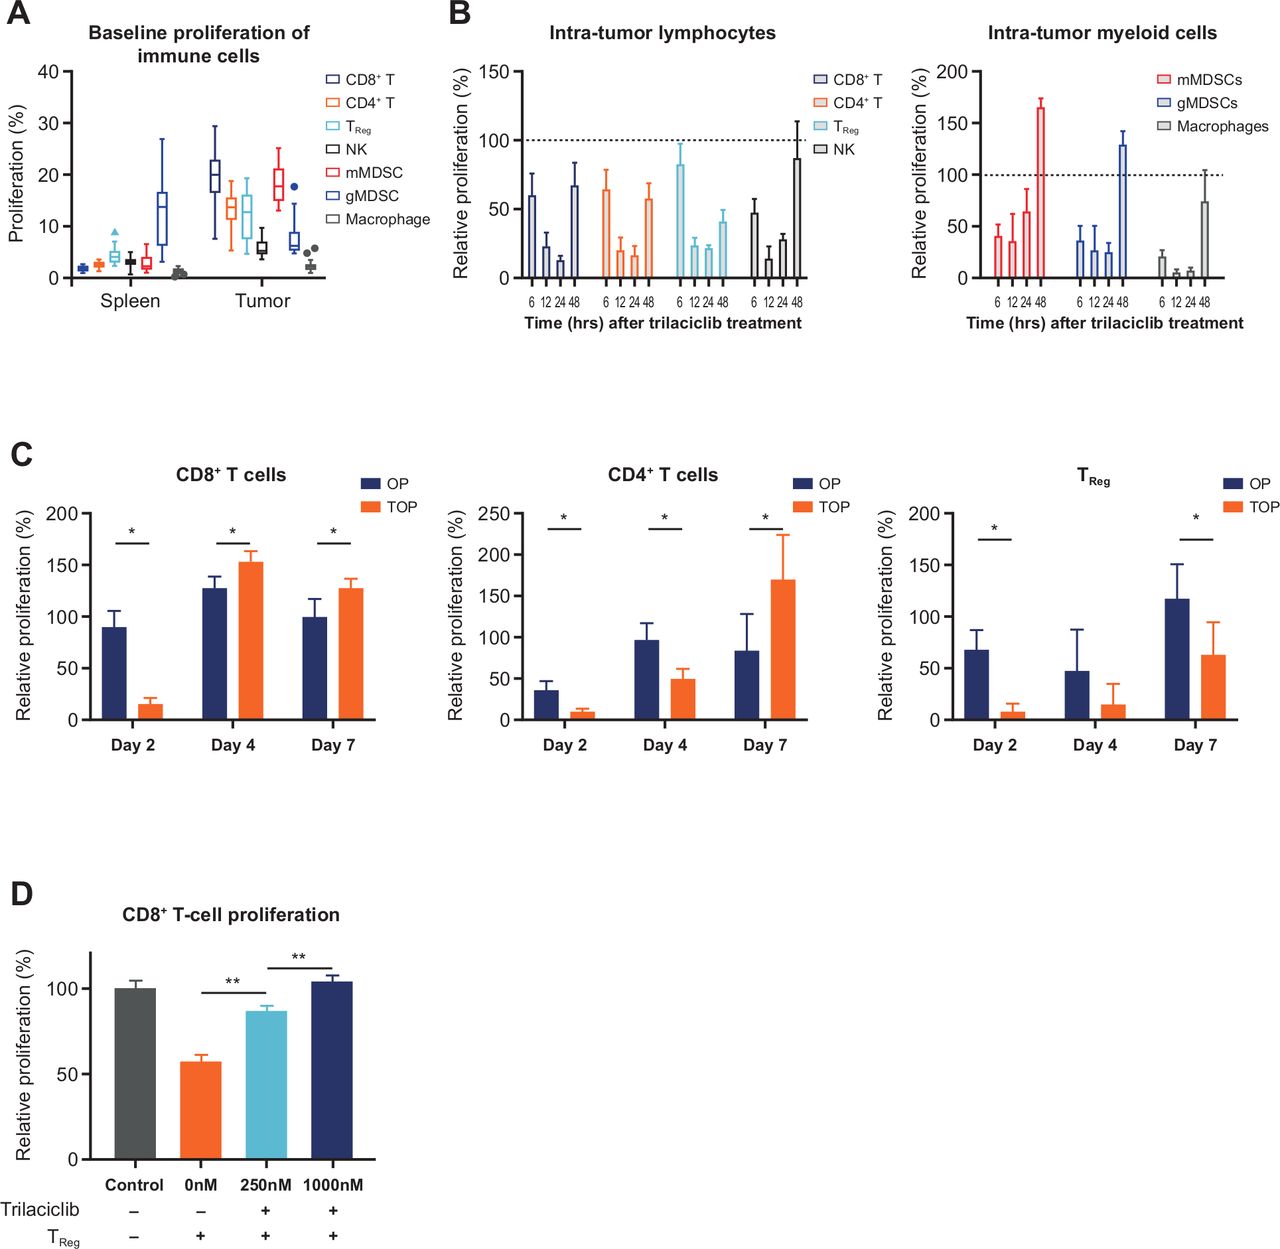
Addition of trilaciclib to OP treatment combination resulted in transient proliferation arrest followed by a faster recovery of CD8+ and CD4+ T cells compared with Tregs. (A) Baseline percent proliferation status of immune cell populations in spleen and tumors in MC38 tumor-bearing mice (n=16 biological replicates), and proliferation of intratumor lymphoid and myeloid immune cell types at (B) 6–24 hours (n=4 biological replicates) and (C) days 2, 4 and 7 (n=4 or 5 biological replicates) after trilaciclib treatment. Percent proliferation was defined as proportion of EdU+ cells, and relative proliferation was defined as (% EdU+ cells in trilaciclib-treated samples)/(% EdU+ cells in vehicle-treated samples) x 100. Each biological replicate consists of a pool of 3 animals. (D) Proliferation of CD8+ T cells in coculture with trilaciclib-treated Tregs (n=3 independent experiments, each performed with three biological replicates per culture condition). Data represent mean±SD. *p<0.05; **p<0.01. EdU, 5-ethynyl-2ʼ-deoxyuridine; gMDSC, granulocytic myeloid-derived suppressor cell; mMDSC, monocytic myeloid-derived suppressor cell; NK, natural killer; OP, oxaliplatin plus anti-programmed death-ligand-1; TOP, trilaciclib plus oxaliplatin and anti-programmed death-ligand-1; Treg, T-regulatory cell.
To further examine the effect of trilaciclib in modulating the proliferation of intratumor T cells when combined with chemotherapy and ICI, proliferation of T-cell subsets was analyzed at multiple time points after OP or TOP treatment in MC38 tumor-bearing mice (figure 2C). On day 2, 1 day after the first dose of combination treatment, proliferation of intratumor CD8+ T cells in TOP-treated animals decreased by 82.5%, while the proliferation status of intratumor CD8+ T cells in OP-treated animals remained unchanged compared with vehicle treatment (figure 2C). However, the proliferation of intratumor CD8+ T cells in the TOP group was quickly restored, resulting in a 20% increase in proliferating CD8+ T cells compared with the OP group on days 4 and 7, 3 days after the first and second doses of anti-PD-L1, respectively (figure 2C). While the recovery of cell proliferation in CD4+ T cells was initially slower than that of CD8+ T cells, the proportion of proliferating CD4+ T cells was twofold higher in TOP-treated versus OP-treated animals by day 7 (figure 2C). In contrast, transient G1 arrest of Tregs resulted in much slower recovery of proliferation in this cell population. On day 7, the proportion of EdU+ Tregs in TOP-treated animals was 46% lower than that of the OP group (figure 2C). To further understand the impact of each treatment on T-cell proliferation, rates of absolute proliferation of T-cell subsets were also analyzed (Lai et al. online supplemental figure S3). These results indicate that in the presence of chemotherapy and ICI combination treatment, trilaciclib transiently arrests all major intra-tumor T-cell subsets, with subsequent faster recovery and enhanced proliferation in CD8+ T and CD4+ T cells and slower recovery of Treg proliferation. The differences in proliferation and recovery result in an increased effector T cell to Treg ratio in the tumor microenvironment.
Supplemental material
In addition to the slower recovery of Treg proliferation, we further investigated whether CDK4/6 inhibition in Tregs affected their immunosuppressive function (online supplemental methods). A dose-dependent inhibition of Treg function was observed after trilaciclib treatment in vitro, as evidenced by an increase in CD8+ T-cell proliferation in the presence of trilaciclib pretreated Tregs compared with untreated Tregs (figure 2D). This result further indicates that trilaciclib can attenuate the proliferation and immunosuppressive properties of Tregs.
Transient G1 arrest alters the proportion of intratumor T-cell subsets favoring effector T-cell function
Because TOP treatment led to changes in the proliferation kinetics of T-cell subsets, we next investigated whether this perturbed the proportions of T-cell subsets within the MC38 tumor microenvironment. Both CD8+ T and CD4+ T-cell populations were similarly elevated after OP and TOP treatments (figure 3A; Lai et al. online supplemental figure S4), while CD11b+ myeloid cells comprised of mMDSC subsets and macrophages were similarly decreased in both treatment combinations (figure 3A; online supplemental figure S4A). In agreement with the effect of trilaciclib on Treg proliferation, the proportion of Tregs within total tumor immune infiltrates (CD45+ cells) was lower with TOP versus OP treatment on day 9 (figure 3A; online supplemental figure S4C). Moreover, the proportion of Tregs within CD4+ T cells was consistently lower in the TOP versus OP treatment groups at both time points (figure 3B). The ratio of intratumor CD8+ T to Tregs, as well as the proportion of T cells localized in the interior versus the periphery of tumor, also increased with TOP treatment (figure 3C; online supplemental figure S4C), although the difference was not significant on day 9. These data suggest that transient G1 arrest by trilaciclib altered the composition of intratumor T-cell subsets associated with reduced immunosuppression. In the spleen, the proportion of Tregs in CD4+ T cells and ratio of splenic CD8+ T cells to Tregs were similarly altered in TOP-treated compared with OP-treated animals on day 5 (figure 3B,C). Furthermore, both splenic CD8+ and CD4+ T cells had a higher proportion of cells expressing the activation marker CD69 (figure 3D; online supplemental figure S4B), suggesting that T-cell status in the peripheral compartment reflects the T-cell activity within the tumor microenvironment.
Supplemental material

Transient G1 arrest led to changes in the proportion of intratumor T-cell subsets favoring effector T-cell function. (A) Flow cytometric analysis of intratumor CD8+ T cells, CD4+ T cells, myeloid cell types (macrophages, mMDSC and gMDSC populations) and Tregs; (B) proportion of Treg in total tumor or spleen CD4+ T cells and (C) ratio of CD8+ T cells to Tregs (% CD8+ T cells/% Tregs) in the CD45+ population or spleen (n=5–8 tumors analyzed per treatment group and time point); and (D) proportion of activated (% CD69+) cells in CD8+ or CD4+ T cells. *P<0.05. gMDSC, granulocytic myeloid-derived suppressor cell; mMDSC, monocytic myeloid-derived suppressor cell; OP, oxaliplatin plus anti-programmed death-ligand-1; TOP, trilaciclib plus oxaliplatin and anti-programmed death-ligand-1; Treg, T-regulatory cell.
Trilaciclib in combination with chemotherapy and ICI enhances the gene signature associated with a cytotoxic antitumor response
To gain insight into whether modulation of T-cell subsets by trilaciclib enhanced effector T-cell function when combined with chemotherapy and ICI, whole tumor gene expression profile was compared between vehicle-treated, OP-treated and TOP-treated MC38 tumor-bearing mice on days 9 and 17, after two or three doses of chemotherapy, respectively. Compared with vehicle treatment, upregulated genes in both the OP and TOP groups were enriched for two immune-related pathways, including TCR signaling pathway and NK cell-mediated cytotoxicity on days 9 and 17 (online supplemental data file S1). While the expression level of most individual genes within the two enriched immune pathways was not significantly upregulated in the TOP versus OP groups, the mean expression level of genes within both pathways was significantly higher in tumors from TOP-treated versus OP-treated animals on day 17 (figure 4A,B). Importantly, the same set of genes within each pathway was also more highly expressed in tumors from animals treated with trilaciclib alone versus vehicle (figure 4A,B), further indicating the contribution of transient CDK4/6 inhibition by trilaciclib in augmenting antitumor gene expression signatures when combined with chemotherapy and ICIs.
Supplemental material
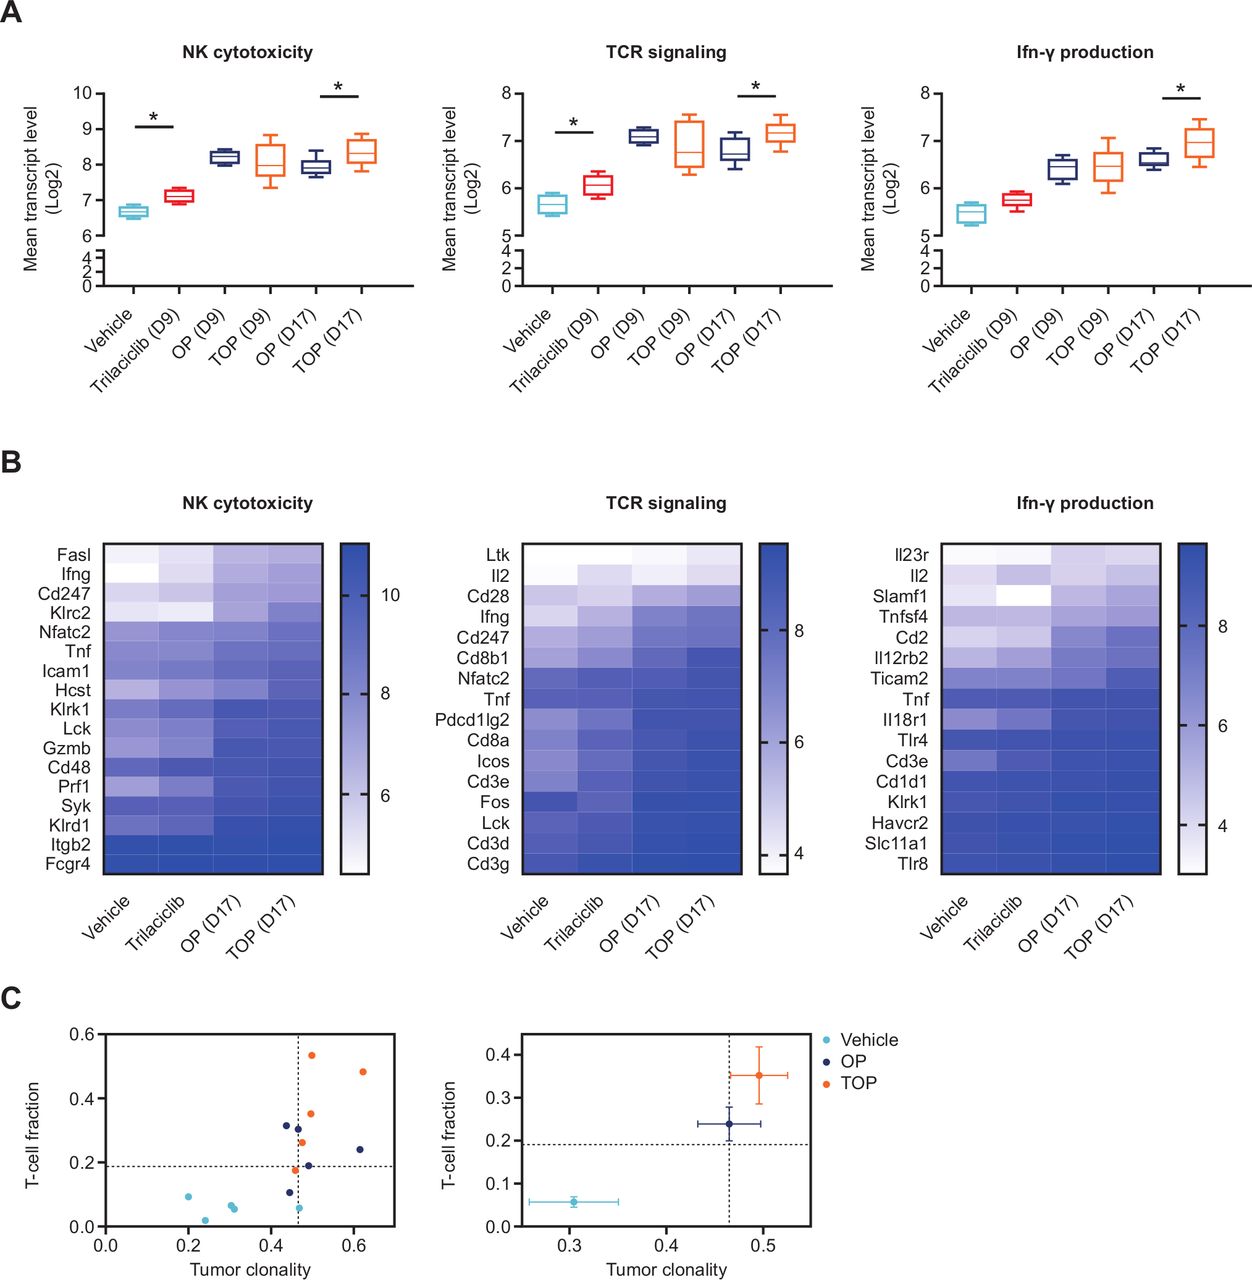
Trilaciclib in combination with chemotherapy and ICI enhanced the gene signature of cytotoxic antitumor response. (A) Between-group comparison of the geometric mean of log2-normalized transcript levels of genes upregulated in either OP or TOP versus vehicle associated with each KEGG pathway and (B) associated heat maps showing mean log2 transcript levels of each gene in the pathway; and (C) T-cell repertoire analyses of MC38 tumors from OP-treated or TOP-treated mice (n=5 per treatment group) on day 17, presented as either clonality score and proportion of T cells in tumor (T-cell fraction; left panel), or median clonality score and TIL fraction (right panel). Error bars denote SE, and dotted lines represent the median value for TIL fraction and clonality score. *P<0.05. For the heat map analyses, p<0.01 for comparison of the difference in gene expression levels in TOP versus OP and trilaciclib versus vehicle groups on day 17, for all three KEGG pathways. Tumor clonality was significantly higher for comparison of TOP versus vehicle (p=0.024), but not OP versus vehicle, while the TIL fraction was significantly elevated in both OP and TOP versus vehicle comparisons (p=0.006). ICI, immune checkpoint inhibitor; IFN, interferon; KEGG, Kyoto Encyclopedia of Genes and Genomes; NK, natural killer; OP, oxaliplatin plus anti-programmed death-ligand-1; TCR, T-cell receptor; TIL, tumor-infiltrating lymphocyte; TOP, trilaciclib plus oxaliplatin and anti-programmed death-ligand-1; Treg, T-regulatory cell.
The IFN-γ pathway is an important component of cytotoxic antitumor response shown to predict clinical response to PD-1 blockade.32 The GO term 'positive regulation of IFN-γ production' was enriched in tumors of TOP-treated but not OP-treated animals on day 17 (online supplemental data file S1). Accordingly, the average expression level of genes associated with this GO term was elevated in TOP-treated compared with OP-treated tumors on day 17 (figure 4A,B). In agreement with enhanced antitumor immunity gene signatures, T-cell repertoire analysis indicated that the addition of trilaciclib to OP treatment resulted in a higher proportion of intratumor T cells and TCR clonality (figure 4C), suggesting a more robust clonal expansion of T cells within tumors.33 Collectively, these results support the notion that transient CDK4/6 inhibition modulated the tumor microenvironment through changes in the proportion of T-cell subsets leading to enhanced effector T-cell function.
Addition of trilaciclib to chemotherapy preserves and enhances lymphocyte function in patients with SCLC
To assess the myelopreservation and immunomodulatory properties of trilaciclib in combination with chemotherapy in patients with SCLC, peripheral blood immunophenotyping was performed in patients from the E/P and T/E/P groups at various time points. Although the CD19+ B-cell population was significantly depleted by E/P, CD19+ B-cell numbers in the T/E/P group remained unchanged (figure 5A). Furthermore, while E/P treatment did not decrease the overall number of peripheral T cells, T/E/P treatment resulted in an increased number of total T cells (CD3+), CD4+ T cells and CD8+ T cells (figure 5A). Profile longitudinal analysis confirmed significantly decreased B-cell numbers in the E/P group but not the T/E/P group, and increased CD4+ and CD8+ T-cell numbers with T/E/P compared with E/P treatment over time (table 1).

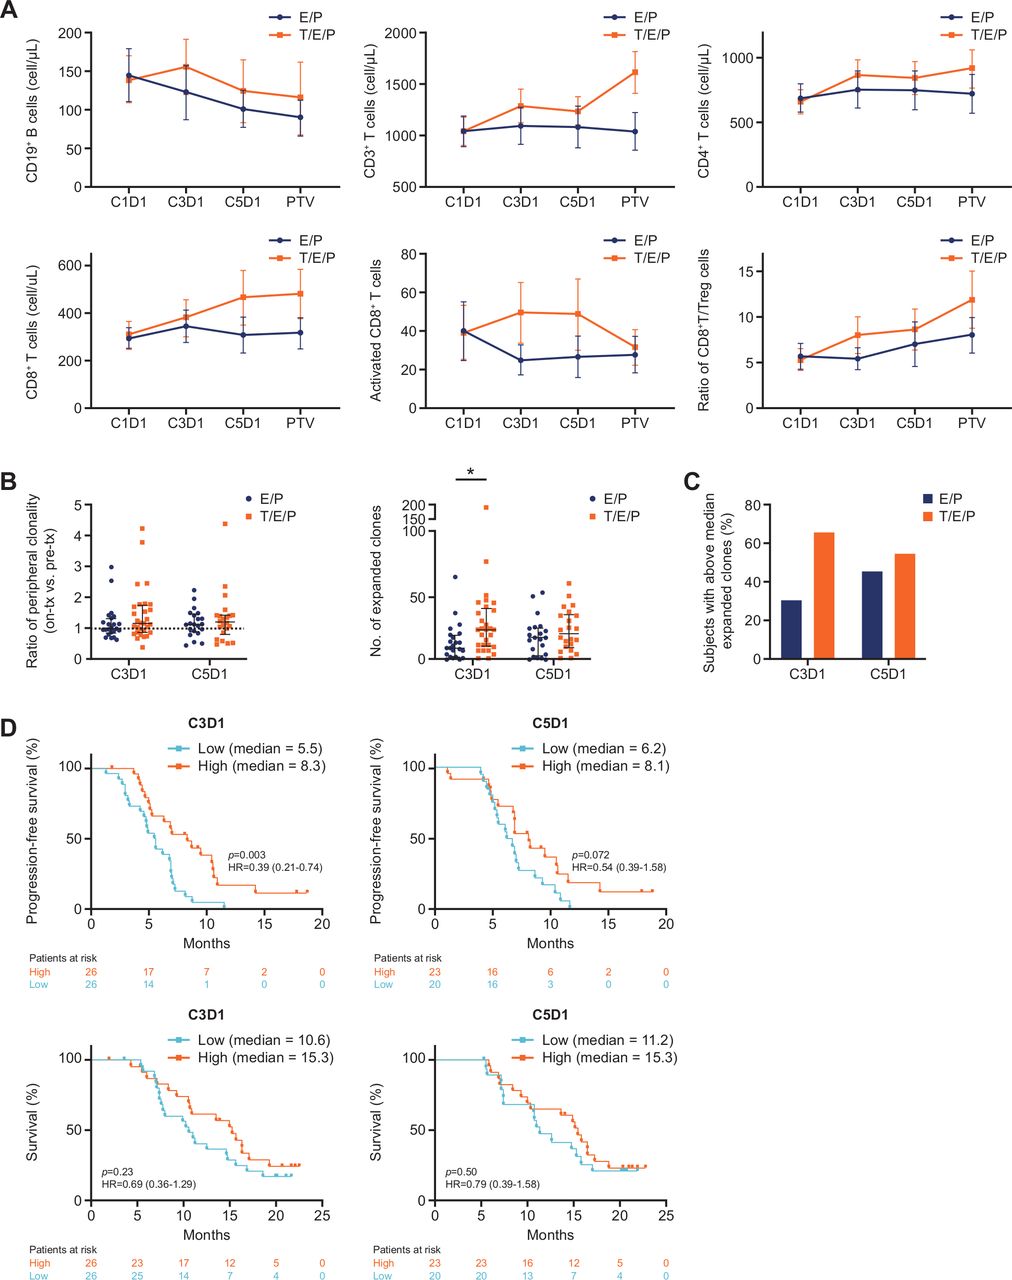
Addition of trilaciclib to E/P preserved and enhanced lymphocyte counts and function in patients with SCLC. (A) Mean absolute cell count (cells/µL) for B-cell and T-cell subsets and activated CD8+ T cells (CD3+CD8+CD38+HLA-DR+), and ratio of absolute whole blood cell counts for CD8+ T cells to Tregs (CD3+CD4+CD25+CD127low), at the indicated time points. Error bars represent 95% CIs. (B) Per-patient T-cell repertoire analysis comparing mean ratio of clonality versus pretreatment level (C1D1) and number of expanded T-cell clones at the indicated time points. Bars represent median and IQR. (C) Proportion of patients with high (≥median) number of expanded T-cell clones at C3D1 (≥15 clones) and C5D1 (≥17 clones). (D) Progression-free and overall survival analysis of all patients with low (<median) and high (≥median) numbers of expanded T-cell clones on C3D1 and C5D1. *P=0.0098. C1D1, cycle 1 day 1; C3D1, cycle 3 day 1; C5D1, cycle 5 day 1; D, day; E/P, etoposide and carboplatin; T/E/P, trilaciclib prior to etoposide and carboplatin; PTV, post-treatment visit; SCLC, small cell lung cancer; Treg, T-regulatory cell.
Functional evaluation of the T-cell subpopulations demonstrated that the trilaciclib group had a higher proportion of activated or effector CD8+ T cells (figure 5A; Lai et al. online supplemental figure S5), as well as activated or effector CD4+ T cells (online supplemental figure S5B and C). On stimulation, a higher proportion of CD8+ T cells produced IFN-γ in the T/E/P group compared with the E/P group (online supplemental figure S5D). Furthermore, the ratio of both CD8+ T cells to Tregs and activated CD8+ T cells to Tregs increased with T/E/P compared with E/P (figure 5A; online supplemental figure S5E). These results suggest that the addition of trilaciclib to chemotherapy at least preserved, if not enhanced, T-cell function during E/P treatment.
Supplemental material
While flow cytometry results demonstrated differential treatment effects on T-cell levels (figure 5A), the overall diversity of the TCR repertoire, measured by the clonality score, was not significantly altered by E/P versus T/E/P treatment (figure 5B). Patients receiving T/E/P treatment, however, exhibited an increased number of T-cell clones expanded when measured on C3D1 (after roughly 6 weeks of therapy (statistically significant)) and C5D1 (after roughly 15 weeks of therapy (not statistically significant)) when compared with patients treated with E/P (figure 5B). Increased clonal expansion in the T/E/P group was more pronounced at C3D1 (figure 5B), and a higher proportion of patients had above the median number of expanded clones with T/E/P compared with E/P (figure 5C). These data further support a role of trilaciclib in increasing the level of T-cell activation.
Regardless of treatment group, high levels of clonal expansion at C3D1 or C5D1 were associated with improved progression-free survival (PFS) and numerically longer median OS (figure 5D), suggesting a correlation between peripheral T-cell activation status and antitumor response. Comparison of PFS in patients with high clonal expansion in the T/E/P versus E/P groups indicated an additional improvement with trilaciclib (online supplemental figure S5F and G), pointing at a role for trilaciclib in mediating an enhanced antitumor response.
Discussion
While the combination of chemotherapy and ICIs is efficacious, and several chemotherapy/ICI regimens have recently gained US Food and Drug Administration approval, combination therapy results in significant hematologic toxicity and fails to achieve adequate benefit in many patients. Diminishing the myelosuppressive and immunosuppressive effects of chemotherapy has the potential to improve therapeutic benefit by simultaneously reducing toxicity and increasing efficacy. The latter may even offer the potential for improved outcomes of chemotherapy/ICI regimens in indications that do not currently benefit.
The addition of trilaciclib to multiple chemotherapy and ICI combinations in murine syngeneic tumor models enhanced antitumor response compared with chemotherapy and ICI combinations alone, in part by modulating the proliferation and composition of T-cell subsets in the tumor microenvironment. A schedule of 3 weekly doses of trilaciclib given 30 min before chemotherapy was sufficient to enhance and prolong the duration of the antitumor response. In contrast, efficacy of the anti-PD-L1 antibody in established tumors was not increased by continuous co-administration of trilaciclib in the absence of chemotherapy. We speculate that prolonged exposure to CDK4/6 inhibition can dampen the ability of tumor-specific T cells to exert their cytotoxic functions. It is also possible that chronic exposure to CDK4/6 inhibition could prevent the differentiation of effector T cells to memory T cells, as intratumor T cells are highly dependent on the CDK4/6 pathway for proliferation.
Given that T-cell proliferation is a critical component of an effective immune response and is highly sensitive to CDK4/6 inhibition,6 it is counterintuitive that cell cycle arrest in T cells could positively influence an antitumor immune response. In this study, we characterized a cell cycle-dependent effect of trilaciclib in modulating the composition of intratumor T-cell subsets and provided a plausible explanation of why transient T-cell proliferation arrest could be beneficial to an ongoing immune response. Following transient G1 arrest, there was a faster restoration of proliferative capacity in CD4+ and CD8+ T cells compared with a significantly slower rate of recovery of Treg proliferation, corresponding to a decreased proportion of Tregs in the tumor microenvironment and enhanced effector T-cell function. Consistent with the ability of trilaciclib to enhance or preserve effector T-cell function during exposure to chemotherapy, we have previously shown ex vivo stimulation of splenic T cells from animals treated with trilaciclib plus 5-FU resulted in the increased production of IFN-γ and IL-2 compared with 5-FU treatment alone.34 Further investigation is needed to determine whether trilaciclib-mediated G1 arrest results in Treg depletion or apoptosis, or if transient proliferative arrest leads to the differentiation of Tregs into effector CD4+ T cells. In the current study, intratumor T-cell populations were defined using CD4 and CD8 cell surface markers only. More detailed analysis of the effects of trilaciclib on T-cell subsets (eg, effector memory, central memory, activated effector T cells, exhausted T cells), through the incorporation of CD3 staining, as well as other cell surface markers specific to different subsets and activation/exhaustion status, may provide additional insights into how transient trilaciclib treatment might enhance antitumor response.
Consistent with increased effector T-cell function in the tumor microenvironment, we observed elevated proportions of activated CD4+ and CD8+ T cells and a high ratio of CD8+ T cells to Tregs in the spleens of tumor-bearing animals after treatment with TOP versus OP combinations. This suggests that the activation status and composition of T cells in the peripheral compartment may be indicative of changes within the tumor microenvironment.35 36 In agreement with these preclinical observations, patients with SCLC who received trilaciclib with chemotherapy showed an increase in number of T cells and the proportion of activated CD8+ T cells in peripheral blood, and had increased T-cell clonal expansion relative to patients who did not receive trilaciclib with chemotherapy. The more pronounced T-cell clonal expansion at C3D1 in the trilaciclib group is consistent with more robust T-cell proliferation previously observed at earlier time points with immunotherapy.35 37
While trilaciclib did not significantly improve PFS (hazard ratio 0.7; p=0.1695) or OS (hazard ratio 0.87; p=0.6107) when added to E/P, the study was not powered to show such an effect.3 However, there are several notable observations providing indirect clinical evidence that trilaciclib may enhance immune-mediated antitumor response through mechanisms demonstrated in preclinical models. Because SCLC is predominately deficient in the retinoblastoma gene and protein function and therefore CDK4/6 independent,38 the positive trend in PFS is not expected to be mediated by direct cell cycle effects on the tumor cells, but rather through effects on immune cells within the tumor microenvironment, as shown in the MC38 model. Peripheral blood immunophenotyping and clonal expansion provides support that trilaciclib can enhance immune function in patients. While tumor tissue was not available for evaluation in patients with SCLC, the congruence between trilaciclib’s effects on immune activation within the tumor and periphery of preclinical models and the peripheral blood of patients supports the hypothesis that trilaciclib can enhance immune activation within the tumors of patients with SCLC. Finally, while patients with above the median clonal expansion had a longer PFS and trended toward longer OS regardless of treatment group, the observation that patients receiving trilaciclib with a high number of expanded clones may have additional PFS benefits may also reflect the effects of trilaciclib on the immune cells within the tumor microenvironment.39 While these observations are thought provoking, tumor tissue and/or larger studies will be needed to confirm these hypotheses in patients.
The more robust immune status in T/E/P patients suggests that trilaciclib has the potential to enhance the efficacy of chemotherapy and ICI combinations in tumors that are sensitive to ICIs. While SCLC has a high degree of genomic instability and a smoking-associated mutational profile, the low expression of major histocompatibility complex class I and class II suggests that it will be recalcitrant to immuno-oncology therapeutic approaches,40 which is supported by a number of underwhelming clinical trials.41 Trilaciclib has been tested in combination with E/P/atezolizumab for the first-line treatment of patients with SCLC.42 Similar to the results shown here, trilaciclib treatment enhanced T-cell immune response as measured by peripheral blood immunophenotyping and T-cell clonal expansion, but failed to significantly improve PFS or OS. In contrast, the addition of trilaciclib to chemotherapy improved OS in mTNBC,4 a tumor type with an immune landscape more amenable to ICI therapy.15 43 While preclinical and correlative data from patients with SCLC have demonstrated that trilaciclib can enhance T-cell activity, direct mechanistic evidence to explain the improved OS results in mTNBC is still needed.4
Given the clinical proof-of-concept findings that trilaciclib can reduce chemotherapy-induced multi-lineage myelosuppression in patients with SCLC,3 improve OS when added to chemotherapy in patients with mTNBC4 and enhance antitumor response and survival in preclinical models when added to chemotherapy and ICI combinations, further clinical exploration of trilaciclib plus chemotherapy or chemotherapy/ICI combinations in tumors that are sensitive to immunotherapies is warranted.
Acknowledgments
We thank Shannon Morris, Janet Horton, Daniel Freed, Kerry Dillon, John Bisi and Yili Pritchett (G1 Therapeutics, Inc.) for scientific input and review of the manuscript. We also thank Rachel Gittelman (Adaptive Biotechnologies) for assistance in TCR data analysis. This study was funded by G1 Therapeutics, Inc.
References
Footnotes
Twitter @teekayowo
AYL and JAS contributed equally.
Contributors AYL, JAS and PJR conceived and designed the study. PJR supervised the study. AYL and JAS performed the preclinical experiments and managed the analyses of clinical samples. AYL, JAS, JMW, KHD, PJR, RKM and TKO contributed to the design and implementation of the clinical research. AYL, JAS, JH, JMW, KHD and TKO were responsible for the acquisition of data. All authors were responsible for the analysis and interpretation of results. AYL, JAS and PJR wrote the manuscript. All authors provided critical feedback and helped shape the research, analysis, and development of the manuscript. All authors read and approved the final manuscript.
Funding This study was funded by G1 Therapeutics.
Competing interests AYL, PJR, ZY and JCS were employees of G1 Therapeutics at the time of the study. AYL is an employee of Locus Biosciences. PJR and JCS are employees of Arc Therapeutics. ZY is an employee of Everest Clinical Research. JAS and RKM are employees of G1 Therapeutics. JAR was an employee of Adaptive Biotechnologies at the time of the study. JH is an employee of and has a financial interest in Adaptive Biotechnologies. JMW has received honorarium from G1 Therapeutics. JMW, KHD and TKO received research funding from G1 Therapeutics (to their institution).
Patient consent for publication Not required.
Ethics approval As previously reported, the phase 1b/2 trial in patients with SCLC (NCT02499770) was designed and conducted in compliance with the principles of the Declaration of Helsinki and the Good Clinical Practice guidelines of the International Council for Harmonisation. The study protocol and all study-related materials were approved by the institutional review board or independent ethics committee of each investigational site.
Provenance and peer review Not commissioned; externally peer reviewed.
Data availability statement All data relevant to the study are included in the article or uploaded as online supplemental information.