Article Text

Abstract
Background Neutrophils have been reported to have protumor, antitumor or neutral effects in cancer progression. The underlying causes for this functional variability are not clear.
Methods We studied the role of neutrophils in six different mouse tumor models by intratumoral injection of antimicrobial peptides or vaccination. Changes in systemic and intratumoral immune cells were analyzed by flow-cytometry and mass-cytometry. The role of neutrophils was studied by antibody-mediated neutrophil depletion. Neutrophils from different mouse strains were compared by RNA sequencing.
Results The antimicrobial peptide Omiganan reduced the growth of TC-1 tumors in BL/6 mice and CT26 tumors in BALB/c mice. No significant effects were observed in B16F10, MC38 and 4T1 tumors. Growth delay was associated with increased abundance of neutrophils in TC-1 but not CT26 tumors. Systemic neutrophil depletion abrogated Omiganan efficacy in TC-1 but further reduced growth of CT26, indicating that neutrophils were required for the antitumor effect in TC-1 but suppressed tumor control in CT26. Neutrophils were also required for a therapeutic vaccine-induced T-cell mediated control of RMA tumors in BL/6 mice. Clearly, the circulating and intratumoral neutrophils differed in the expression of Ly6G and CD62L, between TC-1 and CT26 and between blood neutrophils of tumor-naïve BL/6 and BALB/c mice. RNA-sequencing revealed that neutrophils from BL/6 mice but not BALB/c mice displayed a robust profile of immune activation, matching their opposing roles in TC-1 and RMA versus CT26.
Conclusions Neutrophil functionality differs strongly between mouse strains and tumor types, with consequences for tumor progression and therapy.
- tumor microenvironment
- immunity
- innate
- immune evation
- immunotherapy
- gene expression profiling
This is an open access article distributed in accordance with the Creative Commons Attribution Non Commercial (CC BY-NC 4.0) license, which permits others to distribute, remix, adapt, build upon this work non-commercially, and license their derivative works on different terms, provided the original work is properly cited, appropriate credit is given, any changes made indicated, and the use is non-commercial. See http://creativecommons.org/licenses/by-nc/4.0/.
Statistics from Altmetric.com
Background
Neutrophils are an essential part of the innate immune system and form the hallmark of acute inflammation as they are often among the first responders to reach the site of inflammation.1 The classical effector mechanism of neutrophils is based on their high phagocytic capacity and the production of granules containing effector molecules that assist in target killing. In addition, neutrophils contain extracellular effector mechanisms, including the secretion of neutrophil extracellular traps (NETs) and antimicrobial peptides (AMPs), and can influence their immune microenvironment by producing inflammatory mediators such as cytokines and chemokines.2 The classical view that neutrophils are very short-lived effector cells has been challenged by recent literature showing that neutrophils can survive for days under the right conditions.3
Cancer, often termed a chronic inflammation, is a good example of how neutrophil responses can be modulated. Neutrophilia is observed in many patients with cancer, based on tumor-derived factors driving the excessive release of neutrophils from the bone marrow, which also have a strongly increased lifespan.3 These cancer-related neutrophils typically have an immature phenotype, associated with a banded non-segmented nucleus and a lower density than mature neutrophils.4 Besides nuclear segmentation and cellular density, several cell surface markers including Ly6G and CD62L have been linked to neutrophil maturation and aging, which could be used for antibody-based cell sorting for downstream assays and analyses to interpret neutrophil responses.5 6 Immature neutrophils in cancer are classically associated with the suppression of antitumor immune responses, based on which they are also commonly referred to as granulocytic or polymorphonuclear myeloid-derived suppressor cells (gMDSCs/PMN-MDSCs).7 However, recent studies on the role of neutrophils in tumor growth and cancer therapy have suggested that neutrophils may not only be important immunosuppressive protumor agents8 9 but can also be essential for T cell-mediated tumor cell killing.1 8 10 A functional classification of neutrophils into inflammatory versus suppressive cells has been proposed along the lines of the frequently used M1/M2 classification of macrophages, and it was suggested that neutrophils can be therapeutically skewed towards an antitumor role.11 In addition to functional variation in neutrophils within the same individual, there may also be intrinsic differences between individual humans and between experimental animal models used to study the role of neutrophils in tumors. In this study, we used AMPs or therapeutic peptide vaccines to study the role of neutrophils in six different mouse tumor models growing in the BL/6 or BALB/c mouse strains and for which a varying role for neutrophils on tumor progression has been described.12–16
AMPs are important mediators in innate host defense against pathogens, are often neutrophil-derived and have been described to mediate their antimicrobial function both by direct pathogen killing and by influencing the functionality of immune cells.17 18 For instance, AMPs can chemoattract neutrophils and monocytes, induce their production of reactive oxygen species (ROS) and cytokines and inhibit neutrophil apoptosis.19–22 AMPs have been proposed as a therapeutic option for cancer as these peptides may directly kill tumor cells and improve immune responses against tumors.23 24 Here, we study the role of neutrophils in a range of mouse tumor models using the AMPs LL-37 and Omiganan. LL-37 is a commonly used human AMP, whereas Omiganan is an analog of the bovine neutrophil-derived peptide Indolicidin and is currently undergoing clinical testing for a range of conditions.25 26 We found that the growth of two tumors, each in a different mouse strain, is reduced by Omiganan, but not by LL-37. In one mouse strain, tumor growth was controlled by Omiganan-stimulated neutrophils whereas in another mouse strain, tumor growth control was impaired by neutrophils. Tumor growth control by neutrophils was also a requirement in a setting of T-cell based immunotherapy. RNA-sequencing revealed that the opposed functional profile of neutrophils between the tumor models is an intrinsic genetic characteristic of the mouse strain used. The striking differences between neutrophils in different tumors and strains of mice may explain the opposing findings on the role of neutrophils in cancer treatment and suggests that further research linking neutrophil phenotype to functionality is required to improve the efficacy of cancer treatment.
Methods
Mice and tumor cell lines
The background and use of mice and cell lines is described in detail in the online supplemental methods. All mouse experiments were controlled by the animal welfare committee (IvD) of the Leiden University Medical Center and approved by the Dutch national central committee of animal experiments (CCD) under permit number AVD116002015271, in accordance with the Dutch Act on Animal Experimentation and EU Directive 2010/63/EU.
Supplemental material
Antimicrobial peptides
Omiganan (amino acid sequence ILRWPWWPWRRK) is a variant of the bovine AMP Indolicidin and was provided by Cutanea Life Sciences (Wayne, PA, USA). The human peptide LL-37 was used in a shortened form of 22 amino acids (EKIGKEFKRIVQRIKDFLRNLV) that was shown to have comparable functionality as full-length LL-37.27 A weight control peptide (YHFEDHGKQTEQTY) was manually designed to have comparable molecular weight to Omiganan, but without arginine (R) and tryptophan (W) residues and with no net charge. The LL-37 variant and the weight control peptide were produced by and ordered from JPT Peptide Technologies (Germany). Lyophilized peptides were dissolved in sterile demineralized water at a concentration of 20 mM and stored at −80 degrees Celsius until use.
Tumor treatment
AMP treatment was started when solid subcutaneous tumors had established at a tumor size of 100 mm3, which was on day 6 after tumor inoculation for MC38 tumors and on days 8–10 for the other tumor models. Peptides were administered intratumorally in mice anesthetized by isoflurane inhalation by injecting 30 nmole of peptide dissolved in 30 µL phosphate-buffered saline (PBS), or an identical volume of PBS as empty vehicle control. This treatment was repeated every 2 days, using an identical dose administered in a larger volume for proper coverage of the larger tumors. In vitro Omiganan toxicity to tumor cell lines was assessed by overnight incubation of adhered tumor cells with a dose range of Omiganan, followed by flow cytometry analysis of tumor cell death using the cell viability dye 7-AAD. RMA-Qa1-/- tumors were treated with peptide vaccination containing 50 nmol of the Gag-encoded CD8 T cell epitope CCLCLTVFL, 20 nmol of the Murine Leukemia virus Env-encoded CD4 T cell epitope EPLTSLTPRCNTAWNRLKL and 20 µg CpG in 50 uL PBS on day 10, injected s.c. in the tail-base.28
Flow cytometry
For analysis of the tumor microenvironment, tumor-bearing mice were sacrificed and cardially perfused with 20 mL of PBS/EDTA (2 mM) to eliminate blood contamination of tumor material. Tumors were minced, incubated with 2.5 mg/mL Liberase TL (Roche) for 20 min at 37°C and single-cell suspensions were made using 70 µm cell strainers (BD Biosciences). Mouse Fc-Receptors were blocked with anti-mouse CD16/32 (clone 2.4G2) and 10% naïve mouse serum before antibody staining. Cells were then stained using combinations of antibodies against mouse CD45.2 (clone 104), CD11b (clone M1/70), CD11c (clone HL3), Ly6C (clone HK1.4), Ly6G (clone 1A8), F4-80 (clone BM8), Siglec-F (clone E50-2440), iNOS (clone CXNFT), CD62L (clone MEL14), Gr-1 (clone RB6-8C5), CD3e (clone 17A2 and 145–2 C11), CD4 (clone RM4-5), CD8a (clone 53–6.7) and NK1.1 (clone PK136). 7-AAD or Fixable viability Aqua were used as viability dyes, and CD19 staining (clone 1D3) was included to ensure that no circulating blood was left in the sample. For measurements of blood neutrophils, blood was taken from the tail vein, red blood cells were removed with erythrocyte lysis buffer and samples were stained as described above. Samples were acquired on an LSR-II cytometer (BD) and analyzed using FlowJo software (Tree Star). All data are presented as a percentage of total CD45+ cells after exclusion of dead cells and doublets.
Mass cytometry (CyTOF)
Single cell suspensions of mouse tumors were prepared identically as for flow cytometry, as described above. In addition, debris and aggregates were removed using a 100%/60%/40%/30% layered gradient of Percoll (GE HealthCare) in RPMI 1640 (Lonza), resuspending pelleted single cells in the 40% fraction. This procedure did not skew the abundance of immune cells subsets as assessed by flow cytometry of the same tumor samples with and without using the Percoll gradient (data not shown). Maximally, 3 million cells were then taken for antibody staining. The list of cytometry by time-of-flight (CyTOF) antibodies is provided in online supplemental table S1. Metal-conjugated antibodies were purchased from Fluidigm Sciences, other antibodies were conjugated in-house using the MaxPar X8 antibody labeling Kit (Fluidigm Sciences) and stored in Antibody Stabilization Buffer (Candor Bioscience GmbH). Staining was performed as described in detail elsewhere.29 All reagents were purchased from Fluidigm Sciences unless stated otherwise. In short, samples were incubated with 1 µM Cell-ID intercalator-103Rh to identify dead cells, followed by blockage of mouse Fc-Receptors using anti-mouse CD16/32 (clone 2.4G2, BD Biosciences). Then, the metal-conjugated antibody mix was added, and cells were incubated overnight with 125 nM Cell-ID Intercalator-Ir in MaxPar Fix and Perm. Immediately prior to acquisition on a Helios mass cytometer (Fluidigm), samples were centrifuged and resuspended in MilliQ. Data were normalized using EQ Four Element Calibration Beads with the reference EQ passport P13H2302. Data analysis was performed by pregating live singlet CD45+ cells using FlowJo software (Tree Star), followed by non-supervised clustering based using the hierarchical t-distributed stochastic neighbor embedding (hSNE) function of Cytosplore. hSNE density plots were created for all combined samples and for PBS-treated and Omiganan-treated samples separately. Myeloid cell subsets were linked to clusters based on the marker expression pattern. Cytosplore output data were then used in the postclustering R-based analysis and visualization tool Cytofast.30
Supplemental material
Neutrophil depletion
Neutrophils were depleted by intraperitoneal injection of 100 µg anti-mouse Ly6G (clone 1A8, BioXCell InVivoPlus) in 200 µL PBS, and additional injections of 50 µg were given on the same days as the consecutive Omiganan treatments. Neutrophil depletion was assessed by harvesting tumors or blood samples and staining for flow cytometry as explained above, using a gating strategy based on the surface markers Ly6C and Gr-1.
RNA sequencing
Bulk RNA-sequencing (RNA-seq) was performed as described in the online supplemental methods. In short, neutrophils were isolated from the femoral bone marrow of TC-1 and CT26 tumor-bearing mice or naïve control mice by positive magnetic selection for Ly6G as described above, yielding a neutrophil purity of 94%–96%. RNA was extracted from purified neutrophils using the Macherey-Nagel NucleoSpin RNA Plus kit according to the manufacturer’s protocol. Bulk RNA sequencing was performed by GenomeScan (Leiden, the Netherlands) and bioinformatics analysis was performed by the Sequencing Analysis Support Core of Leiden University Medical Center, the Netherlands. The online tool iDEP90 was used to create gene expression heatmaps (http://bioinformatics.sdstate.edu/idep).31 Gene sets enriched for genes differentially expressed (p<0.05) between two experimental groups were identified using the online tool Metascape (http://metascape.org),32 and upstream mediators were predicted by Ingenuity Pathway Analysis (IPA) software. Detailed RNA-sequencing data (differential gene expression, gene networks and upstream regulators) are available on request to the corresponding author.
Statistics
All in vivo and ex vivo data are presented as mean and SEM unless stated otherwise. Statistical comparison of two groups was performed using an unpaired two-tailed Student’s t test. Comparison of >2 groups was performed using a one-way ANOVA in case of one variable, and a two-way ANOVA was performed when >1 variable was used in the analysis. A minimum of three biological replicates was used in all experiments, as specified in figure legends. Differences were considered statistically significant at p<0.05.
Results
The antimicrobial peptide Omiganan inhibits growth of mouse tumors
To investigate the possible antitumor effect of AMPs, we treated established subcutaneous mouse tumors by repeated intratumoral injections of AMPs. We used an analog of the bovine neutrophil-derived peptide Indolicidin, called Omiganan, and a short functional variant of the widely used human peptide LL-37.27 Intratumoral injection of Omiganan significantly reduced the growth of TC-1 tumors, a commonly used model for cervical cancer, whereas LL-37 treatment had no effect (figure 1A). As Omiganan is rich in the amino acids arginine (R) and tryptophan (W), essential for its antimicrobial activity,33 we designed a control peptide of comparable weight to Omiganan but with neutral charge and lacking these two amino acids (“weight control peptide”). TC-1 tumors injected with this control peptide grew significantly faster than Omiganan-treated tumors, indicating that arginine and tryptophan may be essential for the antitumor effect of Omiganan (figure 1B). Next, we tested whether Omiganan also reduced growth of other mouse tumors, by treating four additional mouse tumors (B16F10 melanoma, MC38 and CT26 colon carcinomas and 4T1 mammary carcinoma), growing in two different mouse strains, BL/6 and BALB/c. Intratumoral Omiganan treatment reduced the growth of CT26 tumors in BALB/c mice with comparable efficacy as for TC-1 tumors in BL/6 mice, but failed to significantly affect the growth of MC38, B16F10 and 4T1 tumors (figure 2). Importantly, Omiganan could directly induce tumor cell lysis in vitro but only at very high concentrations (100 µM), and the sensitive tumors TC-1 and CT26 were killed in a similar dose-toxicity pattern as the insensitive tumor MC38, suggesting that a direct tumoricidal effect of Omiganan is not key to the differential therapeutic capacity in vivo (online supplemental figure S1). Together, these data indicate that the AMP Omiganan is capable of tumor growth inhibition but that its efficacy differs between tumor models.
Supplemental material
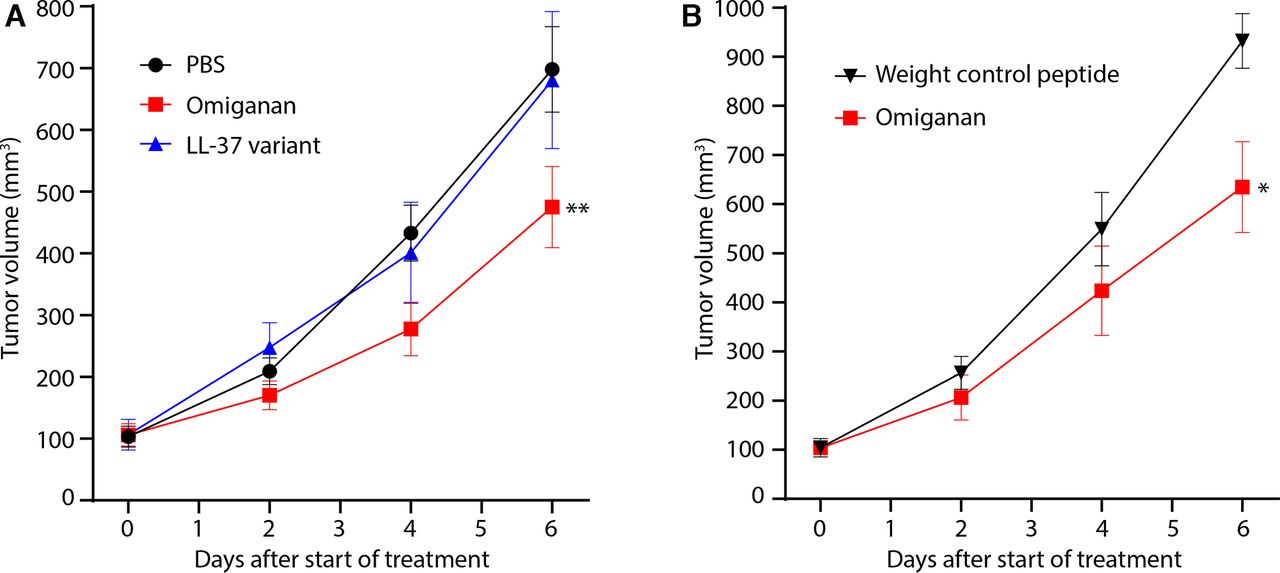
The antimicrobial peptide Omiganan inhibits TC-1 tumor growth. (a) Growth curves of TC-1 tumors treated with antimicrobial peptides. Established subcutaneous tumors were injected intratumorally with Omiganan, a shortened 22-amino acid version of LL-37 (LL-37 variant) or empty vehicle (PBS) on day 0, 2 and 4 of the experiment. n=10–12 mice per group. (b) Growth curves of TC-1 tumors treated by intratumoral injection of Omiganan or a weight control peptide on day 0, 2 and 4 of the experiment, n=5 mice per group. Statistical tests for differences in tumor growth were performed at day 6, using a one-way ANOVA for (A) and Student’s t test for (B), *p<0.05; **p<0.01. ANOVA, analysis of variance; PBS, phosphate-buffered saline.

Effect of Omiganan on tumor growth of different mouse tumors. (A–E) Growth curves of established subcutaneous TC-1, B16F10, MC38, CT26 and 4T1 tumors injected intratumorally with Omiganan or empty vehicle (PBS) on days 0, 2 and 4 of the experiment. TC-1, B16F10 and MC38 tumors grow in BL/6 mice, and CT26 and 4T1 tumors grow in Balb/c mice, n=14 mice per group. Statistical tests were performed at the final timepoint day 6, using a Student’s t test, *p<0.05. n.s., not significant; PBS, phosphate-buffered saline.
Omiganan induces changes in different innate immune cell subsets within the immune microenvironment
To test whether the differential therapeutic efficacy of Omiganan in the five tumor models correlated to a specific immune contexture in these tumors, we analyzed immune cell subsets by flow-cytometry and mass-cytometry. As AMPs have been described to recruit and alter myeloid cells, we mainly focused on these innate immune cells with extensive plasticity. Tumor-bearing mice were treated with Omiganan or saline (PBS) and tumor infiltrating myeloid cells were first quantified by flow cytometry. Figure 3A shows the gating strategy for myeloid cells using the surface markers CD45, CD11b, Ly6C and Ly6G, distinguishing neutrophils (Ly6G+Ly6Cint) from Ly6Clo and Ly6Chi myeloid cell subsets. The macrophage marker F4/80 was not expressed on neutrophils, whereas the non-neutrophilic Ly6Clo and Ly6Chi subsets do express varying extents of F4/80 (online supplemental figure S2a). In TC-1 tumors, Omiganan induced a strong increase in the proportion of intratumoral Ly6G+ neutrophils (figure 3B). In contrast, administration of LL-37 and the weight control peptide did not lead to an increase of neutrophil numbers in the TC-1 microenvironment (online supplemental figure S2b). Treatment of B16F10 and MC38 tumors that share their BL/6 background with TC-1 tumors resulted in minimal intratumoral immune cell changes (figure 3C,D). Strikingly, the Omiganan-sensitive tumor CT26 showed a strong increase in Ly6Chi cells after treatment, but the frequency of Ly6G+ neutrophils did not change (figure 3E). In parallel with the Omiganan-insensitive tumors B16F10 and MC38, the composition of immune cell infiltrate of 4T1 tumors was not affected (figure 3F). Of note, Omiganan did not significantly affect T cell frequencies in TC-1 and CT26 tumors (online supplemental figure S2c). These data demonstrate that tumor growth inhibition by Omiganan correlates with an altered tumor innate immune microenvironment.
Supplemental material

Omiganan skews the myeloid immune microenvironment of mouse tumors. Mice with established subcutaneous tumors were injected intratumorally with Omiganan or empty vehicle (PBS) on days 0, 2 and 4 of the experiment, followed by ex vivo flow cytometry analysis of intratumoral immune cells on day 6, n=5–11 mice per group. (A) Basic gating strategy for intratumoral myeloid cells. CD11b+ myeloid cells were gated from total CD45+ immune cells and further divided into Ly6G+, Ly6Clo and Ly6Chi cells. (B–F) Bar graphs depicting abundance of myeloid immune subsets in TC-1, CT26, MC38, B16F10 and 4T1 tumors, respectively, expressed as percentage among total CD45+ immune infiltrate. Distinguished subsets are total myeloid cells (CD11b+), macrophage-like cells (CD11b+ Ly6Clo), monocyte-like cells (CD11b+ Ly6Chi) and neutrophils (CD11b+ Ly6G+). Statistical significance in abundance between PBS-treated and Omiganan-treated tumors was determined using a Student’s t test, *, p<0.05; **p<0.01; ***p<0.001. PBS, phosphate-buffered saline.
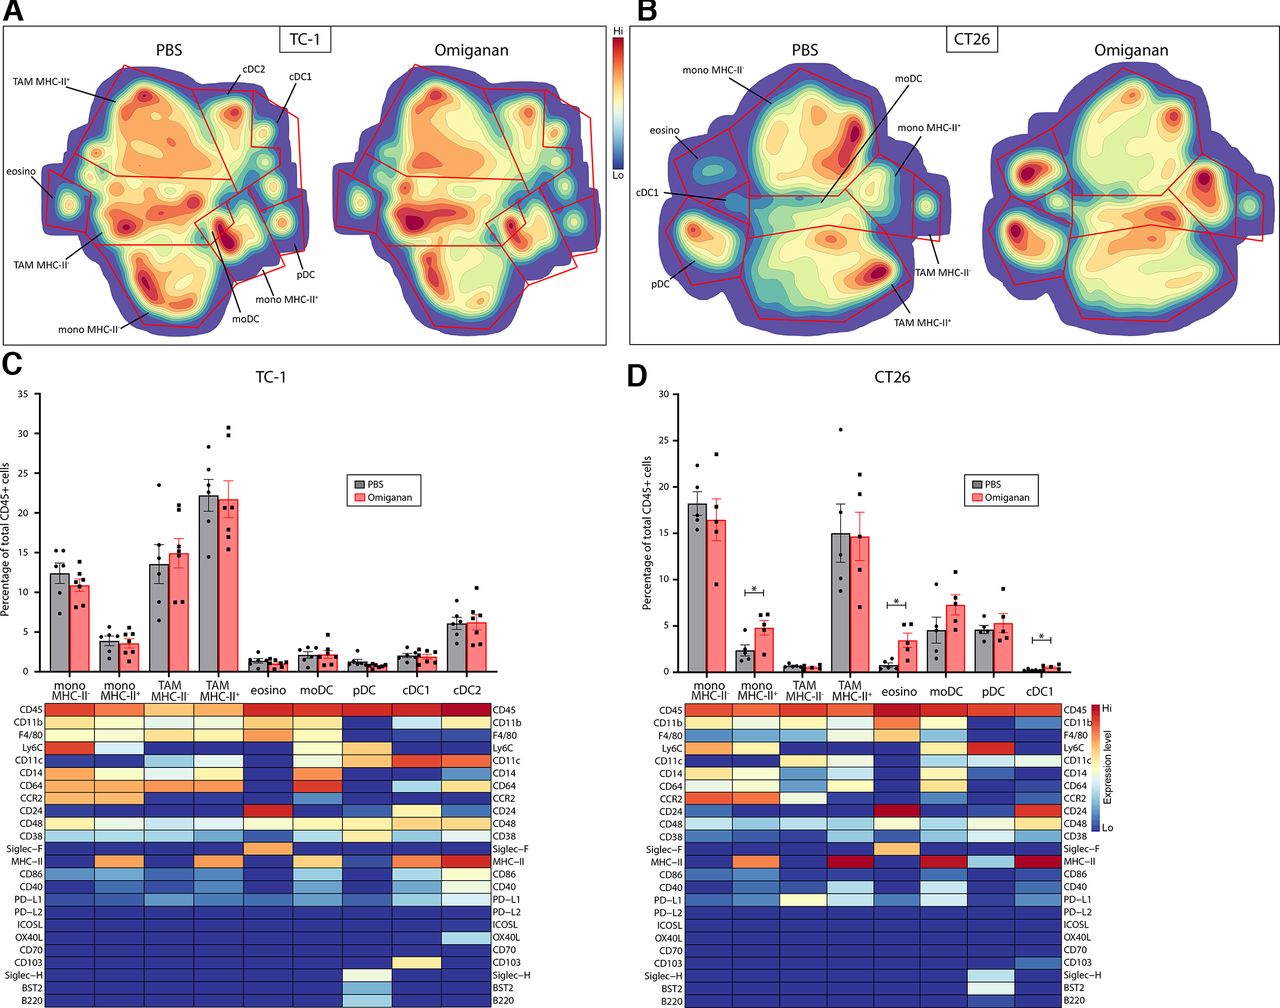
Whereas the Ly6G+Ly6Cint phenotype unequivocally identifies neutrophils in ex vivo flow cytometry, the use of the markers CD11b, Ly6C and F4/80 does not adequately distinguish other myeloid cell lineages and subsets. Therefore, we performed mass cytometry (CyTOF) analysis of Omiganan-treated TC-1 and CT26 tumors using a broad palette of over 25 cell surface markers delineating most myeloid cell types, including eosinophils, monocyte subsets, macrophage subsets, plasmacytoid dendritic cells and conventional dendritic cells (online supplemental table S1). Non-supervised clustering of cells was performed by hSNE analysis using CytoSplore software, resulting in a t-distributed stochastic neighbor embedding (tSNE) plot in which cells are clustered based on similarity in marker expression. The expression level of each marker throughout the tSNE plot is shown in online supplemental figure S3. Myeloid immune subsets were classified from these clusters based on expression profiles reported in literature and are depicted in density tSNE plots to visualize the Omiganan-induced differences (figure 4A,B).7 34–37 Besides the abovementioned increase in neutrophil numbers, no significant additional changes in the myeloid cell composition of TC-1 tumors were observed by CyTOF (figure 4C). Interestingly, CT26 tumors showed a subtle enhancement of infiltrating conventional DC (CD103+), a significantly increased frequency of MHC class II-positive monocytes (CCR2+) and a strong increase of eosinophils (Siglec-F+), in line with the described function of AMPs (figure 4D).
Supplemental material

High-dimensional mass cytometry analysis of myeloid cells in Omiganan-treated tumors. Mice bearing TC-1 or CT26 tumors were injected intratumorally with Omiganan or empty vehicle (PBS) on day 0, 2 and 4 of the experiment, followed by mass cytometry analysis of intratumoral immune cells on day 6, n=5–7 mice per group. Non-supervised clustering of cells was performed by hSNE using CytoSplore software, resulting in a tSNE plot in which cells are clustered based on similarity in marker expression. Relevant myeloid immune subsets were identified from these clusters based on the expression pattern of cell surface markers per cluster. (A,B) tSNE density plots of myeloid immune cell subsets from TC-1 and CT26 tumors, respectively. The location of the subsets in the tSNE plot is indicated in the left plot, which depicts cells from both PBS-treated mice. The density of each cluster represents the abundance of that subset, which is shown separately for PBS-treated and Omiganan-treated mice. (C,D) Bar graphs showing the abundance of each subset as a percentage of total CD45+ immune cells. Marker expression pattern of each cluster is depicted in heatmaps for TC-1 and CT26 tumors, respectively, directly corresponding to the tSNE plots. tatistical significance in subset abundance between groups was determined using a Student’s t test, *p<0.05. cDC, conventional (or classical) dendritic cell; eosino, eosinophils; hSNE, hierarchical tSNE; moDC, monocyte-derived dendritic cell; Mono, monocyte; PBS, phosphate-buffered saline; pDC, plasmacytoid dendritic cell; TAM, tumor-associated macrophage; tSNE, t-distributed stochastic neighbor embedding.
Neutrophils are required to control TC-1 and RMA tumors but support tumor growth in CT26 tumors
As Omiganan strongly increased the abundance of neutrophils in TC-1 tumors, we assessed whether neutrophils were essential for its therapeutic efficacy. Tumor growth inhibition by Omiganan was abrogated after administering the neutrophil-depleting antibody anti-Ly6G (figure 5A), even though neutrophil depletion was incomplete in blood and tumors (online supplemental figure S4). This indicated that the Omiganan-mediated neutrophil influx was required for TC-1 tumor control by this AMP. We had also observed an influx of iNOS-expressing neutrophils in the BL/6 mouse Rauscher’s Murine Leukemia virus induced RMA tumor model, when mice bearing established subcutaneous tumors were therapeutically vaccinated with two synthetic long peptides targeting two tumor-specific viral proteins gag and env, recognized by CD8+ and CD4+ T cells, respectively. This influx was observed only in mice displaying tumor regression (figure 5B,C; online supplemental figure S5). While all non-treated mice rapidly succumbed to disease, about 60% of the vaccinated mice remained alive. In line with the function of neutrophils in TC-1, depletion of neutrophils abrogated the RMA tumor growth control caused by peptide vaccination, with only 10% of mice still alive at the end of the experiment (figure 5D). In contrast, neutrophil depletion in CT26 tumors led to improved efficacy of Omiganan (figure 5E and online supplemental figure S4), suggesting a tumor-supporting role of neutrophils in the CT26 tumor model. Neutrophil depletion during Omiganan treatment had no significant effect in the resistant B16F10 and 4T1 tumor models, although some growth inhibition was seen in 4T1, in line with the effects of neutrophils in the other BALB/c tumor model CT26 (online supplemental figure S6a,b). These data showed that neutrophils mediated the antitumor effects in the TC-1 and RMA models, whereas neutrophils supported the growth of tumors in the CT26 model.
Supplemental material
Supplemental material
Supplemental material

Neutrophils are required to control TC-1 and RMA tumors but support tumor growth in CT26 tumors. (A,E) Growth curves of TC-1 and CT26 tumors, respectively, treated by intratumoral injection of Omiganan or empty PBS vehicle, combined with systemic neutrophil depletion using anti-Ly6G antibodies. Mice received intratumoral injections and neutrophil depletion at every time point of the graph, n=11–15 mice per group. (B) Representative dot plots of inducible nitric oxide synthase (iNOS) expression by neutrophils in RMA tumors of untreated or vaccinated mice, split in non-responders (progressive tumor growth) or responders (tumor regression at day 17 after tumor challenge). iNOS+percentages of Dump-(CD3,CD19,NK1.1), CD45+, CD11b+Ly6G+cells, n=9–15 mice per group. (C) iNOS-expressing neutrophil abundance in RMA tumors of untreated or vaccinated mice. Live, Dump-(CD3,CD19,NK1.1), CD45+, CD11b+, Ly6G+, iNOS+as percentages of Live, Dump-(CD3,CD19,NK1.1) cells. (D) Kaplan-Meier plot of mice bearing RMA tumors treated with therapeutic vaccination in combination with neutrophil depletion, n=8–10 mice per group. Statistical tests were performed at final timepoints, using a one-way ANOVA, *p<0.05. ANOVA, analysis of variance; PBS, phosphate-buffered saline.
Differences in neutrophil abundance and phenotype are determined by genetic background of the host
The abovementioned findings implied functional differences in neutrophils between these two tumor models. As TC-1 and CT26 grow in different mouse strains with distinct genetic backgrounds, the functional difference of neutrophils may be influenced by host factors and/or tumor factors. To dissect this, we first analyzed neutrophil abundance in the blood of naïve mice. Interestingly, naïve BALB/c mice contained more blood neutrophils than naïve BL/6 mice (mean 10,3% vs 3,3% of CD45+ cells, respectively, p<0.001). Moreover, these blood frequencies were strongly elevated in BALB/c mice bearing CT26 or 4T1 tumors (figure 6A). The blood of mice bearing large CT26 tumors reached astonishing frequencies of up to 90% Ly6G+Ly6Cint neutrophils and also the other BALB/c tumor 4T1 strongly promoted the increase of blood neutrophil frequencies (figure 6A). In contrast to the BL/6 tumor models B16F10 and MC38, blood neutrophilia was only observed in TC-1 tumor-bearing mice (figure 6A). We then analyzed the phenotypic profiles of these blood neutrophils by flow cytometry and determined expression levels of several cell surface markers. The neutrophils of naïve BL/6 mice expressed lower levels of surface Ly6G and higher levels of surface CD62L when compared with naïve BALB/c mice. This difference was retained in tumor-bearing hosts (figure 6B). Moreover, the presence of tumors led to enhanced expression of the CD11b molecule (integrin αM) in both models, suggesting a more activated state of the tumor-induced neutrophils.6 38 An identical analysis of tumor-infiltrating neutrophils reflected the findings in blood, as BALB/c CT26 tumors contained higher neutrophil frequencies with much higher Ly6G expression and lower CD62L expression as compared with BL/6 TC-1 tumors (figure 6C,D). Importantly, Omiganan treatment hardly altered neutrophil phenotypes in blood or tumors of both mouse strains (online supplemental figure S6c,d). Neutrophils from both mouse strains migrated comparably towards a gradient of Omiganan in an in vitro transwell assay (online supplemental figure S6e). Together, these results pointed at an important impact of the genetic background of the host on neutrophil responses during tumor growth and in response to therapy.

Blood neutrophil frequencies are strongly promoted by CT26, 4T1 and TC-1 tumors. (A) Neutrophil abundance in blood of naïve (tumor-free) mice and untreated tumor-bearing mice, expressed as a percentage of total CD45+ immune cells, is shown in relation to tumor size, n=2–8 mice per group. (B) Phenotype of blood neutrophils of naïve and untreated tumor-bearing mice. The expression level of several cell surface markers on neutrophils is represented by the MFI per marker. n=5. (C) Abundance of intratumoral neutrophils in relation to tumor size, n=5–9 mice per group. (D) Phenotype of intratumoral neutrophils in TC-1 and CT26 tumors, n=4–5 mice per group. The expression level of several cell surface markers on neutrophils is represented by the MFI per marker. Statistical significance was determined using a one-way ANOVA, *p<0.05. ANOVA, analysis of variance; MFI, mean fluorescence intensity.
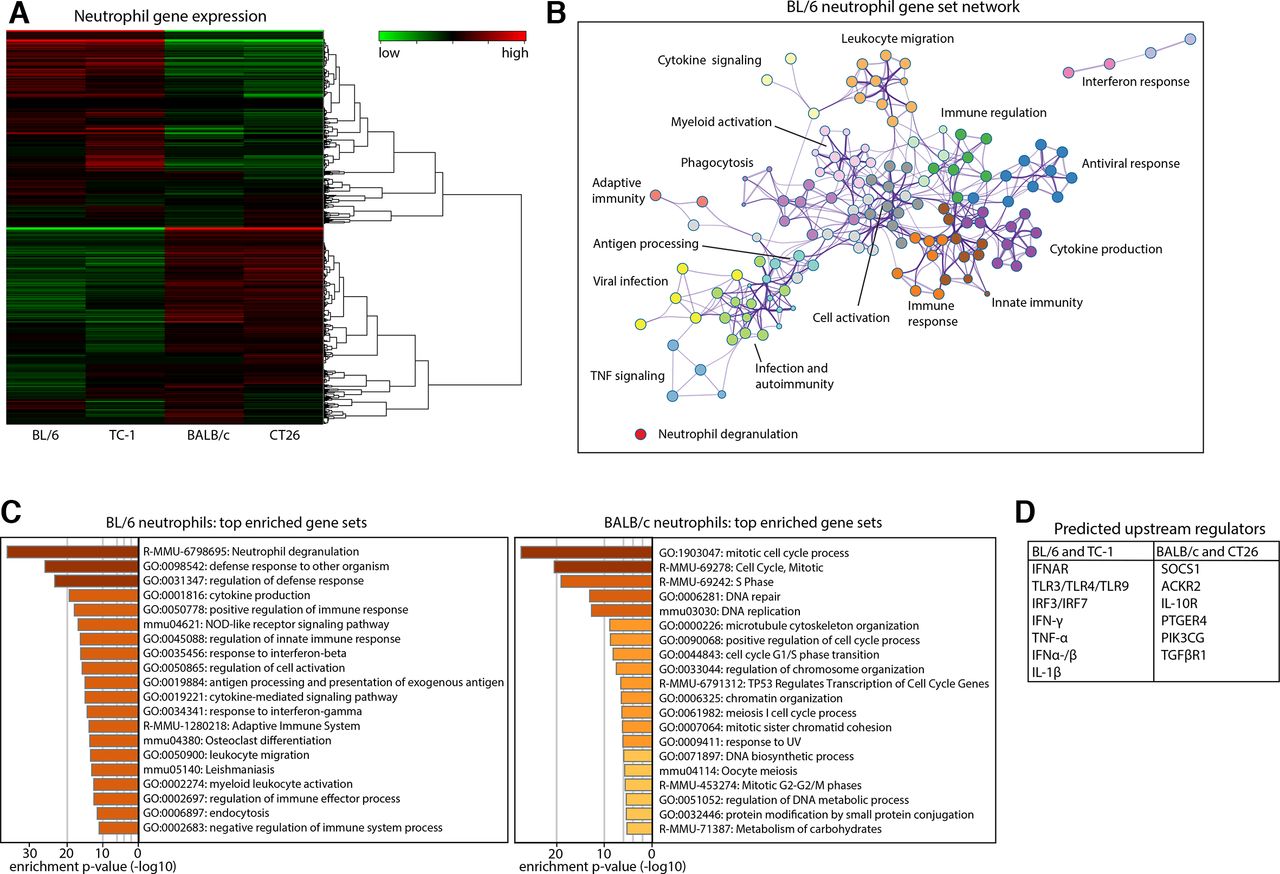
To investigate whether the opposed functional roles of BL/6 and BALB/c neutrophils in tumor therapy are the result of genetically determined differences between the mouse strains and/or instructed by the tumors, we performed bulk RNA-sequencing (RNA-seq) on neutrophils of BL/6 or BALB/c mice, with or without TC-1 or CT26 tumors, respectively (online supplemental figure S7a,b). A heatmap of overall gene expression profile differed strongly between BL/6 and BALB/c mice, irrespective of tumor presence (figure 7A). This pattern was also observed among the 1000 most differently expressed genes (online supplemental figure S7c). The tumor-independent gene expression profile of neutrophils is emphasized by a near lack of differentially expressed genes between BL/6 with or without a TC-1 tumor and between BALB/c with or without a CT26 tumor (n=26–27 out of >10 000 genes), whereas comparisons between different strains resulted in differential expression of 13%–18% of genes (online supplemental figure S7d). We then analyzed the biological nature of these large quantitative differences in gene expression using Metascape, which identifies biologically relevant gene sets in which differentially expressed genes are overrepresented.32 Gene sets overexpressed in BL/6 neutrophils indicated a pronounced profile of immune activation, including the activation and recruitment of neutrophils and other myeloid cells (figure 7B). Neutrophil degranulation was the most significantly enriched gene set in BL/6 neutrophils, followed by activation and mobilization of the innate and adaptive immune systems and antimicrobial defense responses. BALB/c neutrophils showed a distinct profile of cellular proliferation (figure 7C, online supplemental figure S7e). The same analysis of genes differentially expressed between TC-1 and CT26-tumor bearing mice resulted in expression profiles strongly overlapping with BL/6 and BALB/c naïve mice, respectively (online supplemental figure S7f,g). Finally, we used Ingenuity Pathway Analysis (IPA) to identify possible upstream regulators that could be responsible for inducing the gene expression profiles observed. Predicted upstream regulators for BL/6 neutrophils included TNF-α, IFN-γ, TLRs and the type-I interferon pathway (IRFs, IFN-α, IFNAR), whereas the BALB/c profile was predicted to be induced by the Prostaglandin E4 receptor (PTGER4), IL-10RA and TGF-βR1 (figure 7D). In conclusion, RNA-seq analysis of BL/6 neutrophils showed a strong intrinsic profile of immune activation in comparison to BALB/c neutrophils, which was conserved in tumor-bearing mice and indicates a default function of neutrophils in tumor growth and therapy.
Supplemental material
The genetic background of the host determines neutrophil functionality. Bone marrow neutrophils were analyzed by bulk RNA-sequencing. (A) Heatmap visualizing the gene expression profile of neutrophils from naïve BL/6 mice, BL/6 mice with a TC-1 tumor (TC-1), naïve BALB/c mice (BALB/c) and BALB/c mice with a CT26 tumor (CT26). Average expression of n=3–4 samples per group. (B) Metascape gene set enrichment analysis showing biological processes involving genes overexpressed in BL/6 neutrophils as compared with BALB/c neutrophils. Biologically related processes are grouped in clusters shown in different colors, and each cluster is indicated by a representative process of that group. (C) The 20 gene sets most significantly associated with either BL/6 or BALB/c neutrophils, ranked by p value. (D) Predicted upstream regulators for the observed expression profiles of neutrophils.
Discussion
We used AMPs to study the role of neutrophils in six different mouse tumor models growing in the BL/6 or BALB/c mouse strains. We showed that the AMP Omiganan inhibited the growth of one tumor model from each strain. The growth delay of the two sensitive tumors TC-1 and CT26 was associated with different changes in the composition of intratumoral innate immune cells. Omiganan induced a strong influx of neutrophils into TC-1 tumors but not into CT26 tumors. In contrast, this AMP induced a strong influx of MHC-II+monocytes and eosinophils into CT26 tumors, which was not observed in TC-1. Overall, these immunological functions of AMPs have been reported in literature, including their positive effect on neutrophil recruitment and function,17 20 21 39 but we now show that they are highly tumor model-dependent. Whereas the antitumor function of Omiganan was mediated by neutrophils in the TC-1 tumor, this AMP apparently failed to repolarize neutrophils in the CT26 model towards antitumor effectors, as their depletion enhanced its therapeutic effect against CT26. In addition, we showed that the capacity of a therapeutic vaccine-induced tumor-specific T cell response to control RMA tumor outgrowth was significantly impaired when neutrophils were depleted. Thus, our data fit the reports that indicate a widely varying role of neutrophils in tumor growth and response to therapy.9 10 13–16 40 41
Our RNA-sequencing analysis indicated that neutrophil functionality was determined by the genetic background of the mouse strain. We also observed that TC-1 tumors increased the percentage of circulating neutrophils whereas the two other tumors (B16F10 and MC38) in BL/6 mice did not. Moreover, the effect of AMP treatment on tumor growth and neutrophils varied between the different tumor models growing in the same mouse strain. This indicates that tumor-intrinsic factors also determine to what extent the neutrophils play a role in cancer. Notably, while neutrophils played a neutral or weakly protective role against 4T1 or MC38 tumor growth treated with Omiganan, they were shown to promote 4T1 metastasis when recombinant G-CSF was provided16 and MC38 tumor outgrowth after irradiation.14 While neutrophils displayed a protective role in Omiganan-treated TC-1 tumors, they played no role in controlling tumor growth of recurrent TC-1 tumors of mice vaccinated after surgery for a primary TC-1 tumor.15 In contrast, neutrophils hardly played a role in Omiganan treated B16F10 tumors, but displayed a strong protective effect in B16F10 tumors treated with T-cell activating regimens such as poly I:C and inactivated Sendai virus particles40 or a combination of vaccine, anti-PD-1, recombinant IL-2 and a tumor-targeting antibody,41 Similar to what we observed in our RMA model where mice were treated with therapeutic vaccination. Consequently, the contrasting reports on the role of neutrophils in cancer may in part be due to the use of different experimental models and treatments provided, and to variation in genetic, physiological and pathological backgrounds.
Although the exact molecular mediators responsible for this sharply opposed BL/6 and BALB/c neutrophil functionality remain to be identified, we provided a number of predicted upstream regulators that can explain our observations. These include several inflammatory and suppressive mediators that have broad immune-skewing functions beyond the scope of neutrophils, such as IFN-γ, TNF-α, IFN-α, IL-10, TGF-β and prostaglandins. These findings match recent literature on immunological mediators that are suggested to skew neutrophils towards an activated (N1) or suppressive (N2) state, including TNF-α, IFN-α and TGF-β.11 42 Therefore, it is possible that the functional role of neutrophils is not an isolated parameter but part of a broader immunological state and regulated through interplay with other immune subsets. Differential skewing of neutrophil responses in different mouse strains has been described in models of infectious diseases, as BL/6 mice are resistant to Leishmania infection by mounting Th1 responses whereas BALB/c mice are susceptible as they produce Th2 responses.43 Along the same line, BALB/c but not BL/6, mice are sensitive to glucocorticoid driven cutaneous hypersensitivity and osteonecrosis.44 45 Increased glucocorticoid sensitivity may have direct impact on CD62L expression by neutrophils. Whereas CD62L surface expression is transiently downregulated due to proteolytic cleavage of these molecules after their engagement to allow for neutrophil migration into tissues,46 glucocorticoids suppress CD62L at the transcriptional level, most effectively in neutrophils just before they are released from the bone marrow in the circulation,47 48 and as such may explain the CD62Llow phenotype observed in BALB/c mice. In addition, the Ly6Ghi/CD62Llo phenotype of BALB/c neutrophils has been linked to neutrophil aging, suggesting that the Ly6Glo/CD62Lhi neutrophils of BL/6 mice may represent younger neutrophils.5 6
The translatability of experimental results on neutrophils from mouse studies towards humans depends on a number of factors. For instance, humans have much higher neutrophil levels in peripheral blood than the mouse strains used here, and the biological variation between subjects in human studies is much greater than in mouse studies, which are often based on a single mouse strain.49 50 Intrinsic quantitative differences in human neutrophils have also been linked to ethnicity, gender and age. For instance, Benign Ethnic Neutropenia is prevalent in African and Southern-Asian populations and blood neutrophil numbers are markedly reduced in women after the menopause, whereas the abundance of neutrophils gradually increases with age in men.12 51
Altogether, our data illustrate how intrinsic biological differences in neutrophils can underlie opposite roles in tumor growth and therapy. Further research is required to elucidate how host and tumor factors and therapies can drive neutrophil responses, as it may lead to new therapeutic opportunities.
Conclusion
In this study, we showed that neutrophils play a variable role in tumor progression and therapy, depending on the tumor model and mouse strain used. The idea that host and tumor factors jointly determine neutrophil function may explain the contrasting findings on the role of neutrophils in human cancer studies. The identification of biological factors driving neutrophil functionality can be valuable in the development of personalized medicine for patients with cancer.
Acknowledgments
The authors would like to thank Annelies van Wengen-Stevenhagen, Bep Schonkeren-Ravensbergen and Tom Kuipers (Leiden University Medical Center) for technical assistance.
References
Footnotes
MvE and JWK contributed equally.
Contributors SHvdB, TvH, MM, MvE and JWK designed the project and experiments and interpreted the results. JWK, MvE, GB, HM and SMJ performed experiments. MM, SMJ and GF provided expert feedback on the use of Omiganan. RA, HM and PHN advised on and facilitated assays and data analysis. JWK, MvE, SHvdB and TvH wrote the manuscript. All authors read and approved the final manuscript.
Funding This work and JWK were supported by funding from the Centre for Human Drug Research to SHvdB. MvE was supported by the base funding from the Oncode Institute to SHvdB.
Competing interests None declared.
Patient consent for publication Not required.
Provenance and peer review Not commissioned; externally peer reviewed.
Data availability statement Data are available on reasonable request. Detailed RNA-sequencing data (differential gene expression, gene networks and upstream regulators) are available on request.