Article Text

Abstract
Background Myeloid-derived suppressor cells (MDSC) play a major role in the immunosuppressive melanoma microenvironment. They are generated under chronic inflammatory conditions characterized by the constant production of inflammatory cytokines, chemokines and growth factors, including IL-6. Recruitment of MDSC to the tumor is mediated by the interaction between chemokines and chemokine receptors, in particular C–C chemokine receptor (CCR)5. Here, we studied the mechanisms of CCR5 upregulation and increased immunosuppressive function of CCR5+ MDSC.
Methods The immortalized myeloid suppressor cell line MSC-2, primary immature myeloid cells and in vitro differentiated MDSC were used to determine factors and molecular mechanisms regulating CCR5 expression and immunosuppressive markers at the mRNA and protein levels. The relevance of the identified pathways was validated on the RET transgenic mouse melanoma model, which was also used to target the identified pathways in vivo.
Results IL-6 upregulated the expression of CCR5 and arginase 1 in MDSC by a STAT3-dependent mechanism. MDSC differentiated in the presence of IL-6 strongly inhibited CD8+ T cell functions compared with MDSC differentiated without IL-6. A correlation between IL-6 levels, phosphorylated STAT3 and CCR5 expression in tumor-infiltrating MDSC was demonstrated in the RET transgenic melanoma mouse model. Surprisingly, IL-6 overexpressing tumors grew significantly slower in mice accompanied by CD8+ T cell activation. Moreover, transgenic melanoma-bearing mice treated with IL-6 blocking antibodies showed significantly accelerated tumor development.
Conclusion Our in vitro and ex vivo findings demonstrated that IL-6 induced CCR5 expression and a strong immunosuppressive activity of MDSC, highlighting this cytokine as a promising target for melanoma immunotherapy. However, IL-6 blocking therapy did not prove to be effective in RET transgenic melanoma-bearing mice but rather aggravated tumor progression. Further studies are needed to identify particular combination therapies, cancer entities or patient subsets to benefit from the anti-IL-6 treatment.
- myeloid-derived suppressor cells
- melanoma
- immune evasion
- cytokines
This is an open access article distributed in accordance with the Creative Commons Attribution Non Commercial (CC BY-NC 4.0) license, which permits others to distribute, remix, adapt, build upon this work non-commercially, and license their derivative works on different terms, provided the original work is properly cited, appropriate credit is given, any changes made indicated, and the use is non-commercial. See http://creativecommons.org/licenses/by-nc/4.0/.
Statistics from Altmetric.com
Background
In the last decade, immune checkpoint inhibitors like monoclonal antibodies against programmed cell death protein (PD)-1 and cytotoxic T-lymphocyte-associated protein (CTLA)-4 have revolutionized the field of cancer immunotherapy and could improve the survival of patients with advanced malignant melanoma.1 However, there is still a considerable number of patients who do not respond at all or develop resistance.1 One of the factors leading to the development of irresponsiveness or resistance towards immunotherapy is the generation and enrichment of myeloid-derived suppressor cells (MDSC) that are major mediators of an immunosuppressive tumor microenvironment (TME).2 It was demonstrated that high MDSC frequencies at baseline correlated with a poorer outcome of melanoma patients treated with ipilimumab.3
MDSC are a heterogeneous population of myeloid cells with strong immunosuppressive and tumor promoting capacity, provided mainly by the inhibition of tumor-reactive T cells.4 In mice, MDSC were characterized by the expression of CD11b (integrin α-M) and the myeloid differentiation antigen Gr1.5 There are two MDSC subpopulations: CD11b+Ly6GhighLy6Clow polymorphonuclear (PMN)- and CD11b+Ly6G−Ly6Chigh monocytic (M)-MDSC.5 In addition to these markers, both MDSC subpopulations are defined by their immunosuppressive nature.4 They express the immune checkpoint molecule programmed death-ligand (PD-L)1, inducing T cell anergy via interaction with PD-1 expressed on T cells.6 Furthermore, MDSC are able to induce T cell starvation by depleting L-arginine in the TME through high expression of arginase (Arg)17 and inducible nitric oxide synthase (NOS2),8 and via depletion of L-tryptophan through elevated expression of indolamin-2,3-dioxygenase (IDO).9 In addition, NOS2 and nicotinamide adenosine dinucleotide phosphate oxidases (NOX)10 lead to production of elevated levels of nitric oxide (NO) and reactive oxygen species (ROS) by MDSC, harming antitumor T cells.4 It was demonstrated that M-MDSC displayed higher expression of NOS2 than PMN-MDSC, whereas the latter produce more ROS than M-MDSC; however, both subsets expressed high levels of Arg1.11 12
Importantly, generation and activation of MDSC is orchestrated by inflammatory factors, such as interleukin (IL)-6, interferon (IFN)-γ, IL-1β, granulocyte macrophage colony-stimulating factor (GM-CSF), tumor necrosis factor (TNF)-α and vascular endothelial growth factor, as well as Toll-like receptor (TLR) ligands.12 While these factors are known for the induction of the immune response in acute inflammation, their constant presence can cause the pathologic accumulation and activation of MDSC.12 IL-6 plays an important role in MDSC generation, although it could be also critical for the activation of the T-cell response and antibody production by B cells.13 Using the RET transgenic melanoma mouse model that closely resembles human melanoma,14 15 significantly higher levels of IL-6 were detected in serum of melanoma-bearing mice compared with wild type animals.16 Moreover, IL-1β, IFN-γ and GM-CSF were observed to be increased in fast-growing murine melanomas.17 In addition, the endogenous TLR ligand HSP86 was found on melanoma-derived extracellular vesicles (EV) that were able to convert human normal myeloid cells and murine immature myeloid cells (IMC) into MDSC.18
After their accumulation and activation in the bone marrow, MDSC are attracted to the tumor via interactions between chemokine receptors and chemokines accumulated in the TME.19 MDSC expressing C–C chemokine receptor (CCR)5 were shown to be enriched in melanoma lesions of RET transgenic mice, since CCR5 ligand concentrations were significantly increased in the tumor compared with the serum.20 Intriguingly, tumor-infiltrating CCR5+ MDSC demonstrated elevated expression of immunosuppressive markers such as PD-L1, Arg1, ROS and NO, as well as stronger immunosuppressive activity than their CCR5− counterparts. Furthermore, advanced melanoma patients showed an accumulation of CCR5+ MDSC that were also characterized by a stronger immunosuppressive pattern compared to CCR5− MDSC.20 Blockade of the CCR5–CCR5 ligand axis led to a decreased migration of MDSC into melanoma lesions and thereby, increased survival of RET transgenic mice.20 However, the molecular mechanisms inducing CCR5 upregulation on MDSC and stimulating their immunosuppressive properties are poorly understood.
In this study, we investigated the mechanisms of CCR5 upregulation on MDSC in melanoma and elucidated the link between CCR5 expression and immunosuppressive capacity of MDSC. We showed that IL-6 upregulated the expression of CCR5 and immunosuppressive Arg1 by a STAT3-dependent mechanism. We have collected evidence that IL-6 can mediate both CCR5 upregulation and the increased immunosuppressive capacity of CCR5+ MDSC. However, IL-6 blocking therapy did not prove to be effective in RET transgenic melanoma-bearing mice but rather aggravated tumor progression. Furthermore, tumors induced by melanoma cells overexpressing (OE) IL-6 grew significantly slower and showed increased CD8+ T cell activation compared with control melanomas. Our study highlights the pleiotropic role of IL-6 in the antitumor immune response and stimulates rethinking of IL-6 blockade as cancer immunotherapy.
Methods
Mice
Mice (C57BL/6 background) expressing the human RET oncogene in melanocytes under the mouse metallothionein-I promotor-enhancer14 were provided by Dr. I. Nakashima (Chubu University, Aichi, Japan). Mice were kept under specified pathogen-free conditions in the animal facility of the University Medical Center (Mannheim, Germany). Non-transgenic littermates were used as healthy C57BL/6 mice. Murine in vivo studies were approved by the German local authority (G-4/14, G-40/19, G-73/18) and conducted respecting ethical and legal rules.
Cell culture
The murine Ret melanoma cell line was established from skin melanomas isolated from RET transgenic mice16 and cultured in RPMI-1640 with GlutaMAX (Thermo Fisher) and supplemented with 10% heat-inactivated FBS (Merck) and 1% penicillin/streptomycin (Thermo Fisher). The immortalized myeloid suppressor cell line MSC-221 was provided by Dr. S. Ugel (University of Verona, Italy) and cultured in RPMI-1640 with GlutaMAXTM and supplemented with 10 mM sodium pyruvate (Thermo Fisher), 10% heat-inactivated FBS and 1% penicillin/streptomycin. Cell lines were maintained under 5% CO2 at 37°C and routinely tested for Mycoplasma contamination using the Mycoplasma Detection Kit for Conventional PCR (Minerva Biolabs). Different cytokines, chemokines and growth factors (PeproTech) and TLR ligands (InvivoGen) were used for cell stimulation (online supplementary table S1).
Supplemental material
Isolation of primary cells
CD11b+Gr1+ IMC from murine bone marrow and CD8+ T cells from murine spleen were isolated by magnetic-activated cell sorting (MACS, Miltenyi Biotec) according to the manufacturer’s instructions. Single-cell suspension from murine tumors was obtained by collagenase (1 mg/mL) and DNase (10 µg/mL, both Sigma-Aldrich) digest and filtering through a 100 µm cell strainer (Corning). To isolate leukocytes, single-cell suspension was centrifuged over Histopaque (1.119 g/mL, Thermo Fisher).
In vitro differentiation of MDSC from murine bone marrow
The MDSC in vitro differentiation was performed as previously described.22 Briefly, bone marrow cells were isolated and 2.5×10⁶ cells were cultured for 4 days in 10 mL RPMI-1640 with GlutaMAX supplemented with 10% heat-inactivated FBS, 1% penicillin/streptomycin, 10 mM HEPES, 1 mM sodium pyruvate, 50 µM β-mercaptoethanol, 1 mM MEM non-essential amino acids (all Thermo Fisher), 40 ng/mL GM-CSF and 40 ng/mL IL-6 (PeproTech).
RNA isolation
Total RNA was isolated by RNeasy Mini Kit (Qiagen). DNA digest was performed with on-column RNase-free DNase Set (Qiagen) according to manufacturer’s instructions. RNA concentration was determined by the microplate reader Tecan Infinite M200 using a Nanoquant plate.
Microarray analysis
The Affymetrix GeneChip Mouse Gene 2.0 ST Array (Thermo Fisher) was used according to the manufacturer’s instructions. A Custom CDF V. 22 with ENTREZ-based gene definitions was used to annotate the arrays.23 The raw fluorescence intensity values were normalized by applying quantile normalization and robust multiarray analysis background correction. A batch normalization was used to remove the individual mouse variations. An analysis of variance was performed to identify differentially expressed genes using the commercial software package SAS JMP Genomics, V. 7 (SAS Institute). A false positive rate of a=0.05 with false discovery rate correction was taken as the level of significance. Gene set enrichment analysis was used to determine whether defined lists (or sets) of genes exhibit a statistically significant bias in their distribution within a ranked gene list.24 Pathways belonging to different cell functions were obtained from public external databases (KEGG, http://www.genome.jp/kegg).
cDNA synthesis and qRT-PCR
cDNA synthesis was performed with 1 µg RNA using the SensiFAST cDNA Synthesis Kit (Bioline) according to the manufacturer’s instructions. SensiFAST SYBR Lo-ROX Kit (Bioline) was used for qRT-PCR with the Stratagene MX3005P qPCR machine. To allow normalization, mRNA levels for the gene of interest and a house keeping gene were quantified. Primers were purchased from Metabion. Their sequences are shown in online supplementary table S2.
Flow cytometry
Cells were treated with 7AAD or fixable viability dye 700 and with FcR Blocking Reagent (all BD biosciences) followed by the staining with antibodies (online supplementary table S3). For intracellular staining, cells were fixed and permeabilized with the eBioscience Foxp3/Transcription Factor Staining Buffer Set (Thermo Fisher) according to the manufacturer’s instructions. For the detection of ROS and NO production, we applied CellROX Deep Red Reagent (Thermo Fisher) and diaminofluorescein-FM diacetate (Cayman Chemical), respectively. Acquisition was performed by 10-color flow cytometry using BD FACSLyric with FACSuite software (BD biosciences). FlowJo V. 10 software (BD biosciences) was used for analysis. Isotype controls were used for intracellular staining, whereas extracellular markers were gated according to the fluorescence minus one control.
Chromatin immunoprecipitation
Chromatin immunoprecipitation (ChIP) was performed with the Chromatrap spin column ChIP kit for qPCR (Porvair Sciences) according to the manufacturer’s protocol. 4.5×10⁶ MSC-2 cells were incubated with 40 ng/mL IL-6 or without it for 6 hour. Sonication was performed for 20 min with 30 s bursts and 30 s intervals at 4°C using a Bioruptor (diagenode) at high setting. Precipitation was made with pSTAT3 antibody and rabbit IgG used as a control. The applied antibodies and sequences of primers are listed in online supplementary table S4 and S5.
Enzyme-linked immunosorbent assay
Murine tumor samples were lysed by the Bio-Plex cell lysis kit (Bio-Rad) according to the manufacturer’s instructions. The ELISA MAX Deluxe Set Mouse IL-6 (BioLegend) was used according to the manufacturer’s instructions. For the lysate of the tumor preparation, protein concentration was measured with the Pierce BCA Protein Assay Kit (Thermo Fisher).
Arginase activity assay
Arg activity of 1×10⁶ cells was determined using the Arginase Activity Assay Kit (Sigma-Aldrich) according to the manufacturer’s instructions.
Suppression of T cell proliferation assay
CD8+ splenic T cells isolated by MACS from C57BL/6 mice were stained with 2 nM carboxyfluorescein succinimidyl ester (CFSE). T cells were cocultured with stimulated IMC or MDSC at different ratios in 200 µL of RPMI-1640 medium (supplemented as for MDSC in vitro differentiation) for 72 hours in 96-well round bottom plates (Sarstedt) precoated for 3 hour with anti-CD3 and anti-CD28 antibodies (eBioscience, Thermo Fisher). The proliferation of CD8+ T cells was assessed after 72 hours of coculture by measuring CFSE dilution at the BD FACSLyric flow cytometer.
Lentiviral transduction of Ret melanoma cells
HEK293T cells were used for lentiviral particle production with the following plasmids: pLenti-GIII-CMV-C-term-HA with or without IL-6 sequence (accession number: NM_031168), pCMV-VSV-G and pCMV-dR 8.91. Murine Ret melanoma cells were infected twice with virus. The cells were washed twice with PBS and cultured at 37°C and 5% CO2. To select transduced cells, 2 µg/mL puromycin were added for 3 days. Thereafter, cells were expanded and cryopreserved. The OE of IL-6 was validated by qRT-PCR and ELISA.
In vitro growth assay of Ret cells
Ret cells OE IL-6 or transduced with the empty vector (EV) were seeded in flat bottom 96 well plates at a density of 2500 cells/well. 10 µL of 12 mM 3-(4,5-dimethylthiazol-2-yl)-2,5-diphenyltetrazolium bromide (MTT) was added to 100 µL medium after 4, 24 and 48 hours of culture and incubated for 4 hour. Formazan was dissolved by adding DMSO and absorption was measured at 540 nm.
Mouse in vivo studies
C57BL/6 mice were subcutaneously (s.c.) injected with 2×10⁴ Ret cells OE IL-6 or not. Tumor size was measured by a caliper and recorded three times per week. On a tumor length or width of 1.5 cm or any other termination criterion, mice were sacrificed and recorded as died. Tumor volume was calculated according to the formula:  .25 After 3 weeks, mouse tumors were isolated for FACS analysis.
On the first signs of tumors, RET transgenic mice were separated into four groups containing equal numbers of males and females. One group received isotype control antibodies (clone 2A3, 12.5 mg/kg; and clone HRPN,10 mg/kg; both BioXcell), the second group was injected with anti-PD-1 antibodies (clone RMP1-14, 12.5 mg/kg; BioXcell). Other mice received anti-IL-6 antibodies (clone MP5-20F3, 10 mg/kg; BioXcell) or the combination of anti-PD-1 and anti-IL-6. Antibodies were injected intraperitoneally for 4 weeks, twice per week. Mice with any of the termination criteria were sacrificed and recorded as died. In another set of experiments, mice of the same groups were sacrificed after 4 weeks of therapy, and tumors were isolated for FACS analysis.
Statistical analysis
Statistical analysis of data was performed using the GraphPad Prism software on at least three biological replicates (different mice) or at least three independent experiments (cell lines). Two groups were compared with the paired or unpaired two-tailed Student’s t test assuming a Gaussian distribution of the data. Correlation analysis was done by Pearson correlation with two-tailed p value. Survival curves were generated using the Kaplan-Meier method and statistical comparison was done by the Logrank (Mantel-Cox) test. A value of p<0.05 was considered statistically significant.
Results
CCR5 expression on MDSC is upregulated by IL-6, GM-CSF and IFN-γ
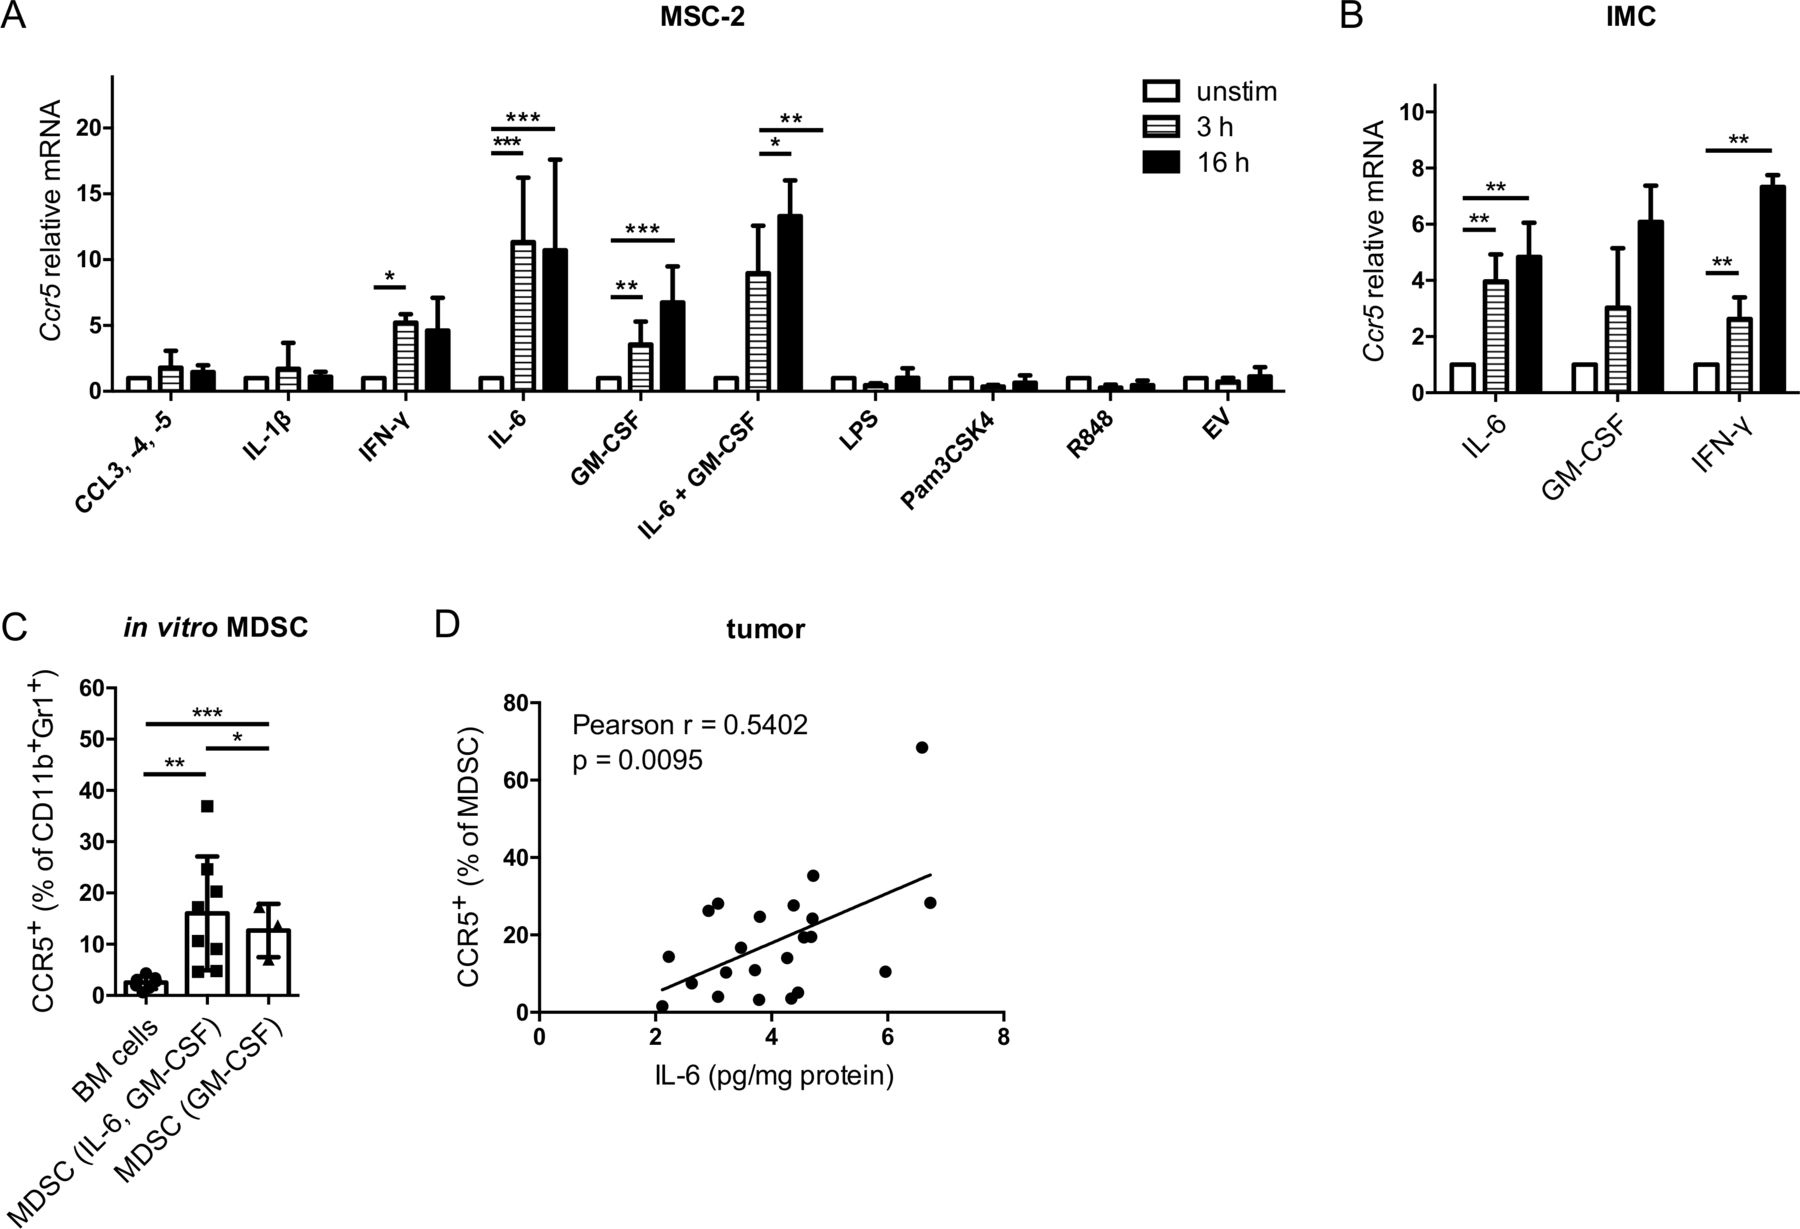
The MSC-2 cell line was stimulated with factors that play an important role in MDSC development and are enriched in the melanoma microenvironment. The CCR5 ligands CCL3, CCL4 and CCL5 as well as IL-1β and the TLR ligands lipopolysaccharide, Pam3CSK4 and R848 failed to upregulate Ccr5 expression at the mRNA level (figure 1A). In contrast, IL-6, GM-CSF and IFN-γ were able to significantly increase Ccr5 expression (figure 1A). However, the combination of IL-6 and GM-CSF failed to further increase the Ccr5 mRNA expression as compared with the incubation with IL-6 alone (figure 1A). The results with MSC-2 cells could be reproduced using primary CD11b+Gr1+ IMC isolated from murine bone marrow (figure 1B). Furthermore, IL-6 and GM-CSF could significantly increase CCR5 expression on mouse CD11b+Gr1+ cells at the protein level after 4 days of MDSC in vitro differentiation as compared to CD11b+Gr1+ cells from freshly isolated bone marrow (figure 1C and online supplementary figure S1). Interestingly, MDSC differentiated with IL-6 and GM-CSF showed significantly higher CCR5 expression than MDSC differentiated with GM-CSF only (figure 1C). In line with these data, increased IL-6 levels in the tumor of RET transgenic melanoma-bearing mice positively correlated with the augmented frequency of CCR5+ tumor-infiltrating MDSC (figure 1D).
Supplemental material

CCR5 upregulation mediated by IL-6 and GM-CSF in vitro. MSC-2 cells (A) and IMC (B) were stimulated with indicated agents for 3 and 16 hours. Ccr5 mRNA expression was measured by qRT-PCR. Values were normalized for the housekeeping gene Rn18s expression and the unstimulated control according to the 2-ΔΔCT method (mean±SEM; n=3–5). Statistics were performed on ΔCT values. (C) Bone marrow cells were differentiated into MDSC with IL-6 and GM-CSF or with GM-CSF alone for 4 days. CCR5 expression was measured by flow cytometry. Results are presented as the percentage of CCR5+ cells among total CD11b+Gr1+ cells (mean±SD; n=8). (D) The IL-6 concentrations in tumors from RET transgenic mice measured by ELISA were plotted against the percentage of tumor-infiltrating CCR5+ MDSC detected within total MDSC by flow cytometry (n=22). The line was calculated by linear regression analysis, and Pearson correlation with two-tailed p value was used for correlation testing. *p<0.05, **p<0.01, ***p<0.001. BM, bone marrow; CCR5, C–C chemokine receptor 5; EV, extracellular vesicles; GM-CSF, granulocyte macrophage colony-stimulating factor; IFN, interferon; IL, interleukin; IMC, immature myeloid cells; LPS, lipopolysaccharide; MDSC, myeloid-derived suppressor cells; MSC, myeloid suppressor cell line.
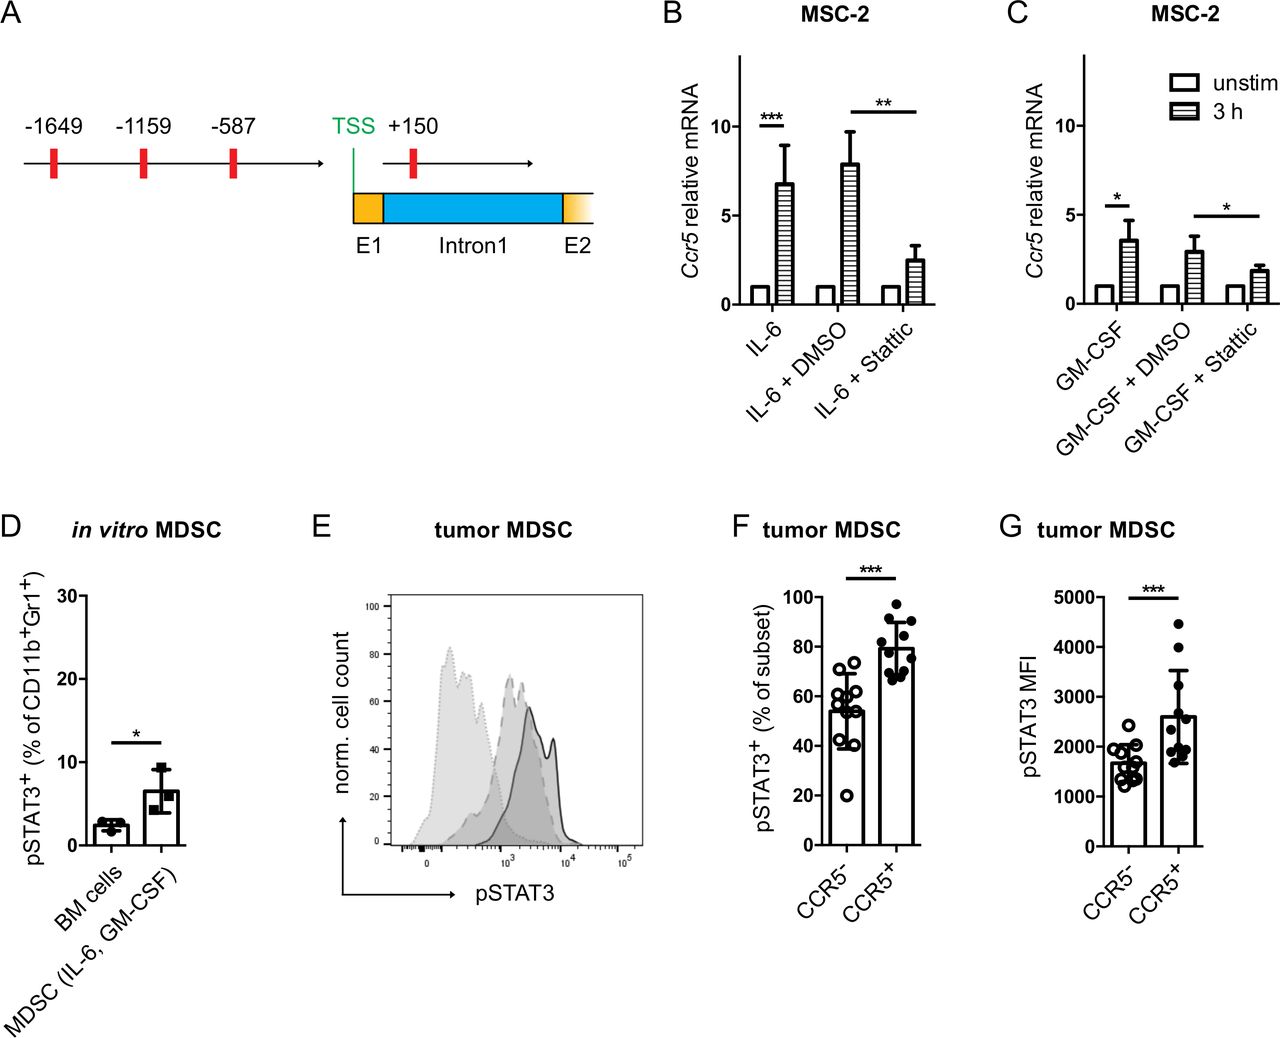
To elucidate the mechanisms of CCR5 upregulation induced by IL-6 and GM-CSF, we analyzed the two Ccr5 promoters26 for binding sites of signal transducer and activator of transcription (STAT)3 using the TFbind online tool.27 Indeed, four putative STAT3 binding sites were found in the murine Ccr5 promoters (figure 2A). Furthermore, upon STAT3 inhibition with the small molecule Stattic,28 the upregulation of Ccr5 in MSC-2 cells mediated by IL-6 and GM-CSF was significantly abrogated (figure 2B,C). Interestingly, the frequency of phosphorylated STAT3 (pSTAT3) positive cells was significantly increased within total CD11b+Gr1+ MDSC population after their in vitro generation with IL-6 and GM-CSF as compared with CD11b+Gr1+ cells from freshly isolated bone marrow (figure 2D). Moreover, the frequency of pSTAT3+CCR5+ tumor-infiltrating MDSC from RET mouse melanomas and the intensity of pSTAT3 expression was significantly higher than in their CCR5− counterpart (figure 2E–G and online supplementary figure S2). Finally, we performed a ChIP assay with anti-pSTAT3 antibodies to detect the enrichment of pSTAT3 at the predicted STAT3 binding sites (figure 2A) in the Ccr5 promoter by qPCR. pSTAT3 was found to be enriched at the Ccr5 promoter in MSC-2 cells stimulated with IL-6 as compared with cells incubated without IL-6 (online supplementary figure S3).

IL-6 and GM-CSF induced CCR5 upregulation is STAT3 dependent. (A) The murine Ccr5 gene sequence was extracted from the NCBI database (Gene-ID: 12774). The TFbind online tool was used to search for STAT3 binding sites in the two Ccr5 promoters. The predicted STAT3 binding sites are shown in red with their respective distance to the transcription start site. MSC-2 cells were stimulated with IL-6 (B) or GM-CSF (C) together with the STAT3 inhibitor Stattic (10 µM) for 3 hours. Ccr5 mRNA expression was measured by qRT-PCR (mean±SEM; n=3). (D) Bone marrow cells were differentiated into MDSC with IL-6 and GM-CSF. pSTAT3 expression was measured by flow cytometry. Data are shown as the percentage of pSTAT3+ cells within total MDSC (mean±SD; n=3). (E) Evaluation of pSTAT3 expression in tumor infiltrating MDSC. A representative histogram for pSTAT3 staining is shown (dotted line: isotype control, dashed line: CCR5− MDSC, solid line: CCR5+ MDSC). (F) The frequency of tumor-infiltrating pSTAT3+ MDSC is expressed as the percentage within CCR5+ or CCR5− MDSC (mean±SD; n=10). (G) The level of pSTAT3 expression in CCR5+ or CCR5− MDSC is presented as median fluorescence intensity (mean±SD; n=10). *p<0.05, **p<0.01, ***p<0.001. BM, bone marrow; CCR5, C–C chemokine receptor; GM-CSF, granulocyte macrophage colony-stimulating factor; IL, interleukin; MDSC, myeloid-derived suppressor cells.
These findings suggest that CCR5 could be upregulated by IL-6 and GM-CSF via a STAT3-dependent mechanism during MDSC generation.
IL-6 and GM-CSF but not CCR5 ligands increase MDSC-mediated immunosuppression
We hypothesized that the CCR5 ligands might induce the expression of immunosuppressive factors in CCR5+ MDSC via CCR5 signaling. To test this assumption, we stimulated MSC-2 cells with the CCR5 ligands, chemokines CCL3, CCL4 and CCL5, and analyzed the expression of genes coding for immunosuppressive factors. We found that these chemokines failed to upregulate the expression of the respective genes, including Pdl1, Tgfb, Arg1, Nos2, Ido and Cox2 (figure 3A). In accordance to these findings, IMC stimulated for 24 hours with CCR5 ligands were not able to suppress proliferation of activated T cells (figure 3B). Moreover, we failed to observe stronger inhibition of T cell proliferation by MDSC generated in vitro by IL-6 and GM-CSF in the presence of CCR5 ligands compared with MDSC induced without CCR5 ligands (figure 3C).
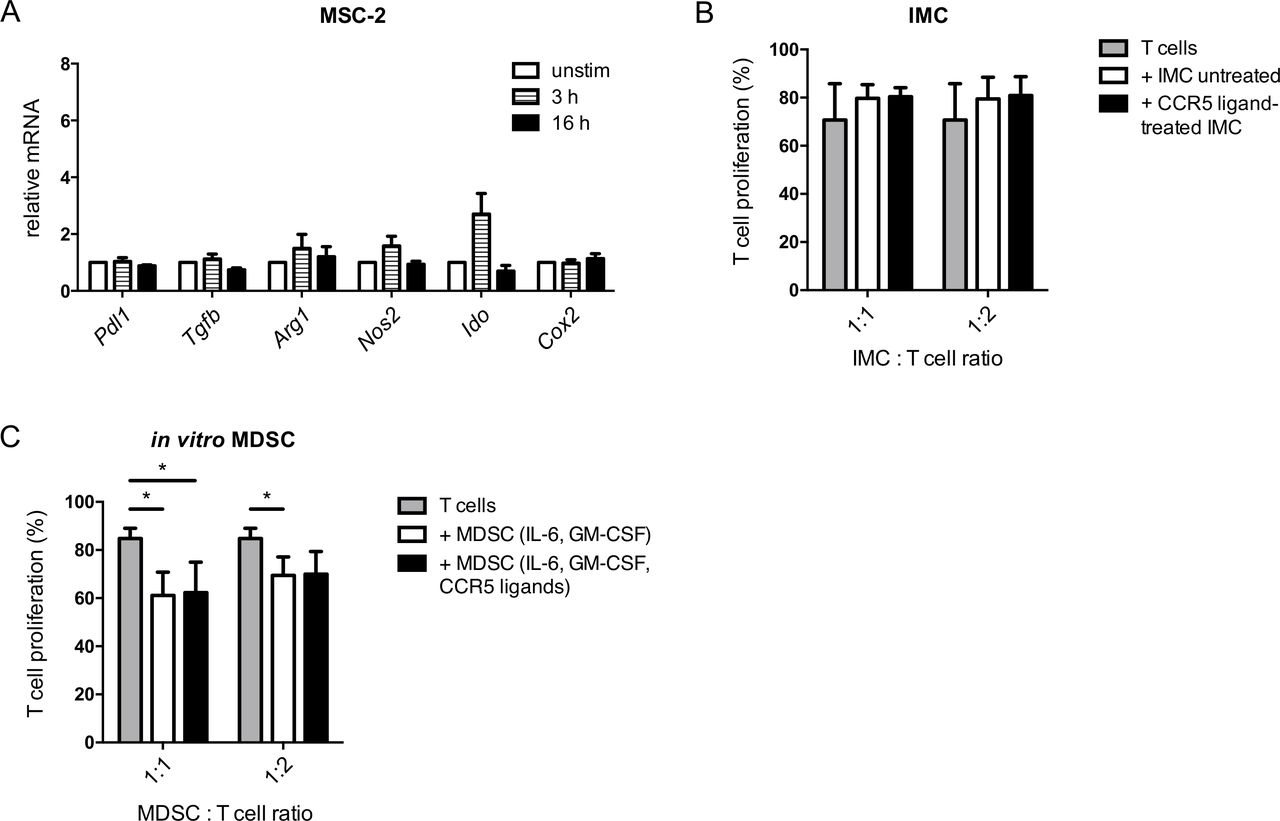
Impact of CCR5 ligands on immunosuppressive capacity of MDSC. (A) MSC-2 cells were incubated with CCL3, CCL4 and CCL5 (20 ng/mL each) for 3 and 16 hours. The mRNA expression of the indicated genes was measured by qRT-PCR (mean±SEM; n=3). (B) IMC were treated with CCL3, CCL4 and CCL5 (20 ng/mL each) for 24 hours followed by the coculture with CD8+ T cells labeled with CFSE and stimulated with anti-CD3 and anti-CD28 antibodies for 72 hours. Cumulative data for the inhibition of T cell proliferation by IMC are presented as the percentage of divided T cells (mean±SD; n=3). (C) MDSC were generated by the incubation with IL-6 and GM-CSF with or without adding CCL3, CCL4 and CCL5 for 4 days followed by the coculture with activated CD8+ T cells for 72 hours. Cumulative data for the inhibition of T cell proliferation by MDSC are presented as the percentage of divided T cells (mean±SD; n=5). MDSC:T cell ratios were as indicated. *p<0.05. CCR5, C–C chemokine receptor; CFSE, carboxyfluorescein succinimidyl ester; GM-CSF, granulocyte macrophage colony-stimulating factor; IMC, immature myeloid cells; MDSC, myeloid-derived suppressor cells; MSC, myeloid suppressor cell line.
In addition, we compared the suppressive capacity of MDSC differentiated in the presence of GM-CSF only or cultured with GM-CSF together with CCR5 ligands. Similar to the findings described for MDSC generated by GM-CSF and IL-6, we found that CCR5 ligands were also not capable of stimulating the immunosuppressive capacity of MDSC generated with GM-CSF in the absence of IL-6 (online supplementary figure S4). Therefore, CCR5/CCR5 ligand signaling is not responsible for increased immunosuppression mediated by CCR5+ MDSC.
Since CCR5 was upregulated during MDSC differentiation by IL-6 and GM-CSF, we hypothesized that GM-CSF and IL-6 might induce upregulation of immunosuppressive factors in parallel to the induction of CCR5 expression on MDSC. Indeed, IL-6 was able to significantly stimulate the expression of Arg1 mRNA (figure 4A) that plays an important role in MDSC-mediated immunosuppression. Interestingly, the Arg1 upregulation was STAT3 dependent, similar to Ccr5 upregulation, since it could be abrogated by the STAT3 inhibitor Stattic (figure 4B). In addition to the induction of Arg1 mRNA expression, MSC-2 cells stimulated with IL-6 displayed also an increased Arg activity, indicating that expression of the functional protein was induced (figure 4C).
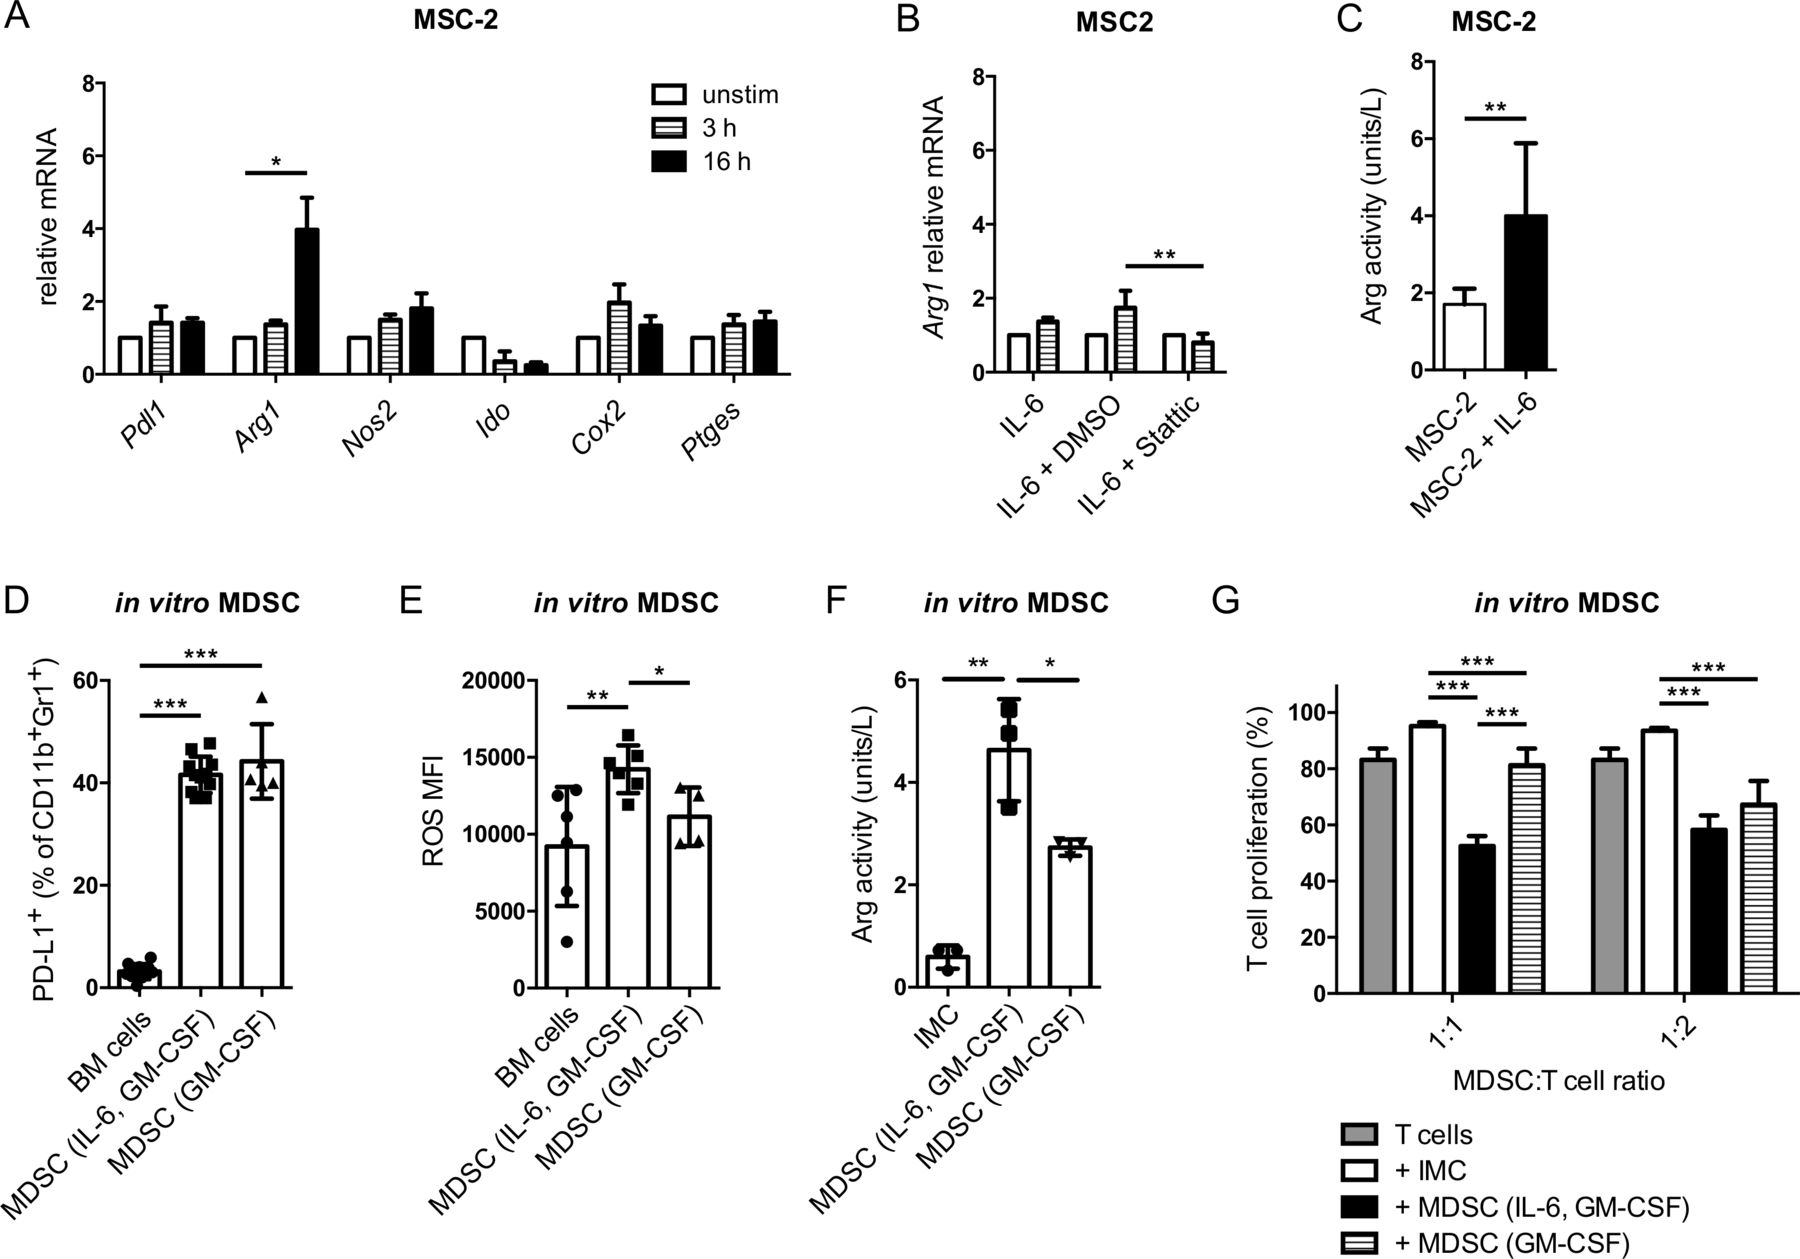
IL-6 increased MDSC-mediated immunosuppression via the stimulation of Arg1. (A) MSC-2 cells were incubated with 40 ng/mL IL-6 for 3 and 16 hours. The mRNA expression of indicated genes was measured by qRT-PCR (mean±SEM; n=3). (B) MSC-2 cells were cocultured with 40 ng/mL IL-6 together with the STAT3 inhibitor Stattic (10 µM) for 3 hour. Arg1 mRNA expression was measured by qRT-PCR (mean±SEM; n=3). (C) MSC-2 cells were incubated with IL-6 for 24 hours. Arg activity was measured using the Arginase Activity Assay Kit and expressed as units/L (mean±SD; n=9). (D–F) MDSC were generated by IL-6 and GM-CSF or GM-CSF only. PD-L1 expression and ROS production were measured by flow cytometry. Arg activity was detected by the Arginase Activity Assay Kit. The data are presented as the percentage of PD-L1+ MDSC among total MDSC (D), as the MFI of ROS producing cells (E) and as units/L of Arg activity (mean±SD; n=3–10). (G) Suppressive capacity of MDSC differentiated with IL-6 and GM-CSF or GM-CSF only was determined in the suppression of T cell proliferation assay with activated CD8+ T cells. Cumulative data for the inhibition of CD8+ T cell proliferation by generated MDSC are presented as the percentage of divided T cells (mean±SD; n=6). MDSC:T cell ratios were as indicated. *p<0.05, **p<0.01, ***p<0.001. BM, bone marrow; CCR5, C–C chemokine receptor; CFSE, carboxyfluorescein succinimidyl ester; GM-CSF, granulocyte macrophage colony-stimulating factor; IL, interleukin; IMC, immature myeloid cells; MDSC, myeloid-derived suppressor cells; MFI, median fluorescence intensity; MSC, myeloid suppressor cell line; ROS, reactive oxygen species.
This led us to further elucidate the involvement of IL-6 and GM-CSF in the acquisition of MDSC immunosuppressive properties in vitro. GM-CSF alone was able to cause a significant induction of PD-L1 expression, which was not increased further by adding IL-6 (figure 4D). Interestingly, GM-CSF alone was not able to stimulate ROS production by MDSC (figure 4E). However, the ROS production was significantly increased in MDSC differentiated with IL-6 and GM-CSF as compared with CD11b+Gr1+ cells from freshly isolated bone marrow or to MDSC differentiated with GM-CSF only (figure 4E). In line with the finding that IL-6 can upregulate Arg1 mRNA, MDSC differentiated with IL-6 and GM-CSF showed significantly higher Arg activity compared with cells differentiated with GM-CSF only (figure 4F). Finally, the suppression of CD8+ T cell proliferation mediated by the MDSC differentiated with IL-6 and GM-CSF was significantly stronger than that of MDSC differentiated with GM-CSF only (MDSC:T cell ratio=1:1; figure 4G). In conclusion, although GM-CSF alone was able to induce the expression of CCR5 and immunosuppressive properties of MDSC, adding IL-6 to the culture could significantly enhance both CCR5 upregulation and immunosuppressive capacity of these cells.
Next, we performed a microarray analysis, comparing the MDSC differentiated with IL-6 and GM-CSF and those differentiated with GM-CSF only. In total, there were 1787 genes differentially regulated with an adjusted p<0.05 when comparing both groups. Of these genes, 880 were expressed higher in MDSC generated by IL-6 and GM-CSF compared with those differentiated by GM-CSF alone, and 907 genes showed lower expression (figure 5A). Among genes with an increased expression were those coding for matrix metalloproteinase (MMP)8,–13 and −19, IL-1β as well as for chemokines CCL9, CCL7 and CCL8 and chemokine receptors CXCR4 and CXCR2 (figure 5B). Genes with lower expression were a part of the antigen processing and presenting machinery, coding for costimulatory molecules like CD80, CD86 and CD40 as well as for cell adhesion molecules (figure 5B). Moreover, a pathway analysis revealed that the MDSC differentiated by IL-6 and GM-CSF displayed an upregulation of metabolism and cell cycle, but a downregulation of endocytosis, cell adhesion, antigen processing and presentation as well as, surprisingly, of JAK-STAT signaling (figure 5C).

Microarray analysis of in vitro generated MDSC. Whole transcriptome of MDSC differentiated in vitro with IL-6 and GM-CSF versus GM-CSF only was analyzed by microarray. (A) Volcano plot shows differentially expressed genes. Red line indicates significance threshold. (B) Heatmap showing differential expression of selected genes important for MDSC functions. (C) Normalized enrichment score (NES) of important significantly regulated pathways found by GSEA pathway analysis using KEGG pathways. GM-CSF, granulocyte macrophage colony-stimulating factor; GSEA, gene set enrichment analysis; IL, interleukin; MDSC, myeloid-derived suppressor cells.
Effect of IL-6 on MDSC in murine melanoma in vivo
Our in vitro and ex vivo findings on the effect of IL-6 on the upregulation of CCR5 expression and acquisition of immunosuppressive capacity of MDSC prompted us to investigate the effects of IL-6 in melanoma in vivo. For this, we performed lentivirus-mediated transduction of Ret melanoma cells to OE IL-6 (online supplementary figure S5A,B). Importantly, we compared the growth of the control and IL-6 OE Ret cells using MTT assay and found no changes in the proliferation of Ret melanoma cells transduced with IL-6 in vitro as compared with Ret cells transduced with the EV (online supplementary figure S5C). Surprisingly, the tumors induced by IL-6 OE Ret cell s.c. injection into C57BL/6 mice showed a tendency to grow slower than those induced with EV control cells (figure 6A). Moreover, the weight of tumors derived from EV control Ret cells was significantly higher compared with IL-6 OE tumors (figure 6B). Studying the tumor-infiltrating immune cells, we observed a minor decrease in the frequency of MDSC in IL-6 OE tumors (figure 6C and online supplementary figure S6) that was accompanied by a minor, non-significant elevation of the frequency of CCR5+ MDSC (figure 6D). However, CD8+ T cells infiltrating tumors in these mice were characterized by a significantly increased frequency among CD45+ leukocytes (figure 6E) and the upregulation of CD69 expression, indicating their activation (figure 6F).
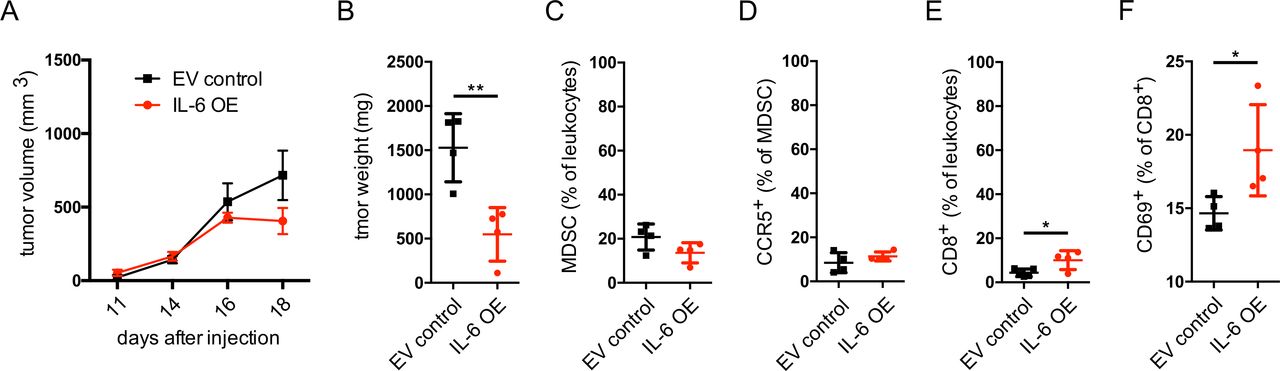
Growth of IL-6 overexpressing Ret melanoma cells in vivo. Ret melanoma cells were transduced to overexpress IL-6 and were injected subcutaneously into C57BL/6 mice. (A) Tumor growth is presented as tumor volume in mm3 (mean±SEM; n=4). (B–F) At day 21, tumor weight was measured, and tumor cell suspension was analyzed by flow cytometry (mean±SD; n=4). (B) Tumor weight expressed in mg. (C) CD11b+Gr1+ MDSC are shown as the percentage within leukocytes. (D) CCR5+ MDSC are shown as the percentage among total MDSC. (E) CD8+ T cells are presented as the percentage within leukocytes. (F) CD69+ cells are shown as the percentage within total CD8+ T cells. *p<0.05, **p<0.01. CCR5, C–C chemokine receptor; EV, extracellular vesicle; IL, interleukin; MDSC, myeloid-derived suppressor cells; OE, overexpressing.
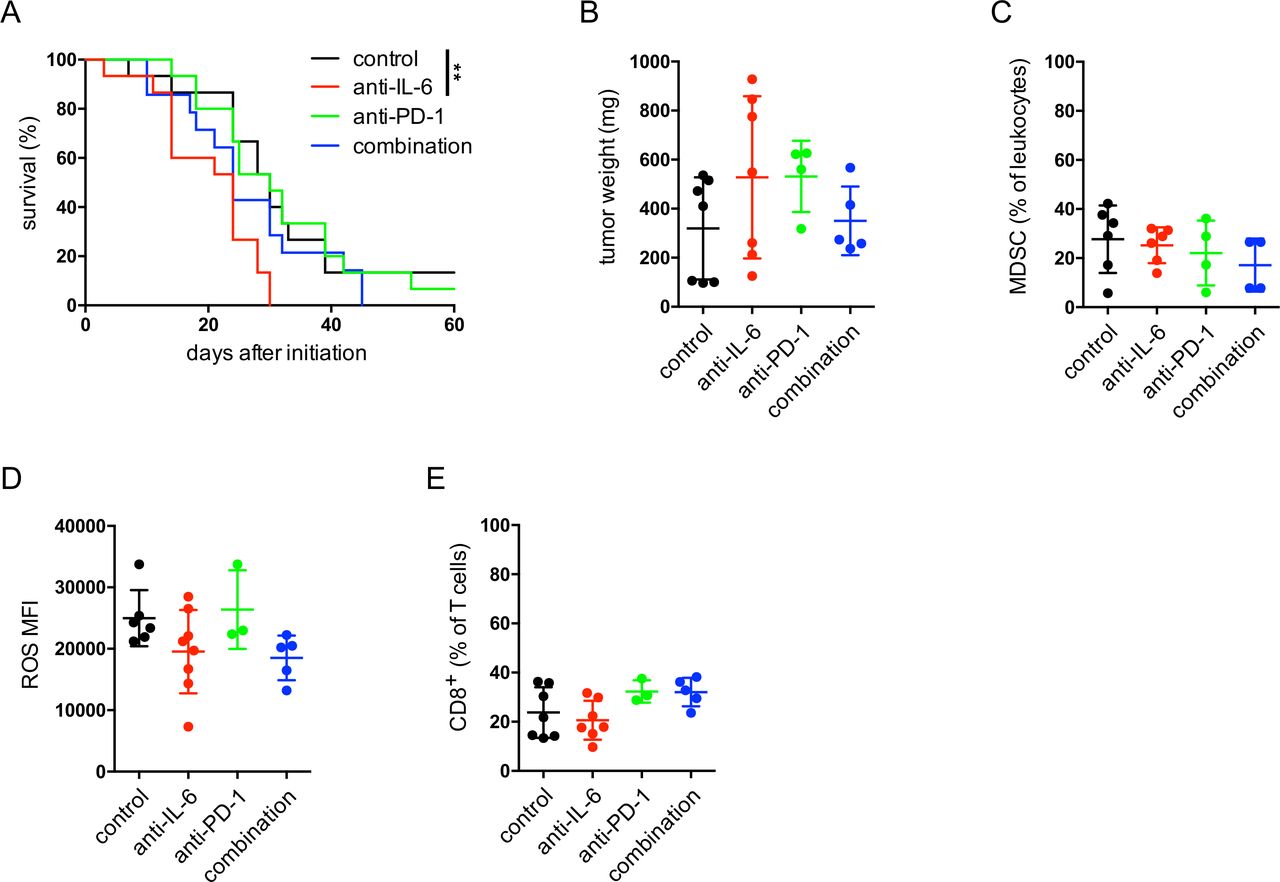
Next, we evaluated the effect of anti-IL-6 antibodies on melanoma progression in RET transgenic mice. The therapeutic blockade of IL-6 led to a significantly accelerated tumor progression as compared with non-treated control group (figure 7A). In addition, the combination of anti-IL-6 and anti-PD-1 antibodies not only failed to improve the survival but even showed a slight tendency for faster melanoma progression as compared with the group with anti-PD-1 therapy alone (figure 7A). After 4 weeks of therapy, tumors from the anti-IL-6 therapy group were characterized by the largest tumor weights (figure 7B). Moreover, we observed no significant changes in the frequency of tumor-infiltrating CD11b+Gr1+ MDSC within leukocytes (figure 7C). A slight, non-significant decrease in ROS production could be detected for MDSC in the anti-IL-6 therapy group (figure 7D) that goes in line with our findings that IL-6 upregulated ROS production by MDSC in vitro (figure 4E). Analyzing the frequency of CD8+ T cells among total T cells, we found their slight reduction in mice treated with anti-IL-6 antibodies as well as a tendency of their elevation in mice injected with anti-PD-1 antibodies as compared with the control group (figure 7E).
Effect of IL-6 blockade combined with anti-PD-1 therapy in melanoma-bearing mice. RET transgenic mice with established tumors were injected intraperitoneally with anti-IL-6 blocking antibodies or with anti-PD-1 therapeutic antibodies for 4 weeks, twice per week. Some mice received both anti-IL-6 and anti-PD-1 antibodies. Control group of mice was treated with isotype control antibodies. (A) Survival of mice is shown as a Kaplan-Meier curve (n=15/group). **p<0.01. In another set of experiments, tumor weight was measured, and immune cells were analyzed by flow cytometry after 4 weeks of therapy. Results are presented as the weight of tumors in mg (mean±SD; n=4–7) (B), as the percentage of CD11b+Gr1+ MDSC within leukocytes (C), the MFI of ROS producing MDSC (D) and the percentage of CD8+ T cells within leukocytes (E) (mean±SD, n=3–8). MDSC, myeloid-derived suppressor cells; MFI, median fluorescence intensity; ROS, reactive oxygen species.
Therefore, against our expectations, IL-6 OE tumors were characterized by a slower progression and higher infiltration by activated CD8+ T cells. In addition, the therapy with anti-IL-6 antibodies aggravated melanoma development in RET transgenic mice.
Discussion
We showed previously that CCR5 on MDSC was responsible for their migration to the melanoma microenvironment.20 Here, we investigated the factors responsible for CCR5 upregulation on MDSC. Upon identification of these factors, their blocking could inhibit MDSC migration to the TME, where they suppress activity of tumor-infiltrating T cells.4 We found that IL-6, GM-CSF and IFN-γ upregulated Ccr5 mRNA expression in MSC-2 cell line and IMC. IFN-γ was previously reported to induce CCR5 expression on human mononuclear phagocytes and their increased migration towards the CCR5 ligands.29 In addition, IFN-γ was able to stimulate expression of CCR5 at the mRNA and protein level in murine macrophages.30 Although IL-6 and GM-CSF were not yet demonstrated to regulate CCR5 expression, they play an important role in MDSC generation12 and are critical for MDSC differentiation from murine bone marrow in vitro.22
We showed here for the first time that IL-6 and GM-CSF were able to upregulate CCR5 expression during such MDSC in vitro differentiation. Importantly, IL-6 and GM-CSF induced CCR5 upregulation by a STAT3-dependent mechanism, presumably via direct STAT3 binding to the Ccr5 promoter. Furthermore, IL-6, pSTAT3 and CCR5+ tumor-infiltrating MDSC correlated in RET transgenic melanoma-bearing mice. IL-6 and GM-CSF function via the JAK-STAT3 signal transduction pathway in MDSC to induce their generation and expansion.12 Our data suggest that these factors lead also to CCR5 upregulation on MDSC. In RET transgenic mice, increased levels of IL-6 could be detected in the serum of tumor-bearing mice as compared with normal animals.16 Furthermore, IFN-γ and GM-CSF were found to be enriched in fast-growing murine melanomas from RET transgenic mice.17 Since we observed here that IFN-γ also upregulated Ccr5 mRNA expression, an influence of this cytokine and its downstream signaling on CCR5 expression (in addition to IL-6 and GM-CSF via STAT3) could be suggested.
Interactions between CCR5 and its ligands were already shown to play a critical role in MDSC recruitment to the TME in melanoma,20 prostate cancer,31 non-small cell lung cancer32 and gastric cancer.33 Interestingly, CCR5+ MDSC from melanoma lesions of RET transgenic mice were more immunosuppressive as compared with their CCR5− counterpart.20 Furthermore, in an ectopic prostate cancer mouse model, CCR5+ MDSC displayed elevated Arg1 expression and stronger capacity to inhibit CD4+ T cell proliferation.31 These authors proposed that CCR5 ligands could induce Arg1 expression on CCR5+ MDSC and thereby mediate the increased immunosuppressive capacity. Another publication reported that MDSC from CCL5 knockout mice-bearing breast cancer were less immunosuppressive than these cells from tumor-bearing wild-type mice.34 These data are supported by another observation that MDSC from CCL5 knockout mice with breast tumors expressed less NOS2 and S100A8/9 and showed rather immunostimulatory than immunosuppressive phenotype.35 In contrast, we failed to demonstrate an induction of immunosuppressive factors and activities of IMC and MDSC mediated by CCR5 ligands (including CCL5) in vitro, suggesting that CCR5 ligands might not be directly responsible for stimulating the immunosuppressive functions of MDSC.
Importantly, we found that IL-6 could upregulate Arg1 expression and its enzymatic activity in MSC-2 cells via a STAT3-dependent mechanism and that MDSC differentiated in the presence of both IL-6 and GM-CSF displayed augmented inhibition of T cell proliferation as compared with MDSC generated with GM-CSF only. Although we found that GM-CSF induced the upregulation of PD-L1, which is in agreement with other publications,22 36 adding IL-6 to GM-CSF led to a significant elevation of Arg activity and ROS production as compared with GM-CSF alone. IL-6 was previously demonstrated to play a role in the accumulation and activation of MDSC and to correlate with increased MDSC frequency in different cancer types, including melanoma.17 37 Moreover, the treatment of healthy donor PBMC with IL-6 for 6 days in vitro resulted in an enrichment of CD14+HLA-DR− cells, as well as an increase of the expression of pSTAT3, Arg1 mRNA and ROS production in these cells.38 Tumor-infiltrating and circulating M-MDSC from head and neck squamous cell carcinoma patients displayed higher pSTAT3 levels that correlated with the upregulation of Arg1 expression and activity.39 In the same study, it was reported that STAT3 inhibition decreased Arg1 activity and MDSC immunosuppressive function; furthermore, it was demonstrated by ChIP that STAT3 binds to the human ARG1 promoter. Recently, it has been reported that CD14+ immunosuppressive myeloid cells from pancreatic cancer patients expressed STAT3 and ARG1 genes, whereas cells without immunosuppressive capacity from the same patients lacked a distinct STAT3/ARG1 transcriptomic gene signature.40 Our findings together with other publications indicated that IL-6 resulted in Arg1 upregulation of MDSC via a STAT3-dependent mechanism that represents an important pathway inducing MDSC immunosuppressive capacity in cancer patients. In addition, IL-6 led to increased ROS production that could also be mediated by a STAT3-dependent mechanism through upregulation of Nox2 enzyme.10
Interestingly, our microarray data revealed that MDSC generated with IL-6 and GM-CSF displayed increased expression of Mmp genes, which are involved in promoting metastasis by MDSC.4 Importantly, these MDSC expressed significantly decreased levels of genes implicated in antigen presentation and delivery of costimulatory signals to T cells that could further contribute to the pro-tumor function of MDSC.
Based on our in vitro findings on the effect of IL-6 on CCR5 expression and acquisition of immunosuppressive capacity of MDSC, we investigated the effects of IL-6 modulation in melanoma in vivo. Strikingly, we found that the growth of Ret melanoma tumors OE IL-6 was decreased, whereas the therapeutic targeting of IL-6 with respective antibodies led to the accelerated tumor progression in RET transgenic melanoma-bearing mice. IL-6 was reported to show both pro-inflammatory and anti-inflammatory properties in cancer.13 IL-6 signaling stimulated the expression of T cell attracting chemokines.41 Moreover, IL-6 could prevent the apoptosis of T cells via the STAT3-dependent upregulation of antiapoptotic factors and the modulation of Fas receptor expression.42 43 This could explain our observation on increased frequency and activation of tumor infiltrating CD8+ T cells in mice injected with IL-6 OE melanoma cells and slightly decreased frequency of CD8+ T cells in tumors from mice treated with anti-IL-6 antibodies. Regarding tumor-infiltrating MDSC, we observed only a slight decrease in ROS production in mice treated with anti-IL-6 antibodies and a small increase in the frequency of CCR5+ MDSC in IL-6 OE tumors that was in agreement with our in vitro findings. In addition, the observed reduction in MDSC frequency in IL-6 OE melanomas could be due to the smaller size of these tumors since MDSC frequency was previously shown to be positively correlated with the melanoma weight.17
Therefore, in melanoma models studied here, the effect of IL-6 on T cells seemed to be stronger than its impact on MDSC which is in agreement with previous publications.13 44 A high IL-6 secretion by IL-6 OE Ret melanoma cells early during tumor development could be rather capable of the activation of antitumor T cells before the generation of MDSC and their accumulation in the TME occurred due to the long-term production of IL-6 under chronic inflammatory conditions. Therefore, timing and intensity of the IL-6 production could play an important role in IL-6 effects on the antitumor immunity.
Several preclinical studies highlighted the efficacy of IL-6 targeting as a potential cancer therapy earlier. IL-6 blockade was demonstrated to reverse the resistance to anti-PD-1 therapy and prolong mouse survival in mouse models of hepatocellular carcinoma45 and colorectal cancer.46 In various murine models for pancreatic cancer, the combined treatment with anti-IL-6 and anti-PD-1 antibodies displayed anti-tumor efficacy and stimulated T lymphocyte infiltration.47
In addition to its effect on immune cells, IL-6 targeting could have an inhibitory effect on cancer cells, since IL-6 was reported to promote their survival, proliferation and invasiveness.13 In contrast, it has been reported that the inhibition of IL-6 signaling could induce immune tolerance in autoimmune diseases or organ transplantation.48 Furthermore, IL-6 receptor deficiency was found to cause immunodeficiency and aberrant inflammatory responses in patients.49
Conclusion
Taken together, our data highlight a key role of IL-6 in the upregulation of CCR5 expression on MDSC together with the upregulation of Arg1 activity and ROS production as well as the acquisition of immunosuppressive function. Interestingly, a direct stimulation of CCR5–CCR5 ligand signaling with respective chemokines did not enhance the immunosuppressive capacity of MDSC, indicating the importance of CCR5–CCR5 ligand interaction only for MDSC recruitment to the TME and not for their activation. Despite a strong stimulation of MDSC immunosuppressive functions via IL-6 in vitro, the targeting of this cytokine in mouse models of skin melanoma in vivo unexpectedly failed to display a beneficial therapeutic impact. The pleiotropic effects of IL-6 on various immune cell populations (including T cells) make it necessary to decipher, in which combination approaches, therapy timing, cancer types and patient groups, IL-6 blockade can be used for effective tumor immunotherapy.
Acknowledgments
We thank Dr. Stefano Ugel (University of Verona, Italy) for providing the MSC-2 cell line and Dr. Izumi Nakashima (Chubu University, Aichi, Japan) for providing the RET transgenic mice. We thank Dr. Aniello Federico and Dr. Daniel Novak (both German Cancer Research Center (DKFZ), Heidelberg, Germany) for the assistance with the IL-6 overexpression plasmid. We thank the microarray core facility of the DKFZ Heidelberg for carrying out the microarray analysis.
References
Footnotes
Contributors VU, JSU and RW designed the study. RW, ZR, LH, AS, CG and XH preformed the experiments and the data analysis. CS performed the bioinformatic microarray data analysis. RW and VU wrote the manuscript. All authors read and approved the manuscript.
Funding This work was supported by the Deutsche Forschungsgemeinschaft (DFG, German Research Foundation)—Project number 259332240/RTG 2099 (to JSU and VU) and the Cooperation Program in Cancer Research of the DKFZ Heidelberg and Israel's Ministry of Science, Technology and Space (MOST, CA181 to VU).
Competing interests None declared.
Patient consent for publication Not required.
Ethics approval Murine in vivo studies were approved by the German local authority (G-4/14, G-40/19, G-73/18) and conducted respecting ethical and legal rules.
Provenance and peer review Not commissioned; externally peer reviewed.
Data availability statement All data relevant to the study are included in the article or uploaded as supplementary information. The raw data sets generated, used and analyzed during the current study are available from the corresponding author on reasonable request. The microarray data generated during the study are available from the GEO repository under the number GSE148293.