Article Text

Abstract
Background EML4-ALK is a distinct molecular entity that is highly sensitive to ALK tyrosine kinase inhibitors (TKIs). Immune checkpoint inhibitors (ICIs) have not proved efficacy in ALK-positive non-small cell lung cancer so far. In this study, we performed a mouse clinical trial using EML4-ALK transgenic mice model to comprehensively investigate immunomodulatory effects of ALK TKI and to investigate the mechanisms of resistance to ICIs.
Methods EML4-ALK transgenic mice were randomized to three treatment arms (arm A: antiprogrammed death cell protein-1 (PD-1), arm B: ceritinib, arm C: anti-PD-1 and ceritinib), and tumor response was evaluated using MRI. Progression-free survival and overall survival were measured to compare the efficacy. Flow cytometry, multispectral imaging, whole exome sequencing and RNA sequencing were performed from tumors obtained before and after drug resistance.
Results Mouse clinical trial revealed that anti-PD-1 therapy was ineffective, and the efficacy of ceritinib and anti-PD-1 combination was not more effective than ceritinib alone in the first line. Dynamic changes in immune cells and cytokines were observed following each treatment, while changes in T lymphocytes were not prominent. A closer look at the tumor immune microenvironment before and after ceritinib resistance revealed increased regulatory T cells and programmed death-ligand 1 (PD-L1)-expressing cells both in the tumor and the stroma. Despite the increase of PD-L1 expression, these findings were not accompanied by increased effector T cells which mediate antitumor immune responses.
Conclusions ALK-positive tumors progressing on ceritinib is not immunogenic enough to respond to immune checkpoint inhibitors.
- immunotherapy
This is an open access article distributed in accordance with the Creative Commons Attribution Non Commercial (CC BY-NC 4.0) license, which permits others to distribute, remix, adapt, build upon this work non-commercially, and license their derivative works on different terms, provided the original work is properly cited, appropriate credit is given, any changes made indicated, and the use is non-commercial. See http://creativecommons.org/licenses/by-nc/4.0/.
Statistics from Altmetric.com
Background
Molecular profiling of non-small cell lung cancer (NSCLC) has led to the discovery of a diverse catalog of genetic aberrations that drive and sustain tumorigenesis. Of these, EML4-ALK rearrangement represents an example of a lung oncogenic driver that can be therapeutically targeted.1 Numerous randomized trials and meta-analyses have been conducted to suggest the superiority of ALK tyrosine kinase inhibitors (TKIs) over cytotoxic chemotherapy in the treatment of ALK-rearranged NSCLC. These trials showed consistent and significant advantages of ALK TKIs in terms of both objective response rate (ORR) and progression-free survival (PFS).2–6 Despite the excellent disease control with initial ALK TKI therapy, acquired resistance to ALK TKI invariably develops and the strategy to overcome resistance remains a key challenge.
The recent ‘game-changer’ in the treatment of NSCLC is immune checkpoint inhibitors (ICIs). Antiprogrammed death cell protein-1 (PD-1) or antiprogrammed death-ligand 1 (PD-L1) is able to induce durable long-term remissions, with superior antitumor efficacy compared with conventional chemotherapy in the frontline setting.7 However, the majority of clinical trials have limited the use of ICIs to patients with EGFR mutation or ALK fusion wild type, meaning that these oncogene-addicted patients have been excluded from the benefit of ICIs. There are pieces of evidence that ICIs are less efficacious in oncogene-addicted patients. In multiple clinical trials and retrospective studies, ICIs have shown minimal benefit in never-smoking patients.7–9 In the phase II ATLANTIC study of durvalumab, no responses were observed among 15 patients with ALK-positive NSCLC.10 In addition, retrospective analysis on the efficacy of ICIs in patients with NSCLC with targetable oncogenes (ImmunoTarget) revealed that the ORR of ICIs was 0% among ALK-positive patients.11 Several trials assessing the combination of ALK TKI with ICIs have also been reported, and the efficacy of ALK TKI in combination with ICIs in treatment-naïve patients (alectinib and atezolizumab) showed a response rate of 86%, with median PFS of 21.7 months.12 Considering the impressive PFS of 34.8 months obtained with the first-line alectinib in the phase III ALEX trial,13 it does not seem that combination of alectinib and atezolizumab is more advantageous than alectinib monotherapy.14 More recently, a combination of ceritinib plus nivolumab was shown to have activity, particularly in patients with high PD-L1 expression.15 However, significant hepatotoxicities, as represented by increased ALT level, were reported in combination trials consisting of ALK TKI and ICIs,15 16 and the mechanisms underlying hepatotoxicities remain unknown.
Several explanations to these poor outcomes of immunotherapy in ALK-positive patients with NSCLC have been identified, such as the association of ALK rearrangement with low tumor mutation burden (TMB),17 a lack of T-cell infiltration9 and variable PD-L1 expression.10 18 However, the number of patients in these studies was very low, and the results were only exploratory.
Before we conclude that a single agent ICI or a combination of ALK TKI and ICI has no additional value to ALK-positive patients, we need further understanding of dynamic changes of the tumor-immune microenvironment in response to treatments. In this study, we aimed to investigate the comprehensive immunomodulatory potential of ALK inhibitor and ICIs in ALK-positive NSCLC by using an EML4-ALK transgenic mice model. We have previously reported the utility of EML4-ALK transgenic mice which recapitulates human ALK-positive lung adenocarcinoma.19 Using this model, we conducted a mouse clinical trial and compared both efficacy and toxicity of different treatment regimens. We also analyzed comprehensive immunodynamics and immunoreactivity in response to different treatments.
Methods
EML4-ALK transgenic mice
This study followed worldwide standard animal care condition via Institutional Animal Care and Use Committee (IACUC). The research proposal was approved by Yonsei University IACUC (2014-0249). All experimental mice were housed in colony cages and maintained on a 12-light:12 hours dark cycle in the Association for Assessment and Accreditation of Laboratory Animal Care International-certified specific pathogen-free facility. Conditional EML4-ALK transgenic mice were generated as described previously.19 Genotypes of EML4-ALK transgenic mice were confirmed by PCR with the following three primers: pCB-F: 5’-TGT CTG GAT CCC CAT CAA GC-3’, mEML4-intron-F-5’-TTA CCT GCT GTG CCA TCC TG-3’, EML4-R_common: 5’-GAA CTC GTG ACT CAA GAG CTG-3’. For tumorigenesis, mice were treated with tamoxifen twice a week. For tumorigenesis, treatment with tamoxifen is needed for activation of Cre-ERT2. Tamoxifen (Sigma Chemical, St. Louis, Missouri, USA) was given intraperitoneally twice at a 3-day interval, and all mice developed lung tumors after 1 week.
Drug treatment in transgenic mice
After tumor formation was confirmed on MRI, mice were treated with ALK inhibitor, ceritinib. Ceritinib was provided by Novartis Pharmaceuticals, and stored in −20ºC until use. Before treatment, ceritinib was diluted with 20% PEG400, 3% Tween-80, based on deionized water. The diluted ceritinib was homogenized and vortexed vigorously, and used within 24 hours. Anti-PD-1 (BioXcell, West Lebanon, New Hampshire) used was the RMP1-14 monoclonal antibody which reacts with mouse PD-1 also known as CD279. The drug was stored 4ºC until use and diluted with phosphate-buffered saline. Anti-PD-1 treatment was injected intraperitoneally twice a week at the dose of 200 µg per mouse.
MRI and tumor measurement
The optimization of MRI was completed before the beginning of the study. For MRI, the mice were anesthetized with isoflurane in 100% oxygen. MRI protocols were optimized for assessing lung parenchyma at 9.4 T (BioSpec 94/20 USR MRI system (Bruker, Billeria, Massachusetts)). All tumors were analyzed on T2-weighted image. One week after intraperitoneal treatment with tamoxifen, tumor size was measured on MRI. Then TKIs were treated after the first MRI. The tumor measurement and response evaluation criteria are as following: (1) complete response (CR) is defined as complete disappearance of all tumor lesions, (2) partial response is defined as >30% shrinkage in the sum of tumor diameter from baseline, (3) progressive disease (PD) is defined as the growth of tumor size of >20% from the baseline (online supplementary figure S1). PFS was defined as the start of the drug treatment until the date of disease progression.
Supplemental material
Flow cytometry
Tumor tissue was dissociated by collagenase, and then isolated cells were preserved in liquid nitrogen tank with frozen media until use. Samples were stained with the following antibodies: mCD3e (145-2C11; eBioscience), mCD4 (RM4-5; eBioscience), mCD8a (53-6.7; eBioscience), mCD25 (PC61.5; eBioscience), mCD44 (IM7; eBioscience), mGranzyme B (NGZB; eBioscience), mFoxP3 (FJK-16s; eBioscience), mF4/80 (BM8; eBioscience), mCD11c (N418; eBioscience), mCD11b (M1/70; eBioscience), mLy-6G (1A8-Ly6G; eBioscience). All samples were run on LSRFortessa (BD biosciences) and analyzed with FlowJo software (Tree Star).
Enzyme-linked immunosorbent assay
Measurement of interferon (IFN)-γ and interleukin (IL)-12p40 in the serum of transgenic mice was performed using ELISA kit (Biolegend, San Diego, California, USA). Optical density reading at 450 nm were measured using a VERSAmax microplate reader (Molecular Devices). The cytokine concentration was normalized by protein concentration which has been measured by BCA kit (Thermo Fisher, USA).
Multiplexed immunohistochemistry
Immunohistochemical protocols were performed using 4 mm thick sections, mCD8 antibody (Cell Signaling) as primary antibody. All slides were stained by Bond RX fully automated staining device (LEICA), scanned by Vectra Polaris (Perkin Elmer), and analyzed by Phenochart and InForm (Perkin Elmer) according to the manufacturer’s protocol. The anti-mPD-L1, anti-Pan-CK, anti-mCD8, anti-mFoxp3, anti-mPD-1 and anti-mGranzyme B antibodies were applied for multiplex immunohistochemistry. The InForm software was used for analysis tissue and cell segmentation. The individual cells including target expression were integrated and converted by R (V.3.6.1). The converted matrix files were analyzed for deconvoluted results by FlowJo software (V.10.6.2).
RNA sequencing and TCR repertoire analysis
Total RNA was extracted from vehicle and ceritinib-resistant tumors using TRIzol RNA isolation reagents (Life Technologies, Carlsbad, California, USA). RNA integrity was analyzed using a bioanalyzer with the Agilent RNA 6000 pico kit (Agilent Technologies, Santa Clara, California, USA). The extracted total RNA was processed to prepare the mRNA-sequencing library using the TruSeq stranded mRNA LT sample preparation kit (Illumina, San Diego, California, USA) according to manufacturer’s instructions. All samples were sequenced on an Illumina HiSeq2500 sequencer using paired-end 100 bp reads. The raw image data were transformed by base-calling into sequence data and stored in FASTQ format. Paired-end reads of the five independent samples were trimmed for both PCR and sequencing adapters with Cutadapt (http://cutadapt.readthedocs.io/en/stable/; V.1.16). Trimmed reads were aligned to the GRCm38 mouse reference genome using STAR (V.2.6.0a)20 and gene-level read counts were generated using feature Counts function from the Subread package (V.1.6.2).21 The presence of significant differential expression was determined by DESeq2 package (V.1.26)22 at the gene level. All gene sets in V.7.0 of the Molecular Signatures Database were analyzed by V.4.0.3 of gene set enrichment analysis (GSEA) and corrected for multiple hypothesis testing. The p value threshold was set at 0.05.23 Heatmaps of differentially expressing genes was generated using the prism (V.8.0). To analyze TCR repertoire, the high-depth RNA sequencing was performed. TCR sequences were extracted by V.3.0 of MiXCR, and analyzed by TcR packages (V.2.2.4.1).
Whole exome sequencing
SureSelect (target enrichment system) was applied for exome capture sequencing process. The hybridized genome sample with biotinylated RNA library ‘BAITS’ was mixed with streptavidin-coated magnetic beads. The bead captured genomes were washed and RNA digest. The collected genome particles were analyzed by next-generation sequencing. The FASTQ file was generated by RTA V.1.12.4/CASAVA V.1.8.2. The FASTQ files were aligned on mm10 genome reference, then generated to BAM file. Extract mappable read, on-target reads, SNP and Indels were generated by analysis pipe lines. The read mapping was performed by BWA. The mark duplicates filter (Picard), Indel realignment (GATK) and base recalibration were performed for variant calling. The GATK was used for variant calling, variant filtering.
Masson’s trichrome and reticulin staining of liver tissue
In sections stained with Masson’s trichrome stain, collagen staining was separately quantitated in the liver. Gomori’s silver impregnation methods for reticulin fibers were carried out on formalin-fixed, paraffin-embedded sections mounted on glass slides. Three slides per group were analyzed. The proportional area of blue stain in each section was recorded by using analytical imaging software, and the average from five fields was calculated to yield a relative value of collagen staining per field.
Statistical analysis
Survival analyses were estimated using Kaplan-Meier method and associated 95% CIs. All statistical analyses and graphs were performed using SPSS V.23.0 software (IBM, Chicago, Illinois, USA) and GraphPad Prism (V.8.0).
Results
Mouse clinical trial shows anti-PD-1 treatment is ineffective in ALK-positive lung cancer
We designed a three-arm trial consisting of anti-PD-1 and ceritinib to evaluate the efficacy and toxicity of each treatment. The schematic design of this study is shown in figure 1A. Mice in each arm were allocated to the following treatment arms. arm A: anti-PD-1 followed by ceritinib (n=9), arm B: ceritinib followed by anti-PD-1 (n=11) and arm C: anti-PD-1 and ceritinib combination (n=6). When tumors showed progression in arm A and arm B (defined as PD1), second-line therapy was designated as the following: anti-PD-1 was switched to ceritinib and was continued until progression (PD2), ceritinib was switched to anti-PD-1 and was continued until progression (PD2). During the drug treatment, MRI was performed every week to measure tumor size and objective response was determined as described in online supplementary figure 1.

Mouse clinical trial reveals that antiprogrammed death cell protein-1 (PD-1) therapy is ineffective in treatment-naïve ALK-positive lung cancer. (A) Schematic diagram showing the three treatment arms. Arm A consists of anti-PD-1 followed by ceritinib (n=9), arm B consists of ceritinib followed by anti-PD-1 (n=11) and arm C consists of anti-PD-1 and ceritinib combination (n=6). PFS1 is defined as the time duration from drug treatment until first progression. PFS2 is defined as the time duration from second drug treatment until second progression. (B) Swimmer’s plot of treatment duration. The three arms of treatments are indicated as arm A, arm B and arm C, and the schedule of ceritinib, anti-PD-1 and micro-MRI is depicted below the X-axis. Lines of treatment and time points of complete response (CR), partial response (PR) and progressive disease (PD) was marked by colors and symbols (red=anti-PD-1, blue=ceritinib, green=anti-PD-1 plus ceritinib, white circle=CR, yellow circle=PR, black circle=PD and black arrow=ongoing). (C) Representative coronal T2-weighted MRI images are shown. A mouse treated with anti-PD-1 alone showing disease progression (arm A), a mouse treated with ceritinib showing initial response then progression after drug resistance (arm B) and a mouse treated with ceritinib and anti-PD-1 combination showed initial response then progression after drug resistance (arm C). (D) Progression-free survival (PFS) as determined by Kaplan-Meier curves is shown for arm A, arm B and arm C. PFS1, PFS2 and PFS1+2 were compared between individual arms by log-ranked analysis. The median survival, CI and statistical significance are demonstrated (two-way analysis of variance, p value: ns, non-significant, ***p<0.001 and ****p<0.0001).
The swimmer’s plot in figure 1B shows the treatment duration of three arms. Upfront ceritinib (arm B) or ceritinib and anti-PD-1 combination (arm C) clearly produced more durable responses compared with anti-PD-1 alone upfront. Representative MRI images of mouse tumors in each arm are shown in figure 1C. Next, we analyzed the survival outcome of each treatment in terms of PFS and OS (figure 1D). The median PFS1 was 13, 132 and 129 days for arms A, B and C, respectively. As expected, arm B and arm C showed significantly prolonged PFS compared with arm A. The PFS1 of arm B and arm C were not significantly different, suggesting that combination treatment did not prolong PFS in the frontline. The median PFS2 was 99 days for arm A and 7 days for arm B, suggesting that anti-PD-1 treatment after ceritinib resistance was not effective. The median PFS1+PFS2 was 112, 139 and 129 days, respectively, confirming that upfront ceritinib was the most effective treatment regimen while combination of ceritinib and anti-PD-1 did not add any improvement in terms of PFS. These data were in concordance with the data from clinical trials summarized previously.10–12 In addition, we also observed significant hepatotoxicity resulting from ceritinib and anti-PD-1 combination treatment, characterized by fibrosis and infiltration of lymphoplasmacytic cells (online supplementary figure 2A‒D). There was also a significant reduction in body weight after day 20 in the combination-treated group compared with ceritinib group (online supplementary figure 2E). Next, we questioned whether combination treatment after failure on sequential treatment could overcome resistance to either sequential treatment (online supplementary figure 3). Anti-PD-1 was added on after progressing on ceritinib in arm A (n=5), ceritinib or anti-PD-1 was rechallenged in mice progressing on arm B and PFS3 was compared between these groups. There was no significant difference between PFS3 among three groups, and all regimens were not efficacious. Still, partial responses were observed in all mice which may have resulted from remaining ALK-dependent clones reactive to TKI. Altogether, anti-PD-1 treatment was ineffective in ALK-positive lung cancer, either as a single agent, or in combination with ALK TKI in delaying lung cancer progression.
Supplemental material
Supplemental material
Dynamic changes in immune cells and cytokines are observed following treatment
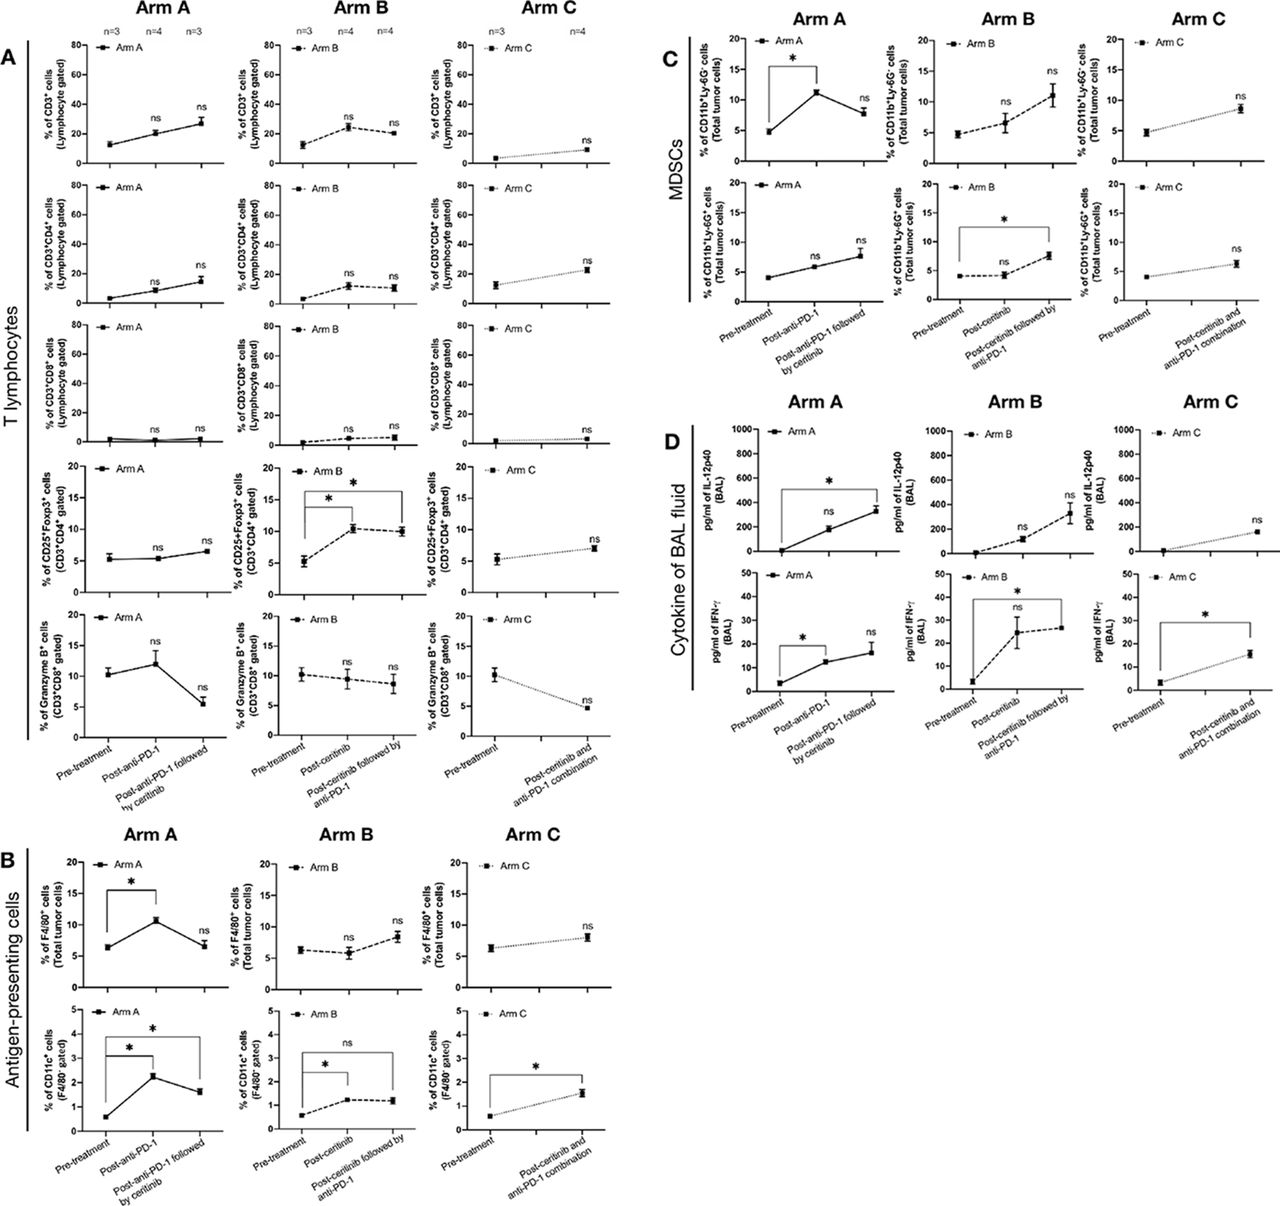
To further investigate immunodynamics following treatment, we examined changes in the tumor immune microenvironment by performing flow cytometry of tumors and bronchoalveolar lavage (BAL) fluid. We compared three subsets of immune cells (T lymphocytes, antigen-presenting cells, myeloid-derived suppressor cells (MDSCs)) at baseline, and at the time of progression. Gating strategies are described in online supplementary figures 4 and 5. Overall, there were no notable changes among T lymphocytes, except regulatory T (Treg) cells (CD3+CD4+CD25+Foxp3+), which showed a significant increase after ceritinib resistance and after ceritinib followed by anti-PD-1 in arm B. Of note, granzyme B production did not alter, implying lack of cytolytic function by CD8+ T cells24 (figure 2A). Among antigen-presenting cells, macrophages (F4/80+) and dendritic cells (CD11c+/F4/80−) increased after anti-PD-1 or ceritinib or combination treatment (figure 2B). Among MDSCs, monocytic MDSCs (CD11b+Ly-6G−) were increased after anti-PD-1, and granulocytic MDSCs (CD11b+Ly-6G+) were increased after ceritinib followed by anti-PD-1 (figure 2C). We also noted changes in the cytokines obtained from BAL fluid (figure 2D), that IL-12p40 which upregulates IFN-γ secretion,25 was increased after anti-PD-1 followed by ceritinib. IFN-γ was increased after anti-PD-1 and ceritinib, which may result from immunogenic cell deaths following treatment26 or may be produced by increased antigen-presenting cells.27 Altogether, we presume that upregulation of IFN-γ following treatment may have stimulated development and recruitment of Tregs, MDSCs, tumor-associated macrophages and dendritic cells in tumor.27 28 To better compare the tumor immune microenvironment before and after treatment, we focused on pretreatment, postceritinib resistance, postcombination resistance samples for further experiments involving multispectral imaging, whole exome sequencing and RNA sequencing.
Supplemental material
Supplemental material

Immunodynamics are shown in tumor microenvironment after progression of sequential and combination treatments. (A) Tumor infiltrating T-cell subsets were measured by anti-CD3, anti-CD4, anti-CD8, anti-Foxp3, antiprogrammed death cell protein-1 (PD-1) and antigranzyme B antibodies in pretreatment and postprogression groups. Total T-cell population was identified by CD3+ cells from total lymphocyte gate. Helper T-cell and cytotoxic T-cell populations were CD3+CD4+ cells and CD3+CD8+ cells, respectively. To identify regulatory T cell, CD25+Foxp3+ cells were measured from helper T cell population. The granzyme B expressing cytotoxic T cells were measured from CD3+CD8+ cells. The number of mice involved in each time point is marked at the top. (B) Antigen-presenting cells, macrophage and dendritic cells were identified by F4/80 and CD11c expression. The F4/80, a pan-macrophage marker was used to identify macrophage population. The dendritic cell population was measured by CD11c+ cells in F4/80− gate. (C) The G-myeloid-derived suppressor cell (MDSC) and M-MDSC were measured by CD11b+Ly-6G+ and CD11b+Ly-6G− cells, respectively. (D) Interleukin (IL)-12p40 and interferon (IFN)-γ expression was measured in bronchoalveolar lavage (BAL) fluid. All data was analyzed with two-way analysis of variance and their significance is marked with symbolic digits (p value: ns, non-significant, *p<0.05).
Comparison of tumor immune microenvironment before and after ceritinib or combination treatment reveals lack of immunogenicity
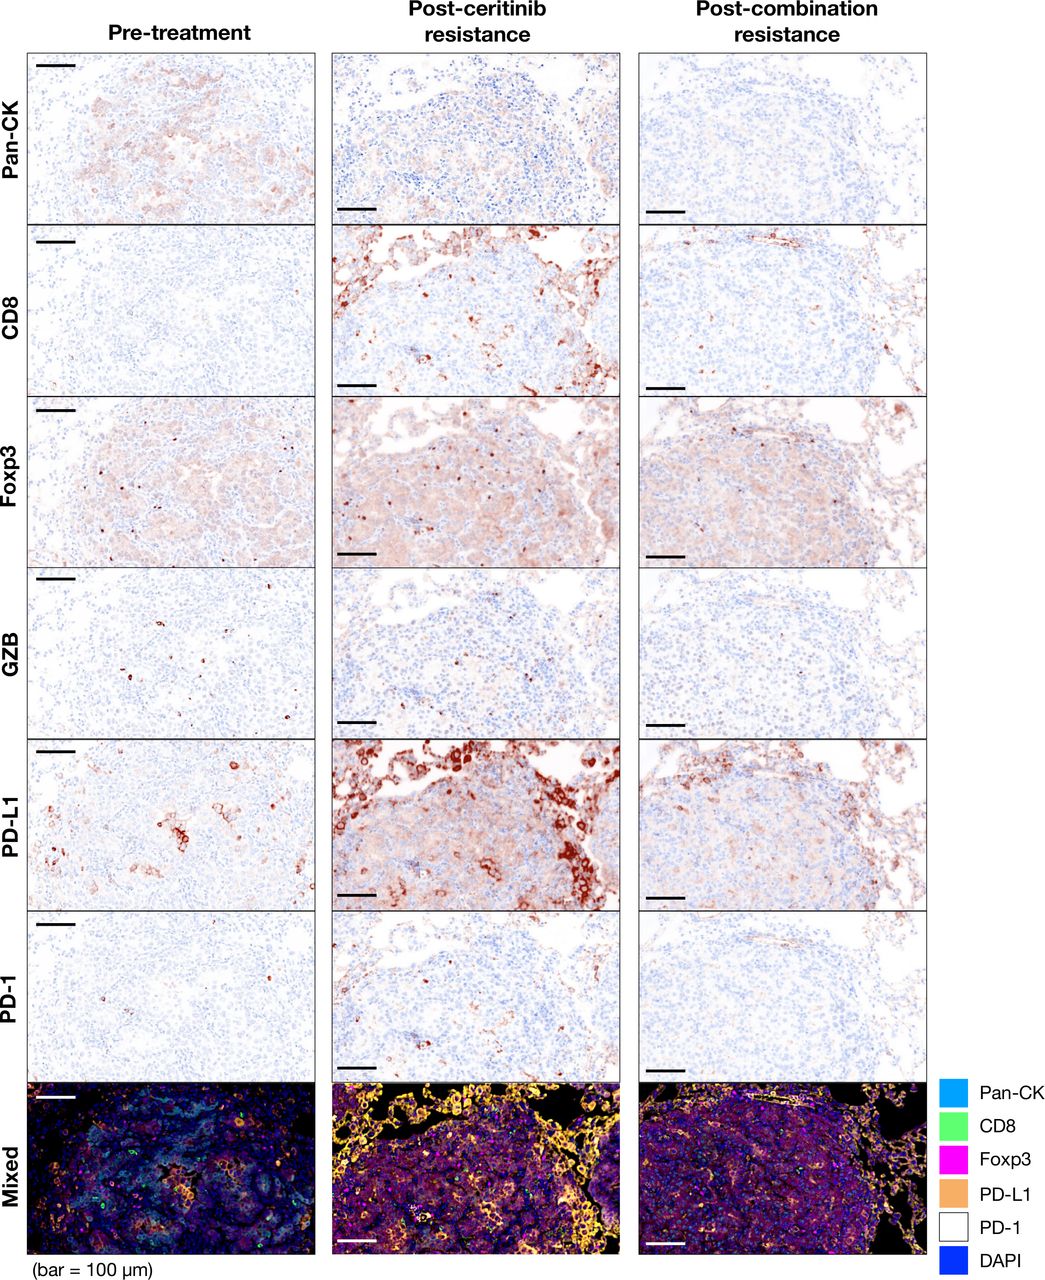
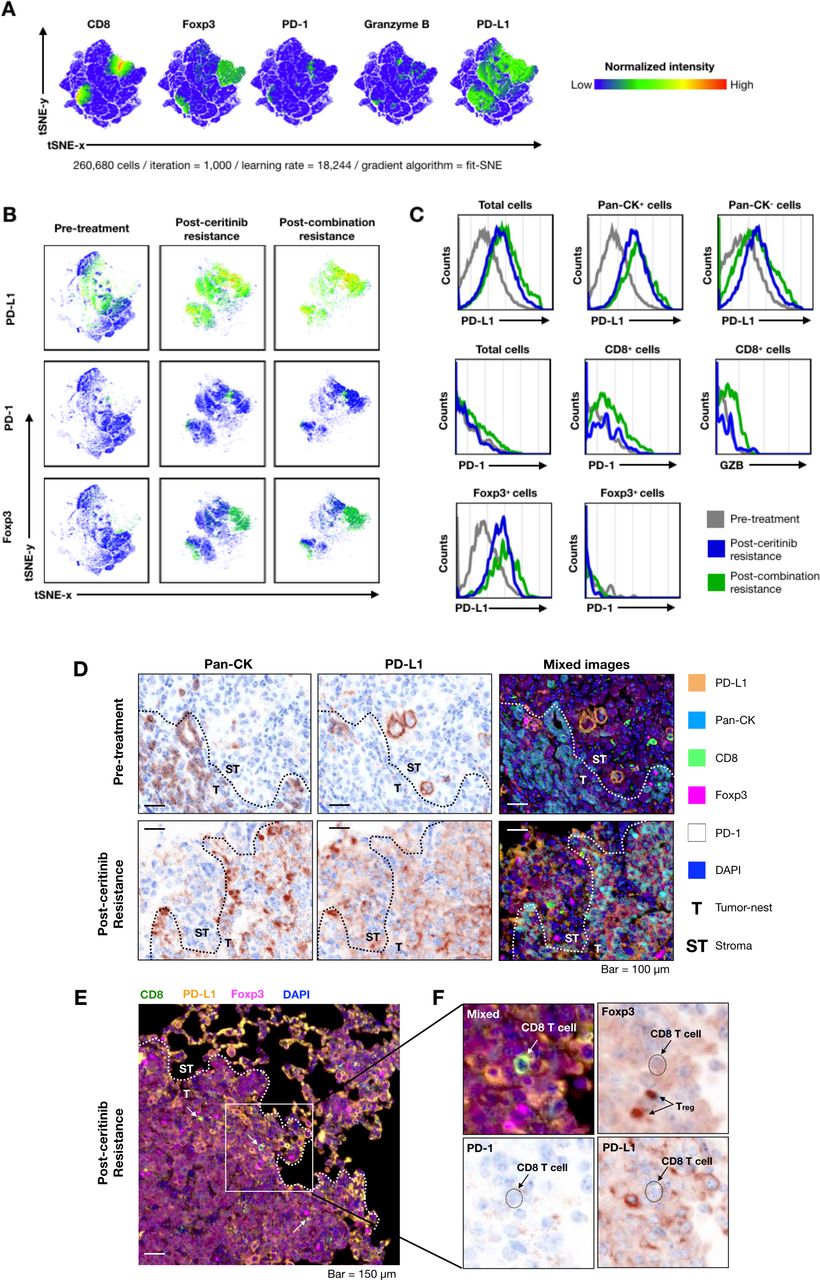
Next, we compared tumor immune microenvironment in the treatment-naïve and ceritinib-resistant and combination-resistant tumors to examine changes in the immune microenvironment. On multispectral imaging, treatment-naïve tumors showed paucity of tumor infiltrating T cells, characterizing the so-called ‘cold tumors’.29 Ceritinib-resistant and combination-resistant tumors showed dramatically increased PD-L1 staining cells, while changes in the expression of CD8, FoxP3, granzyme B and PD-1 staining cells were modest. A representative image is seen in figure 3. For quantification, we further examined the expression of CD8, Foxp3, PD-1, granzyme B, PD-L1-positive cells by deconvolution analysis obtained from multispectral imaging (figure 4A). When we compared expression levels of PD-L1, PD-1 and Foxp3 at pretreatment, postceritinib resistance and postcombination resistance, PD-L1 and Foxp3 were again dramatically increased after ceritinib and combination resistance, but not PD-1 expression (figure 4B). Phenotypic analyses revealed that PD-L1-expressing cancer cells were increased after ceritinib and combination treatment, while there were no significant changes in PD-1-expressing CD8+ T cells and granzyme B-expressing CD8+ T cells, suggesting that these CD8+ T cells may not be cytotoxic (figure 4C). Segmentation of tumors from tumor nest and stroma showed upregulation of PD-L1 staining cells both in the tumor nest and stroma after ceritinib resistance (figure 4D). A close up image of ceritinib-resistant tumor showed staining of CD8+ T cells surrounded by PD-L1-staining cells and Foxp3-positive Treg cells (figure 4E,F). Altogether, we assumed that resistance to ceritinib or combination treatment may lead to increased number of CD8+ T cells which are just bystanders.30

Expression of immune cells and immune activation markers in tumor microenvironment after progression on ceritinib and combination treatment. To analyze expression of immune population and activation markers in tumor, multiplex immunohistochemistry was performed in three groups: pretreatment (n=3), postceritinib resistance (n=3) and postcombination resistance (n=3). The representative images of tumor infiltrating immune cells and activation markers were identified by the following antibodies; Pan-CK (cancer marker), CD8 (cytotoxic T-cell marker), Foxp3 (regulatory T-cell marker), granzyme B and programmed death cell protein-1 (PD-1) (T-cell activation and inhibitory markers). The positive markers displayed brownish color, and the blue color was used for nucleus localization. The mixed image was merged and each image was represented in different index colors (cyan=pan CK, green=CD8, magenta=Foxp3, yellow=programmed death-ligand 1 (PD-L1), white=PD-1 and blue=DAPI).

Deconvolution analysis of multispectral imaging for understanding tumor microenvironment after progression on ceritinib and combination treatment. Multispectral image analysis was performed by InForm software. The individual cell information was extracted from tumor images (n=3 per group). The information of cells was represented using intensity of six markers (Pan-CK, CD8, Foxp3, granzyme B, programmed cell death ligand 1 (PD-L1) and programmed cell death 1 (PD-1)). All cell data were integrated as a large-scale matrix (26,680 cells) to non-biased clustering. The t-Stochastic Nearest Neighbor (tSNE) analysis was performed for dimensional reduction with parameters (iteration=1000, learning rate=18,244, gradient algorithm=fit SNE). (A) The expression of CD8, Foxp3, PD-1, granzyme B and PD-L1 markers were presented as a normalized color gradient expression. The key color was demonstrated at right from tSNE plot. (B) The PD-L1, PD-1 and Foxp3 expression and cell population were individually displayed by groups. (C) Histogram of immune checkpoints and granzyme B expressions were compared with cancer cell and immune cells (gray=pretreatment, blue=postceritinib resistance, green=postcombination resistance). (D) PD-L1 expression of cancer and non-cancer cell populations at both pretreatment and postceritinib-resistant tumor is shown. (E) A CD8+ T cell is surrounded by PD-L1+ cells and regulatory T cells in postceritinib resistance (white arrow=CD8+ T cell, T=tumor nest, ST=stroma). (F) Enlarged image of white box at (E). Individual arrows indicate CD8+ T cell and regulatory T cell. The dot-line marked the location of CD8+ T cell. CD8+ T cell did not express PD-1 on the surface and was surrounded by regulatory T cells (Foxp3+) and PD-L1-expressing cells.
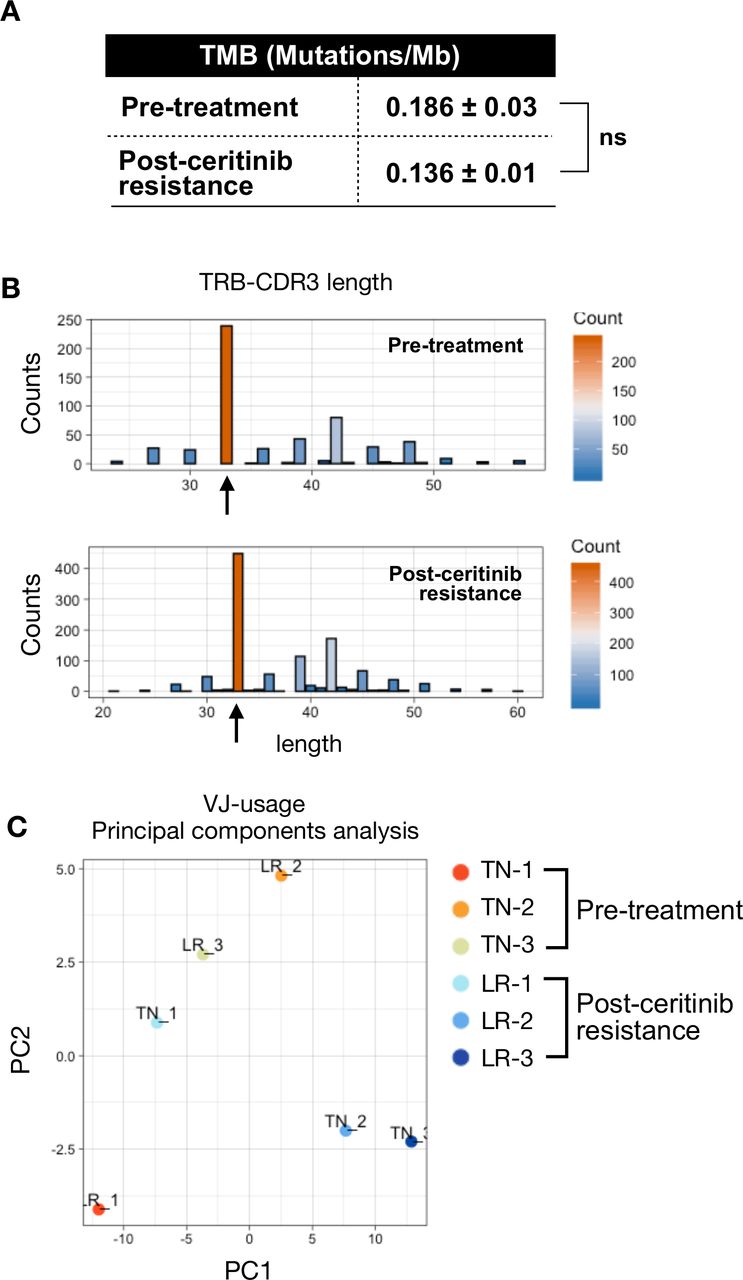
We have previously observed that ALK-positive tumors are resistant to anti-PD-1 treatment either upfront or after ceritinib resistance (figure 1). Treatment-naïve ALK-positive tumors were also devoid of CD8+ T cells (figure 3), suggesting that these tumors are non-immunogenic. To further explore immunological landscape of primary resistance to ICIs, we performed whole exome sequencing of treatment-naïve tumors and ceritinib-resistant tumors. ALK kinase domain of the ALK gene was directly sequenced to identify known resistant ALK mutations, but no known ALK mutation was found (data not shown). When the TMB, as calculated by mutations per mega-base, was compared, there was no significant difference between the two groups (figure 5A). As tumor antigen-specific CD8+ T cells expand clonally during immune response, we analyzed T-cell receptor (TCR) sequences to identify clonally expanded cells as an indicator of tumor specificity. We also compared the changes in CDR3 length which could affect TRB (which encodes TCRβ) sequences. TRB analysis revealed that relative usage frequency of TRBV and TRBJ gene was not significantly different between pretreatment and postceritinib tumor (online supplementary figure 6). We noted that variations in CDR3 length did not affect TCR repertoire (figure 5B, online supplementary figure 7). In addition, there was no significant change in clonality between pretreatment and postceritinib tumor (online supplementary figure 8). Principal component analyses of treatment-naïve and ceritinib-resistant tumors showed a large variation between the two groups (figure 5C). These findings suggest a lack of antigen specificity among CD8+ T cells in ceritinib resistance.
Supplemental material
Supplemental material
Supplemental material

Tumor mutation burden and T-cell receptor (TCR) repertoire of pretreatment and postceritinib-resistant tumor. (A) Tumor mutation burden (TMB) was measured by whole exome sequencing. (P value: NS, non-significant). (B) CDR3 length of TCR-beta were analyzed by MixCR and TcR analysis packages. The black arrow represents the top frequency of CDR3 length. (C) The TCR-beta V and J usages were analyzed by principal component analysis (PCA) with pretreatment and postceritinib treatment groups. The major principal components 1 and 2 were used as PC1 (X-axis) and PC2 (Y-axis) in the PCA plot.
Furthermore, RNA sequencing analysis of pretreatment and ceritinib-resistant tumor was performed to gain a more in-depth understanding of the immune phenotype. Volcano plot comparisons between the pretreatment and postceritinib tumor identified 197 transcripts (145 genes up, 52 genes down) that were differentially expressed between the two cell populations (figure 6A). Network analysis showed that upregulated genes showed a higher clustering coefficient than downregulated genes (online supplementary figure 9). Among upregulated gene set, genes that respond to IFN-γ, as well as negative regulation of immune system process inflammatory response and monocyte chemotaxis were noted by GO term analysis (figure 6B,C). GSEA also revealed that gene transcripts associated with Treg cell differentiation (GO), classically activated macrophage versus type 2 activated macrophage up (GSE4811), and IL-4 versus IL-4 and dexamethasone-treated macrophage up (GSE7568) were significantly enriched in ceritinib-resistant tumors (figure 6D). Dexamethasone and IL-4-treated macrophages help conversion of M2 macrophage to M2c subtype, which plays a role of strong immune suppression and decreased antigen presentation.31 Of note, among the core enrichment genes described in figure 6E, genes involved in Treg cell function such as suppressor of cytokine signaling (SOCS1)32 showed a significant enrichment in ceritinib resistance. These data are concordant with the previous data in figures 2–4 that Treg cells are increased after ceritinib resistance.
Supplemental material

Differentially expressed genes (DEGs) and gene set enrichment analysis (GSEA) between progression of ceritinib and pretreatment groups. (A) A total of 24 052 genes are presented in Volcano plots to compare differentially expressed genes in postceritinib resistance and pretreatment tumors. DESeq2 package was used for folds of gene expression and statistical analysis (folds ≧|2|, p<0.01). The individual gene expression and p values were displayed as colored dots (gray=no-significant and no-folds changes, green=folds >|2|, blue ≤0.01, red=folds ≧|2| and p<0.01). Lower expression of 145 genes and higher expression of 52 genes were identified in postceritinib resistance tumor. (B) The selected DEGs were analyzed by the gene set enrichment with higher expressing 52 genes and lower expressing 145 genes. GO pathway was applied to analyze the meaning of previous results. The presented gene sets were significantly enriched gene sets in GO pathway (FDR >0.05). The indicated gene sets were highly related to previous results (red square dots=high expressed genes, blue square dots=low expressed genes). (C) The heatmaps were presented to show core enrichment genes of previously related gene sets; IFN-γ, negative regulation of immune system process and inflammatory response. The gradient key color presents the expression of individual genes (Z-score normalized). (D) GSEA with MSigdb.v7.0. (12,999 gene sets). Among the significant gene sets, regulatory T cell differentiation (GO), classically activated macrophage versus type 2 activated macrophage up (GSE4811), and IL-4 versus IL-4 and dexamethasone-treated macrophage up (GSE7568) were demonstrated with normalized enrichment score (NES)and p value. (E) The heatmaps were presented to show core enrichment genes.
Discussion
ALK-rearranged lung cancer is an important molecular subtype in Asia, considering that approximately 10% of patients with lung adenocarcinoma in Asian never-smokers carry the activating gene.33 In this regard, the lack of benefit of anti-PD-1/PD-L1 therapy to ALK-rearranged lung cancer treatment raises concern.11 In this study, we confirmed that anti-PD-1 did not have antitumor efficacy in EML4-ALK tumors, either alone or in combination with ceritinib. Combination treatment of ceritinib and anti-PD-1 resulted in a severe hepatotoxicity, recapitulating the results in previous clinical trials.12 16 We observed notable immunodynamics following treatment with anti-PD-1, ceritinib or ceritinib and anti-PD-1 combination. Deep analysis of the immune infiltrates of the tumors revealed that despite the upregulation of PD-L1 in cancer cells, PD-1 and granzyme B-expressing CD8+ T cells did not increase, suggesting that these T cells may not be functional and the efficacy of anti-PD-1 may be limited.
It is known that T-cell response to immunotherapy derives from a distinct repertoire of tumor-specific T cell clones, and robust response to ICIs have been seen in tumors with a high TMB.34 A previous study reported that ALK-positive lung cancer is characterized by low TMB compared with other genotypes, with the median TMB of 2.8 mutations per mega-base,17 suggesting that ALK-positive tumors may not have enough tumor neoantigens that are recognized by the TCR. Given the low TMB, we also looked at whether TMB increased after ceritinib resistance, but there was no significant change in TMB. Furthermore, no significant change in T cell clonality was observed after ceritinib resistance. These data all suggest that primary resistance mechanism to ICIs in both treatment-naïve and TKI-resistant ALK-positive tumors arise from lack of tumor neoantigens that are recognized by the TCR.
For PD-1/PD-L1 inhibitor to work in tumor, we need generation of tumor reactive T cells, activation of effector T-cell function and formation of effector memory T cells.35 If any of these steps does not function, tumor microenvironment may become inhospitable which may preclude proper T-cell function, thereby limiting the efficacy of anti-PD-1. PD-1/PD-L1-independent mechanisms of immune escape may also occur, including activation of alternate immune checkpoints or co-inhibitory receptors, immune suppressive cytokines, immune inhibitory metabolites and immune suppressive cells.36 In our study, we noted that Tregs, as characterized by the expression of the transcription factor Foxp3, were increased after ceritinib resistance in the tumor. This finding is supported by the upregulation of gene expressions related to Treg cell differentiation on RNA sequencing after ceritinib resistance. Tregs are important immune suppressor cells that play a suppressive function in antitumor immunity, and infiltration of Tregs into tumor tissues may evoke suppression of tumor-specific effector T cells.37 The increased Treg cell population might be related to the SOCS1 expression. SOCS1 is necessary for the suppressor function of Treg cells, and plays important roles in Treg cell integrity and function by maintaining Foxp3 expression.32 The increased intensity of Foxp3 on multispectral imaging, increased Treg cell population and suppressed T-cell activity all correlate with each other. Whether or not Tregs played a major role in counteracting efficacy of anti-PD-1 after ceritinib resistance needs to be further explored.
We revealed mechanisms of toxicity when combining ALK TKI and ICI, showing that increased infiltration of lymphoplasmacytic cells in peri-venular areas were inducing hepatic damage. Similarly, recent reports suggested that sequential ICI and crizotinib is associated with a significantly increased risk of hepatotoxicity.26 38 Therefore, we suggest that careful consideration and monitoring for hepatotoxicity may be warranted in ALK-positive patients receiving combination treatment.
Conclusion
We demonstrated that PD-1 inhibitor is not beneficial for ALK-rearranged lung tumors and that combination of ALK TKI and PD-1 inhibitor do not improve survival outcome via EML4-ALK transgenic mice. Dynamic changes of the tumor-immune microenvironment in response to treatments revealed that ALK-positive NSCLC is devoid of tumor recognition and immune-specific tumor killing. We believe that this work leads to a deeper understanding of tumor biology when incorporating ICIs in the treatment of ALK-positive NSCLCs.
Acknowledgments
The authors would like to thank all the lab members for helping this project.
References
Footnotes
K-HP, SML and C-WP contributed equally.
Contributors K-HP, SML were involved in project conceptualization, performed experiments and analyzed flow cytometry and immunohistochemistry staining, and wrote the original manuscript draft. C-WP was involved in transgenic mouse experiment. All authors have read and approved the manuscript.
Funding This study was supported by the National Research Foundation of Korea funded by the Korean government (2017R1D1A1B03032110, 2019R1A2C4069993), Basic Science Research Program through the NRF funded by the Ministry of Science, ICT & Future Planning (2016R1A2B3016282) and research foundation of Yonsei University (No. 6-2019-0128).
Competing interests None declared.
Patient consent for publication Not required.
Ethics approval This study followed worldwide standard animal care condition via Institutional Animal Care and Use Committee (IACUC). The research proposal was approved by Yonsei University IACUC (2014-0249).
Provenance and peer review Not commissioned; externally peer reviewed.
Data availability statement Data are available on reasonable request.