Article Text

Abstract
Background Limited data exist on the role of alterations in HLA Class I antigen processing and presentation machinery in mediating response to immune checkpoint blockade (ICB).
Methods This retrospective cohort study analyzed transcriptional profiles from pre-treatment tumor samples of 51 chemotherapy-refractory advanced non-small cell lung cancer (NSCLC) patients and two independent melanoma cohorts treated with ICB. An antigen processing machinery (APM) score was generated utilizing eight genes associated with APM (B2M, CALR, NLRC5, PSMB9, PSME1, PSME3, RFX5, and HSP90AB1). Associations were made for therapeutic response, progression-free survival (PFS) and overall survival (OS).
Results In NSCLC, the APM score was significantly higher in responders compared with non-responders (p=0.0001). An APM score above the median value for the cohort was associated with improved PFS (HR 0.34 (0.18 to 0.64), p=0.001) and OS (HR 0.44 (0.23 to 0.83), p=0.006). The APM score was correlated with an inflammation score based on the established T-cell-inflamed resistance gene expression profile (Pearson’s r=0.58, p<0.0001). However, the APM score better predicted response to ICB relative to the inflammation score with area under a receiving operating characteristics curve of 0.84 and 0.70 for PFS and OS, respectively. In a cohort of 14 high-risk resectable stage III/IV melanoma patients treated with neoadjuvant anti-PD1 ICB, a higher APM score was associated with improved disease-free survival (HR: 0.08 (0.01 to 0.50), p=0.0065). In an additional independent melanoma cohort of 27 metastatic patients treated with ICB, a higher APM score was associated with improved OS (HR 0.29 (0.09 to 0.89), p=0.044).
Conclusion Our data demonstrate that defects in antigen presentation may be an important feature in predicting outcomes to ICB in both lung cancer and melanoma.
- tumor biomarkers
- antigen presentation
- lung neoplasms
- melanoma
This is an open access article distributed in accordance with the Creative Commons Attribution Non Commercial (CC BY-NC 4.0) license, which permits others to distribute, remix, adapt, build upon this work non-commercially, and license their derivative works on different terms, provided the original work is properly cited, appropriate credit is given, any changes made indicated, and the use is non-commercial. See http://creativecommons.org/licenses/by-nc/4.0/.
Statistics from Altmetric.com
Background
Immune checkpoint blockade (ICB) has improved the survival of patients with a number of advanced malignancies. Antibodies targeting PD1 and its ligand PD-L1 are now approved for multiple cancer types, including non-small cell lung cancer (NSCLC) and melanoma.1–3 However, clinical responses to these therapies vary across tumor types and the majority of cancers treated are unresponsive or develop resistance over time. As a result, we need to develop better predictive biomarkers of response and further understand potential mechanisms of primary and adaptive resistance in order to develop novel therapeutic strategies that might improve both the rate and duration of response.
Several biomarker approaches have emerged to improve patient selection for immunotherapeutic agents. These include the characterization of genetic determinants of response, such as the use of somatic tumor mutation burden (TMB)4 and the presence of microsatellite instability,5 along with the use of markers indicative of an inflamed tumor microenvironment, such as assessment of the tumor-immune infiltrate,6–8 and the use of gene expression signatures of activated T cells.9–11 Recently, a gene expression signature including genes that identify T cells, T-cell activation, interferon (IFN)-responsive genes, chemokine expression and adaptive immune resistance, termed the T-cell-inflamed resistance gene expression profile (GEP), was shown to predict response to pembrolizumab in melanoma, gastric, and head and neck squamous cell carcinomas.9 Our group demonstrated that the genes used in this signature were also predictive of response and survival to checkpoint blockade in patients with metastatic lung cancer.12
However, even in the setting of an inflamed tumor microenvironment, a critical step in neoantigen presentation and cytolytic T-cell responses is the interaction between CD8+ T cells and tumor HLA Class I molecules, which present intracellular peptides on the cell surface for recognition by the T-cell receptor (TCR).13–15 Defects in the expression of HLA class I or proteins involved in the antigen processing machinery (APM) result in reduced antigen presentation and thus facilitate immune evasion. For example, in lung cancer, Perea et al showed that reduced expression of HLA Class I was associated with lower levels of CD8 T-cell infiltration.16
Recent work has highlighted the role of genetic losses of HLA Class I APM molecules in mediating response to ICB. Loss of β2-microglobulin (β2m) in melanoma and lung tumors due to mutations has been found to be associated with the development of resistance to ICB.17–19 A recent report by Chowell et al, examining over 1500 patients with advanced malignancies, showed that genetic loss of heterozygosity in the HLA Class I alleles was associated with resistance to checkpoint inhibitors.20 However, most tumors resistant to checkpoint blockade do not harbor readily identifiable genetic causes of resistance,21–23 suggesting epigenetic mechanisms involving HLA Class I molecules or APM may mediate primary resistance.
Defective expression of HLA Class I and APM proteins are common, with a reported incidence of 73% to 90% depending on the tumor type (with most of the changes being due to down regulation of transcription).24–26 Given the essential role of antigen presentation in a successful anti-tumor immune response, we hypothesized that defects in this pathway would be associated with poor response to ICB. To test this hypothesis, we analyzed transcriptional profiles from advanced NSCLC and melanoma patients treated with checkpoint inhibitors. Our results show a strong correlation between expression of genes involved in the APM process with response and survival outcomes.
Materials and methods
Study design and RNA sequencing
This single-center, retrospective, observational study was conducted at the Hospital of the University of Pennsylvania from September 2013 to August 2018 and was approved by the University’s Institutional Review Board. The Strengthening the Reporting of Observational Studies in Epidemiology (STROBE) statement was followed to ensure the quality of data reported in this study.27
Lung cohort: Patients with chemotherapy-refractory metastatic NSCLC treated with anti-PD1 or anti-PD-L1 antibodies that had sufficient residual formalin-fixed paraffin-embedded (FFPE) tumor material for detailed RNA analysis were included.12 A pathologist confirmed the presence of adequate tumor material in FFPE slides. Initially, 67 subjects were identified; 51 had RNA of sufficient quality for analysis. Baseline demographics and clinical variables were obtained from the electronic medical record.
RNA was analyzed using the AmpliSeq Transcriptome Human Gene Expression Kit (Thermo Fisher Scientific). RNA was extracted using the RNAstorm, RNA Isolation kit for FFPE (CellData) from three FFPE slides per patient as per the manufacturer’s instructions. The quality of FFPE RNA was measured using the Agilent 2100 Bioanalyzer system (RNA 6000 Pico Kit). Sequencing libraries were prepared according to the AmpliSeq Library prep kit protocol as previously described.28 Pooled libraries were amplified using emulsion PCR on an Ion Torrent OneTouch2 instrument and enriched following the manufacturer’s instructions. Libraries were then loaded onto an Ion P1 chip V2 and sequenced on the Ion Torrent Proton sequencing system, using the Ion PI sequencing 200 Kit v3 chemistry.
The data were based on raw read counts per gene. The primers used for each gene targeted regions of approximately the same length in all genes so they did not need to be corrected for gene length. The data were normalized as ‘counts per million’, where the raw counts for each gene were divided by the total number of counts, multiplied by a constant (106), and log2 transformed.
Gene signature generation
The goal of this study was to develop a gene signature that reflected antigen processing and presentation machinery and its association with response to ICB. We generated an APM signature (APMS) by adding the sum of the log2 z-score of 17 genes associated with APM in the literature (B2M, TAP1, TAPBPL, CALR, PSMB9, PSMB10, ERAP1, PDIA3, NLRC5, RFX5, PSME1, PSME2, PSME3, CIITA, HSP90AB1, HSP90AA1, and HSP90B1)23 24 29–32 (online supplemental table 1). Log2 z-score values were used to generate a heat map using Morpheus from the Broad Institute (software.broadinstitute.org/morpheus/). Genes in this expanded antigen processing signature were examined to determine differential expression between responders and non-responders. A refined antigen processing signature was then generated by removal of genes that did not reach a nominal p value of less 0.05 for a positive association with response. This resulted in an eight-gene APMS (B2M, CALR, NLRC5, PSMB9, PSME1, PSME3, RFX5, and HSP90AB1) (online supplemental table 2).
Supplemental material
Statistical analyzes of lung cohort
Descriptive statistics were computed for patient, tumor, and treatment characteristics. Response variables were grouped into the binary categories of responders (including patients with partial responses and stable disease) versus non-responders. The responder group was defined by a radiologist reporting a decrease in size of overall disease burden or stability of disease >6 months. The association between a gene signature score and response was examined using a t-test after the normality of the gene scores were established. The area under a receiving operating characteristics (ROC) curve (AUC) was obtained by fitting a logistic regression model with response status as the dependent variable and the signature score as an independent variable. The significance level of AUC against the null value of 0.05 was tested. Associations between the inflammatory and APM gene signatures were examined using Pearson correlation coefficients for continuous variables. Comparisons between pre-treatment and post-treatment APM scores were examined using a t-test after the normality of the gene scores were established.
Kaplan-Meier curves for progression-free survival (PFS) and overall survival (OS) were generated and compared between patients above or below the median APM score using the log-rank test. HRs and the associated 95% CIs were estimated using Cox proportional hazard (PH) model. PFS was defined as the number of months since the start of ICB therapy until the date of progression or death, or censored at the cut-off date of August 31, 2018. All statistical analyzes were two-sided and performed using Graphpad Prism V.7.0 (La Jolla, California) or Stata V.15.1 (College Station, Texas).
Melanoma cohorts
NanoString gene expression data was obtained from a cohort of 14 high-risk resectable stage III/IV melanoma patients in a clinical trial of single dose neoadjuvant pembrolizumab to prevent disease recurrence.33 The NanoString platform did not contain all the genes in the current antigen processing signature, so the specific genes tested in this cohort included: B2M, TAP1, CALR, PSMB9, PSMB10, ERAP1, and PDIA3. The association between the sum of the log2 z-scores and disease recurrence was examined using the Wilcoxon rank-sum test. Kaplan-Meier curves for disease-free survival (DFS) were plotted for patients above or below the median APM score and compared by Cox PH models.
An additional publicly available melanoma data set with RNA sequencing was utilized to assess the antigen processing score and association with outcomes.34 This cohort included 27 metastatic melanoma patients treated with pembrolizumab. The refined eight-gene APM log2 z-score was assessed for its association with response using a t-test, and Kaplan-Meier curves for OS was plotted for patients above or below the median APM score and compared by Cox PH models.
Results
Patient characteristics and responses
A total of 51 stage IV NSCLC patients were analyzed (table 1). Sixty-one per cent had an adenocarcinoma histology and 84% were current or former smokers. Thirty-five (69%) patients were treated with nivolumab, 14 (27%) with pembroluzimab, and 2 (4%) with atezoluzimab. Twenty-three patients (45%) had a clinical response (partial response or stable disease) and 28 (55%) patients had progressive disease (non-responders). Response rates were not statistically different by histology, gender, age at diagnosis, age at treatment, pack years, or types of ICB treatment (all p>0.05). The median PFS was 1.7 months in non-responders and 25.1 months in responders. The median OS was 5.9 months in non-responders and 25.1 months in responders.
Patient characteristics
Antigen processing machinery signature and response to ICB
As described in the methods, we identified 17 genes from the literature that were involved in the APM. An APMS using these genes was generated for each patient and the APMS of responders was compared with non-responders (figure 1). The APMS (sum of the log2 z-scores for each gene) was significantly higher in the responder group compared with non-responders. (online supplemental figure 1A, average z-score 5.3 vs −4.5, p=0.0002). A ROC curve evaluating the APMS had an AUC of 0.81 (online supplemental figure 1B, p=0.0002). An APMS above the median value for the entire cohort was significantly associated with improved PFS and OS (online supplemental figure 1C and D). The median PFS for patients with a high APMS was 18.1 months versus 1.74 months in the low APM group (HR 0.27, 95% CI, 0.14 to 0.53, log-rank <0.001). The median OS for patients with a high APMS was 19.7 months versus 6.3 months in the low APMS group (HR 0.26, 95% CI, 0.17 to 0.66, log-rank=0.0006).

Heat map of individual APM signature genes. Differential expression of APM gene z-scores in responders and non-responders. APM, antigen processing machinery.
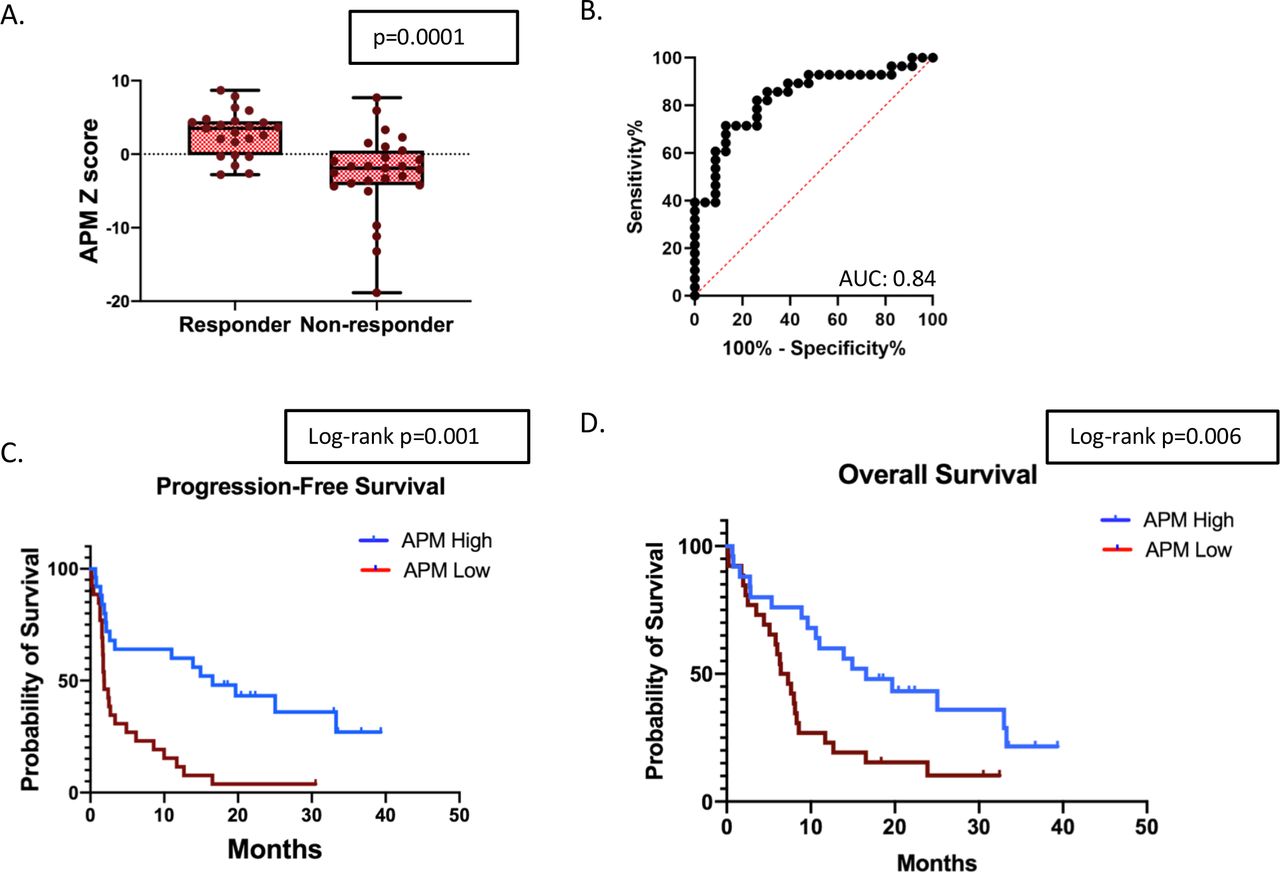
To generate a more refined APMS, we removed genes not significantly (p<0.05) associated with response. This resulted in an eight-gene antigen processing signature (online supplemental table 2). The refined antigen processing signature was significantly higher in the responder group compared with non-responders. (figure 2A, average z-score 2.84 vs −2.49, t-test p=0.0001). A ROC curve evaluating the APM score had an AUC of 0.84 (figure 2B, p<0.001). An APM score above the median value for the entire cohort was associated with significantly improved PFS and OS (figure 2C and D). The median PFS for patients with a high APM score was 16.6 months versus 1.9 months in the low APM group (HR 0.34, 95% CI, 0.18 to 0.64, log-rank=0.001). The median OS for patients with a high APM score was 16.6 months versus 6.9 months in the low APM group (HR 0.44, 95% CI, 0.23 to 0.83, log-rank=0.006).

APM signature and response to ICB in NSCLC. (A) Comparison of the log2 z-scores of the APM gene signature between responders and non-responders (n=51). (B) ROC curve utilizing the APM signature to predict response to checkpoint blockade. (C) Kaplan-Meier survival curves for patients above and below the median APM score for PFS, and (D) Kaplan-Meier survival curves for patients above and below the median APM score for OS. APM, antigen processing machinery; AUC, area under a receiving operating characteristics curve; ICB, immune checkpoint blockade; NSCLC, non-small cell lung cancer; OS, overall survival; PFS, progression-free survival.
The APM signature is more predictive than an inflammation signature
The best developed gene signature to predict response to immunotherapy is a signature that reflects the inflammatory state of the tumor microenvironment.9 10 We previously showed that such an inflammatory gene signature was significantly associated with response to checkpoint blockade in patients with metastatic lung cancer with an AUC of 0.70 (figure 3A, gray line).12 In the same NSCLC cohort, the eight-gene antigen processing score demonstrated an improved ability to predict response to checkpoint blockade relative to the inflammatory gene signature with an AUC of 0.84 (figure 3A, green line), even though there was a significant correlation between the APM score and inflammatory gene signature (Pearson’s r=0.58, p<0.0001) (figure 3B).
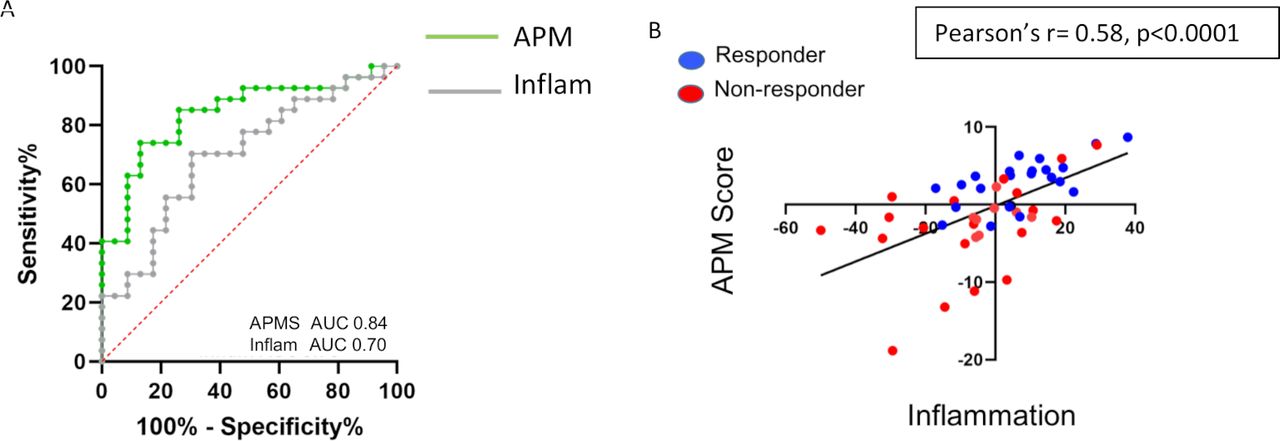
Comparison between inflammatory and APM gene signatures. (A) ROC curves for the APM signature (green) and inflammatory gene signature (gray) to predict response to checkpoint blockade in NSCLC. (B) Association between APM and inflammatory gene signatures shows a high correlation (Pearson’s r=0.58, p<0.0001). Responders are highlighted in blue and non-responders are highlighted in red. APM, antigen processing machinery; AUC, area under a receiving operating characteristics curve; NSCLC, non-small cell lung cancer; ROC, receiving operating characteristics.
The APMS decreases after ICB
Tumor biopsy samples were available from three patients before and after treatment with ICB. The APM score in the biopsies before therapy were significantly higher (p<0.001) than the score after ICB (figure 4).

Baseline and post-treatment APM scores. (A) Baseline and post-treatment APM score in three patients that had biopsies at disease progression on a checkpoint inhibitor. (B) Change in APM score between baseline and post-treatment samples. APM, antigen processing machinery.
The APMS in melanoma predicts response
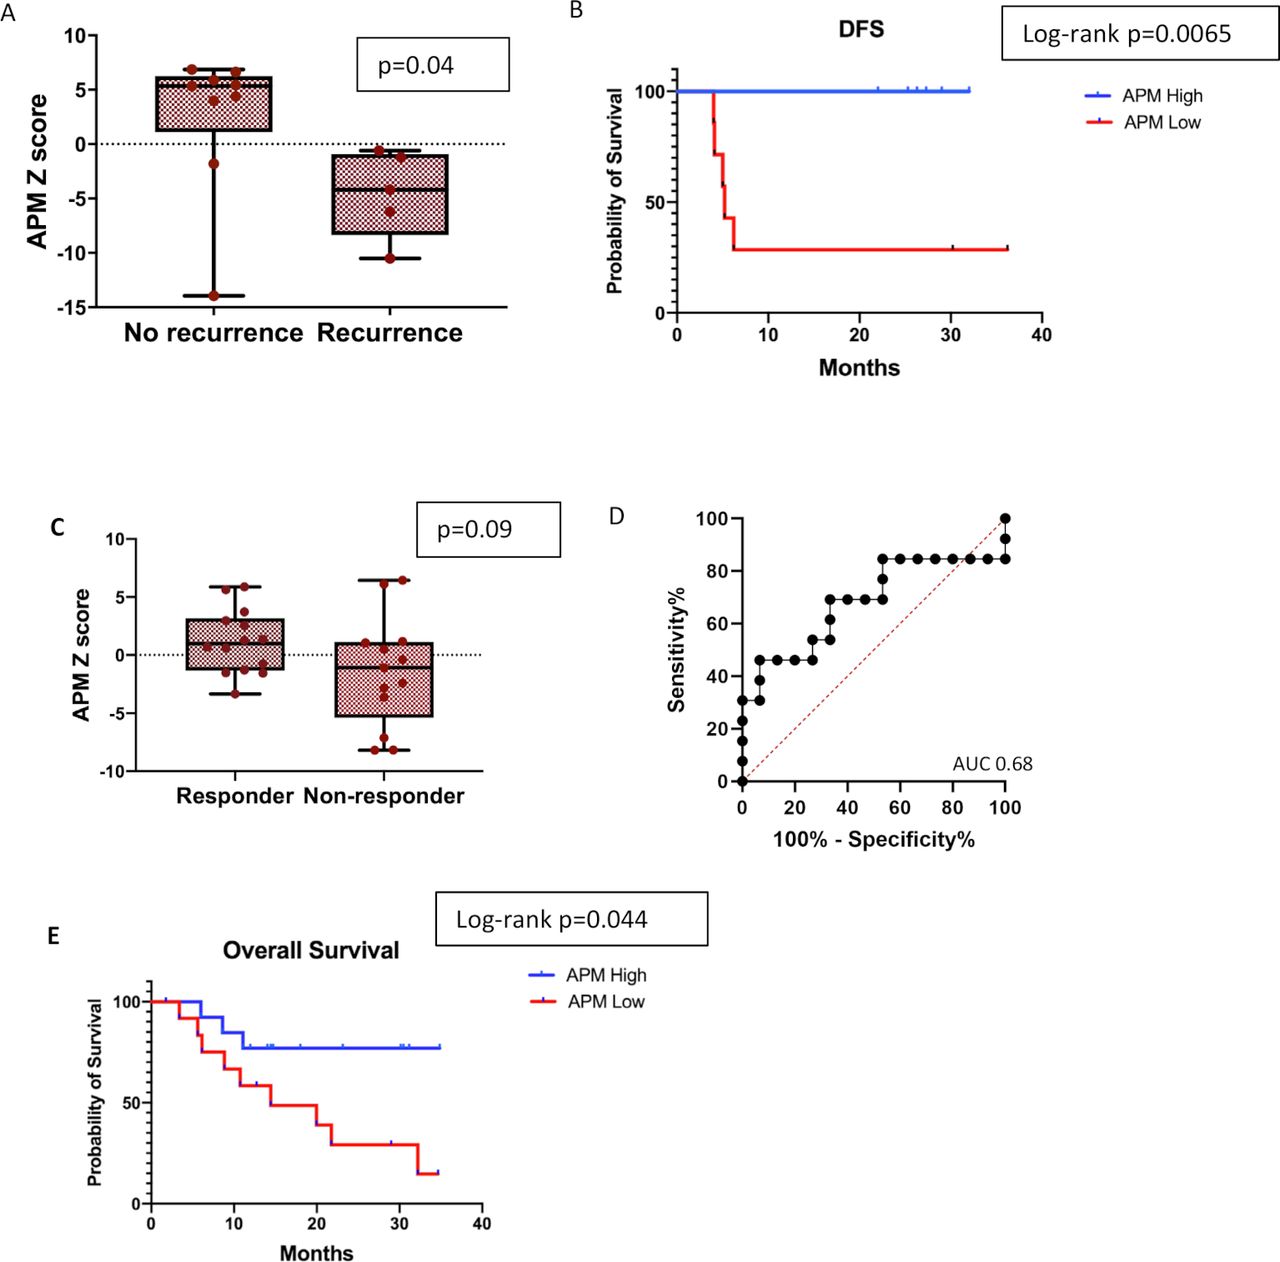
To evaluate the generalizability of the APMS and its association with response and survival to ICB in an additional tumor type, we analyzed NanoString gene expression data from a recently reported cohort of 14 high-risk resectable stage III/IV melanoma patients involved in a clinical trial of single dose neoadjuvant pembrolizumab to prevent disease recurrence.33 Patients with no recurrence had a significantly higher APMS than those with recurrence with a median follow-up of 25 months (figure 5A.) DFS was significantly longer in patients with upregulation in genes involved antigen processing (HR: 0.08, 95% CI, 0.01 to 0.50, log-rank=0.0065, figure 5B). An additional publicly available melanoma data set with RNA sequencing and clinical outcomes was analyzed to assess the APMS and association with response and outcomes.34 In this 27-patient melanoma cohort, a higher APM score was associated with response (responder average z-score 1.16 vs −1.44 in non-responders); however, this difference did not reach statistical significance (p=0.09, figure 5C) due to one outlier. The AUC in the ROC curve was 0.68 (p=0.11) (figure 5D). However, a higher APMS was significantly associated with improved OS (figure 5E); the median OS for patients with an APM above the median score was not reached, while the median OS was 14.4 months in the lower APMS group (HR 0.29, 95% CI, 0.09 to 0.89, log-rank=0.044).

APM signature in melanoma cohorts. (A). Comparison of the log2 z-scores of the APM score in a cohort of stage III/IV melanoma patients receiving neoadjuvant pembrolizumab between patients with recurrent disease or no recurrence (n=14). (B) Kaplan-Meier survival curve showing DFS for patients above and below the median APM score. (C) Comparison of the log2 z-scores of the APM gene signature between responders and non-responders in a cohort of metastatic melanoma patients treated with pembrolizumab (n=27). (D) ROC curve utilizing the APM signature to predict response to checkpoint blockade in melanoma cohort. (E) Kaplan-Meier survival curve for OS for patients above and below the median APM score in melanoma cohort. APM, antigen processing machinery; AUC, area under a receiving operating characteristics curve; DFS, disease-free survival; ROC, receiving operating characteristics.
Discussion
Antigen presentation is accomplished through a series of coordinated intracellular events involving multiple proteins, the so-called APM proteins.35 36 First, tumor antigens are degraded by the proteasome and the immunoproteosome (specifically, PSMB8 (LMP7), PSMB9 (LMP2), and PSMB10 (LMP10)). These peptides are then transported via the transporter associated with antigen processing (TAP), which is composed of the two non-covalently associated subunits, TAP1 and TAP2 into the endoplasmic reticulum (ER). In the ER, HLA Class I heavy chain and β2m assembly occurs, with the ER chaperones calnexin, calreticulin, and the thiol oxidoreductase ERp57 (PDIA3) allowing for the correct folding of the HLA Class I β2m complex, which then associates with tapasin and subsequently with TAP-peptide complexes. This allows peptide loading onto the HLA Class I β2m molecules, after which, the antigenic peptides may be trimmed by an ER-associated aminopeptidase (ERAP1).29 The HLA Class I β2m-peptide complex then travels to the plasma membrane via the Golgi apparatus. Other genes in our signature that affect the APM machinery include PSME 1, 2, and 3 (20s-26S proteasome proteins that play a role in antigen presentation),30 three heat shock 90 proteins, HSP90AB1, HSP90AAA1, and HSP90B1,31 and the transcription factors NLRC5, RFX5, and CIITA.32 37 We thus used this set of genes in our initial APMS (online supplemental table 1). We did not include the genes for the HLA Class I molecules in our signature as these can be highly polymorphic and subject to post-translational modifications that affect expression levels.38 For example, in a mouse fibrosarcoma cell model with widely different levels of HLA Class I expression measured by flow cytometry, there was no correlation with HLA Class I messenger RNA expression.39
We found that patients with a higher APM score were more likely to respond to ICB and had improved PFS and OS in lung cancer, and the APM score was also associated with improved survival in two independent melanoma cohorts treated with checkpoint blockade. These results are novel, but consistent with a growing body of literature highlighting the importance of MHC Class I and β2m gene mutations in mediating tumor intrinsic resistance to ICB. Loss of heterozygosity at the β2m locus has been associated with primary resistance and poor OS in melanoma patients receiving checkpoint blockade,18 and defects in β2m leading to loss of MHC Class I expression have been associated with acquired resistance to immunotherapy in melanoma.17 40
HLA loss can be classified into two main categories: reversible regulatory or irreversible structural defects. Structural defects are due to mutational events or chromosomal losses (in chromosomes 6p21.3 and 15q21) that disrupt HLA-I heavy chains or β2m.41 Clearly, these patients will likely have poor responses to checkpoint blockade or any type of T-cell-based immunotherapy. However, the frequency of somatic mutations in APM components in epithelial malignancies is reportedly low (less than 10%)24 and, specifically, are relatively rare in lung cancer (2.7% to 6.9%).42 In contrast, reversible defects due to epigenetic, transcriptional, or post-transcription events are common; loss of HLA class I protein occurs in between 30% to 70% of cancer cases.24 A recent study by Pereira et al found somatic mutations in antigen processing components in only 5% of lung cancers, while loss or low level expression of MHC Class I protein was appreciated in 66% of cases.22 This dissociation between genetic defects and protein levels is likely due to at least two factors. First, since many of the defects in HLA Class I and APM proteins are due to epigenetic changes, they are not seen in genetic analyzes.43 Second, it appears that unless the entire antigen presentation machinery is intact, optimal stability and surface expression of MHC Class I molecules is not achieved.30
It is likely that the status of HLA Class I expression and the APM components is tightly linked to the inflammation status of the tumor. Initial T-cell activation requires the ability of tumor cells to present antigen to the T cells. Indeed, loss of HLA Class I expression has been associated with a decrease or absence of CD8 T-cell infiltration within tumors.22 Activation of T cells would result in the subsequent release of IFN-γ and tumor necrosis factor-α, resulting in tumor microenvironmental activation and recruitment of additional T cells. In addition, IFN-γ signaling would be expected to upregulate proteins on tumor cells involved in antigen processing, including MHC Class I and APM molecules,44 45 leading to a positive feedback loop resulting in additional T-cell recruitment and activation. It is thus expected that tumors with higher APM scores would have higher T-cell-inflamed scores, as we observed. It is interesting that the APM score was actually more predictive of response than an inflammatory gene score in our NSCLC cohort, supporting the importance of antigen presentation in response to ICB therapy. Eventually, it has been proposed that the success of CD8 T-cell attack on tumors can result in selection of tumor cells lacking MHC Class I expression making them resistant to further T-cell killing.43 46 This form of tumor editing likely explains the high incidence of loss of MHC Class I and APM molecules on lung cancer and other tumors.22
We believe there are a number of important potential clinical implications of our study. First, we demonstrate the overall expression levels of APM genes (and the presumed associated decrease in HLA Class I expression) can predict which patients will respond to anti-PD1 therapy with more accuracy than previously published inflammation scores. A very low APM score was particularly powerful in identifying those patients who did not respond. Thus, in our optimized lung cancer data set, an APM score of less than or equal to −3.0 (n=11) was 100% predictive of progressive disease. Although using this cut-off value results in relatively low sensitivity, being able to predict lack of response with very high accuracy would be of great value in sparing a set of patients’ expense, time, and the possibility of immune-related side effects for no benefit. Low scores in the Hugo melanoma data set were also highly predictive of non-response. Indeed, a recent study by Kalaora et al demonstrated that lower expression of immunoproteosome subunits (PSMB8 and PSMB9) were associated with inferior response rates and outcomes in melanoma patients receiving ICB.47
Second, identifying patients with low Class I expression could have important implications in directing more efficacious alternative therapies.15 43 In terms of other immunotherapies, loss of Class I expression would make vaccines and adoptive transfer of tumor infiltrating lymphocytes or T cells expressing transgenic TCRs less likely to be successful, but would not affect sensitivity to chimeric antigen receptor (CAR) T-cell therapy. Loss of Class I expression could actually make the tumors more sensitive to adoptive transfer of NK cells or NK cell-CARs. As mentioned above, most HLA Class I losses are not due to genetic mutations, but secondary to epigenetic or environmental factors. It may thus be possible to alter the tumor cells to re-express Class I molecules, making treatment with ICB or other immunotherapies more effective.23 43 This could be achieved using immunostimulatory agents that induce IFNs (such as cytokines, toll-like receptor agonists, or viral therapies), resulting in increased MHC I expression in tumors. Alternatively, a number of drugs already used in cancer therapy have also been shown to restore MHC I expression. These include mitogen-activated protein kinase inhibitors,48 DNA demethylating agents (eg, 5-azacytidine and decitabine),49 and inhibitors of histone deacetylation (HDAC inhibitors) such as trichostatin A or entanostat.50 One could thus envision screening patients for loss of APM genes or HLA Class I expression and in those with defective expression, initiating a treatment regimen where Class I expression was pharmacologically upregulated. This could then be followed by treatment with ICB, vaccines, or adoptive T-cell transfer.
Our study does have certain limitations. One possible limitation of the genomic signature approach for antigen presentation is that, by nature, the analysis interrogates the entire tumor, including tumor cells and stroma. Although this is of value in understanding the inflammation status and which cell types infiltrate into the tumor, HLA Class I expression is often quite high in stromal tissues, so variable amounts of fibroblasts or leukocytes could dilute signals that are intrinsic to tumor cells (such as Class I or APM expression). The only way to know definitively from which cells our signals came from, would be single cell RNAseq. This is an extremely expensive approach that requires fresh tissue and may not have coverage deep enough for a number of our genes. We do have some data to suggest that our APMS is not simply another surrogate for certain type of leukocyte infiltration. First, in our previous study using these same samples12 (Supplemental figures 2 and 4), we saw no associations of response to anti-PD1 therapy with lymphocyte genes (CD4, CD8A, and CD8B), with macrophage genes (CD68, CD14, CD163, and CSF1R), or to fibroblast genes (ACTA2 and Col4A1). We saw no correlation between the APM score and expression levels of the genes for CD45, CD8A, CD11b, CD68, CD14, and CD163 (online supplemental figure 2). However, despite this potential dilutional effect, we were still able to detect a strong signal. Going forward, we postulate that targeted immunohistochemistry, that would determine expression levels of key surface proteins on only the tumor cells, will be even more specific and valuable. Such studies, staining for HLA Class I expression and key components of the APM are underway. This was a single-center, retrospective study conducted in chemotherapy-refractory patients with metastatic NSCLC. Further study is required to validate our findings in larger data sets. In addition, as checkpoint inhibitors are now approved in the front-line setting in patients with metastatic NSCLC, it will be important to evaluate our APMS in patients receiving checkpoint blockade, both alone and in combination with chemotherapy, in the first-line setting. These studies are currently ongoing. The other major limitations to our study are that we did not consistently have PD-L1 immunohistochemical staining or measurements of TMB; our patients were treated several years ago following progression on standard of care chemotherapy when neither of these tests were routinely performed. Nevertheless, our data demonstrate that defects in antigen presentation may be an important feature in predicting outcomes to ICB in both lung cancer and melanoma and, if substantiated, has the potential to inform therapeutic strategies in this patient population.
References
Supplementary materials
Supplementary Data
This web only file has been produced by the BMJ Publishing Group from an electronic file supplied by the author(s) and has not been edited for content.
Footnotes
Contributors Conception and design: JCT, CJL, and SMA. Provision of study materials or patients: JTC, CJL, SMA, CD, SJ, and CD. Collection and assembly of data: JCT, W-TH, SMA, CD, and SJ. Data analysis and interpretation: JCT, W-TH, CJL, SMA, TCM, AH, CD, and SJ. Manuscript writing: All authors. Final approval of manuscript: All authors.
Funding This work was supported in part by the Abramson Cancer Center Lung Cancer Translational Center of Excellence (WTH, CD, CD, SJ, CJL, and SMA) and by K08 CA234335-02 from the National Cancer Institute (National Institutes of Health (NIH)), and LUNGevity Foundation (JCT). The content is solely the responsibility of the authors and does not necessarily represent the official views of the NIH.
Competing interests JCT reported a consulting or advisory role for Guardant Health, AstraZeneca, and Honeywell. CJL reported honoraria from Bristol Myers Squibb, Genentech/Roche, and Lilly/ImClone; a consulting or advisory role with Genentech/Roche, Lilly/ImClone, Merck Sharp & Dohme, Abbott Biotherapeutics Inc, Bayer/Onyx, Clariant, Clovis Oncology, Celgene Corporation, Cancer Support Community, Bristol Myers Squibb, Ariad Pharmaceuticals Inc, Takeda Pharmaceutical Company Ltd, and AstraZeneca; institutional research funding from Merck Sharp & Dohme, Advantagene Inc, Clovis Oncology, Celgene Corporation, Inovio Pharmaceuticals, Ariad Pharmaceuticals Inc, GlaxoSmithKline, Genentech/Roche, and Stemcentrx Inc; and other relationships with Eli Lilly and Company, Amgen Inc, Peregrine Pharmaceuticals Inc, and Synta Pharmaceuticals Inc.
Patient consent for publication Not required.
Ethics approval Approved by the University of Pennsylvania’s Institutional Review Board under a waiver of informed consent.
Provenance and peer review Not commissioned; externally peer-reviewed.
Data availability statement Data are available upon reasonable request.