Article Text

Abstract
Background Human papillomavirus (HPV)-associated oropharyngeal squamous cell carcinoma (OPSCC) is a distinct clinical entity with a much better prognosis after (chemo)radiotherapy than HPV-negative OPSCC, especially in patients with a concomitant intratumoral HPV-specific and type-1 cytokine-oriented T cell response. However, knowledge on the type of myeloid cells and their coordination with intratumoral T cells and influence on patient outcome in OPSCC is lacking.
Methods We analyzed the presence of intratumoral myeloid cells and their relationship to tumor-infiltrating T cells and patient outcome in a well-described cohort of HPV16+ patients with OPSCC using multispectral immunofluorescence, flow cytometry and functional analyses.
Results We show that the tumor microenvironment of HPV16+ OPSCC tumors with such an ongoing HPV16-specific T cell response is highly infiltrated with a newly defined CD163+ cytokine-producing subset of conventional dendritic cell type 2 (cDC2), called DC3. These CD163+ cDC2 predominantly stimulated type 1 T cell polarization and produced high levels of interleukin-12 (IL-12) and IL-18, required for IFNγ and IL-22 production by T cells after cognate antigen stimulation. Tumor-infiltration with these CD163+ cDC2 positively correlated with the infiltration by Tbet+ and tumor-specific T cells, and with prolonged survival.
Conclusions These data suggest an important role for intratumoral CD163+ cDC2 in stimulating tumor-infiltrating T cells to exert their antitumor effects.
- dendritic cells
- head and neck neoplasms
- immunity, cellular
- lymphocytes, tumor-infiltrating
- tumor microenvironment
This is an open access article distributed in accordance with the Creative Commons Attribution Non Commercial (CC BY-NC 4.0) license, which permits others to distribute, remix, adapt, build upon this work non-commercially, and license their derivative works on different terms, provided the original work is properly cited, appropriate credit is given, any changes made indicated, and the use is non-commercial. See http://creativecommons.org/licenses/by-nc/4.0/.
Statistics from Altmetric.com
- dendritic cells
- head and neck neoplasms
- immunity, cellular
- lymphocytes, tumor-infiltrating
- tumor microenvironment
Background
Head and neck cancer is the sixth most prevalent cancer type worldwide and the incidence of oropharyngeal squamous cell carcinoma (OPSCC) has increased over the last decades, most likely due to infection with high-risk human papillomaviruses (HPVs).1 2 While HPV-positive OPSCC often is diagnosed at a late stage of disease with lymph node metastasis, it has a favorable clinical outcome compared with HPV-negative OPSCC.3–5 There is strong evidence that this is due to the presence of a beneficial tumor microenvironment (TME) with increased antitumor immune reactivity.6 7 Indeed, we recently demonstrated that HPV-associated OPSCC is a distinct clinical entity with a much better prognosis after standard of care (chemo)radiotherapy than HPV-negative OPSCC, especially in patients with a concomitant intratumoral HPV16-specific and type-1 cytokine-oriented T cell response.3 8 9
There is ample evidence that innate immune cells play an important role in cancer development and progression. Tumors can be highly infiltrated with monocytes, macrophages, dendritic cells (DCs) and granulocytes, all of which with different functions and influence on prognosis and survival.10 Knowledge about the type of infiltrating myeloid cells and their influence on patient outcome in OPSCC, however, is limited. A number of studies describe tumor-associated macrophages (TAMs) in OPSCC, but direct links between the levels of these TAMs and patient outcome are controversial, as high numbers of intraepithelial macrophages have been described to be associated with both prolonged7 11 and decreased survival.12 13 Furthermore, a profound insight on the coordination of intratumoral myeloid cell and T cell infiltration often is lacking.
In this study, we investigated the presence of intratumoral myeloid cells and their relationship to tumor-infiltrating T cells and patient outcome in a well-described cohort of HPV16+ patients with OPSCC.3 We demonstrated that the TME of HPV16+ OPSCC tumors with ongoing HPV16-specific T cell responses is highly infiltrated with a yet underappreciated population of CD14‒CD33‒CD163+ myeloid cells, which resemble a recently defined inflammatory type of cytokine-producing CD1c+ conventional dendritic cell type 2 (cDC2) subtype designated DC3.14 15 This CD163+ cDC2 population produced high levels of interleukin-12 (IL-12) and IL-18, which is required for optimal type 1 T cell polarization and for IFNγ production by T cells after cognate antigen stimulation.
Methods
Patients
The 27 samples of patients with OPSCC that were studied here were part of a larger observational study (P07-112) investigating cellular immunity in patients with head and neck cancer.3 The study was conducted in accordance with the Declaration of Helsinki and approved by the local medical ethical committee of the Leiden University Medical Center and in agreement with the Dutch law. HPV typing and p16ink4a immunohistochemistry (IHC) staining was performed on formalin-fixed paraffin-embedded (FFPE) tumor sections as described previously.6 An overview of patient characteristics is given in online supplementary table 1.
Supplemental material
Blood and tumor cell isolation and culturing
Healthy donor buffy coats (Sanquin, Amsterdam, The Netherlands), heparinized OPSCC blood and fresh tumor samples were obtained and handled as described previously.3 8 9 In brief, venous blood samples were drawn prior to surgery, and processed within 6 hours. Peripheral blood mononuclear cells (PBMCs) were isolated using ficoll density-gradient centrifugation according to standard operating procedures. OPSCC tumors were cut into small pieces and used for single cell dissociation by enzymatic digestion and to obtain tumor-infiltrating lymphocytes (TILs). Obtained single cell tumor cell suspensions and TIL bulk cultures were cryopreserved and stored in the vapor phase of liquid nitrogen until further use.
Tumor-specific T cell reactivity analysis
Cultured TILs were analyzed for the presence of HPV16-specific T cells as described previously.3 In brief, reactivity of the cultured TILs were tested against autologous monocytes loaded with HPV16 E6/E7 synthetic long peptide (22-mers with 14 amino acids overlap) in a 5-day [3 hour]-thymidine-based proliferation and cytokine production assay. Proliferation was measured by [3 hour]-thymidine incorporation during the last 16 hours. Antigen-specific cytokine production was measured by using a cytometric bead array (CBA, Th1/Th2 kit, BD Bioscience, Breda, The Netherlands). The cut-off value for cytokine production was 20 pg/mL, except for IFNγ for which it was 100 pg/mL. For the proliferation assay, a response was considered positive when the stimulation index, calculated by dividing the average counts of the test wells by the average counts of the medium control wells, was at least 3. Positive cytokine production was defined as at least a twofold increase compared with that of unstimulated cells. Patients were considered immune response-positive (IR+) when a positive response was detected in the cultured TILs by antigen-specific proliferation and/or cytokine production.
Multiplex immunofluorescent staining, image acquisition and analysis
Characterization of myeloid infiltration was first carried out with triple immunofluorescent staining in 20 OPSCC tumors as described previously.6 8 In brief, following deparaffinization and antigen retrieval (Tris-EDTA buffer, pH 9.0), FFPE tissue sections were stained using anti-CD14, anti-CD33 and anti-CD163 and isotype-specific secondary fluorescent antibodies goat-anti-mouse IgG2a Alexa 488, goat-anti-mouse IgG2b Alexa 546 and goat-anti-mouse IgG1 Alexa 647 (all from Molecular probes; 1:200; see also online supplementary table 2). Nuclear counterstain was obtained with 4′,6-diamidino-2-phenylindole (DAPI). Based on the morphology of cancer cell nests and autofluorescence of keratinocytes the immune cells per mm2 were manually counted as intraepithelial or stromal using the LSM V.5 Image Examiner software (average of five images at a 250× magnification). By use of overlapping colors the following infiltrating myeloid cells were distinguished: CD14+CD33−CD163−, CD14+CD33+CD163−, CD14+CD33−CD163+, CD14+CD33+CD163+, CD14−CD33+CD163− and CD14−CD33−CD163+.
Immunofluorescent four color staining was performed for 10 selected OPSCC tumors as described previously.16 17 Antibody specificity and optimal antigen retrieval were assessed by single-plex IHC using tonsils. Following incubation with superblock buffer (Thermo Fisher Scientific, Waltham, Massachusetts, USA), the primary antibodies and isotype/species-specific secondary fluorescent antibodies were applied (online supplementary table 2). Tissue slides were imaged at 20× magnification with the Vectra 3.0 Automated Quantitative Pathology Imaging System (PerkinElmer). Imaging analysis was performed with the InForm Cell Analysis software (PerkinElmer). Five random multispectral imaging fields of interest were selected for acquisition from each tumor and myeloid cells were manually counted within these fields. The following phenotypes were identified: HLA-DR+CD11c+CD14/CD68+CD163− macrophages, HLA-DR+CD11c+CD14/CD68+CD163+ macrophages, HLA-DR+CD11c+CD14‒CD68−CD163− DC and HLA-DR+CD11c+CD14‒CD68−CD163+ DC.
Flow cytometry and cell sorting
Cryopreserved single cell OPSCC tumor samples were thawed and used for myeloid cell subset determination by flow cytometry. Cryopreserved healthy donor PBMCs were thawed, depleted of CD3+ T and CD19+ cells by the use of CD3-microbeads (Miltenyi Biotec), subsequently CD19 pan B dynabeads (Thermo Fisher Scientific) and then used for myeloid cell sorting by flow cytometry. After thawing and/or CD3/CD19 depletion, samples were stained with the LIVE-DEAD Fixable yellow or near-IR dead cell stain kit (Thermo Fisher Scientific) for 20 min at room temperature. Following washing, Fc receptors were blocked by incubating for 10 min on ice with phosphate buffered salt (PBS)/0.5% bovine serum albumin (BSA)/10% fetal calf serum (FCS), after which the cells were washed, and stained for 30 min on ice with fluorochrome-conjugated antibodies. Details on antibodies used for myeloid cell subsets determination and flow activated cell sorter (FACS)-sorting of PBMCs are listed in online supplementary table 3. Acquisition of cells was performed on a BD LSR Fortessa and flow cytometry-based cell sorting was done using a BD FACS Aria III. Data were analyzed using DIVA software (V.8.02; BD Biosciences).
Cytokine production by CD163+ and CD163− myeloid cells
CD11c+HLA-DR+ and CD14+CD163‒, CD14+CD163+, CD14‒CD163‒ and CD14‒CD163+ myeloid cells were FACS-sorted from CD3‒CD19‒ PBMCs from healthy donors and cultured in Iscove's Modified Dulbecco's Media (IMDM; Lonza) supplemented with 2% human AB (hAB) serum (Capricorn Scientific), 100 IU/mL penicillin (pen; Thermo Fisher Scientific), 100 µg/mL streptomycin (strep; Thermo Fisher Scientific) and 2 mmol/L l-glutamin (L-glut; Lonza) at 20,000 cells per well in triplo in a 96-well round bottom plate in the presence of 100 ng/mL lipopolysaccharide (LPS) (Sigma-Aldrich), 25 µg/mL poly(I:C, Invivogen) and 2.5 µg/mL R848 (Enzo life sciences). After 20 hours, supernatants were harvested, pooled and frozen until analysis. Cytokines were determined using IL-12p70 and IL-18 ELISA (R&D systems) and a custom-made 13-plex cytokine assay (Granulocyte-macrophage colony-stimulating factor (GM-CSF), IL-1α, IL-1β, IL-10, IL-23, IL-6, IL-8, MIP-1α, MIP-3α, TGF-α, TNF-α, M-CSF and VEGF-A, ProcartaPlex Immunoassay, Thermo Fisher Scientific).
Assessment of T cell stimulatory capacity of CD163+ and CD163− myeloid cells
To assess the T cell stimulatory capacity of the flow cytometry-sorted CD163+ and CD163‒ myeloid subsets, these cells were cultured for 20 hours at 15.000–20.000 cells per well in triplo in IMDM + pen/strep/L-glut+2% hAB serum a 96-wells round bottom plate in the presence of 100 ng/mL LPS and 2.5 µg/mL R848, after which allogeneic Cell Trace Violet (CTV; Thermo Fisher Scientific)-labeled allogeneic PBMCs were added at 1:10, 1:20 and 1:40 myeloid-to-PBMC ratio. At day 4, 50 µL of the culture supernatants was harvested and frozen for cytokine analysis, and then 10 µg/mL brefeldin A (Sigma-Aldrich) was added during the last 16 hours of culture. The next day, T cell proliferation was assessed by measuring CTV dilution and IFN-γ production by intracellular cytokine staining (ICS) using flow cytometry (online supplementary table 3). Also, supernatants were assessed for the presence of IFN-γ by ELISA (Mabtech) and IL-2, IL-3, IL-4, IL-5, IL-9, IL-13, IL-17A and IL-22 by a custom-made 8-plex cytokine assay (ProcartaPlex Immunoassay, Thermo Fisher Scientific).
IL-12 and/or IL-18 stimulation of T cells
Healthy donor-derived PBMCs were cultured in triplicate wells for 24 hours in the presence or absence of 50 ng/mL IL-12 (Miltenyi Biotec) and/or IL-18 (R&D systems) in 96-wells round bottom plates and 5 µg/mL Brefeldin A was added during the last 4 hours of culture. Cytokine production by the stimulated T cells was determined by ICS as described previously (online supplementary table 3).3 9
To assess IL-12/IL-18 responsiveness of T cells in an antigen-specific manner, we made use of HPV16-specific Th clones, which were generated, maintained and tested as described previously.18 19 Responsiveness of the Th clones to IL-12 and IL-18 was assessed for 18 different Th clones that were obtained from three different HPV16+ SCC tumors (one OPSCC and two CxCa tumors). To this end, autologous B-LCL were loaded overnight with various concentrations of the cognate peptide (0, 0.005, 0.05, 0.5 µg/mL), and subsequently cultured for 24 hours with the HPV16-specific Th clones at a 1:5 B-LCL:Th ratio in the presence or absence of IL-12 and IL-18. All stimulations were done in duplicate wells of a 96-wells round bottom plate and 5 µg/mL Brefeldin A was added during the last 4 hours of culture.
Antigen-specific T cell stimulatory capacity of CD163+ and CD163− myeloid cells
To assess the antigen-specific stimulatory potential of the CD163+ and CD163‒ macrophage and DC populations, these cells were also tested for their capacity to stimulate the abovementioned HPV16-specific Th clones. To this end, CD11c+HLA-DR+ and CD14+CD163‒, CD14+CD163+, CD14‒CD163‒ and CD14‒CD163+ myeloid cells were sorted from HLA-DPB1 01:01+ or HLA-DPB1 14:01+ buffy coats, loaded for 1.5 hours with increasing concentrations of the cognate peptide (0, 0.05, 0.5 and 5 µg/mL), and matured by culturing them for an additional 4 hours with 100 ng/mL LPS and 2.5 µg/mL R848 in IMDM + pen/strep/L-glut+2% hAB serum. Next, HLA-DPB1 01:01 or HLA-DPB1 14:01 restricted HPV16-specific Th clones were added at 1:10 myeloid-to-Th cell ratio, and antigen reactivity of the Th cells was determined after 16 hours by ICS using flow cytometry (online supplementary table 3). To test the role for IL-12 and IL-18 in this setting, 10 µg/mL of anti-IL-12 (clone C8.6; Thermo Fisher Scientific) and anti-IL-18 (clone 125–2 hour, MBL International Corporation) antibodies were added during the last 2 hours of the LPS/R848 stimulation.
Transcriptomic analysis of CD163+ cDC2 cells
The bulk RNA sequencing data GEO: GSE13673114 was used. To this end, paired-end reads obtained from bulk RNA sequencing of CD163+ cDC2 were mapped to human transcript sequences obtained from Gencode V.28 using Salmon (V.0.9.1).20 21 Transcript abundances quantified by Salmon were summarized to gene-level counts and normalized gene-level abundances in transcript per million (TPM) units using the tximport R/Bioconductor package (V.1.2.0). For the analysis of differentially expressed genes (DEGs), the gene counts were imported into DESeq222 and a negative binomial generalized linear model (GLM) was fitted to the counts data. Dispersion parameters in the GLM were estimated by a local smoothed dispersion fit by providing the argument fitType=‘local’ to the estimateDispersions function of DESeq2. A Wald test was performed on the model coefficients to identify DEGs between CD163+CD14− and CD163+CD14+ cells. DEGs selected based on adjusted p value <0.05 and at least twofold change were analyzed for pathway enrichment using Ingenuity Pathway Analysis. For visualization, gene abundances in TPM were log2 transformed (ie, TPM + 1.0 to avoid log-zero) and averaged over replicates to obtain mean expression and listed as median log2 TPM values in an Excel file (version 1803) (online supplementary table 4). Genes associated with cDC phenotype, HLA, TNF/TNFR superfamily, cytokine and chemokine (receptor) activity, TLR binding and TNF and IFN signaling for display in heatmaps.
Statistical analysis
Non-parametric (Wilcoxon signed-rank or Mann-Whitney test for two samples and Friedman or Kruskal-Wallis with Dunn’s multiple comparison test for multiple samples) and parametric (paired or unpaired t test for two samples or repeated measures (RM) one-way analysis of variance (ANOVA) or ordinary one-way ANOVA with Tukey’s multiple comparison test for multiple samples) tests were performed as appropriate. Correlation analysis were done using the Pearson's correlation test. For survival analysis, patients were grouped into two groups according to the median (ie, grouped into below or above the median of the total group for each parameter), after which survival was tested using Kaplan-Meier method, and statistical significance of the survival distribution was analyzed by log-rank testing. All statistical tests were performed at the 0.05 significance level, and differences were considered significant when p<0.05, as indicated with an asterisk (*p<0.05, **p<0.01, ***p<0.001 and ****p<0.0001). Statistical analyses were performed using GraphPad Prism V.8.2.1 (San Diego, USA).
Results
The TME of HPV16+ OPSCC tumors is highly infiltrated with CD14−CD33−CD163+ myeloid cells
To evaluate the intraepithelial and stromal myeloid cell infiltration, tumors of 20 HPV16+ patients with OPSCC (online supplementary table 1) were analyzed for cells expressing CD14, CD33 and/or CD163 by triple immunofluorescent confocal microscopy (figure 1A; online supplementary table 2). Clear differences were observed in the number and type of infiltrating myeloid cells between individual tumors and between epithelium and stroma (figure 1B). In general, the stroma was more densely infiltrated with myeloid cells. The most abundant myeloid cells within the tumor epithelium were CD14+CD33 ‒ CD163+, CD14+CD33+CD163+ or CD14 ‒ CD33 ‒ CD163+ cells. While CD14+CD33 ‒ CD163+ and CD14+CD33+CD163+ cells could be detected in the tumor stroma at similar levels to the epithelium, CD14 ‒ CD33+CD163 ‒ immature myeloid cells and in particular CD14 ‒ CD33 ‒ CD163+ cells dominated the tumor stroma. Furthermore, the numbers of intratumoral and stromal CD14 ‒ CD33 ‒ CD163+ cells were highly correlated, while this was less the case for the other subpopulations (online supplementary figure 1A).

The TME of HPV16+ OPSCC tumors is highly infiltrated with CD14‒CD33‒CD163+ myeloid cells. Paraffin-embedded OPSCC tissue of 20 patients was analyzed by triple immunofluorescent confocal microscopy analysis with antibodies directed against CD14 (red), CD33 (blue) and CD163 (green). (A) The left panel depicts an example of an OPSCC sample with dense infiltration of the stromal compartment. the right panel depicts examples of (1) a CD14+CD33+CD163+ cell, (2) a CD14+CD33‒CD163+ cell, (3) a CD14‒CD33+CD163‒ cell and (4) a CD14‒CD33‒CD163+ cell. (B) Scatter plot depicting (from left to right) CD14+CD33‒CD163‒, CD14+CD33‒CD163+, CD14+CD33+CD163‒, CD14+CD33+CD163+, CD14‒CD33+CD163‒ and CD14‒CD33‒CD163+ cell infiltrates/mm2 for each patient in the epithelium (top) and stroma (bottom). Cells were manually counted and represented as the number of cells per mm2 for each slide (average of five images at 250× magnification). (C) Scatter plots and correlation analysis between the number of total CD14‒CD33‒CD163+ myeloid cells/mm2 (epithelium+stroma; Y-axis) and total CD8+, CD8+Foxp3‒Tbet+ and CD4‒Foxp3‒Tbet+ (CD4, from left to right; X-axis) cells/mm2. Pearson’s correlation with the coefficient of determination (r2) and p value is depicted for each correlation analysis. The dotted lines represent the 95% CI. Data for total CD8+, CD8+Foxp3‒Tbet+ and CD8‒Foxp3‒Tbet+ (CD4) have been described before.3 (D) Stacked bar graph depicting (from top to bottom) CD14+CD33‒CD163‒, CD14+CD33‒CD163+, CD14+CD33+CD163‒, CD14+CD33+CD163+, CD14‒CD33+CD163‒ and CD14‒CD33‒CD163+ cell infiltrates/mm2 in eight HPV16+ immune response-negative (HPV16+IR‒; left) and 12 HPV16+IR+ (right) patients with OPSCC. (E) Kaplan-Meier survival curve showing the survival of 19 patients with OPSCC. The patients were grouped into low (blue) or high (red) based on the median numbers of CD14‒CD33‒CD163+ cells/mm2 of the total group. statistical significance of the survival distribution was analyzed by log-rank testing and differences were considered significant when p<0.05. HPV, human papillomavirus; OPSCC, oropharyngeal squamous cell carcinoma; TME, tumor microenvironment.
The number of CD14−CD33−CD163+ cells correlates with Tbet+ T cells, tumor-specific T cells and prolonged survival
To gain insight in the impact of these cells in the TME, we assessed the relation between the number of infiltrating myeloid cells and a type 1-oriented tumor immune infiltrate. Positive correlations were found between the number of CD14 ‒ CD33 ‒ CD163+ myeloid cells and total CD8+, CD8+Foxp3 ‒ Tbet+ and CD8 ‒ Foxp3 ‒ Tbet+ (CD4) cells, both in the tumor epithelium and in the stroma (figure 1C and online supplementary figure 1B). This was not found for the other myeloid cell subsets (online supplementary figure 1C), indicating that only the CD14‒CD33‒CD163+ cells accumulate at type 1-inflamed sites where potentially a tumor-specific immune response has developed. Notably, we have shown before that approximately 99% of the CD3+CD8– T cells express CD4.23 As the reactivity of the TILs against the tumor-specific viral oncoproteins E6 and E7 of HPV16 was already known,3 8 9 we were able to assess whether these CD14‒CD33‒CD163+ cells preferentially accumulated in tumors with a concomitant tumor-specific type 1 T cell reaction. Indeed, higher numbers of intraepithelial and stromal CD14‒CD33‒CD163+ cells were found in OPSCC containing HPV16-specific TIL (HPV16+IR+) when compared with the group of OPSCC in which no intratumoral HPV16-specific TILs (HPV16+IR-) were detected (figure 1D and online supplementary figure 2). Interestingly, relatively high numbers of tumor-infiltrating CD14‒CD33‒CD163+ cells also correlated with improved overall survival (figure 1E). These two relationships did not exist for the other populations of myeloid cells analyzed (online supplementary figures 2 and 3), suggesting that specifically the presence of CD14‒CD33‒CD163+ cells correlated with an ongoing effective antitumor response.
The CD14−CD33−CD163+ myeloid cell population comprises DCs
The positive association between intratumoral CD14‒CD33‒CD163+ cells and tumor immunity prompted the in-depth characterization of this cell population. Therefore, 10 HPV16+IR+ OPSCC tumors with high CD14 ‒ CD33 ‒ CD163+ cell content were stained with a multiplex immunofluorescent VECTRA panel consisting of the myeloid markers CD11c, HLA-DR, CD14, CD68, and CD163 (figure 2A). This analysis confirmed our findings on the existence of a CD14‒CD163+ population, which constituted approximately 30% of the identified CD11c+ cells in these tumors. The absence of the markers CD14 and CD68 refutes that they are monocytes or macrophages, while the coexpression of CD11c and HLA-DR (figure 2B) confirmed their myeloid origin and suggested that these cells were a population of DCs. Notably, the relative contribution of the CD14‒CD68‒CD163+ cells to the total CD163+ cells is 40%, whereas that of CD14‒CD163+ cells to the total CD163+ cells detected by three-color immunofluorescence was 67%, indicating that the originally identified CD14‒CD33‒CD163+ cell population also included a fraction of CD14‒CD68+CD163+ M2 macrophages (figure 2C).
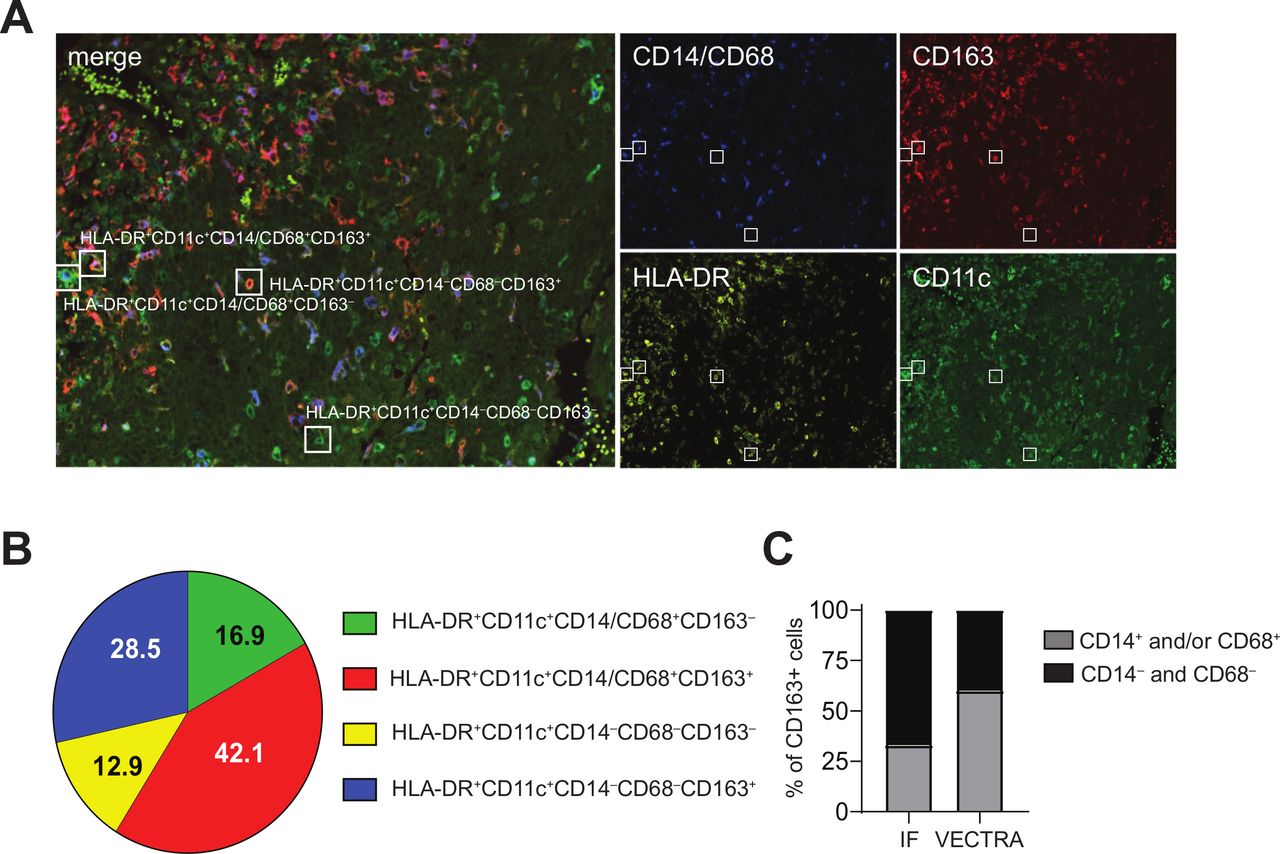
CD14‒CD33‒CD163+ myeloid cells in the TME include CD14‒CD68+CD163+ macrophages and CD14‒CD68‒CD163+ DCs. Paraffin-embedded tumor tissue of 10 HPV16+IR– patients with OPSCC was analyzed by multiplex immunofluorescent VECTRA analysis with antibodies directed against CD11c (green), CD163 (red), HLA-DR (yellow), and CD14 and CD68 (blue), of which the latter two were in the same fluorescence channel for direct monocyte/macrophage identification. (A) Example of an immunofluorescent staining is given for a representative OPSCC sample. Quadruple staining resulted in: HLA-DR+CD11c+CD14/68+CD163‒ (green with blue), HLA-DR+CD11c+CD14/68+CD163+ (orange with blue), HLA-DR+CD11c+CD14‒68‒CD163‒ (green) and HLA-DR+CD11c+CD14‒68‒CD163+ (orange) myeloid cells. (B) Pie chart showing the relative distribution of the identified phenotypes HLA-DR+CD11c+CD14/68+CD163‒ (green), HLA-DR+CD11c+CD14/68+CD163+ (red), HLA-DR+CD11c+CD14‒68‒CD163‒ (yellow), HLA-DR+CD11c+CD14‒68‒CD163+ (blue) cells. (C) Bar graph depicting the relative contribution of CD14+ (immunofluorescence) and CD14/CD68+ (VECTRA; light gray) cells and CD14‒ (IHC) and CD14/CD68‒ (VECTRA; black) cells to the total CD163+ cells within the TME of HPV16+IR+ tumors. DCs, dendritic cells; HPV, human papillomavirus; OPSCC, oropharyngeal squamous cell carcinoma; TME, tumor microenvironment.
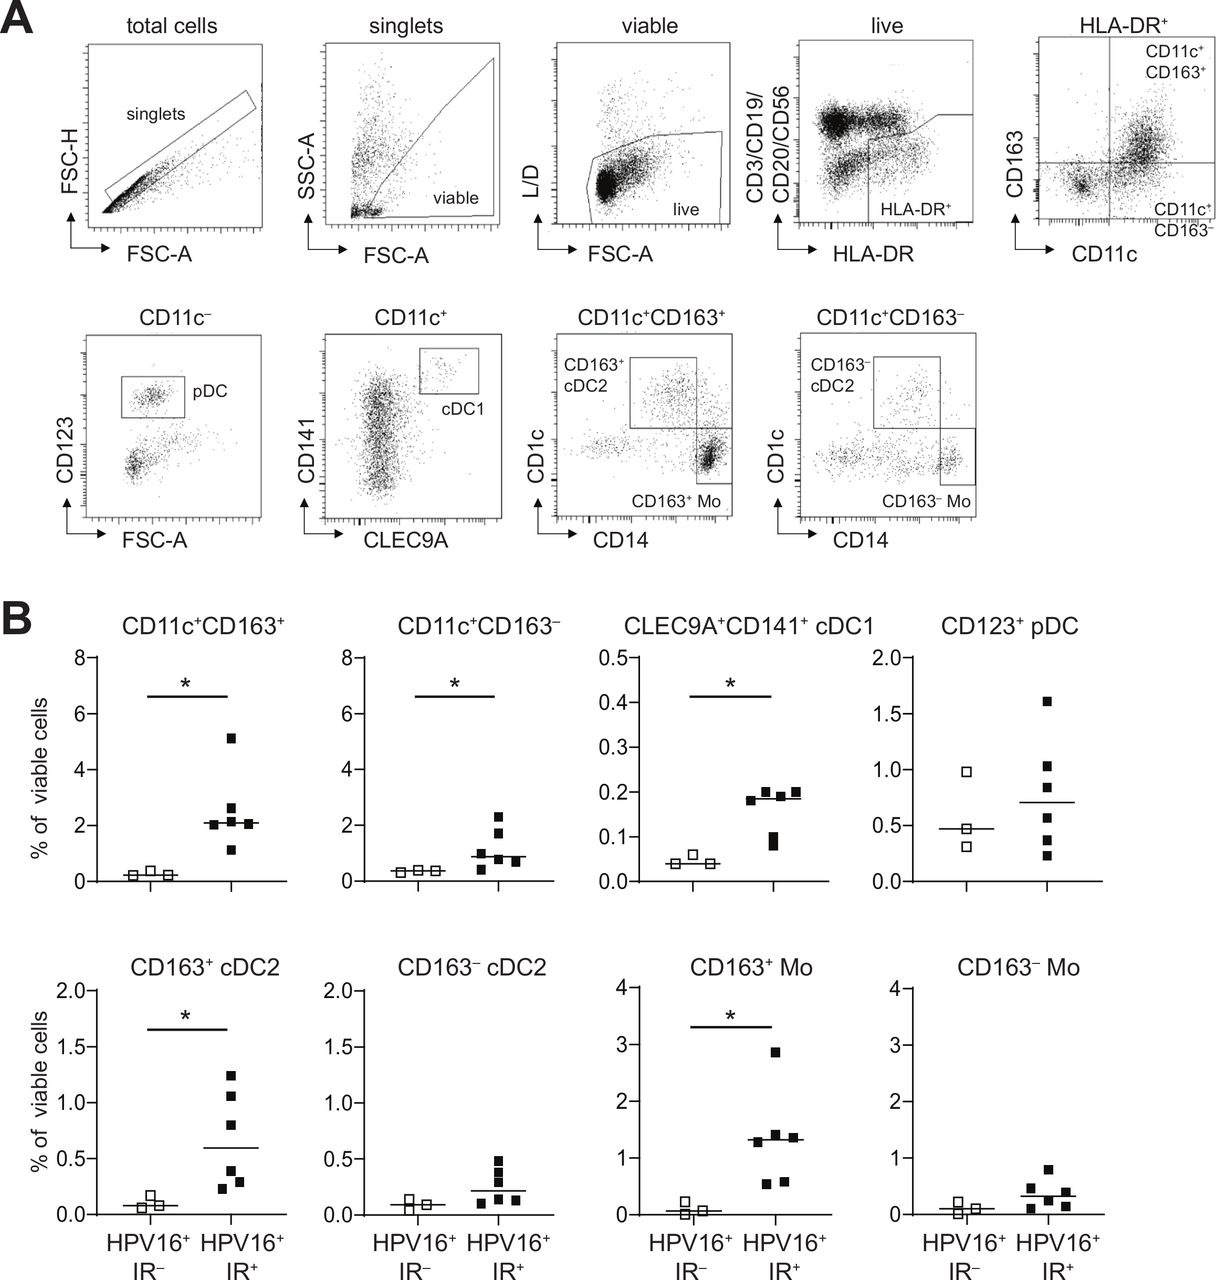
Recently a novel CD163+CD1c+ conventional type 2 DC subset (CD163+ cDC2; also known as DC314 15 was identified in the blood, the percentage of which was increased in the blood of patients with systemic lupus erythematosus (SLE) and correlated with the SLE disease activity index,14 suggesting that these DCs promoted inflammation. Therefore, a series of HPV16+ OPSCC single cell digests was used to delineate whether the observed tumor-infiltrating CD14‒CD33‒CD163+ cells resemble these DC3s, using phenotypic analysis by flow cytometry. Nine freshly digested HPV16+ OPSCC samples (n=3 IR‒ and n=6 IR+) were stained with fluorescently labeled antibodies (online supplementary table 3) and analyzed by flow cytometry according to the gating strategy shown in figure 3A. Higher frequencies of total CD11c+CD163‒ and CD11c+CD163+ cells were detected in the TME of HPV16+IR+ OPSCC (figure 3B). Two main subsets were found, namely CD14+CD1c‒ monocytes (Mo) and CD14‒CD1c+ cDC2. Whereas CD163+ Mo and CD163+ cDC2 were significantly increased in HPV16+IR+ tumors, this was not the case for their CD163‒ counterparts (figure 3B). These data clearly indicate that CD14‒CD33‒CD163+ cDC2 in the TME of HPV16+ OPSCC phenotypically resemble blood DC3.

CD14‒CD33‒CD163+ myeloid cells in the TME of HPV16+ OPSCC express CD1c and phenotypically resemble cDC2. Freshly dissociated OPSCC tumor tissue from nine HPV16+ patients with OPSCC was analyzed by 13-parameter flow cytometry analysis with antibodies directed against CD3/CD19/CD20/CD56, CD11c, HLA-DR, CD14, CD11b, CD163, CD141, CLEC9A, CD1c, CD16, CD123, CD36 and CD32B. (A) Gating strategy for a representative OPSCC sample is depicted. Singlets were gated on FSC-H/FSC-A properties, after which dead cells and granulocytes were excluded through gating on SSC-A/FSC-A properties and yellow amine reactive dye-negative cells. Next, CD3‒CD1‒CD20‒CD56‒HLA-DR+ myeloid cells were selected, which were subsequently divided on the basis of CD163 and/or CD11c expression. Further characterization was done on by CD123, CD141, CLEC9A, CD1c and CD14, leading to the following populations: total CD11c+CD163+ and CD11c+CD163‒ cells, CD11c‒CD123+ pDC, CD11c+CD141+CLEC9A+ conventional DC1 (cDC1), CD11c+CD163+CD14‒CD1c+ cDC2 (CD163+ cDC2), CD11c+CD163+CD14+CD1 c‒ monocytes (CD163+ Mo), CD11c+CD163‒CD14‒CD1c+ cDC2 (CD163‒ cDC2), and CD11c+CD163‒CD14+CD1c‒ monocytes (CD163‒ Mo). (B) Scatter plots depicting CD11c+CD163+, CD11c+CD163‒cells, CLEC9A+CD141+ cDC1 and CD123+ PDC, (top) and CD163+ cDC2, CD163‒ cDC2, CD163+ Mo and CD163‒ Mo (bottom) cells in HPV16+IR‒ (open squares) and HPV16+IR+ (closed squares) patients with OPSCC. *p<0.05, **p<0.01, ***p<0.001 and ****p<0.0001. cDC2, conventional dendritic cell type 2; DC, dendritic cell; HPV, human papillomavirus; OPSCC, oropharyngeal squamous cell carcinoma; pDC, plasmacytoid DC; TME, tumor microenvironment.
CD14−CD163+ myeloid cells are bonafide T cell stimulating DC
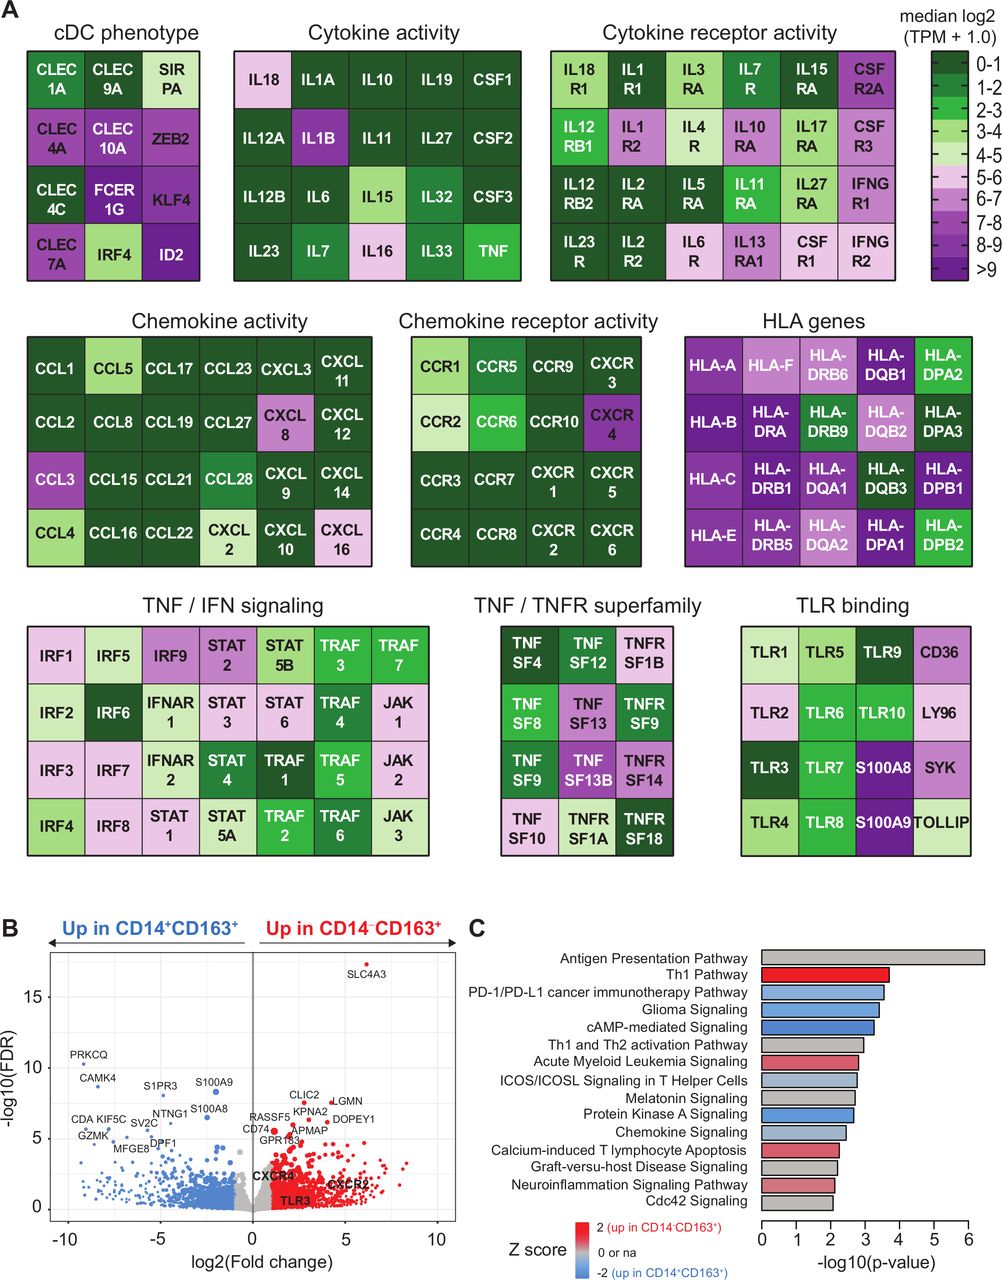
It is well established that DCs are potent stimulators of CD4+ and CD8+ T cell responses. Hence, we sorted CD14+CD163‒ and CD14+CD163+ monocytes, and CD14‒CD163‒ and CD14‒CD163+ DCs from peripheral blood (online supplementary figure 4A) and assessed their T cell stimulatory potential and cytokine secretion in vitro. Analysis of the sorted populations revealed that CD14‒CD163+ DCs displayed the highest expression of HLA-DR and consisted of a pure population of CD1c+ DCs, whereas the CD14‒CD163‒ population consisted of a mixture of CD1c+ and CD1c‒ DCs (online supplementary figure 4B–D). In addition, the CD14‒CD163+ cells expressed typical DC markers such as CD40, CD54, CD80 and CD86 (online supplementary figure 4E,F). Unlike monocytes, both types of DCs were capable of stimulating T cell proliferation and production of the type 1 cytokines IFNγ and IL-22 (figure 4A–D). Interestingly, while IL-2, IL-3, IL-4, IL-5 and IL-17A levels were undetectable in all conditions, T cells stimulated with CD14‒CD163‒ DCs produced also much more of the type 2 cytokines IL-9 and IL-13 than CD14‒CD163+ DC-stimulated T cells (figure 4D, online supplementary figure 5). This suggests that CD14‒CD163+ cDC2 predominantly stimulate type 1 T cell responses. Activation of the monocyte and DC subsets with LPS, R848, and poly(I:C) revealed that the CD14‒CD163+ DCs displayed a strong capacity to produce proinflammatory mediators IL-12p70, IL-18, GM-CSF, IL-10, IL-23, IL-6, IL-1α, IL-1β, MIP1α, MIP3α, TGFα and TNFα (figure 4E,F and online supplementary figure 6). Finally, the DC signature24 of CD14‒CD163+ myeloid cells was confirmed by transcriptome analysis showing the expression of CLEC4A, CLEC10A, IRF4, ID2, FCER1G, KLF4 and ZEB2 (figure 5A). Consistent with their DC gene signature, these cells also expressed high levels of HLA class I and II molecules, which are important for T cell stimulation, and expressed toll-like receptor (TLR)2, 4–6 and 8, making them sensitive for TLR-mediated activation (figure 5). Interestingly, the CD14‒CD163+ DCs also expressed IL-1β, IL-15, IL-16, IL-18, CCL3–5, CXCL16, cytokines and chemokines (figure 5A), which are important for attraction and activation of immune cells in the TME.25–31 Finally, we compared the gene expression profile of CD14‒CD163+ DC with CD14+CD163+ cells. This revealed several subset-specific upregulated genes, among which TLR3, CXCR2 and CXCR4 may be utilized as therapeutic targets for specific activation or recruitment of the CD14‒CD163+ DC (figure 5B and online supplementary table 5). Moreover, pathway analysis revealed a strong activation (positive Z score) of the Th1 pathway and an inhibition (negative Z score) of the programmed death (PD)-1/programmed death ligand 1 (PD-L1) cancer immunotherapy and inducible T cell costimulator (ICOS)/ICOS ligand (ICOSL) signaling pathways (figure 5C), highlighting the T cell stimulatory profile of the CD14‒CD163+ DC.
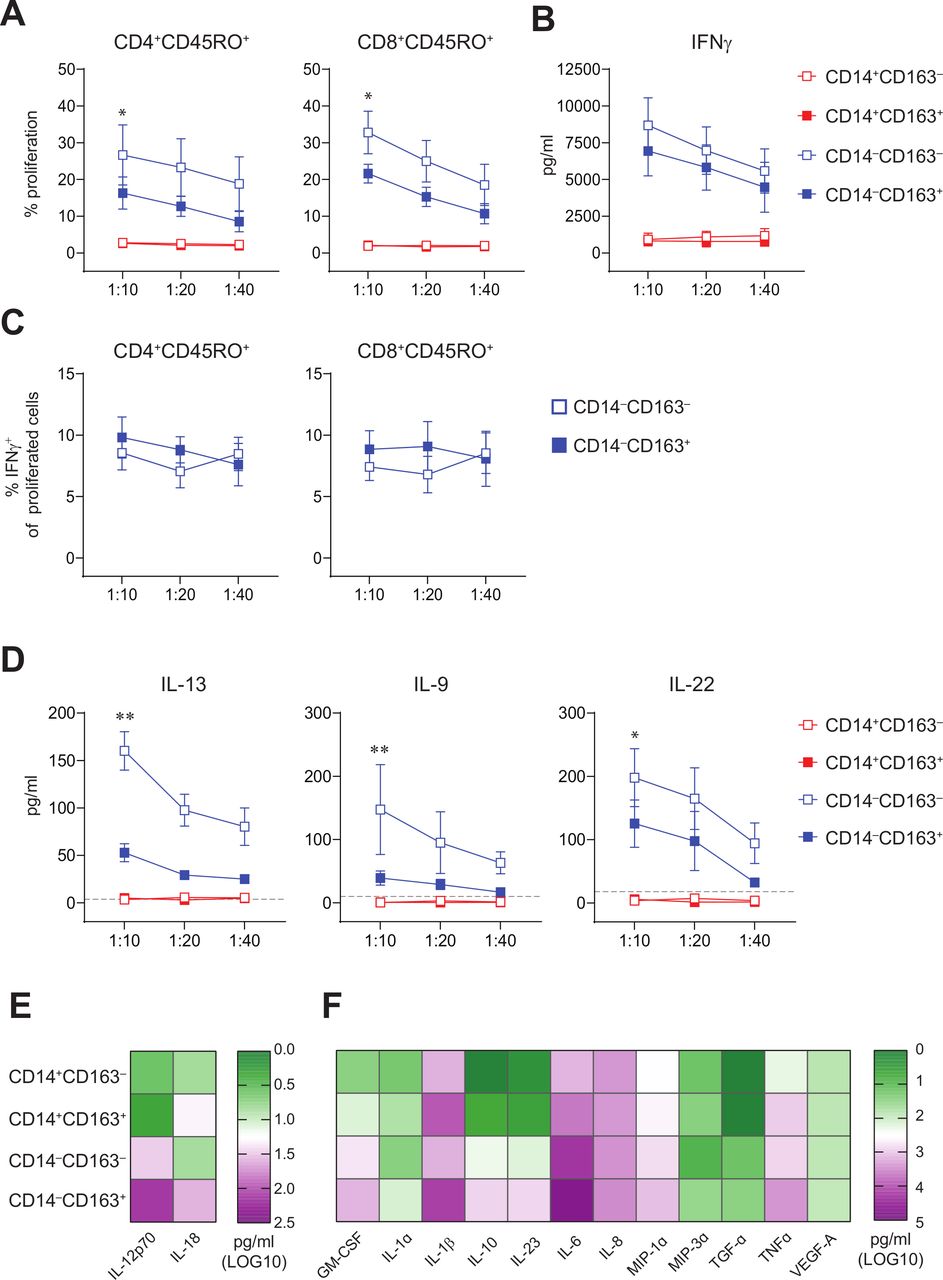
CD14‒CD163‒ and CD14‒CD163+ myeloid cells have allogeneic T cell stimulatory capacity and represent true DC. FACS-sorted CD14+CD163‒, CD14+CD163+, CD14‒CD163‒ and CD14‒CD163+ myeloid cells were tested for their T cell stimulatory and DC cytokine-producing potential. (A) Graphs depicting the percentage proliferation of CD4+CD45RO+ (left) and CD8+CD45RO+ (right) T cells within allogeneic PBMCs in response to CD14+CD163‒ (open red), CD14+CD163+ (closed red), CD14‒CD163‒ (open blue) and CD14‒CD163+ (closed blue) myeloid cells isolated from healthy donors (n=9, mean±SEM). (B) Graph depicting the IFNγ production in pg/mL of the total allogeneic PBMCs in response to the CD163‒ and CD163+ myeloid cells, as determined by ELISA (n=9, mean±SEM). (C) Graphs depicting the percentage of IFNγ+ cells of proliferated CD4+CD45RO+ (left) and CD8+CD45RO+ (right) T cells in response to CD14‒CD163‒ (open blue) and CD14‒CD163+ (closed blue) myeloid cells isolated from healthy donors (n=7, mean±SEM). (D) Graphs depicting the IL-13, IL-9 and IL-22 production in pg/mL of the total allogeneic PBMCs in response to the CD163‒ and CD163+ myeloid cells (n=8, mean±SEM), as determined by multiplex T cell cytokine assay. The dotted line indicates the lower limit of detection of each of the cytokines. (E, F) Heatmaps presenting (E) IL-12p70 and IL-18 (n=15) and (F) Granulocyte-macrophage colony-stimulating factor (GM-CSF), IL-1α, IL-1β, IL-10, IL-23, IL-6, IL-8, MIP-1α, MIP-3α, TGF-α, TNF-α and VEGF-A levels (n=12) in supernatants from toll-like receptor (TLR)-ligand stimulated CD14+CD163‒, CD14+CD163+, CD14‒CD163‒ and CD14‒CD163+ myeloid cells. Cytokines were determined by ELISA (E) and multiplex cytokine assays (F) and given as log10 values in pg/mL. *p<0.05, **p<0.01, ***p<0.001 and ****p<0.0001. DC, dendritic cell; PBMCs, peripheral blood mononuclear cells.

Transcriptome analysis of CD163+ cDC2 cells. CD5+CD14‒CD163+ DC and CD14+CD163+ were isolated by flow activated cell sorter (FACS) sorting and analyzed by bulk RNA sequencing as described.14 (A) Heatmaps displaying median log2-transformed TPM + 1.0 expression values of genes associated with CDC phenotype, HLA, TNF/TNFR superfamily, cytokine and chemokine (receptor) activity, toll-like receptor (TLR) binding and TNF and IFN signaling within CD163+ cDC2 cells. (B) Volcano plot showing differential gene expression between CD14+CD163+ and CD14‒CD163+ cells. Gene expression data are depicted as log2(Fold change) versus –log10(false discovery rate (FDR)). P values were calculated using DESeq2. (C) Ingenuity pathway analysis of differentially regulated genes (<0.05 FDR) between CD14+CD163+ and CD14‒CD163+ cells displayed as a histogram plot showing the −log10 (p value) and the Z score for each pathway using twofold upregulated and downregulated DEGs of each subset. cDC2, conventional dendritic cell type 2; DEGs, differentially expressed genes; TPM, transcript per million.
IL-12 and IL-18 are instrumental for IFNγ production by activated tumor-specific T cells
TLR-mediated activation of CD14–CD163+ cDC2 showed that they produced high amounts of IL-12p70 and IL-18 (figure 4E and online supplementary figure 6). These two cytokines have been described as important bridges between the innate and adaptive immune system, and to play a key role in T cell activation and driving Th1 differentiation by augmenting IFNγ production.32–34 Moreover, it has been described that intratumoral injection of DC engineered to secrete IL-12 and IL-18 leads to accelerated tumor rejection by the activation of a strong and diverse type 1 immune response in tumor-bearing mice.35 Therefore, we examined whether these cytokines also played a role in the type 1 T cell polarization by CD14–CD163+ cDC2. IL-18 receptor expression analyses showed its expression by approximately 20% of CD4+ and 40% of CD8+ peripheral blood T cells (figure 6A). Stimulation of T cells with either IL-12 or IL-18 alone failed to induce IFNγ production, but their combination synergized to stimulate the production of IFNγ by CD4+ and CD8+ memory T cells (figure 6B and online supplementary figure 7A), confirming previous studies.36 37 This effect was specific for IFNγ, as production of TNFα, IL-2 and IL-17A was not induced (online supplementary figure 7B).

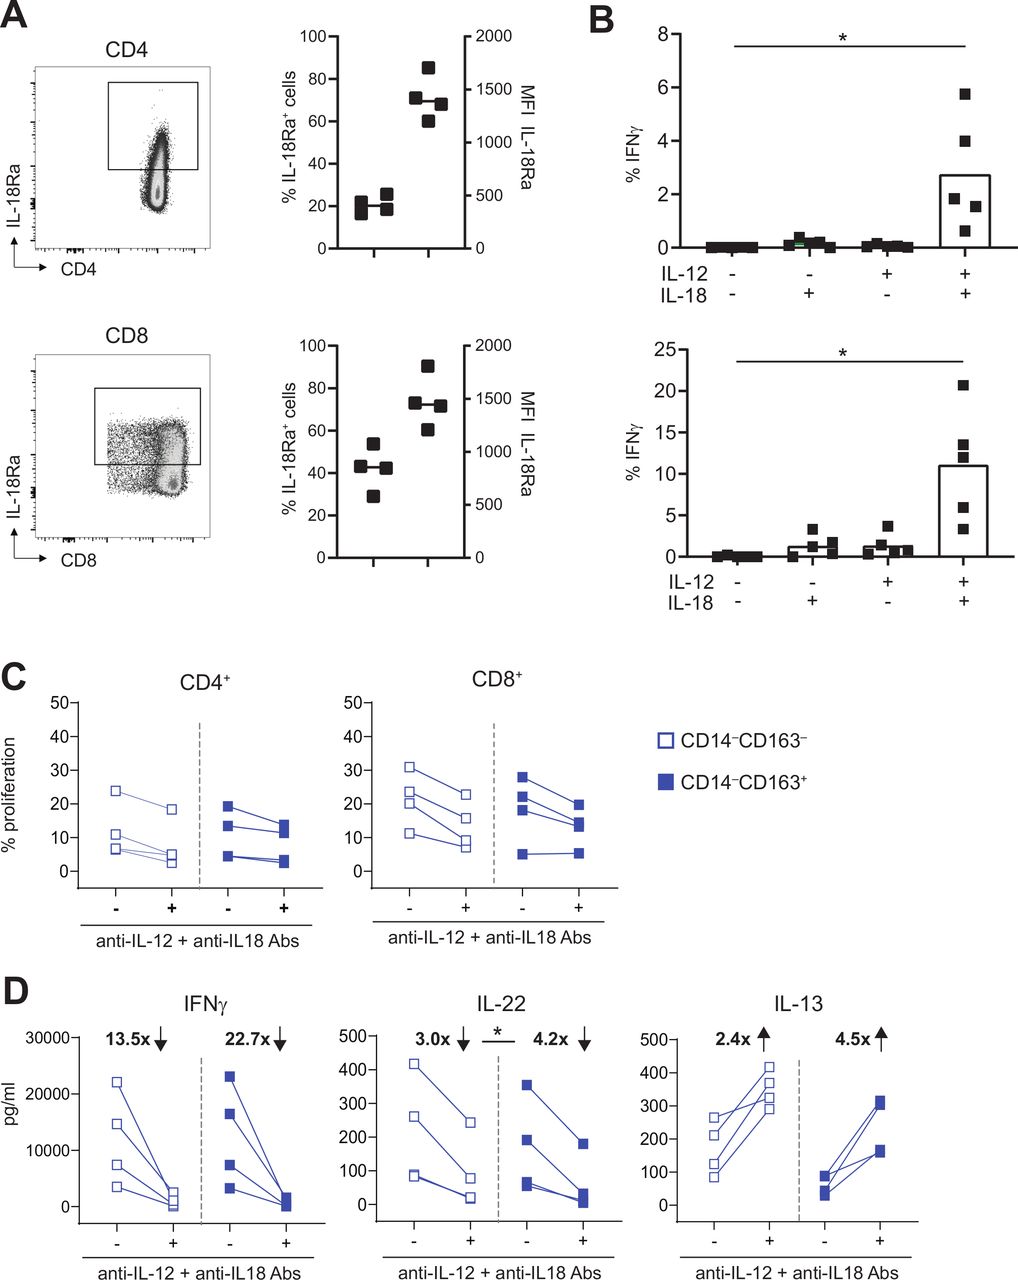
IL-12 and IL-18 are instrumental for IFNγ and IL-22 production by activated T cells. (A) IL-18Ra expression is depicted for CD4+ (top) and CD8+ T cells (bottom) for a representative healthy-donor PBMC sample (left) and four samples (right). scatter plots show percentage of IL-18RA+ cells (left Y-axis) and MFI of the IL-18RA+ cells (right Y-axis). (B) Graph showing percentage of IFNγ+ cells within CD4+CD45RO+ (top) and CD8+CD45RO+ (bottom) T cells after culture for 24 hours in the presence or absence of 50 ng/mL IL-12 and/or IL-18 (n=5). (C–D) To test the effect of blocking IL-12 and IL-18, proliferation and cytokine production of CD4+ and CD8+ CD45RO+ T cells or total PBMCs was assessed after stimulation for 4 days with CD14‒CD163‒ DC (open blue) and CD14‒CD163+ DC (closed blue) in the presence or absence of 10 µg/mL anti-IL-12 and anti-IL-18 antibodies. Graphs depict (C) the percentage proliferation of CD4+CD45RO+ (left) and CD8+CD45RO+ (right) T cells, and (D) the IFNγ (left), IL-22 (middle) and IL-13 (right) production in pg/mL by total PBMCs in the presence or absence of IL-12 and IL-18 blocking antibodies (n=4). The fold change in IFNγ, IL-22 and IL-13 production, which was calculated by dividing the mean cytokine concentration in the absence of blocking antibodies by the mean cytokine concentration in the presence of blocking antibodies, is depicted in bold as increased (↑) or decreased (↓) on blockade. *p<0.05, **p<0.01, ***p<0.001 and ****p<0.0001. DC, dendritic cell; MFI, mean fluorescence intensity; PBMCs, peripheral blood mononuclear cells.
Next, the role of IL-12 and IL-18 on the T cell stimulatory capacity of FACS-sorted CD14‒CD163‒ DC and CD14‒CD163+ cDC2 was determined by stimulating allogeneic CD4+ and CD8+ T cells in the presence or absence of neutralizing IL-12 and IL-18 antibodies. Neutralization of IL-12 and IL-18 had only minimal effect on the proliferation of CD4+ and CD8+ memory T cells (figure 6C). However, the production of the type 1 cytokines IFNγ and IL-22 by these T cells was clearly reduced on neutralization of IL-12 and IL-18 (figure 6D), while the production of the Th2 cytokine IL-13 was increased (figure 6 and online supplementary figure 8). The changes in cytokine production were on average stronger in T cells stimulated with CD14–CD163+ DCs (figure 6D). These data suggest an additional role for these CD14–CD163+ cDC2 in dampening Th2 differentiation via IL-12 and IL-18 production. The levels of IL-2, IL-3, IL-4, IL-5, IL-9 and IL-17A were low or undetectable and remained unaffected on neutralization of IL-12 and IL-18 (online supplementary figure 8).
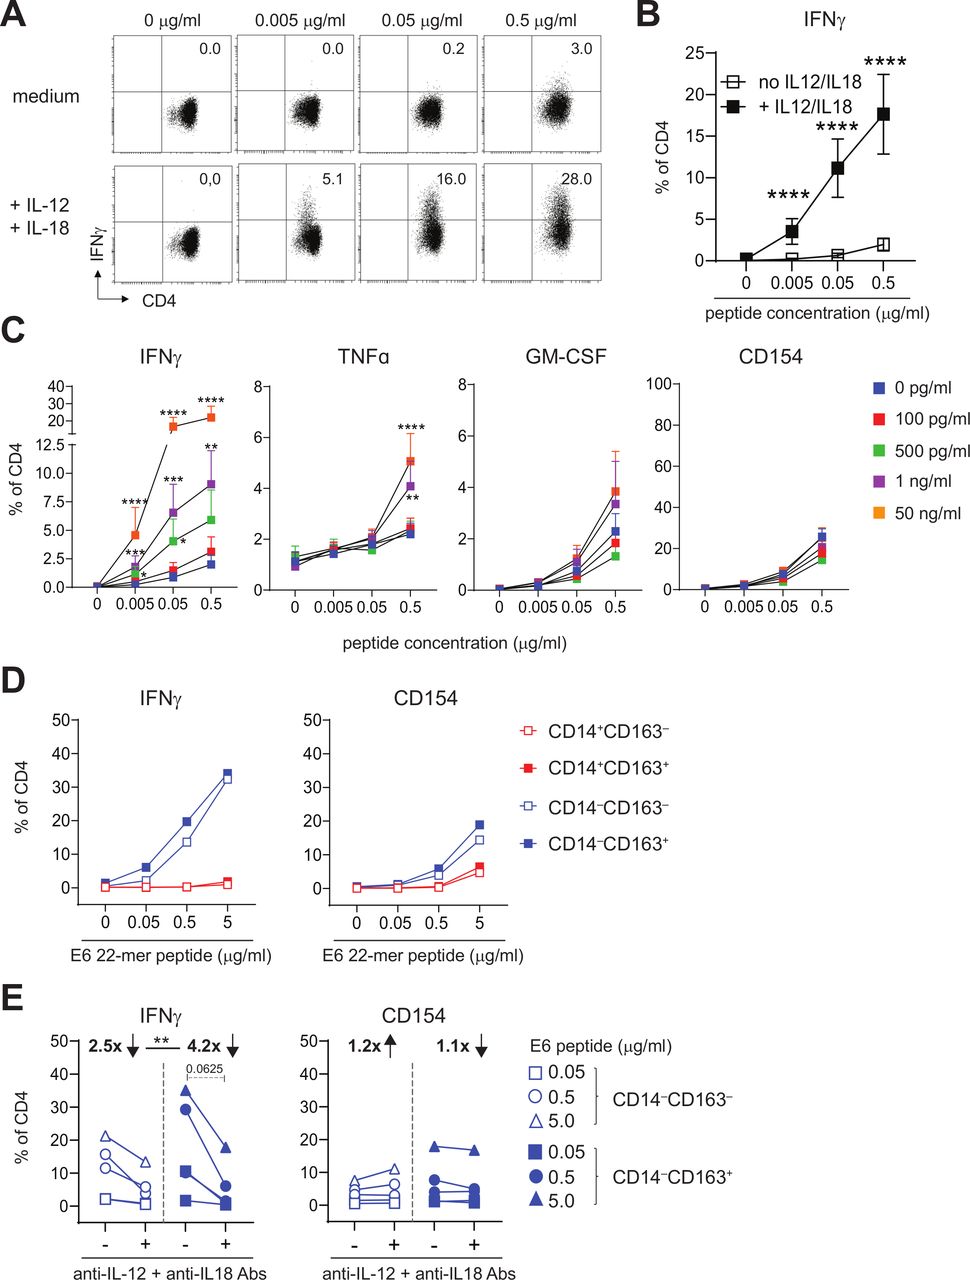
Next, we studied the effects of IL-12 and IL-18 on the reactivity of tumor-specific T cells, which are present in HPV16+IR+ OPSCC where CD14‒CD163+ cDC2 were found. On stimulation of 18 different HPV16-specific CD4+ helper T cell clones with increasing concentrations of cognate HPV16 antigen, in the presence or absence of recombinant IL-12 and IL-18, it became clear that the percentage of T cells producing IFNγ was significantly higher when IL-12 and IL-18 were present (figure 7A,B). Moreover, IFNγ-producing cells were detected already at much lower antigen concentrations (figure 7A,B). This effect was already observed at IL-12/IL-18 concentrations of 500 pg/mL and was specific for IFNγ, as this was not observed for GM-CSF and for TNFα only at the highest antigen and cytokine concentrations. Importantly, the increased IFNγ production by the helper T cell clones in the presence of IL-12 and IL-18 was truly a qualitative difference and not a quantitative difference, as expression of the activation marker CD154 on T cells was similar in the presence and absence of IL-12 and IL-18 at all of the antigen concentrations used to stimulate the T cells (figure 7C).

IL-12 and IL-18 are instrumental for IFNγ production by activated tumor-specific T cells. (A, B) Intracellular IFNγ staining is presented for a representative HPV16-specific Th clone (A) Eighteen different HPV16-specific Th clones (B) that have stimulated with peptide-loaded autologous B-LCL in the presence of medium (top panel in A; open squares in B) or 50 ng/mL IL-12 and IL-18 (bottom panel in A; closed squares in B). Concentrations of peptides used are 0, 0.005, 0.05, 0.5 µg/mL. (C) Graphs depicting the percentage of IFNγ+, TNFα+, GM-CSF+ and CD154+ (from left to right) cells within CD4+ cells for 9–11 different HPV16-specific Th cell clones in response to B-LCL loaded with cognate peptide (0, 0.005, 0.05 and 0.5 µg/mL) in the presence of 0 pg/mL (blue), 100 pg/mL (red), 500 pg/mL (green), 1 ng/mL (purple) and 50 ng/mL (orange) recombinant IL-12 and IL-18 (n=9–11, mean±SEM). (D) Graphs depicting the median percentage of IFNγ+ (left) and CD154+ (right) HPV16-specific Th cells following overnight stimulation with HPV16 E6 22mer peptide-loaded CD14+CD163‒ (open red), CD14+CD163+ (closed red), CD14‒CD163‒ (open blue) and CD14‒CD163+ (closed blue) cells of two Th clones. (E) Graphs depicting the percentage of IFNγ+ and CD154+ HPV16-specific Th cells in response to CD14‒CD163‒ (open blue) and CD14‒CD163+ (closed blue) cells in the presence or absence of 10 µg/mL anti-IL-12 and anti-IL-18 antibodies for two donors. Concentrations peptides used are 0, 0.05, 0.5 and 5.0 µg/mL (D) and 0.05, 0.5 and 5.0 µg/mL (E). *p<0.05, **p<0.01, ***p<0.001 and ****p<0.0001. HPV, human papillomavirus.
Finally, we also stimulated two different HPV16-specific Th clones with peptide-loaded, HLA-DPB1-matched CD14+CD163‒, CD14+CD163+, CD14‒CD163‒ and CD14‒CD163+ myeloid cells in the presence or absence of IL-12 and IL-18 neutralizing antibodies. CD14‒CD163+ cDC2 stimulated the IFNγ production by HPV16-reactive Th clones, and they do this as efficient as CD14‒CD163‒ DCs (figure 7D). Moreover, IL-12 and IL-18 neutralization resulted in a clear reduction in the percentage of IFNγ-producing cells, whereas the level of CD154 activation was not affected (figure 7E). Importantly, the IL-12/IL-18 blockade had a significantly stronger effect on Th cells stimulated with CD14‒CD163+ cDC2, in line with the fact that they produced the highest amounts of IL-12 and IL-18.
Discussion
In this study, we show that the TME of HPV16+ OPSCC tumors with ongoing HPV16-specific T cell responses is highly infiltrated with CD14‒CD33‒CD163+ DCs. These cells resemble a recently identified subset of cytokine-producing inflammatory DC3, and produce high levels of IL-12 and IL-18, cytokines that are required for optimal type 1 T cell polarization and IFNγ production by T cells after cognate antigen stimulation. Importantly, we found that their numbers correlated with the infiltration of Tbet+, tumor-specific T cells and with significantly prolonged survival, suggesting an important role for intratumoral DC3 in stimulating tumor-infiltrating T cells to exert their antitumor effects.
Although there is a large body of evidence that myeloid cells play an important role in tumor development and progression, knowledge on their role in OPSCC is limited and restricted to conflicting information on TAMs.7 11–13 Here, we found that the tumor epithelium and stroma of HPV16+ patients with OPSCC is also infiltrated with CD14+CD33 ‒ CD163+ and CD14+CD33+CD163+ myeloid cells that most likely are M2 macrophages, yet no relation with clinical outcome was observed for these cells. Interestingly, the TME of our HPV16+ patients with OPSCC was also highly infiltrated with an unexpected population of CD14 ‒ CD33 ‒ CD163+ cells, which particularly dominated the tumor stroma and clearly correlated with prolonged survival. These cells have been described previously by us and others in cervical, oropharyngeal and ovarian cancer,13 38 39 where they also were the most abundant myeloid cell population in tumor and stroma. Moreover, and different from the other studies, we found a clear correlation with prolonged survival in patients with high intratumoral levels of these CD14 ‒ CD33 ‒ CD163+ cells.13 38 39
It has been previously shown by several groups that CD163+ inflammatory, cytokine-producing CD1c+ cDC2 cells (DC3) can be found circulating in the blood.14 15 40 41 We are the first to show that these cells can also be found in the TME of HPV16+ patients with OPSCC, as the CD14 ‒ CD33 ‒ CD163+ cells we found comprise CD14‒CD68+CD163+ M2 macrophages and CD14‒CD68‒CD163+ CD1c+ cDC2. Moreover, CD163+ cDC2 express lectins such as CLEC4A and CLEC10A, produce proinflammatory mediators like GM-CSF, IL-10, IL-6, IL-1β, TNFα, CCL3, CCL4 and CCL5 and are capable of inducing T cell proliferation14 15 and Th1 polarization.42 Of note, and as described before, TLR-activated CD163+ cDC2 also produce IL-12p70 and IL-18, cytokines that have been described to play an important role in T cell activation and Th1 differentiation32–34 and whose intratumoral delivery, via intratumoral injection of engineered DCs, resulted in accelerated tumor rejection and the activation of a strong and diverse type 1 immune response.35 In line with those findings, we observed higher frequencies of CD163+ cDC2 in HPV16+ OPSCC tumors with a type 1-oriented, HPV16-specific and clinically favorable TME,3 suggesting that these cells contribute to better response of these tumors to standard of care therapy.
Interestingly, transcriptome analysis of CD163+ DC revealed the absence of CXCL9, CXCL10 and CXCL11, which are chemokines that are important for Th1 differentiation and migration to focal sites.43 However, CD163+ DC do express CCL3, CCL4, CCL5 and CXCL16, chemokines which also have been shown to direct CD8+ T cell infiltration into primary tumor sites.44–46 Of note, the homing and adhesion molecule CXCR6 (which is the receptor for CXCL16) has been found in numerous tissue-resident memory CD8+ T cell signatures.27 47 48 These cells have been extensively described to be involved in antitumor immunity,49 50 suggesting an important role for the CXCL16/CXCR6 axis in antitumor immunity.
CD163+ DC also expressed high levels of the chemokine receptor CXCR4, which via SDF-1/CXCR4 signaling may lead to a plethora of different functions in tumor biology and the immune system.51 Although it is described that the SDF-1/CXCR4 axis can contribute to tumor progression, either through CXCR4 expression on cancer cells themselves or through the CXCL12-guided attraction of CXCR4+ myeloid-derived suppressor cells (MDSC), regulatory T cells (Tregs) and plasmacytoid DC,52 there is also evidence that the SDF-1/CXCR4 axis promotes antitumor immune responses. CXCR4 is upregulated on DC maturation,53 required for DC migration toward peripheral tissue54 55 and CXCR4 engagement promotes DC maturation and survival. This suggests that engagement of this axis can also result in the generation of effective tumor immunity. In our hands these CXCR4-expressing CD163+ cDC2 were able to stimulate type 1 T cell responses, consistent with the fact that these DCs did not express PD-L1.
Our observation that high numbers of tumor-infiltrating CD14‒CD33‒CD163+ cells correlated with improved overall survival suggests that these cells play an important role in the generation of an effective antitumor response. To further translate this work into the clinic, it would be interesting to study whether these cells could serve as a prognostic marker for survival in a large cohort of patients with OPSCC. In addition, further studies aiming at refinement of their phenotype, and their subsequent association with survival, are warranted as our data clearly showed that the CD14‒CD33‒CD163+ cell population also included a fraction of CD14‒CD68+CD163+ M2 macrophages. From a clinical perspective, it would be of interest to study the recruitment of CD163+ cDC2 cells from the blood into the TME, potentially via CXCR2 or CXCR4, which are both expressed by these DCs. In addition, their expression of TRL3 may be exploited to activate them in vivo, in order to increase the local production of IL-12 and IL-18, and thus drive proper T cell activation and Th1 differentiation. For instance, through the intratumoral injection of the TLR3 ligand Poly(I:C).
In conclusion, we demonstrated that the TME of HPV16+ OPSCC tumors with ongoing HPV16-specific T cell responses is highly infiltrated with CD163+ inflammatory, IL-12 and IL-18-producing CD1c+ cDC2, also called DC3 and which are required for optimal type 1 T cell polarization and IFNγ production by T cells after cognate antigen stimulation. These data suggest an important role for intratumoral DC3 in stimulating tumor-infiltrating T cells to exert their antitumor effects, and development of new therapeutic strategies aiming at targeting and/or modulating this DC3 subset should be considered.
Acknowledgments
We gratefully thank all the patients and healthy individuals who participated in this study.
References
Footnotes
Contributors SJS, MJPW, and SHvdB helped in the conception and study design. Acquisition of data was done by SJS, CLD, EJJ, VJvH, IE, NML, CAD, FG, VP, and MJPW. Analysis and interpretation of data was done by SJS, CLD, EJJ, CAD, FG, VP, MJPW and SHvdB. Writing and review of the manuscript was performed by SJS and SHvdB. Patient management was done by SLvE and study supervision was done by SHvdB.
Funding SJS and IE are supported by a grant from the Dutch Cancer Society 2016-10168 to SHvdB. CLD and NML are supported by a grant from the Dutch Cancer Society 2017-10726 to SJS, MJPW and SHvdB. SHvdB is supported by a base fund from the Oncode Institute.
Competing interests None declared.
Patient consent for publication Not required.
Ethics approval The study was conducted in accordance with the Declaration of Helsinki and approved by the local medical ethical committee of the Leiden University Medical Center (P07-112) and in agreement with the Dutch law. The materials were used according to the Dutch Federation of Medical Research Association guidelines.
Provenance and peer review Not commissioned; externally peer reviewed.
Data availability statement Data are available upon reasonable request. All data relevant to the study are included in the article or uploaded as supplementary information. All data generated or analyzed during this study are included in this published article (and its additional files) and are available from the corresponding author on reasonable request.