Article Text

Abstract
Background Pancreatic ductal adenocarcinoma (PDA) is an almost incurable tumor that is mostly resistant to chemotherapy (CT). Adaptive immune responses to tumor-associated antigens (TAA) have been reported, but immunotherapy (IT) clinical trials have not yet achieved any significant increase in survival, confirming the suppressive environment of PDA. As CT has immune-modulating properties, we investigated the effect of gemcitabine (GEM) in antitumor effector responses to TAA in patients with PDA.
Methods The IgG antibody repertoire in patients with PDA before and after CT was profiled by serological proteome analysis and ELISA and their ability to activate complement-dependent cytotoxicity (CDC) was measured. Peripheral T cells were stimulated in vitro with recombinant TAA, and specific proliferation, IFN-γ/IL-10 and CD8+/Treg ratios were measured. Mice that spontaneously developed PDA were treated with GEM and inoculated with an ENO1 (α−Enolase) DNA vaccine. In some experimental groups, the effect of depleting CD4, CD8 and B cells by specific antibodies was also evaluated.
Results CT increased the number of TAA recognized by IgG and their ability to activate CDC. Evaluation of the IFN-γ/IL-10 ratio and CD8+/Treg ratios revealed that CT treatment shifted T cell responses to ENO1, G3P (glyceraldheyde-3-phosphate dehydrogenase), K2C8 (keratin, type II cytoskeletal 8) and FUBP1 (far upstream binding protein 1), four of the most recognized TAA, from regulatory to effector. In PDA mice models, treatment with GEM prior to ENO1 DNA vaccination unleashed CD4 antitumor activity and strongly impaired tumor progression compared with mice that were vaccinated or GEM-treated alone.
Conclusions Overall, these data indicate that, in PDA, CT enhances immune responses to TAA and renders them suitable targets for IT.
- vaccination
- immunotherapy
- antigens
- drug therapy
- combination
This is an open access article distributed in accordance with the Creative Commons Attribution Non Commercial (CC BY-NC 4.0) license, which permits others to distribute, remix, adapt, build upon this work non-commercially, and license their derivative works on different terms, provided the original work is properly cited, appropriate credit is given, any changes made indicated, and the use is non-commercial. See http://creativecommons.org/licenses/by-nc/4.0/.
Statistics from Altmetric.com
Background
Pancreatic ductal adenocarcinoma (PDA) is very challenging to treat, with only 8% of patients being cured. Gemcitabine (GEM) and FOLFIRINOX are currently considered the chemotherapeutic standard of care for treating advanced PDA.
Targeting the immune system is an active area of research for treating cancer, especially following recent successes obtained with immunotherapy (IT) in many solid tumors.1–3 Although immune checkpoint inhibitors represent an important breakthrough in the field of IT, they have not yet achieved tumor regression in patients with PDA.4 5 Significant improvements in IT clinical outcomes cannot be achieved without novel strategies that involve better comprehension of the tumor microenvironment, as well as identifying novel immunological targets.
PDA has a pronounced desmoplasia as a histological hallmark, which is derived from pancreatic stellate cells that are activated to proliferate and produce collagens, laminin, and fibronectin, which differentially shape the stroma.6 This is also believed to contribute to tumor hypoperfusion and hypoxia7 and harbor infiltrative macrophages and inflammatory cells with the potential to suppress antitumoral immune mechanisms.8 In addition to reactive fibroblasts and M2 macrophages, the PDA microenvironment also contains γδ-T cells, which are a source of IFN-γ, and are associated with a poor prognosis.9
We have previously shown that DNA vaccination that targets α-Enolase (ENO1), a tumor-associated antigen (TAA) that is upregulated in PDA, effectively prolongs survival in mice that spontaneously develop PDA.10 This increased survival results from the induction of specific antibodies to ENO1 that activate complement-dependent cytotoxicity (CDC); a decrease in tumor infiltration by regulatory T cells and myeloid-derived suppressor cells (MDSC);11 inhibition of migration and invasion of PDA cells;12 13 and an increase in tumor-infiltrating T cells10 that relocalize into tertiary lymphoid tissue.14
Considering the immune modulating effects of chemotherapy (CT) in a clinical setting,15–17 we decided to evaluate whether combining CT with IT can increase therapeutic efficacy in PDA. Here, we observed that, in patients with PDA, CT enhances adaptive immune responses to a number of TAA including ENO1, G3P (glyceraldheyde-3-phosphate dehydrogenase), K2C8 (keratin, type II cytoskeletal 8) and FUBP1 (far upstream binding protein 1). Notably, combining ENO1 DNA vaccination with GEM treatment significantly enhanced antitumor responses and efficacy to counteract tumor progression compared with mice which were vaccinated or GEM-treated only. These data indicate that—in patients with PDA—CT enhances immune responses to TAA and renders them suitable targets for IT.
Methods
Patients
From 2005 to 2011, 28 patients with newly diagnosed PDA were enrolled in the study approved. Inclusion criteria consisted of an ECOG performance status 0–2, signing of a written informed consent form and no previous CT or radiotherapy. Exclusion criteria consisted of a lack of ability to perform follow-up (1 year) and any previous malignant tumors, with the following exception: adequately treated basal/spino-cell carcinomas, cervical carcinoma in situ, and patients affected by other malignancies, but disease-free for at least 5 years at the date of enrollment.
In this cohort, 14 patients had been subjected to total surgical resection, 4 patients had received palliative resection only, and 10 patients had not been resected. All patients were treated with CT, 26 with GEM-based CT (GEM or GEM plus oxaliplatin) and 2 with capecitabine and bevacizumab (table 1).
Characteristics of patients
Peripheral blood mononuclear cells (PBMC) and sera samples were isolated from venous blood before CT, and after each round of CT, and stored until use.
Cell culture
PDA cell lines CFPAC-1, CAPAN-2, DT6606, and K8484 were cultured at 37°C in a humidified 5% CO2 atmosphere in DMEM (Invitrogen, San Giuliano Milanese, Italy) supplemented with 20 mM glutamine (Invitrogen), 10% certified fetal bovine serum (FBS) (Invitrogen), and 40 µg/mL gentamycin (Schering-Plow, Milan, Italy).
Proteomics studies
For proteomics studies, CFPAC-1 cells were untreated or treated with 0.25 µg/µL GEM for 24 hours. Procedure details are described in the online supplemental file. For serological proteome analysis (SERPA), CFPAC-1 cells were solubilized and proteins were quantified to perform two-dimensional electrophoresis (DE) and Coomassie staining, as previously described.18 19 2-DE gels were transferred to nitrocellulose membranes and incubated with sera from patients before and after CT. Detailed procedures are described in the online supplemental file.
Supplemental material
Complement-dependent cytotoxicity
CFPAC-1 or CAPAN-2 cells were seeded in 96-well plates (5×10⁴ cells/well). Cells were washed with warm PBS, incubated with sera diluted in PBS (1:1000) for 1 hour at 4°C, then washed again, followed by incubation with fresh reconstituted human complement (Cedarlane, Euroclone, Milan, Italy) diluted at 1:10 in PBS for 1 hour at 37°C. The CytoTox 96 non-radioactive cytotoxicity kit (Promega, Milan, Italy) is based on the ELISA, and detects the release of lactate dehydrogenase (LDH) after 4 hours of incubation from cells that have lost membrane integrity (lysed cells). A LDH positive control was added to empty wells of each plate, and all tests were performed in triplicate.
Antibody detection
The quantity of total IgG in 12 patients was measured using an ELISA kit before and after CT (Bethyl Laboratories, Montgomery, Texas, USA), following the manufacturer’s instructions. TAA (ENO1, FUBP1, K2C8, and G3P)-specific IgG responses of sera from 28 healthy subjects and 28 patients with PDA, before and after each round of CT, were analyzed by ELISA (see online supplemental file). Anti-ENO1 and anti-G3P IgG in mouse sera, at different weeks of age, were measured by ELISA using ENO1 or G3P, as previously described.
T cell responses
After thawing, PBMC from 13 patients, before and after each round of CT, were cultured at a density of 5×10⁴/well in RPMI (Invitrogen) plus 5% of FBS in 96-well microplates with 5 µg/mL of ENO1, FUBP1, K2C8, or G3P. At day 3, supernatants were collected and IFN-γ and IL-10 levels were measured by ELISA (BioLegend, Campoverde, Milan, Italy), following the manufacturer’s instructions. Specific production of IFN-γ and IL-10 in the supernatants was calculated by subtracting the concentration of each cytokine in the medium only from that in PBMC stimulated with TAA. These specific concentration values were pseudocounted (+1) and then expressed as an IFN-γ/IL-10 ratio. At day 5, proliferation was evaluated using a tritiated-thymidine (3H-TdR) incorporation assay (see online supplemental file). Stimulation index (SI) T cell proliferation was calculated by dividing the cpm from PBMC stimulated with each antigen by the cpm of PBMC cultured in medium only. PBMC from five patients were cultured 5×10⁵ in 48-well plates in the presence of each TAA, as described above, and at day 3, cells were collected and stained with anti CD4-PercP, CD8-APC, and FoxP3-FITC to perform flow cytometer analysis (see online supplemental file).
In vivo experiments
Pancreatic cancer-prone KC mice were generated by crossing single-mutated KrasG12D with C57BL/6 mice expressing Cre recombinase (see online supplemental file). KC mice were treated twice at week 8 by i.p. injection with GEM (on Monday and Friday) using 1 mg/injection/mouse. The ENO1 vaccine was administered at 9 weeks of age, and every 2 weeks for a total of three rounds of vaccination (see online supplemental file). Mice were sacrificed at 24 weeks of age, and pancreases were fixed in formalin and embedded in paraffin for analyzing tumor lesions and immunohistochemistry (see online supplemental file). Different experimental groups of mice were depleted of CD4, CD8 or CD20 (Bioxcell, West Lebanon, New Hampshire, USA) every 3 days (200 µg/mouse/injected i.p.) until the week after the final vaccination. At 14 weeks, depleted mice were sacrificed, and pancreases were fixed in formalin and embedded in paraffin for evaluating tumor lesions and anti-ENO1 antibody titers. To test the effectiveness of GEM+ENO1 vaccination on established tumors, C57BL/6 mice were injected subcutaneously with pancreatic tumor cells in the right flank (K8484, 1×10⁵ cells/mouse) and treated with GEM+ENO1 vaccination when tumors reached 0.2 cm in diameter, as described above.
Enzyme-linked immunosorbent spot assay (ELISpot)
Splenocytes from treated or untreated mice were stimulated in vitro for 4 days in the presence of 10 µg/mL of selected TAA proteins. Recovered T cells were seeded at a density of 1×10⁵/well in triplicate and stimulated with DT6606 cells (with a stimulator/effector ratio of 1:100) or 5 µg/mL TAA for 48 hours to evaluate specific IFN-γ production by ELISpot assay (see online supplemental file).
Statistical analysis
Data from SERPA experiments, protein differential expression, overall survival, immunohistochemical and FACS staining, ELISA, and ELISpot were analyzed, as described in the online supplementary file.
Results
Analysis of the autoantibody response to TAA in patients with PDA before and after CT
Circulating IgG from the sera of 28 patients with PDA before and after one or two rounds of CT were profiled by SERPA. In CT-treated patients with PDA, a clear enhancement of the IgG-specific response in both the number and intensity of recognized TAA was observed (figure 1A, B). This increase was not due to a global enhancement of total IgG after two rounds of CT as no difference in sera IgG levels was detected by ELISA (online supplemental figure 1A).
Supplemental material
Supplemental material

Analysis of the reactivity of sera from patients with PDA to recognize the PDA cell proteome and of their ability to induce CDC before and after CT. (A) Recognition of the proteome 2-DE map of the CFPAC-1 cell line by a representative PDA serum before and after CT. (B) Quantitative evaluation of increased IgG autoantibody recognition before and after CT. Results represent the mean of the percentage of all recognized spots. (C) Bar graph of LDH release measured as OD by damaged CFPAC-1 (black bars) and CAPAN-2 (white bars) cells subjected to CDC by patient sera before and after CT. All graphs indicate mean±SEM from 28 patients with PDA analyzed, and statistical significance is shown. CDC, complement-dependent cytotoxicity; CT, chemotherapy; LDH, lactate dehydrogenase; OD, optical density; PDA, pancreatic ductal adenocarcinoma; 2-DE, two-dimensional electrophoresis.
The CDC of sera from patients with PDA before and after CT was evaluated in CFPAC-1 cells (complement sensitive), which do not express complement activity inhibitor CD55, and in CAPAN-2 cells (complement resistant), which do express CD55 (online supplemental figure 1B). A significant difference between sera-induced LDH release in CFPAC-1 and CAPAN-2 cells after the first and second rounds, but not before CT, was observed. A significant increase of sera-induced LDH release against CFPAC-1, but not in CAPAN-2 cells, was found after CT rounds (figure 1C).
Mass spectrometry revealed 91 proteins from 160 isoforms, highlighted by SERPA as distinct spots (online supplemental table 1A and online supplemental figure 1C). Following CT, a widespread and progressive increase of the autoantibody response to TAA was observed (figure 2). There was an increase in 32 TAA recognized in at least three patients after CT (online supplemental figure 1D), among which ENO1 was the most recognized TAA (online supplemental table 1B), in accordance with our previous studies.20
Supplemental material

Analysis of the autoantibody response of patients with PDA after CT. Heatmaps representing the variation of antigen recognition level by autoantibodies measured by SERPA in sera from 28 patients with PDA receiving one round (left) or two rounds (right) of CT compared with before CT. Columns represent patients, and rows represent the antigens identified-listed in online supplemental table1A (all the isoforms of ENO1, FUBP1, K2C8 and G3P are indicated in red). Clustering analysis was performed considering data from patients receiving one CT round only (left). Rows and columns of the heat map reported in the right panel are sorted according to this clustering. CT, chemotherapy; PDA, pancreatic ductal adenocarcinoma.
Proteomic analysis of GEM-treated CFPAC-1 cells revealed that CT modified the expression of 34 proteins, of which 12 corresponded to TAA whose autoantibody recognition was increased in patients with PDA following CT (online supplemental figure 2A,B and supplemental table 2).
Supplemental material
Supplemental material
The 32 protein targets of autoantibody responses following CT (online supplemental figure 1D) were coded by 23 genes transcriptionally overexpressed in The Cancer Genome Atlas (TCGA) patients with PDA (online supplemental figure 3) and gene-set enrichment analysis (online supplemental table 3).
Supplemental material
Supplemental material
There was considerable TAA recognition by autoantibodies of patients, and 11 TAA were recognized by at least 7 patients before and/or after CT (online supplemental table 1B). Four TAA, namely ENO1, FUBP1, K2C8 and G3P, were selected to represent metabolic-related, cytoskeletal-related and transcription-related molecules. A statistically significant correlation was found between patient survival and the increased autoantibody recognition of G3P and K2C8 after the first round of CT (figure 3A,B). Data from ELISA showed that a group of patients with PDA displayed a significantly higher level of autoantibodies to all four TAA compared with healthy subjects (figure 3C). A significant increase of autoantibodies to ENO1, K2C8 and G3P was measured in patients with PDA after CT (figure 3C), confirming the SERPA results.

Detection of autoantibodies to TAA before and after CT, and correlation with survival of patients with PDA. (A,B) Survival curves of patients with PDA (n=28) with increased (dotted line) or unchanged/decreased (solid line) of 2-DE western blot reactivity of autoantibodies to G3P_20 (A) and K2C8_16 (B) isoforms after CT. (C) ELISA detection of autoantibodies to ENO1, FUBP1, K2C8 and G3P in healthy subjects and sera of patients with PDA before and after CT. Each graph indicates the OD mean (n=28), and statistical significance is shown. CT, chemotherapy; OD, optical density; PDA, pancreatic ductal adenocarcinoma; TAA, tumor-associated antigens; 2-DE, two-dimensional electrophoresis.
T lymphocyte responses to TAA in patients with PDA before and after CT
Peripheral blood T lymphocytes from patients with PDA were stimulated with each of the four selected TAA, and the proliferation, regulatory (IFN-γ/IL-10 ratio <1), effector (IFN-γ/IL-10 ratio >1), or null cytokine responses (no production of either IFN-γ or IL-10) was monitored (table 2).
TAA-induced cytokine and proliferative response of PBMC from patients with PDA before and after CT treatment
Overall, the number of patient T cell proliferative responses (evaluated as SI≥2) to selected TAA were significantly increased after CT rounds (online supplemental figure 3A).
The relationship between proliferative and regulatory/effector responses to each TAA were also analyzed. Before CT, only one patient (pt. 24) displayed an effector response to ENO1. By contrast, seven patients (pt. 3, 9, 10, 24, 30, 32, 87) showed effector responses after CT, with just two of them (pt. 32, 87) being associated with a proliferative response (table 2). Before CT, four patients (pt. 3, 19, 41, 87) displayed effector responses to FUBP1, but only two showed a concomitant proliferative response (pt. 41, 87). After CT, the number of patients that displayed an effector response increased to 11 (pt. 3, 5, 9, 10, 19, 24, 25, 27, 30, 41, 84), with 8 of them (pt. 5, 9, 10, 25, 27, 30, 41, 84) being associated with a proliferative response (table 2). Before CT, six patients (pt. 3, 19, 25, 41, 84, 87) displayed an effector response to K2C8, with four of them (pt. 25, 41, 84, 87) showing concomitant proliferative responses. After CT, there was a regulatory-to-effector shift in three patients (pt. 9, 10, 24); an increase in effector responses in three patients (pt. 3, 19, 87); and a decrease in regulatory responses in one patient (pt. 30). Among these seven patients, five (pt. 9, 10, 24, 30, 87) were associated with proliferation (table 2). Before CT, three patients (pt. 3, 24, 87) displayed a G3P-induced effector response, with only one (pt. 87) showing a concomitant proliferative response. After CT, there was a regulatory-to-effector shift in two patients (pt. 9, 19); an increase in effector responses in four patients (pt. 3, 10, 24, 87); and a reduction in regulatory responses in two patients (pt. 30, 41). Among these eight patients, seven (pt. 3, 9, 10, 24, 30, 41, 87) showed T cell proliferation.
A significant increase of the ratio between the percentage of CD8 and Treg after one and two CT rounds was also observed in TAA-stimulated T lymphocytes from patients with PDA (online supplemental figure 3B and supplemental table 4).
Supplemental material
Effect of combining CT and ENO1 DNA vaccination on antitumor immunity in the KC pancreatic cancer mouse model
The effect of the combined treatment of CT and DNA vaccination to ENO1, a TAA expressed in the early phases of PDA carcinogenesis (online supplemental figure 5A) was evaluated in KC mice.
Supplemental material
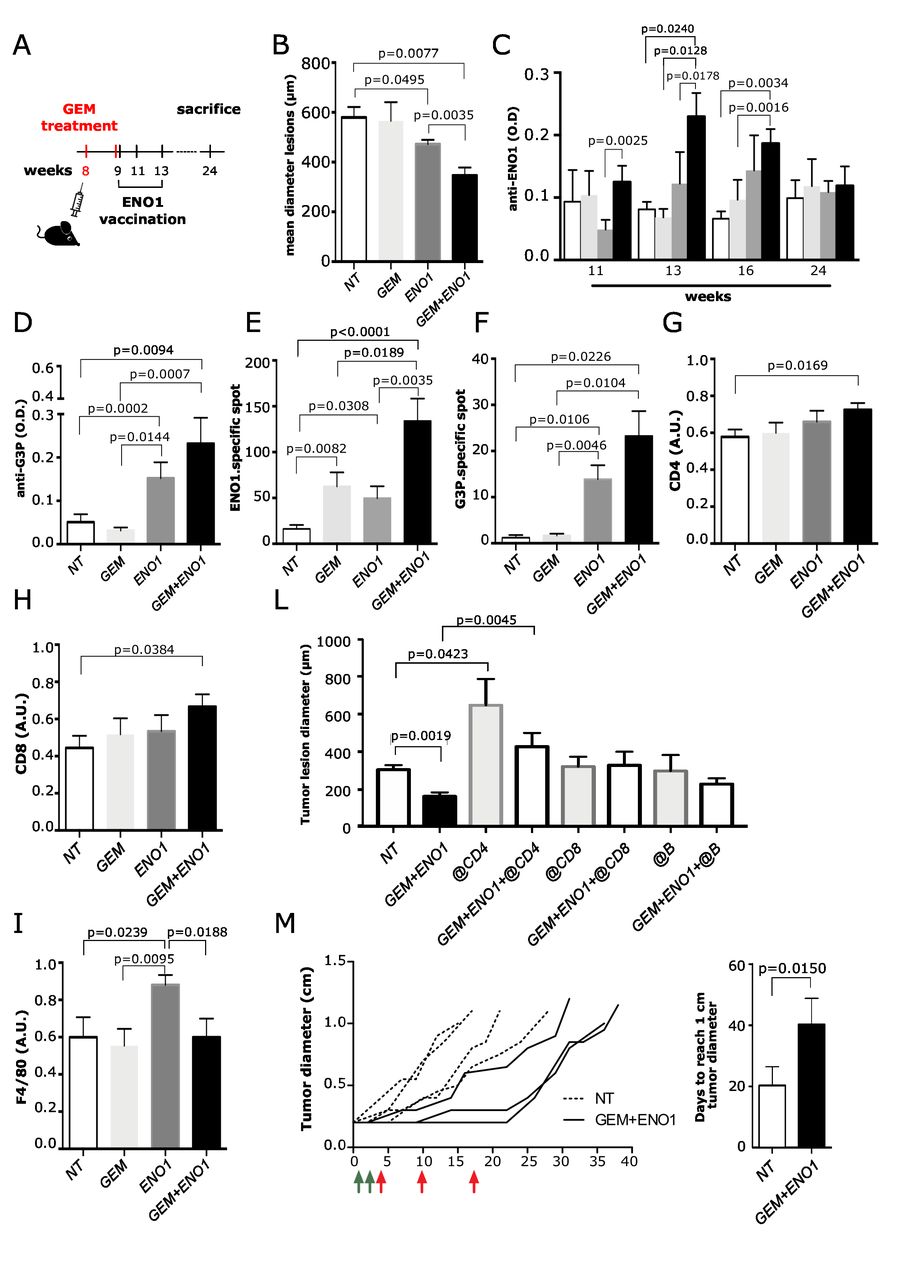
KC mice were treated with a suboptimal dose of GEM and then vaccinated with ENO1 (figure 4A). The size of all neoplastic lesions (from PanINs to invasive PDA) was evaluated by H&E staining. Both ENO1 and GEM+ENO1 treatment induced a significant reduction of PDA lesions compared with untreated mice and GEM+ENO1 treatment further reduced tumor lesions compared with the ENO1 vaccine alone (figure 4B). The evaluation of both the number and size of invasive PDA and PanIN lesions showed that ENO1 vaccination and combined treatment reduced the number of both invasive and PanIN lesions, whereas only the size of PanIN lesions were reduced by ENO1 vaccination alone and to a larger extent by combined treatment (online supplemental figure 6).
Supplemental material
Effect of combination of GEM and ENO1 vaccination in KC mice. (A) Schematic representation of mice treatment schedule. (B) Evaluation of the mean of tumor lesion diameter in treated mice sacrificed at 24 weeks of age. (C) ELISA detection of anti-ENO1 IgG titer (referred to as OD) in sera of mice throughout the treatment period. The experimental groups are indicated as follows: untreated (NT, white bars), GEM (light gray bars), ENO1 (dark gray) and GEM+ENO1 (black bars). (D) ELISA detection of anti-G3P IgG antibody (referred to as OD) in mice at 16 weeks of age. (E,F) ELISpot analysis of IFN-γ-secreting cells (indicated as number of specific spots) in the different treated groups at sacrifice after restimulation with ENO1 (E) or G3P (F) recombinant protein. (G–I) Immunohistochemical staining of CD4 (G), CD8 (H) and macrophages (I) in tumor lesions of mice at sacrifice. (L) Effect of the depletion of CD4, CD8 and B subsets in GEM+ENO1 or untreated mice, evaluated as the mean of tumor lesion diameter. (M) The spaghetti plot indicates the effect of combined treatment (GEM, green arrows; ENO1 vaccination, red arrows) on tumor growth, measured as tumor diameter. Treatment started when the mass of K8484 tumor cells injected subcutaneously reached 0.2 cm in diameter. The bar graph indicated the days required by the tumor mass to reach 1.0 cm of diameter in control and GEM+ENO1 experimental groups. In all experiments, the mice number per group was between 5 and 11; graphs report the mean±SEM values and statistical significance is shown. GEM, gemcitabine; OD, optical density.
Smaller tumor lesions were accompanied with an increase of anti-ENO1 IgG antibodies (figure 4C). ELISpot revealed that splenocytes from ENO1-vaccinated mice displayed a significantly higher number of IFN-γ-secreting cells, which was increased in the GEM+ENO1 group (figure 4E). These results were confirmed when syngeneic PDA murine DT6606 cells were used as a stimulus (not shown). GEM+ENO1 treatment caused an increase of both IgG production and IFN-γ secretion specific to G3P, enhancing the epitope spreading effect of ENO1 (figure 4D and F). No increase in anti-K2C8 or anti-FUBP1 IgG and IFN-γ was observed in GEM+ENO1-treated mice (data not shown).
Immunohistochemistry demonstrated that only GEM+ENO1 caused a significant increase of tumor-infiltrating CD4 and CD8 T cells (figure 4G–H and online supplemental figure 5B,C). Compared with untreated mice, an increase of macrophage infiltration was observed in ENO1-vaccinated mice, but not in GEM or GEM+ENO1 treated mice (figure 4I and online supplemental figure 5D). No differences in PD-L1 and FoxP3 expression were observed in tumor lesions among the different groups (data not shown). At 24 weeks, GEM+ENO1 mice showed a significant reduction of circulating CD4 and CD8 T cells, which supported the increased infiltration of these cells in tumor lesions (online supplemental figure 5E,F). In the GEM+ENO1 group, a significant correlation between CD4 and CD8 infiltration was observed (online supplemental figure 5G). Depletion of CD4, but not of CD8 or B cells, completely reverted the antitumor effect of the combined treatment (figure 4L). Anti-ENO1 IgG titers decreased significantly in all subset-depleted mice (online supplemental figure 5H). Finally, a significant delay of the growth of established 0.2 cm tumors was observed in GEM+ENO1 treated mice (figure 4M).
Discussion
It has been established that CT and radiotherapy enhance the antitumor immune response.21–24 In particular, GEM reduces the amount of MDSC, whereas it favors tumor-associated macrophage polarization to M1, and enhances cytotoxic T lymphocyte function, MHC-I expression by cancer cells, antigen cross-presentation by dendritic cells following GEM-induced apoptosis and increases CCL/CXCL chemokines.25–29 Here, we demonstrated that, in patients with PDA, CT induced a progressive increase of autoantibodies to many self-TAA, indicating a robust antigenic spreading. To date, antigen spreading has been documented in clinical trials using mesothelin CAR T cells in patients with PDA.30 Our data showed that antigen spreading is induced by ENO1 vaccination and further increased in combination with GEM, eliciting antibody and T cell responses to G3P.
Many TAA recognized by patients’ autoantibodies are highly expressed in PDA (online supplemental figure 3 and supplemental table 3) suggesting their role in PDA development. We showed that after CT, antibodies to ENO1, G3P and K2C8 were increased in just a subset of patients, and additional studies are therefore needed to evaluate whether the increased antibody response to TAA is a useful tool to stratify patients for response to CT.
High ENO1 expression, as well as the specific autoantibody production, has been previously reported in patients with PDA and associated with a more favorable clinical outcome.20 31 The increase of CDC induced by sera of patients with PDA after CT, which we have documented, could explain the positive correlation between survival and the increased antibody response to G3P and K2C8. In fact, autoantibodies to these TAA predict the patient’s outcome in various malignancies.32–36 However, there is no possibility of comparing the presence of antibodies to K2C8 and G3P in a cohort of untreated patients with PDA to demonstrate the role of CT in these phenomena. This issue requires addressing in a separate study in a PDA mouse model.
The immunosuppressed PDA microenvironment and the consequent T cell exhaustion play a role in immune-resistance.37–39 We have shown that CT increased TAA-induced effector responses and enhanced the number of TAA recognized by each patient with PDA, which is only partially associated with T cell proliferation.
In this study, we demonstrated that the combination of CT with ENO1 vaccination elicits a strong antitumor activity in KC mice. However, ENO1 vaccination and combined treatment seem to be much more effective in reducing PanIN lesions rather than invasive PDA. We are aware that treating KC mice at 8 weeks of age, when only PanIN lesions were present40 does not recapitulate the human scenario. As advanced, metastatic tumors are diagnosed in most patients with PDA, treating premalignant lesions (PanIN) with IT, in combination with CT, remains a difficult task. However, our data from patients with PDA that show that CT increases the coordinated immune response to TAA may open a therapeutic window for patients with PDA, which deserves to be evaluated for precision IT by targeting one or more TAA that are recognized.
In this study, combination of just one cycle of GEM with ENO1 DNA vaccination reduced PDA lesions compared with ENO1 vaccination alone. The combined treatment also induced antibodies and T cell responses to G3P. While in patients with PDA, antigen spreading involved a progressive increase in the number of TAA recognized by autoantibodies after CT, in mice, increased humoral and cellular recognition to G3P was induced by ENO1 vaccination and was further increased by CT. The epitope spreading effect involved G3P, but not K2C8 and FUBP1, suggesting possible differences in the potential tumor clonality of this model. We cannot rule out that, after combined therapy, the selected tumor cell clones lose K2C8 and FUBP1 expression or increase the expression of other TAA in addition to G3P.
The combined treatment caused a significant increase of infiltration of CD4 and CD8 T cells into tumor lesions, which was associated with a decrease of circulating CD4 and CD8 T cells. In PDA, CT induced the infiltration of CD4 and CD8 T cells to the tumor and correlated with a longer survival in patients, probably because it induced the death of immunogenic tumor cells.37 41 42 This is in agreement with our data showing that the CD4 and CD8 T cell infiltrate persisted for 3 months after the final vaccination in the GEM+ENO1 group.
Oncolytic virus increased the expression of PD-L1 via induction of IFN-γ, enhancing the effectiveness of combined administration with anti PD-L1 antibody.43 We did not observe any differences in FoxP3 and PD-L1 in tumor lesions of mice at 24 weeks of age (data not shown). ENO1-restimulated splenocytes from vaccinated mice produced IFN-γ, and to a greater extent in combined treated mice, suggesting that PD-L1 expression was probably not affected. However, we cannot rule out that IFN-γ-induced overexpression of PD-L1 occurred at an earlier time after vaccination. It will be interesting to evaluate the effect of the combination of PD-L1 antibody with CT and ENO1 vaccination.
Macrophages are associated with poor prognosis in PDA44 and secrete soluble factors that induce GEM resistance.45 46 Combination therapy did not affect the number of tumor-infiltrating macrophages, suggesting that it prevalently promotes T cell-mediated immunity. We cannot rule out, however, that a different functional polarization in macrophages (eg, M1 versus M2) can be induced by combination therapy. Tumor lesions increase in mice treated with combined therapy and anti-CD4 antibody, unveiling a role for CD4 T cells in GEM+ENO1 treatment in delaying PDA growth. While some reports showed that effective tumor immunity can occur in the absence of CD4 helper T cells, most indicated that CD4 T cells are important for generating tumor-specific CD8 T cells.47
Our results are in agreement with data from many vaccination models which show that CD4 T cells play a critical role in inducing antitumor immunity.48–50 Most of the identified TAA were intracellular and loaded onto MHC class II by antigen-presenting cells after phagocytosis of dying PDA cells exposed to CT.25–28 Generation of CD4 T cells specific for TAA favors the production of specific IgG by B cells (and favors CDC) and the generation of cytotoxic T lymphocytes by CD8 T cells.10 46 This supports the notion that the single depletion of these subsets only partially rescues tumor growth. The pivotal role of CD4 in this model is also shown by the observation that depletion of CD4 cells in untreated mice leads to very aggressive growth of tumors. Even if the type of CD4 T cells depleted in GEM+ENO1 treated mice is unknown, it is likely that the subset that was predominantly depleted consisted of T helper 1 and T helper 17 cells, in agreement with present and previous studies.10 These data are in agreement with those from the analysis of the effector phase of tumor rejection induced by vaccination, indicating a far broader role for CD4+ T cells in orchestrating the host response to tumors.51 This consists of the simultaneous induction of Th1 and Th2 cytokines, which activate eosinophils as well as macrophages to produce both superoxide and nitric oxide that leads to the induction of systemic antitumor immunity as well as tumor destruction within the growth site.51
In conclusion, our profiling of the immune response in patients with PDA, together with the preclinical mouse model validation, provide a proof-of-concept that CT combined with TAA vaccination may offer a promising solution for novel PDA treatments.
Supplemental material
Acknowledgments
We thank Roberta Curto for technical support in the in vivo experiments and Dr Radhika Srinivasan for critically reading the manuscript.
References
Supplementary materials
Supplementary Data
This web only file has been produced by the BMJ Publishing Group from an electronic file supplied by the author(s) and has not been edited for content.
Footnotes
Contributors GM and CC designed and performed the majority of experiments, interpreted the results, generated the figures and tables, and wrote the manuscript. CC and PC analyzed immunohistochemical staining. EM performed proteomic analysis. MP, SB and DV performed the in vitro experiments. AE, LF, GF, and FC performed the biostatistics analysis of the patients with PDA and analyzed the results. MAS, RS, and DG recruited patients with PDA. PC supervised and designed the in vivo experiments, interpreted the results, and wrote the manuscript. FN supervised the study, interpreted the results, and wrote the manuscript.
Funding This work was supported by grants from the Associazione Italiana Ricerca sul Cancro (5×mille no. 12182 to FN, IG no. 15257 to FN); University of Turin-Progetti Ateneo 2014-Compagnia di San Paolo (PC-METAIMMUN-OTHER to FN and PANTHER to PC); Italian Ministry of Health-Progetti Ricerca Finalizzata (RF-2013–02354892 to FN); Fondazione Ricerca Molinette Onlus (Funds CD38 and Associazione Ursula e Giorgio Cytron); and the Fondazione Nadia Valsecchi.
Competing interests None declared.
Patient consent for publication Not required.
Ethics approval The protocol for human samples was approved by the local research ethics committee (Azienda Ospedaliera Città della Salute e della Scienza di Torino, Turin), and investigations were performed according to the Helsinki Declaration principles. All participants in the protocol signed a declaration of informed consent. Mice were bred and maintained under saprophytic and pathogen-free conditions at the animal facilities of the Molecular Biotechnology Center (Turin) and treated in accordance with EU and institutional guidelines.
Provenance and peer review Not commissioned; externally peer reviewed.
Data availability statement Data are available on reasonable request. All data relevant to the study are included in the article or uploaded as supplementary information. All data generated during this study are included in this published article and its supplementary information files.
Supplemental material This content has been supplied by the author(s). It has not been vetted by BMJ Publishing Group Limited (BMJ) and may not have been peer-reviewed. Any opinions or recommendations discussed are solely those of the author(s) and are not endorsed by BMJ. BMJ disclaims all liability and responsibility arising from any reliance placed on the content. Where the content includes any translated material, BMJ does not warrant the accuracy and reliability of the translations (including but not limited to local regulations, clinical guidelines, terminology, drug names and drug dosages), and is not responsible for any error and/or omissions arising from translation and adaptation or otherwise.