Article Text

Abstract
Background T-cell-engaging CD3-bispecific antibodies (CD3-bsAbs) are promising modalities for cancer immunotherapy. Although this therapy has reached clinical practice for hematological malignancies, the absence of sufficient infiltrating T cells is a major barrier for efficacy in solid tumors. In this study, we exploited oncolytic reovirus as a strategy to enhance the efficacy of CD3-bsAbs in immune-silent solid tumors.
Methods The mutant p53 and K-ras induced murine pancreatic cancer model KPC3 resembles human pancreatic ductal adenocarcinomas with a desmoplastic tumor microenvironment, low T-cell density and resistance to immunotherapy. Immune-competent KPC3 tumor-bearing mice were intratumorally injected with reovirus type 3 Dearing strain and the reovirus-induced changes in the tumor microenvironment and spleen were analyzed over time by NanoString analysis, quantitative RT-PCR and multicolor flow cytometry. The efficacy of reovirus in combination with systemically injected CD3-bsAbs was evaluated in immune-competent mice with established KPC3 or B16.F10 tumors, and in the close-to-patient human epidermal growth factor receptor 2 (HER2)+ breast cancer model BT474 engrafted in immunocompromised mice with human T cells as effector cells.
Results Replication-competent reovirus induced an early interferon signature, followed by a strong influx of natural killer cells and CD8+ T cells, at the cost of FoxP3+ Tregs. Viral replication declined after 7 days and was associated with a systemic activation of lymphocytes and the emergence of intratumoral reovirus-specific CD8+ T cells. Although tumor-infiltrating T cells were mostly reovirus-specific and not tumor-specific, they served as non-exhausted effector cells for the subsequently systemically administered CD3-bsAbs. Combination treatment of reovirus and CD3-bsAbs led to the regression of large, established KPC3, B16.F10 and BT474 tumors. Reovirus as a preconditioning regimen performed significantly better than simultaneous or early administration of CD3-bsAbs. This combination treatment induced regressions of distant lesions that were not injected with reovirus, and systemic administration of both reovirus and CD3-bsAbs also led to tumor control. This suggests that this therapy might also be effective for metastatic disease.
Conclusions Oncolytic reovirus administration represents an effective strategy to induce a local interferon response and strong T-cell influx, thereby sensitizing the tumor microenvironment for subsequent CD3-bsAb therapy. This combination therapy warrants further investigation in patients with non-inflamed solid tumors.
- immunotherapy
- lymphocytes
- tumor-infiltrating
- oncolytic viruses
- tumor microenvironment
- interferon inducers
This is an open access article distributed in accordance with the Creative Commons Attribution Non Commercial (CC BY-NC 4.0) license, which permits others to distribute, remix, adapt, build upon this work non-commercially, and license their derivative works on different terms, provided the original work is properly cited, appropriate credit is given, any changes made indicated, and the use is non-commercial. See http://creativecommons.org/licenses/by-nc/4.0/.
Statistics from Altmetric.com
- immunotherapy
- lymphocytes
- tumor-infiltrating
- oncolytic viruses
- tumor microenvironment
- interferon inducers
Background
T-cell-engaging bispecific antibodies (bsAbs) are emerging as a potent therapeutic cancer modality.1 These Ig-based biologicals can induce dramatic responses in advanced malignancies, as was demonstrated with the use of a CD3xCD19 bsAb for the treatment of non-Hodgkin’s lymphoma.2 Currently, more than 40 other T-cell-redirecting bsAbs are in clinical development for both hematological malignancies and solid tumors.3 CD3-bispecific antibodies (CD3-bsAbs) are comprised of one arm engaging a tumor-associated antigen (TAA) expressed on the cell surface of cancer cells, and a second arm targeting T cells via CD3.4 By tethering T cells to tumor cells, these CD3-bsAbs create a functional immunological synapse.5 This results in selective T-cell-mediated killing of the target-expressing tumor cells, for which both CD4+ and CD8+ T cells can be employed.6 Since binding and activation of T cells occurs via CD3, these CD3-bsAbs can activate T cells in an major histocompatibility complex (MHC) class I- and T-cell receptor-independent manner. CD3-bsAbs can redirect a large proportion of the polyclonal T-cell pool toward the tumor, and thereby bypass the need for endogenous tumor-specific T cells.7 Despite the many advantages of these CD3-bsAbs, clinical development has been hampered by several factors, including low response rates in solid, immune-silent tumors.7 Factors associated with poor response to immunotherapy include the absence of an interferon (IFN) gene signature and lack of T cells in the tumor beds, generally referred to as a “cold” microenvironment.8 9
Oncolytic viruses (OVs) are increasingly recognized as potent anticancer moieties due to their virtue to selectively replicate in transformed cells and ignite an antiviral immune response in the malignant lesion.10 It has been demonstrated that OVs can sensitize resistant tumors for checkpoint blockade therapy.11–13 The mammalian reovirus type 3 Dearing strain (T3D), which is not associated with symptomatic disease in humans, is one of the leading OVs under clinical evaluation and displays an excellent safety record in clinical trials.14 15 Reoviruses show an inherent preference for replication in transformed, but not in healthy cells.16 17 Although reovirus has demonstrated some tumor regressions as a monotherapy in certain cancer types, such as in prostate xenograft models and prostate cancer patients, its potency might be better manifested in rationally designed combination strategies.18 19 In this study, we employed oncolytic reovirus as a strategy to enhance the antitumor efficacy of CD3-bsAbs in solid tumors. Using fully immunocompetent mouse tumor models, we demonstrated that injection with replication-competent reovirus converted immunologically cold pancreatic adenocarcinoma tumors to inflamed sites with a strong IFN signature and abundance of virus-specific CD8+ T cells. This effect depended on viral replication, which was controlled by the immune system within 2 weeks. Subsequent systemic administration of CD3-bsAbs resulted in regressions of local and distant large tumors. These findings provide evidence that preconditioning of the tumor microenvironment (TME) with an oncolytic reovirus is an attractive strategy to prime immune-silent tumors for effective CD3-bsAb therapy (Graphical abstract).
Supplemental material
Methods
Virus
The wild-type reovirus strain R124 (here referred to as reovirus) was previously isolated from a heterogeneous reovirus T3D stock (VR-824) obtained from the American Type Culture Collection (ATCC) by two rounds of plaque purification using HER911 cells.20 All experiments were performed using cesium chloride-purified stocks (see online supplemental materials). The total amount of particles was calculated based on optical density (OD)260 values, where 1 OD equals 2.10*1012 reovirus particles/mL.21 The infectious titer was quantified by plaque assay on HER911 cells.22 Reovirus particles were inactivated by exposure to shortwave ultraviolet light (254 nm) for 15 min at room temperature on a low-attachment 6-well plate (Corning).23 Afterward, the total amount of viral particles was determined based on the OD260 values. A correction value was calculated to ensure an equal number of viral particles for treatments with infectious and UV-inactivated reovirus (UVi).
Supplemental material
Bispecific antibodies
The CD3xTRP1 bsAb used is a knob-into-hole bispecific based on murine IgG2a with an Fc Silent mutation, featuring one arm with an anti-mouse CD3e single-chain variable fragment (scFv) based on the clone 145-2 C11, and the other arm containing the TA99 clone directed against tyrosinase-related protein-1 (TRP1) (bAb0136; Absolute Antibody). The CD3xHER2 bsAb comprises an antihuman CD3 scFv based on the clone OKT3, together with an anti-HER2 arm based on clone 4D5-8 (trastuzumab) (bAb0183; Absolute Antibody).
Cell lines
The murine pancreatic cancer cell line KPC3 is a low-passage derivate of a primary KPC tumor with mutant p53 and K-ras 24 from a female C57BL/6 mouse. KPC3.TRP1 cells were generated as described25 and selected for expression of TRP1 by cell sorting using an αTRP1 antibody (clone: TA99). The murine melanoma cell line B16.F10 (ATCC-CRL6475) and the human breast cancer cell line BT474 (ATCC-HTB-20) were purchased from the ATCC. More information can be found in the online supplemental methods.
Animal experiments
Male or female C57BL/6J mice (Charles River Laboratories, France) of 8 weeks old were used for the KPC3 and B16.F10 model, respectively. KPC3 or KPC3.TRP1 tumors were inoculated by subcutaneous injection of 1×10⁵ (for antitumor efficacy experiments) or 2×10⁵ (for intratumoral analysis experiments) cells in the right flank in 100–200 µL phosphate-buffered saline (PBS)/0.1% bovine serum albumin (BSA). For bilateral experiments, a second tumor was subcutaneously engrafted 1 week after the primary tumor on the alternate flank. B16.F10 tumors were engrafted by subcutaneous injection of 5×10⁴ cells in a volume of 100 µL PBS/0.1% BSA. Female nonobese diabetic (NOD).Cg-PrkdcscidIl2rgtm1Wjl/SzJ (NSG) mice of 6 weeks old (Charles River Laboratories) were used for the BT474 model. BT474 tumors were orthotopically engrafted by injecting 5×10⁶ cells in a volume of 100 µL 50:50 PBS/0.1% BSA:Growth Factor Reduced matrigel (Corning) in the fourth mammary fat pad of isoflurane-anesthesized mice. Human peripheral blood mononuclear cells (PBMCs) from a buffy coat of an anonymous consented donor (Sanquin Bloodbank, Amsterdam, The Netherlands) HLA-A29:02-matched to BT47426 were isolated by Ficoll-Paque density-gradient centrifugation. 5×10⁶ PBMCs were intravenously administered to each mouse in a volume of 100 µL PBS/0.1% BSA. Mice with palpable tumors were allocated into groups with similar average tumor size and assigned a treatment regimen. Intratumoral reovirus administration was performed by injection of 107 plaque-forming units (pfu) of reovirus or PBS as control in a volume of 30 µL on 3 consecutive days, unless otherwise indicated, while mice were under isoflurane anesthesia. Intravenous reovirus administration was performed by injection of 107 or 108 pfu of reovirus in a volume of 100 µL in the tail vein on 3 consecutive days. Treatment with CD3xTRP1 or CD3xHER2 bsAb consisted of three intraperitoneal injections of 12.5 µg antibody in 100 µL PBS given every other day. Treatment with FTY720 (Cayman Chemical) occurred by supplementing the mice with 2.5 µg/mL FTY720 in their drinking water and a daily oral dose of 2 µg FTY720/g body weight administered orally via pipetting into the mouth. During all experiments, tumors were measured 3–6 times a week in three dimensions using a caliper, in a blinded manner concerning the experimental group. For antitumor efficacy experiments, mice were euthanized when tumors reached the experimental endpoint, which equals a volume of 1000 mm3 (one-tumor model) or a combined volume of 1500 mm3 (bilateral tumor model). Mice were censored from analysis when they had to be euthanized due to humane endpoints before reaching the experimental endpoint. For intratumoral analysis experiments, mice were sacrificed at indicated days after treatment before tumors and/or spleens were collected. Tumors were divided into representative parts, which were either snap-frozen in liquid N2 and stored at −80°C until further analysis, fixed in 4% formaldehyde (AddedPharma) for immunohistochemistry (IHC) or immediately processed to single-cell suspensions to analyze the cellular composition by flow cytometry. These procedures are described in detail in the online supplemental methods.
Quantification of reovirus genomic copies by quantitative reverse transcription PCR (RT-qPCR)
Reovirus genomic copies were quantified by RT-qPCR of reovirus genomic segment 4 (S4) on RNA of cells, tumors and other organs, as described in the online supplemental methods. Reovirus S4 copy numbers were determined based on a standard curve, generated with serial dilutions of plasmid pcDNA_S4. Log10 S4 copy numbers were calculated using a previously described formula.27
NanoString analysis
Total RNA was isolated from a representative piece (10–30 mg) of each tumor as described in the online supplemental methods. RNA quality and integrity (RQI) were determined using the Experion Automated Electrophoresis System (Bio-Rad). Only samples with RQI score >8 were included for NanoString analysis. Multiplex gene expression was measured using the PanCancer Mouse Immune Profiling panel (NanoString Technologies). Two hundred nanogram of total RNA was hybridized for 17 hours, and quantified by scanning 490 Field Of Views using the Digital Analyzer (nCounter Flex). Data were processed and normalized using nSolver Analysis Software (V.4.0) and the Advanced Analysis module (NanoString). NanoString-defined markers were used to analyze cell type scores. Expression of reovirus-induced host genes was confirmed by RT-qPCR as described in the online supplemental methods.
Statistics
All graphs were prepared and statistical analyses were performed using the GraphPad Prism software (V.8). All data represent means±SEM and key data are representative for 2–5 experiments with similar results. Survival between groups was compared using Kaplan-Meier curves and the statistical log-rank test (Mantel-Cox). For RT-qPCR analysis, samples were excluded when RNA concentration and purity were too low. When comparing S4 RT-qPCR data between two groups, average log10 values were compared using a two-tailed unpaired t test. For comparing more groups versus PBS treatment, average log10 values were compared using an ordinary one-way analysis of variance (ANOVA) including Dunnett’s post hoc test. For flow cytometry data, tumor samples were excluded when evidence for draining lymph node contamination was present. The means of flow cytometric data of two experimental groups were compared using two-tailed unpaired t tests. For comparing multiple groups versus PBS treatment or negative control, a one-way ANOVA including Dunnett’s post hoc test was performed. For comparing multiple groups with each other, a one-way ANOVA including Tukey’s post hoc test was used. The association between two ranked variables was done by Spearman rank correlation. Significance levels are labeled with asterisks, with *p<0.05, **p<0.01, ***p<0.001 and ****p<0.0001. Non-significant differences are indicated by ns.
Results
Reovirus efficiently replicates but does not affect tumor growth in the KPC3 pancreatic cancer model
Human pancreatic tumors are often not susceptible to immunotherapeutic strategies, including checkpoint inhibition.28 29 The murine pancreatic cancer model KPC3 is an early derivate from the genetic pancreatic ductal adenocarcinoma (PDAC) KPC mouse model, which recapitulates many of the histopathological and immunological key features observed in human PDAC,30 including acinar tubular structures, a dense desmoplastic stroma and absence of CD3+ T cells (online supplemental figure S1A,B). We previously demonstrated that outgrowth of KPC3 tumors with heterologous expression of the Trp1 gene (KPC3.TRP1) could significantly be delayed by early CD3xTRP1 bsAb therapy.25 However, CD3xTRP1 bsAb treatment failed to exhibit any effect on larger KPC3.TRP1 tumors (online supplemental figure S1C,D), although tumor cells were efficiently killed in vitro in an antigen-dependent fashion (online supplemental figure S1E). We hypothesized that the low T-cell density observed in established KPC3 tumors represents a major barrier to the efficacy of CD3-bsAb therapy and therefore explored the use of oncolytic reovirus to overcome this barrier.
Supplemental material
We first tested the ability of reovirus to infect and replicate in KPC3 cells in vitro and observed a high number of genomic viral copies (figure 1A) and reoviral protein sigma 3+ cells (figure 1B) after infection with very low multiplicities of infection (MOIs). Total viral copy numbers and viral load per cell increased with higher MOIs, and additionally, reovirus demonstrated a dose-dependent oncolytic activity in vitro (figure 1C). Oncolytic activity appeared moderate as half of the cell culture was killed after 2 days, whereas all cells contained high levels of replicating virus. As expected, reovirus did not replicate after UV inactivation in KPC3 cell cultures (figure 1A).23 To test the replication capacity of reovirus in vivo, KPC3 tumor-bearing mice were intratumorally injected on 3 consecutive days with either 107 or 108 pfu/mouse starting at day 13 when the tumors were established (figure 1D). Both viral doses resulted in high levels of genomic reovirus copies after 3 days, indicating efficient replication in vivo (figure 1E). Hotspots of viral replication were seen in tumor tissue slides stained for sigma 3, suggesting that viral replication is not evenly distributed in the tumor (figure 1F). Despite this very efficient replication, reovirus administration failed to make a large impact on tumor growth (figure 1G). Since optimal replication was observed with 107 pfu/mouse, we selected this dose for further experiments.
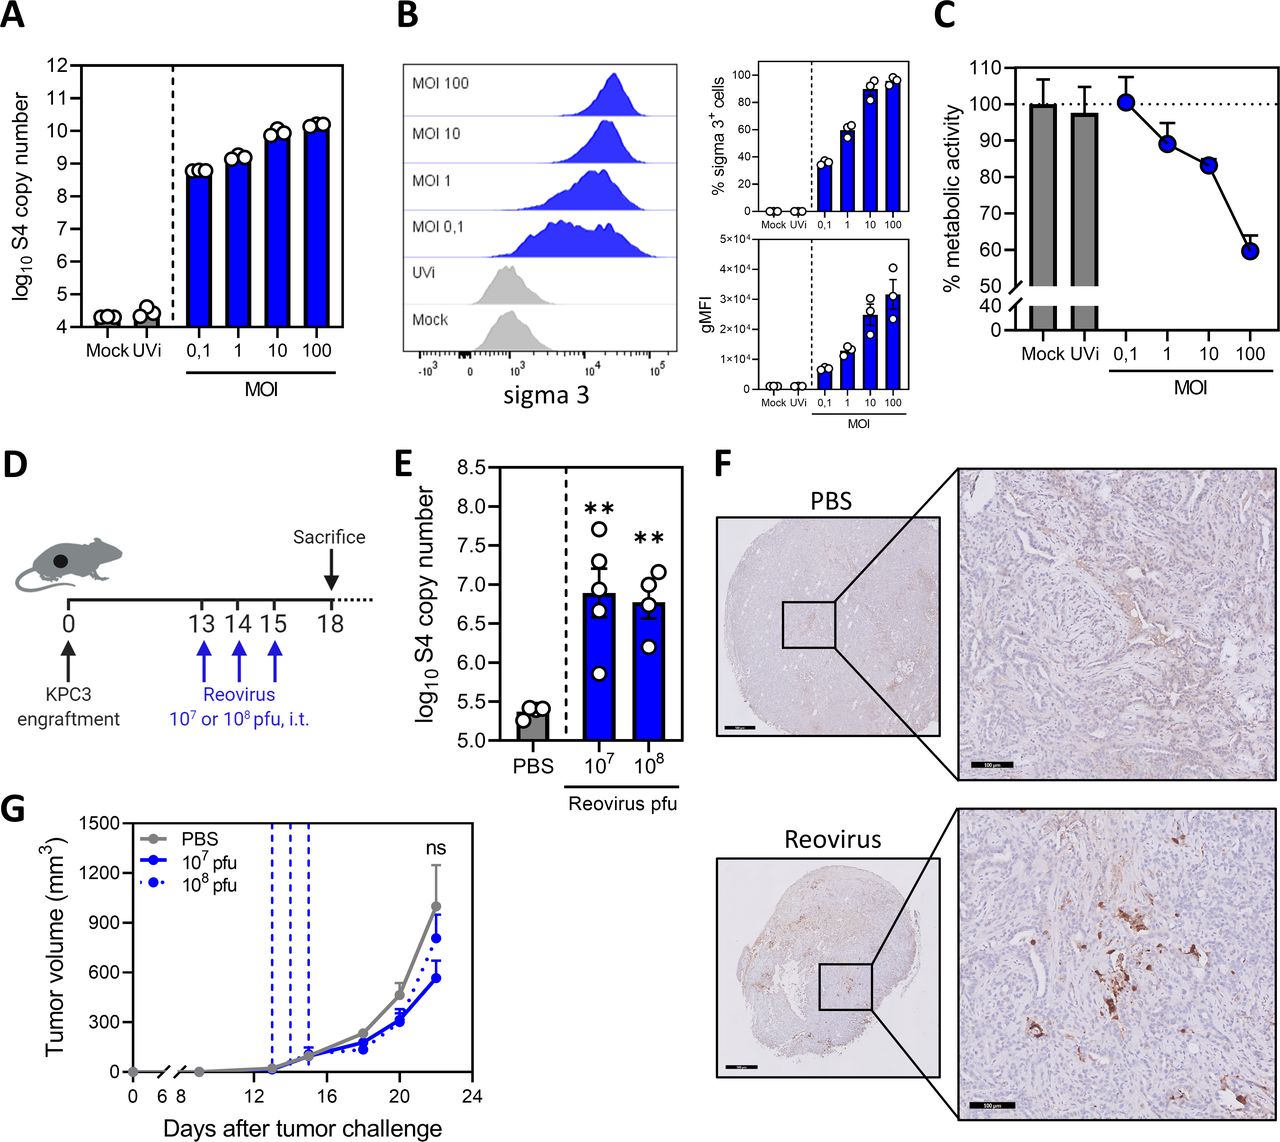
Reovirus efficiently replicates but does not affect tumor growth in the KPC3 pancreatic cancer model. (A) Numbers of reovirus genomic segment 4 (S4) copies in KPC3 cells after reovirus infection. KPC3 cells (125,000/well) were infected with increasing multiplicities of infection (MOIs) of reovirus, or phosphate-buffered saline (PBS) (Mock) or UV-inactivated reovirus (UVi) (equal number of viral particles as MOI 100) as controls. Samples (n=3) were harvested 24 hours after infection and reovirus S4 copy numbers were determined by quantitative reverse transcription PCR (RT-qPCR). (B) Frequency of sigma 3-positive KPC3 cells and geometric mean fluorescence intensity (gMFI) of sigma 3 expression 48 hours after infection with increasing MOIs of reovirus, or PBS (Mock) or UVi as controls, analyzed by flow cytometry. Bar graphs represent mean±SEM of triplicates. (C) Analysis of oncolytic activity of reovirus. KPC3 cells (5000/well) were plated and infected with reovirus or controls. Metabolic activity was determined 48 hours after infection. Data represent mean±SEM of triplicates. (D) Design of experiment described in (E–G). Mice (n=4–6/group) with established KPC3 tumors were treated with intratumoral (i.t.) injections of 107 or 108 plaque-forming units (pfu) of reovirus on 3 consecutive days. PBS was used as control. (E) Three days after the last reovirus injection, tumors were harvested and reovirus S4 copy numbers were determined in tumor lysates by RT-qPCR. (F) Representative images obtained from immunohistochemical staining of tumors for sigma 3. Shown are tumors treated with PBS or reovirus 107 pfu. Scale bars equal 500 µm and 100 µm for overview and magnification, respectively. (G) Mean tumor volumes after treatment with PBS or reovirus 107 or 108 pfu. Dashed vertical lines indicate days of injections. Data are presented as mean±SEM (n=4–6/group). Significance versus PBS treatment in (E) and (G) is determined using an ordinary one-way analysis of variance (ANOVA) with Dunnett’s post hoc test. Significance levels: ns (not significant) and **p<0.01.
Replication-competent reovirus induces a potent IFN response in the tumor
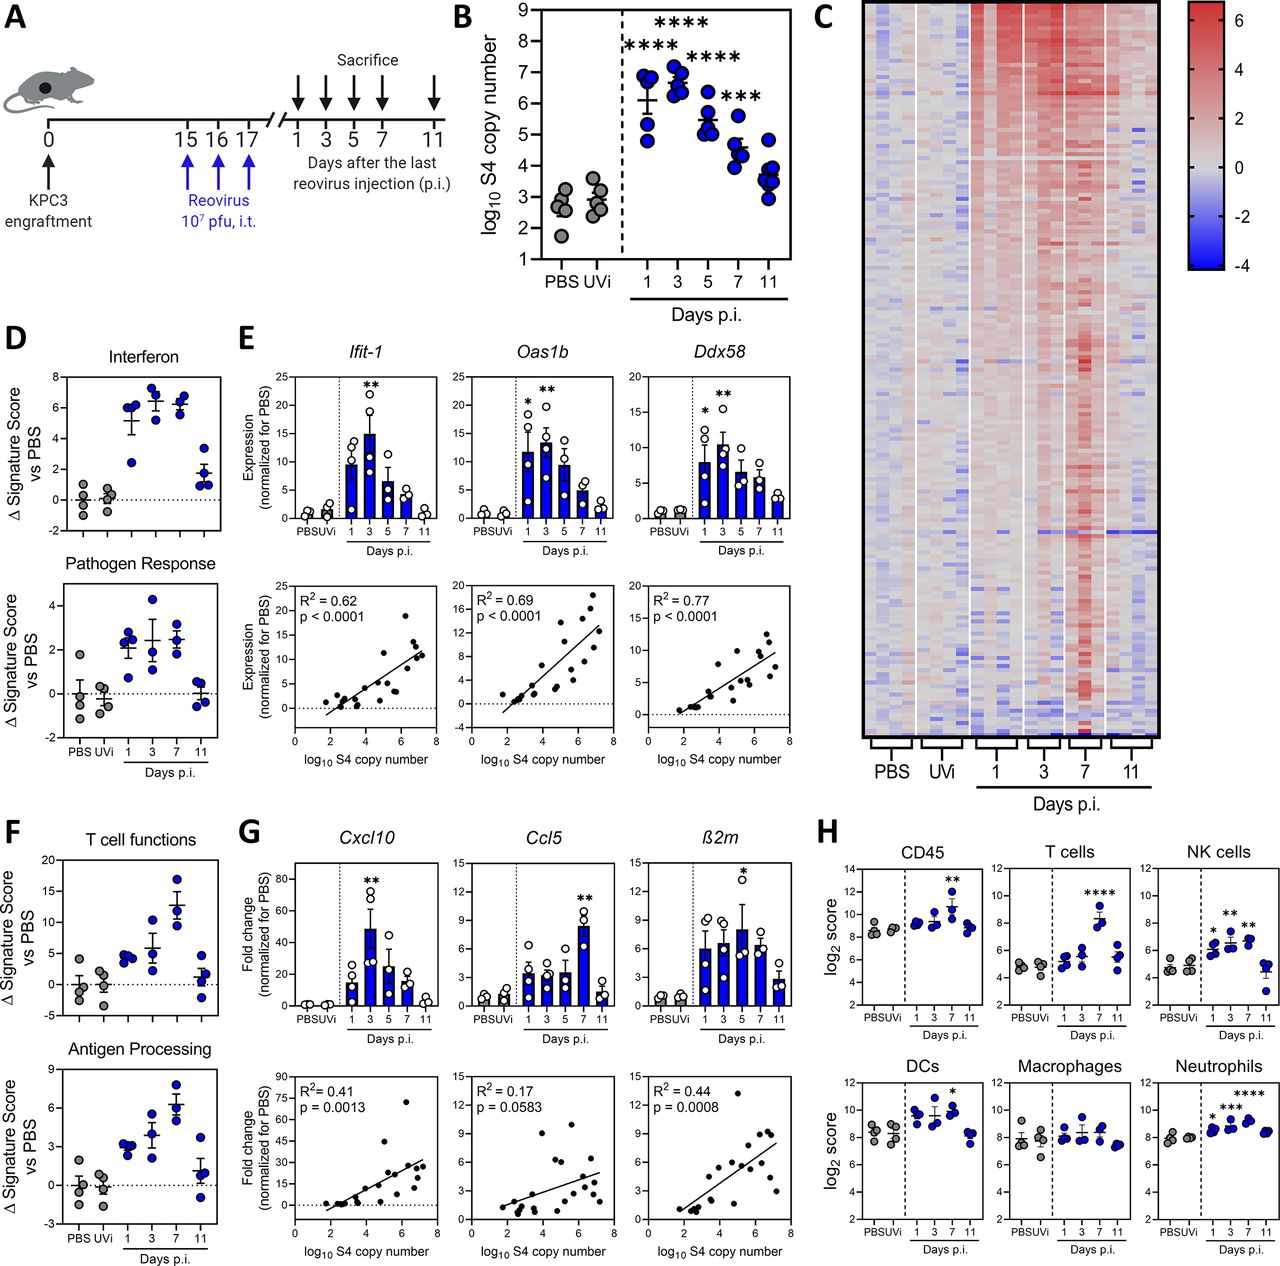
Next, we studied the kinetics of reovirus replication in KPC3 tumor-bearing mice (figure 2A). Intratumoral administration of reovirus yielded high viral copy numbers that peaked around 1 to 3 days post injections (p.i.) and gradually decreased back to baseline levels around day 11 p.i. (figure 2B). UV-inactivated reovirus (UVi) did not show any amplification. Thus, reovirus has a limited time window of replication in the TME which lasted up to 10 days, suggesting that replication is restricted by antiviral immunity of the host. Transcriptome analysis of whole KPC3 tumors using NanoString technology was performed to investigate the antiviral immune response (figure 2C and online supplemental figure S2A). A heatmap of all genes, differentially expressed on at least one of the time points, revealed that the number of upregulated genes peaked 7 days after reovirus administration (figure 2C). More than 100 immune-related genes were upregulated (False Discovery Rate p<0.1 and fold change >2 compared with PBS) and this number severely declined after 11 days, in parallel with viral replication (figure 2C and online supplemental figure S2A). Although UVi might still have the capacity to engage pattern recognition receptors (PRRs), as was previously demonstrated,31 this inactivated reovirus did not induce upregulation of immune genes (figure 2C and online supplemental figure S2A). This suggested that the ability to replicate was essential for the immunostimulatory effects of reovirus in the TME.
Supplemental material

Replication-competent reovirus induces a potent interferon response in the tumor. (A) Design of experiment described in figures (B–H). Mice (n=5/group) with established KPC3 tumors were intratumorally (i.t.) injected with 107 plaque-forming units (pfu) of reovirus on 3 consecutive days. Phosphate-buffered saline (PBS) or UV-inactivated reovirus (UVi) were used as controls and were harvested 3 days post injections (p.i.). (B) Tumors were harvested at designated days p.i., and reovirus genomic segment 4 (S4) copy numbers were determined in tumor lysates by quantitative reverse transcription PCR (RT-qPCR). (C) Heatmap of all genes that were differentially expressed in the tumor (n=3–4/group) on any day after reovirus treatment (False Discovery Rate p<0.1 and fold change >2 compared with PBS), as analyzed by NanoString. (D) Changes in signature scores on indicated days after reovirus treatment. All scores are normalized for average score of PBS. (E) Relative expression of interferon response genes (upper panel) as determined by RT-qPCR, and the correlation between expression and reovirus S4 copy numbers (lower panel). (F) Changes in signature scores on indicated days after reovirus treatment. All scores are normalized for average score of PBS. (G) Relative expression of genes involved in T-cell attraction and antigen processing (upper panel) as determined by RT-qPCR, and the correlation between expression and reovirus S4 copy numbers (lower panel). (H) Kinetics of specific cell type scores after reovirus treatment. All data are presented as mean±SEM. Significance versus PBS treatment is determined using an ordinary one-way analysis of variance (ANOVA) with Dunnett’s post hoc test. Correlation is determined using Pearson’s correlation tests. Significance levels: *p<0.05, **p<0.01, ***p<0.001 and ****p<0.0001. DCs, dendritic cells; NK, natural killer.
Analyses of gene expression signatures roughly revealed two patterns: an early expressed profile, including pathways such as “interferon” and “pathogen response,” peaking at day 1 to 5 and a late expressed profile, with pathways such as “T-cell functions” and “antigen processing,” which peaked at day 7 (figure 2D–G and online supplemental figure S2B). Expression of early IFN response genes was validated for some prime examples such as Ifit-1, Oas1b and Ddx58 using RT-qPCR (figure 2E). These antiviral genes were strongly upregulated after treatment with replication-competent reovirus, but not UVi, and expression levels correlated strongly (R2 >0.6) and significantly (p<0.0001) with the number of viral copy numbers in the tumor (figure 2E). We also validated the expression of some genes involved in the late pathways (figure 2F), such as T-cell-attracting chemokines Cxcl10, Ccl5 and MHC class I component β2m, and observed increased expression levels after reovirus, but not UVi treatment (figure 2G). The expression levels of these genes also significantly correlated with the number of viral copies present in the tumor, although to a lesser extent (R2<0.5) than the early induced genes. Lastly, we analyzed the kinetics of NanoString-defined cell type scores in our dataset (figure 2H). A marginal increase in CD45 score was observed on day 7, and when lineage-specific scores were examined, the score for T cells (identified by expression of Cd3g, Cd3e, Cd3d and Sh2d1a) was most significantly upregulated at day 7 after reovirus treatment. Interestingly, natural killer (NK) cells, dendritic cells (DCs) and neutrophil scores were also enhanced on day 7. Macrophage score remained largely unaffected by reovirus treatment. Overall, we observed that reovirus replication induced a potent IFN response, including highly increased expression of inflammatory genes and T-cell-attracting chemokines.
Replication-competent reovirus recruits virus-specific T cells to the tumor
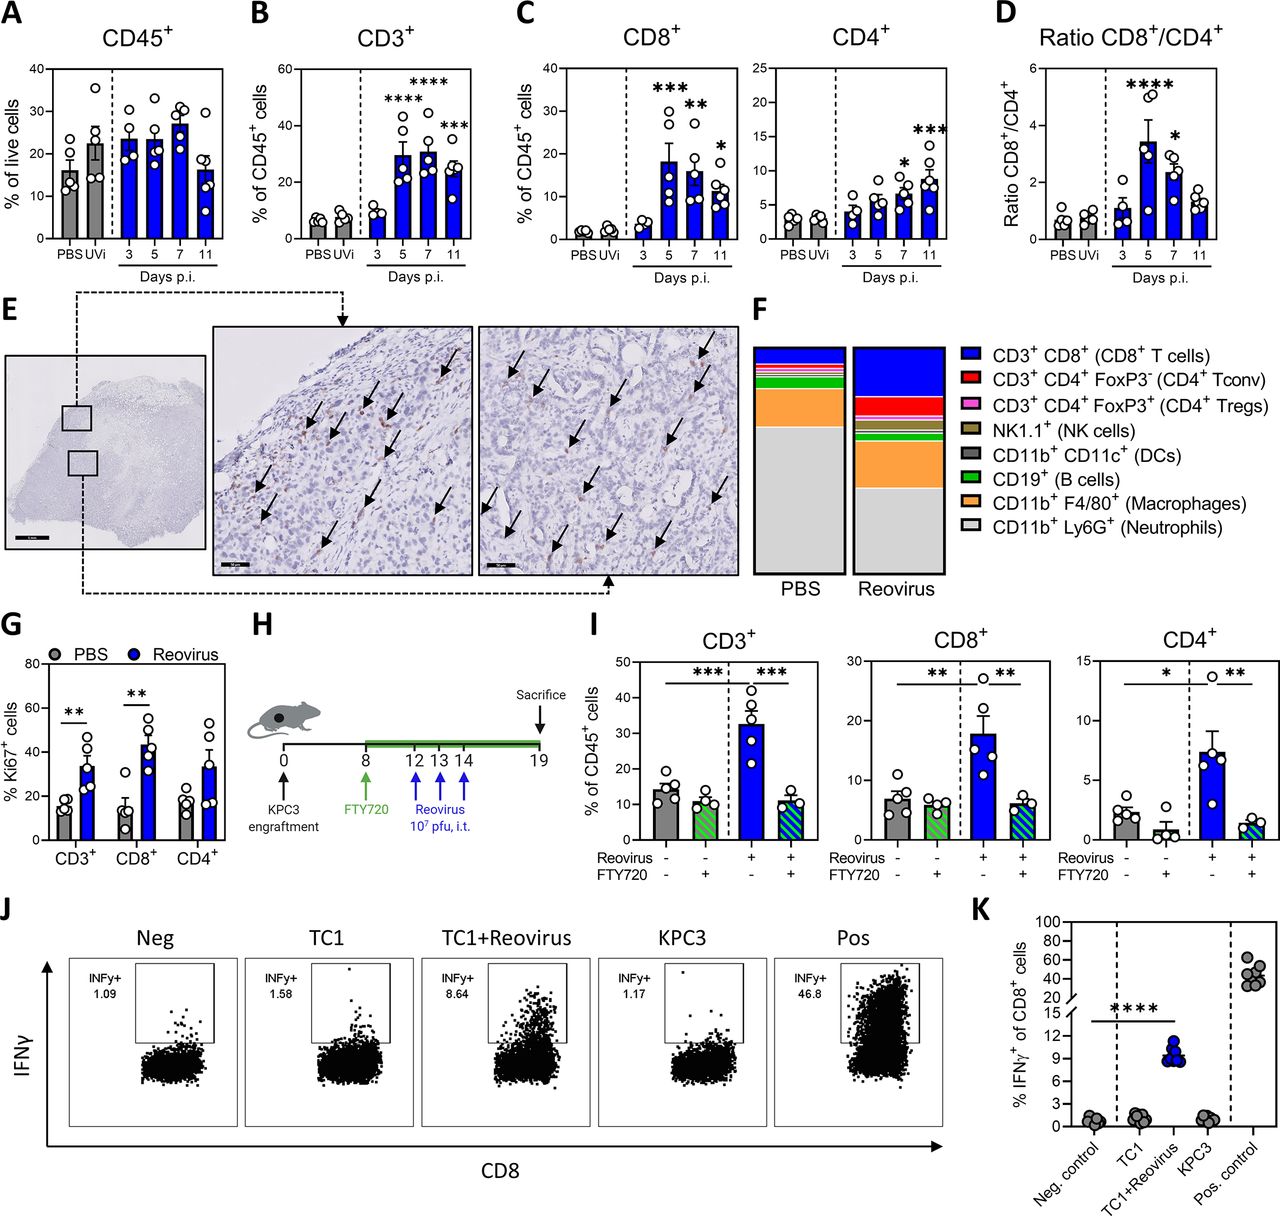
To validate that the reovirus-induced inflammatory response increased tumor infiltration by immune cells, we analyzed the cellular composition of the TME by flow cytometry and IHC (figure 3 and online supplemental figure S3). Interestingly, the total number of CD45+ immune cells in the reovirus-treated tumors was hardly altered (figure 3A). However, the percentage of CD3+ T cells within the CD45+ population was significantly increased after reovirus administration, starting 5 days after the last reovirus injection (figure 3B). This effect was replication-dependent since UVi treatment failed to increase the intratumoral T-cell density (figure 3B and online supplemental figure S4A). Within the CD3+ T-cell population, the CD8+ T cells were significantly more enriched compared with the CD4+ T cells, as seen by a significantly increased CD8+/CD4+ ratio (figure 3C,D). In the tumors of reovirus-injected mice, the presence of CD8+ T cells could be observed in both the border and the interior of tumors (figure 3E).
Supplemental material
Supplemental material

Replication-competent reovirus recruits virus-specific T cells to the tumor. (A) Frequency of CD45+ immune cells in the tumor on indicated days post injections (p.i.) of reovirus or UV-inactivated reovirus (UVi) (n=5/group). (B) Frequency of CD3+ T cells within CD45+ immune cells in the tumor. (C) Frequency of CD8+ and CD4+ T cells within CD45+ immune cells in tumors after reovirus treatment. (D) Ratio between intratumoral CD8+ and CD4+ T cells. (E) Representative images obtained from immunohistochemical staining of tumors for CD8 (light brown). Arrows indicate CD8+ cells. Scale bars equal 1 mm and 50 µm for overview and magnification, respectively. (F) Composition of CD45+ immune infiltrate in the tumor, 5 days after reovirus treatment. (G) Frequency of Ki67+ cells within CD3+, CD8+ and CD4+ T-cell populations in the tumor. (H) Design of experiment described in (I). Mice (n=3–5/group) with established KPC3 tumors were intratumorally injected with reovirus (107 plaque-forming units (pfu)) on 3 consecutive days and were treated with FTY720 (2.5 µg/mL FTY720 in drinking water and daily oral administration of 2 µg/g body weight). (I) Frequency of CD3+, CD8+ and CD4+ T-cell populations in the tumor. (J) Representative flow cytometry plots for the frequency of interferon gamma (IFNγ)+ cells within the intratumoral CD8+ T-cell population 7 days after reovirus treatment. Single-cell suspensions from tumor samples (n=8/group) were cocultured with indicated targets for 6 hours. Medium was used as negative (Neg.) and phorbol 12-myristate 13-acetate (PMA)/ionomycin was used as positive (Pos.) control, respectively. (K) Quantification of IFNγ+ cells within CD8+ T-cell population. All data are presented as mean±SEM. Statistical tests used: (A–D): ordinary one-way analysis of variance (ANOVA) with Dunnett’s post hoc test. (G): Multiple unpaired t-tests. (I): ordinary one-way ANOVA with Tukey’s post hoc test. (K): unpaired t-test between Neg. control and TC1+reovirus. Significance levels: *p<0.05, **p<0.01, ***p<0.001 and ****p<0.0001.
To gain a broader view on the TME, we performed a high-dimensional flow cytometric analysis of the lymphoid and myeloid cell compartments in the tumors at 5 days after reovirus administration (figure 3F and online supplemental figure S4B–G). This analysis confirmed the increased contribution of CD8+ T cells (a 2.6-fold increase compared with PBS), as the total CD45+ immune infiltrate increased only 1.4-fold (online supplemental figure S4B). The frequency of NK cells and CD4 cells also significantly increased, and within the CD4+ T-cell population, the frequency of FoxP3+ CD4+ regulatory T cells dramatically dropped from 40% to 10% (online supplemental figure S4C,D). This resulted in an enhanced ratio of CD8+ cytotoxic T cells to FoxP3+ regulatory T cells in the TME (online supplemental figure S4E). Additionally, reovirus induced activation of T cells, as indicated by increased expression of activation marker CD44 and loss of adhesion marker CD62L (online supplemental figure S4F). Interestingly, we observed a large population of neutrophils (CD11b+Ly6G+) in untreated KPC3 tumors, the frequency of which dramatically decreased after reovirus administration (online supplemental figure S4G). Other myeloid cell lineages, such as macrophages (CD11b+F4/80+) and CD11c+ macrophages (CD11b+ CD11c+) remained unaffected (online supplemental figure S4G). Overall, these analyses revealed that replication-competent reovirus converts an immunologically cold TME with low T-cell infiltration into a site with a strongly enhanced abundance of activated effector T cells and NK cells and reduced frequency of neutrophils and immunosuppressive regulatory T cells.
Next, we investigated the mechanism underlying the increased T-cell density in the tumor after reovirus administration. First, we assessed the proliferation of T cells by measuring the frequency of intratumoral Ki67+ T cells (figure 3G). The fraction of Ki67+ T cells was significantly increased after reovirus treatment, especially in CD8+ T cells. We subsequently examined if the increased T-cell frequencies were solely the result of local proliferation in the tumor or were the result of increased attraction to the tumor. To this end, T-cell egress from lymph nodes was blocked with FTY720 during this experiment (figure 3H,I and online supplemental figure S4H,I).32 Interestingly, the reovirus-induced increase in intratumoral CD3+ T cells, both CD4+ and CD8+ subsets, was completely abrogated under FTY720 conditions, whereas the abundance of total CD45+ immune cell infiltrate into the tumor was not affected.
Finally, we examined the specificity of the tumor-infiltrating CD8+ T cells. Tumor-infiltrating lymphocytes were cocultured for 6 hours with KPC3 tumor cells, MHC class I-matched control TC1 tumor cells or TC1 cells infected with reovirus (figure 3J,K). No tumor-specific response to KPC3 could be detected, but 10% of the CD8+ T cells responded to reovirus-infected TC1 cells by producing interferon gamma (IFNγ). This population of reovirus-specific T cells was specifically enriched at the site of the tumor since their frequencies were around 1% in the spleen (online supplemental figure S4J). We concluded that reovirus replication in the tumor leads to strong recruitment of proliferating and activated type 1 T cells, which are reovirus-specific.
Combination treatment of reovirus and CD3-bsAbs induces strong tumor regression of established TRP1-expressing tumors
The observation that reovirus replication ignites a strong influx of T cells in the otherwise immunologically cold KPC3 tumors provided a strong rationale to evaluate the combination of reovirus with CD3-bsAb therapy. C57BL6/J mice with palpable TRP1-expressing KPC3 tumors were treated intratumorally with reovirus and 4 days later, when the inflammatory response had reached its full potential, CD3xTRP1 bsAbs were systemically administered (figure 4A). This combination resulted in striking tumor regressions that started directly after the first bsAb injection, whereas bsAbs or reovirus monotherapy hardly showed any tumor growth delay (figure 4B and online supplemental figure S5A). Visualizing the relative change in tumor size after start of bsAb injection indicated that combination therapy induced tumor regressions in all treated mice, whereas tumors treated with CD3xTRP1 bsAb monotherapy all increased in size (figure 4C). Mice receiving the combination treatment had significantly lower tumor volumes on day 21 (figure 4B) and survived significantly longer (figure 4D) compared with PBS or both monotherapies.
Supplemental material

Combination treatment of reovirus and CD3xTRP1 bispecific antibodies (bsAbs) induces regression of established TRP1-expressing tumors. (A) Design of experiment described in (B–F). Mice (n=8–10/group) with established KPC3.TRP1 tumors were intratumorally (i.t.) injected with reovirus (107 plaque-forming units (pfu)) on 3 consecutive days. After 4 days, mice received intraperitoneal (i.p.) injections of 12.5 µg CD3xTRP1 bsAbs (CD3xTRP1) or phosphate-buffered saline (PBS) as control. (B) Average tumor growth curves±SEM. Dashed lines indicate timing of injection with reovirus (blue) or CD3xTRP1 (red). Differences in mean tumor volumes versus reovirus+CD3xTPR1 treatment on day 21 are determined by one-way analysis of variance (ANOVA) with Dunnett’s post hoc test. (C) Relative changes in tumor volume of individual mice from the start of CD3xTRP1 bsAb treatment. Indicated is the number of mice with tumor regressions. (D) Kaplan-Meier survival graphs of mice in indicated treatment groups. (E) Overlayed dot plots indicating percentage of TRP1+ cells on representative tumors of each group. Black dots show background staining of secondary antibody. Red dots show staining using primary αTRP1 antibody followed by the secondary antibody. (F) Quantification of TRP1 expression. Dashed line indicates mean background staining of secondary antibody. Data represent mean±SEM. (G) Design of experiment described in (H–J). Mice (n=8–10/group) with established B16.F10 tumors were i.t. injected with reovirus (107 pfu) on 3 consecutive days. After 4 days, mice received i.p. injections of 12.5 µg CD3xTRP1 bsAbs or PBS as control. (H) Individual growth curves of B16.F10-bearing mice receiving indicated treatments. (I) Relative changes in tumor volume from start of CD3xTRP1 bsAb treatment. Indicated is the number of mice with tumor regressions. (J) Kaplan-Meier survival graphs of mice in indicated treatment groups. Log-rank test was used to compare differences in survival. Significance levels: *p<0.05, **p<0.01, ***p<0.001 and ****p<0.0001.
Despite the striking regressions induced by the combination therapy, durable responses were not observed, and all tumors eventually escaped immune control (figure 4B–D and online supplemental figure S5A). This escape could not be prevented by an additional treatment round of reovirus and CD3xTRP1 bsAbs (online supplemental figure S5B,C) or by the addition of checkpoint blockade using αPD-L1 (online supplemental figure S5D–F). We aimed to explain the escape mechanism and first assessed T-cell presence in end-stage tumors. Immunohistochemical analysis of these samples indicated that CD3+ T cells were still abundantly present in tumors from combination-treated animals (online supplemental figure S6A). Flow cytometry analysis confirmed the increased presence of mainly CD8+ T cells in the tumors that were treated with reovirus and CD3xTRP1 (online supplemental figure S6B) and additionally revealed that most of these T cells still displayed an activated phenotype with high expression of CD44 and absence of CD62L (online supplemental figure S6C). Furthermore, no striking differences in the expression of checkpoint molecules programmed cell death protein-1 (PD1), T-cell immunoglobulin and mucin-domain containing-3 (TIM-3) and NKG2A were observed between T cells from the combination group and T cells from the CD3xTRP1 group (online supplemental figure S6C). These data indicated that the observed tumor escape could not be explained by the absence or exhaustion of intratumoral T cells.
Supplemental material
We then looked at tumor-intrinsic factors and analyzed the presence of surface TRP1+ cells within the CD45- tumor cell population (figure 4E,F and online supplemental figure S6D). Importantly, we found that TRP1 expression was lost in nearly all tumor cells after combination treatment, versus 40% in tumors treated with CD3xTRP1 alone and <20% of cells in the other groups (figure 4E,F). These data imply that the robust immune pressure of combination treatment initially resulted in striking tumor regressions, but also promoted the selective expansion of TRP1-negative tumor cell clones that are insensitive for CD3xTRP1 bsAb targeting. The TRP1 protein was selected as a model antigen in this study; however, it is not an essential molecule for cell growth or survival and could therefore be lost without consequences for tumor growth. We concluded that this combination therapy led to complete eradication of TRP1-expressing tumor cells, concomitantly leading to escape of tumor variants that lost the targeted antigen.
To demonstrate the efficacy of this combination treatment in another immunologically cold tumor model, we employed the murine melanoma model B16.F10,33 which spontaneously expresses the melanocyte-lineage antigen TRP1. Although all B16.F10 cells expressed TRP1 on their cell surface, the level of expression in B16.F10 was a magnitude lower compared with KPC.TRP1 (online supplemental figure S7A). In vitro, reovirus was able to efficiently replicate in B16.F10 cells; however, the number of viral copy numbers and the frequency of sigma 3+ cells was lower compared with KPC3 (online supplemental figure S7B,C). Interestingly, despite viral replication in B16.F10 cells, oncolysis hardly occurred, even at an MOI of 100 (online supplemental figure S7D). In vivo, reovirus was able to efficiently replicate (online supplemental figure S7E) and to increase the T-cell density in established subcutaneous B16.F10 tumors after intratumoral injection (online supplemental figure S7F). Earlier, we reported that CD3xTRP1 significantly delayed tumor growth in B16.F10 tumors, when given early after tumor challenge.25 Similar to the KPC3.TRP1 model, the combination regimen of reovirus and CD3xTRP1 was required to induce tumor regressions in established B16.F10 tumors (figure 4G,H). Whereas CD3xTRP1 monotherapy delayed tumor growth in some animals (figure 4H), therapy-mediated tumor regressions were exclusively found in 7 out of 10 animals of the combination group (figure 4I). The combination treatment also significantly prolonged survival (figure 4J).
Supplemental material
Combination of reovirus and CD3-bsAbs is effective in a human, orthotopic HER2+ breast cancer model
Additionally, we aimed to investigate the efficacy of the combination of reovirus and CD3-bsAbs in a more clinically relevant setting. We employed the HER2 positive breast cancer model BT474,34 as a close-to-patient model to test CD3xHER2 bsAb therapy. BT474 cells express high levels of HER2 and were susceptible to reovirus replication (figure 5A,B). BT474 tumors were engrafted orthotopically in the fourth mammary fat pad of NSG mice, and human PBMCs were intravenously administered as source of effector cells before reovirus and bsAb administration (figure 5C). In contrast to our experiments in immunocompetent mice, reovirus alone already showed some efficacy by impairing tumor growth (figure 5D). Whereas CD3xHER2 monotherapy had no therapeutic efficacy in comparison to the PBS-treated group, the combination of reovirus with CD3xHER2 bsAbs induced strong tumor regressions in all animals (figure 5D) and a significant average tumor shrinkage calculated from the moment of PBMC injection (figure 5E). Collectively, these results show that the efficacy of bsAb therapy in immunologically cold, solid tumors such as KPC3, B16.F10 and BT474 can be greatly enhanced by a prior sensitization with reovirus.
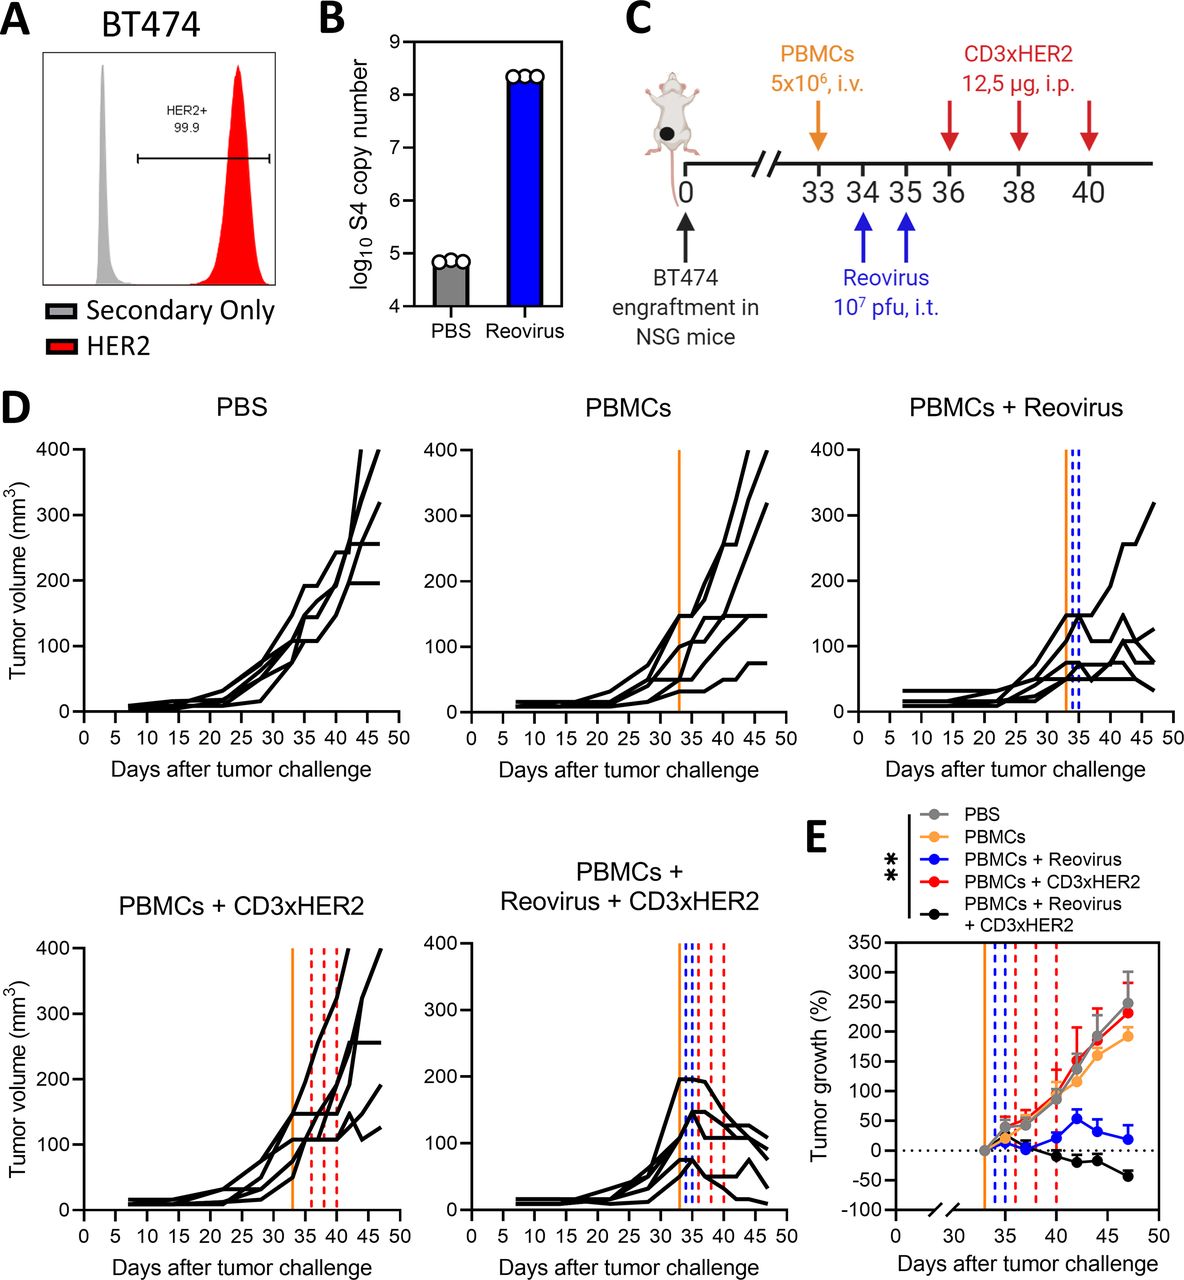
Combination of reovirus and CD3-bispecific antibodies (bsAbs) is effective in a human, orthotopic human epidermal growth factor receptor (HER2)+ breast cancer model. (A) HER2 expression percentages on BT474 cells, as analyzed by flow cytometry using a two-step protocol. (B) Number of reovirus genomic segment 4 (S4) copies in BT474 cells after reovirus infection. BT474 cells (200,000/well) were infected with reovirus multiplicities of infection (MOI) 10 or phosphate-buffered saline (PBS) (Mock) as a control. Samples (n=3) were harvested 24 hours after infection and the number of viral S4 copies was determined by quantitative reverse transcription PCR. (C) Design of experiment described in (D and E). Mice (n=6/group) with established BT474 tumors were intravenously (i.v.) injected with 5×10⁶ human PBMCs, and thereafter intratumorally (i.t.) injected with reovirus (107 plaque-forming units (pfu)) on 2 consecutive days. After 4 days, mice received intraperitoneal (i.p.) injections of 12.5 µg CD3xHER2 bsAbs (CD3xHER2) or PBS as control. (D) Individual growth curves of BT474-bearing mice receiving indicated treatments. Lines indicate timing of injection with PBMCs (orange), reovirus (blue) or CD3xHER2 (red). (E) Average relative changes (±SEM) in tumor volume from start of CD3xHER2 bsAb treatment. Significance versus PBS on day 42 was calculated using one-way analysis of variance with Dunnett’s post hoc test. Significance level: **p<0.01.
Treatment sequence is important for the synergistic effect of the reovirus and CD3-bsAb combination therapy
Here, we used two separate treatment modalities applied sequentially, but alternatively genes coding for T-cell-engaging antibodies can also be introduced into OVs as transgenes.35 For this reason, we investigated whether timing was important for the observed synergistic effect and if comparable tumor regressions could also be observed if reovirus and CD3xTRP1 bsAbs were administered simultaneously or in reversed order (figure 6). Interestingly, steady tumor growth without any regressions was observed when we switched the sequence of treatment arms and first administered bsAbs (figure 6A,D). Simultaneous administration of CD3-bsAbs at the day of reovirus injection did induce regressions in tumor volume, but tumors started to regrow fast (figure 6B,D). Our previous regimen of reovirus before bsAbs led to significantly smaller tumor volumes on day 23 after tumor challenge, indicating more durable and deeper regressions compared with the other regimens (figure 6C,D). Importantly, simultaneous treatment with reovirus and bsAbs did induce small regressions, but these occurred when tumor volumes were still relatively low at the start of CD3-bsAb treatment (figure 6E). In contrast, pretreatment with reovirus caused tumors to undergo steeper regressions, even though the tumor volume was significantly higher at the start of CD3-bsAb treatment. All combination treatment regimens significantly improved survival in comparison to the untreated group, but the exploitation of reovirus as a preconditioning regimen performed significantly better compared with both other schedules (figure 6F). In conclusion, these data highlight the importance of sensitization of tumors with reovirus preceding CD3-bsAb treatment to optimally harness the full potential of this combination.
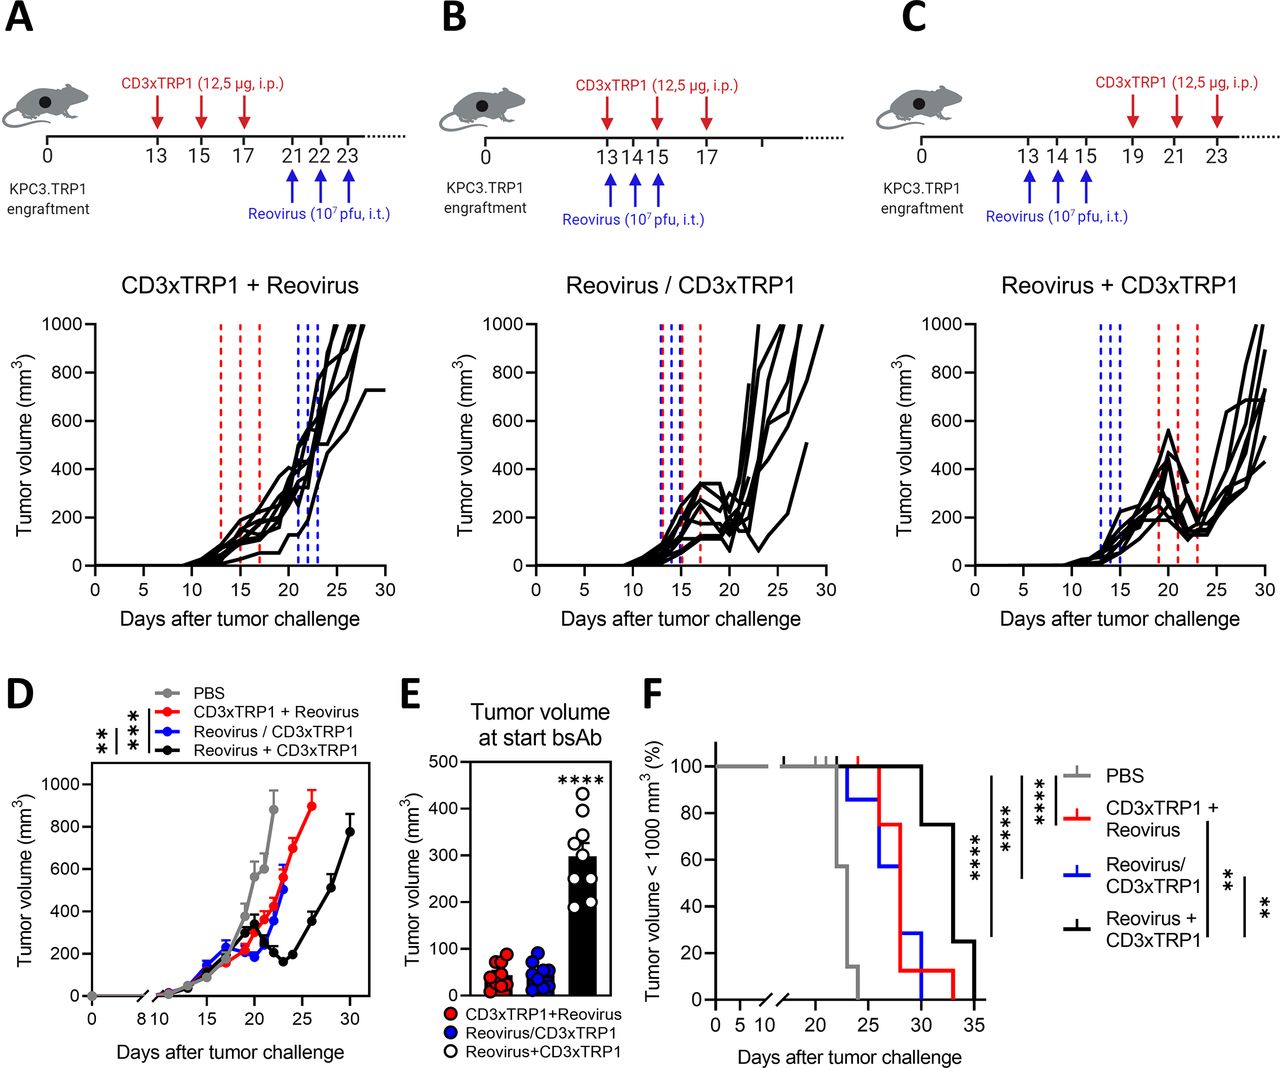
Treatment sequence is important for the synergistic effect of the reovirus and CD3-bispecific antibody (bsAb) combination therapy. Treatment schedule and individual tumor growth curves of mice (n=8–10/group) that received intraperitoneal injections (i.p.) (12.5 µg/mouse) of CD3xTRP1 bsAbs before (A), simultaneously with (B) or after (C) intratumoral (i.t.) reovirus injections (107 plaque-forming units (pfu)/mouse). Dashed vertical lines indicate timing of injection with reovirus (blue) or CD3xTRP1 (red). (D) Average tumor growth curves±SEM of experimental groups shown in (A–C) compared with PBS treatment. Significance versus reovirus+CD3xTPR1 treatment on day 23 is determined by comparing tumor volumes using a one-way analysis of variance (ANOVA) with Dunnett’s post hoc test. (E) Mean±SEM tumor volume at the start of CD3xTRP1 bsAb treatment for treatment schedules CD3xTRP1+reovirus (day 13), reovirus/CD3xTRP1 (day 13) and reovirus+CD3xTRP1 (day 19). Ordinary one-way ANOVA with Tukey’s post hoc test was used to compare means. (F) Kaplan-Meier survival curves of mice in different treatment schedules. Log-rank test was used to compare differences in survival. Significance levels: **p<0.01, ***p<0.001 and ****p<0.0001.
Intratumorally injected reovirus sensitizes local and distant cold tumors for subsequent treatment with CD3xTRP1 therapy
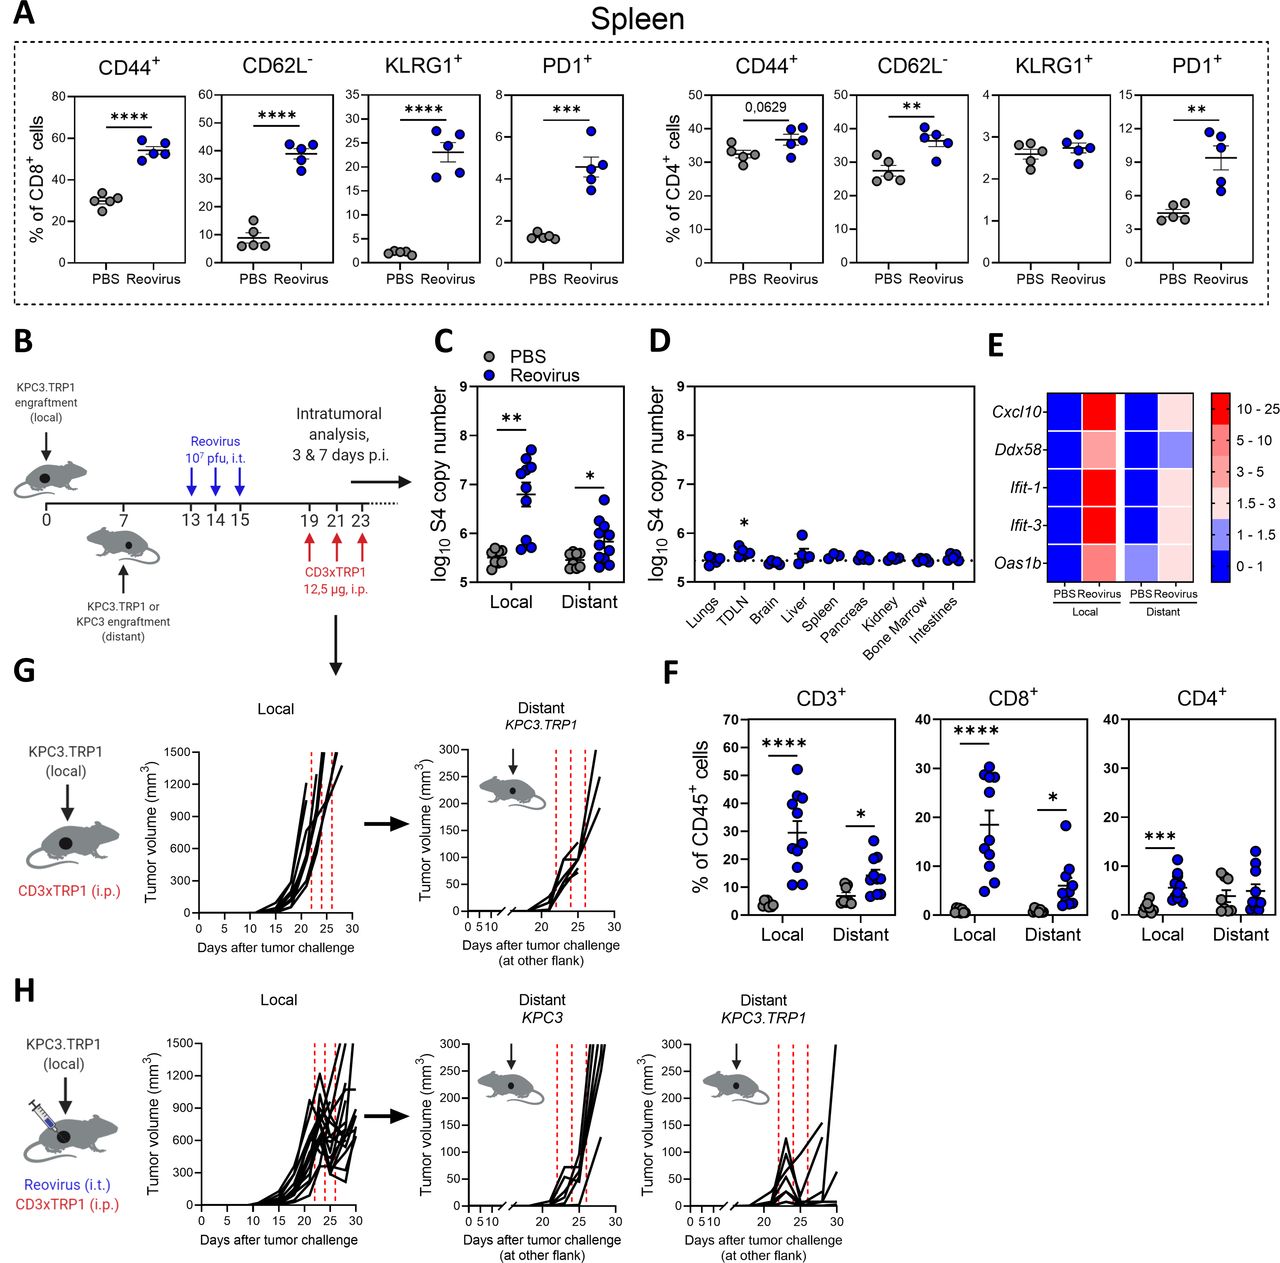
In previous experiments, we observed that intratumoral delivery of reovirus also induced systemic activation of both CD8+ and CD4+ T cells in the spleen, reflected by increased expression of CD44, KLRG1 and PD1, and absence of adhesion molecule CD62L (figure 7A). To evaluate the possible systemic effects of local reovirus administration, a bilateral tumor model was used. Mice were engrafted with a subcutaneous KPC3 tumor on the right flank and 1 week later received another tumor on the left flank (figure 7B). After reovirus treatment, we assessed the presence of reovirus copy numbers in both the injected (local) and the non-injected (distant) tumor. To our surprise, we detected a significantly increased number of viral genomic copies in the distant tumor after reovirus treatment, although at lower numbers than in the injected tumor (figure 7C). Interestingly, no increase of reovirus copy numbers could be observed in other organs except for the tumor-draining lymph node (TDLN) (figure 7D). The presence of reovirus in the distant tumor also led to an increased expression of a selection of IFN-stimulated genes (ISGs) (figure 7E) and subsequent increased influx of CD8+ T cells, indicating that locally injected reovirus can find its way to distant tumors and is associated with the recruitment of immune cells there (figure 7F). We then investigated whether our combination treatment could also effectively control the growth of distant tumors. As expected, monotherapy with CD3xTRP1 bsAbs did not affect the tumor growth of local or distant tumors (figure 7G). Strikingly, combination treatment also induced regression of the distant KPC3.TRP1 tumors (figure 7H). This effect was TRP1 targeted, since no regressions were observed in distant tumors not expressing TRP1 (KPC3). These findings suggest that the combination of reovirus and CD3-bsAbs might also be effective in metastatic disease.

Intratumorally-injected reovirus sensitizes local and distant cold tumors for subsequent treatment with CD3xTRP1 therapy. (A) Expression of activation markers on splenic CD8+ or CD4+ T cells 5 days after reovirus or phosphate-buffered saline (PBS) administration (n=5/group). (B) Treatment schedule of experiment described in (C–G). Mice (n=8–10/group) were subcutaneously inoculated with KPC3.TRP1 cells in the right flank. Seven days later, another KPC3.TRP1 or KPC3 tumor was inoculated in the left flank. Mice received intratumoral (i.t.) injections of reovirus (107 plaque-forming units (pfu)) in the primary right tumor. Then, mice were sacrificed for intratumoral analysis at 3 and 7 days post reovirus injections (p.i.) (panels C–F; pooled results of two independent experiments with similar results) or mice received subsequent intraperitoneal (i.p.) injections of 12.5 µg CD3xTRP1 bispecific antibodies (bsAbs) and tumor size was monitored (panels G and H). (C) Reovirus genomic segment 4 (S4) copy numbers in local and distant tumors 3 days after reovirus treatment or PBS as control. (D) S4 copy numbers present in other organs of reovirus-treated mice 3 days after reovirus administration. Dashed horizontal line represents average S4 copy numbers in PBS-treated mice. (E) Heatmap of relative expression of interferon response genes in local and distant tumor as determined by quantitative reverse transcription PCR. Numbers indicate fold change versus PBS-treated local tumors. (F) Frequency of T cells in local and distant tumors of mice 7 days after local reovirus administration. Data presented as mean±SEM. Differences between PBS and reovirus in panels A and C–F were determined with unpaired t tests. (G) Individual tumor growth curves of local and distant tumors of mice (n=8/group) treated with CD3xTRP1. Dashed red lines indicate timing of injection. (H) Individual tumor growth curves of local and distant TRP1-expressing (KPC3.TRP1) or wild-type (WT) KPC3 tumors of mice after i.t. treatment with reovirus and subsequent i.p. injections with CD3xTRP1. Dashed lines indicate timing of injection with reovirus (blue) or CD3xTRP1 (red). Significance levels: *p<0.05, **p<0.01, ***p<0.001 and ****p<0.0001. TDLN, tumor-draining lymph node.
Intravenous administration of reovirus is also effective in preconditioning the TME
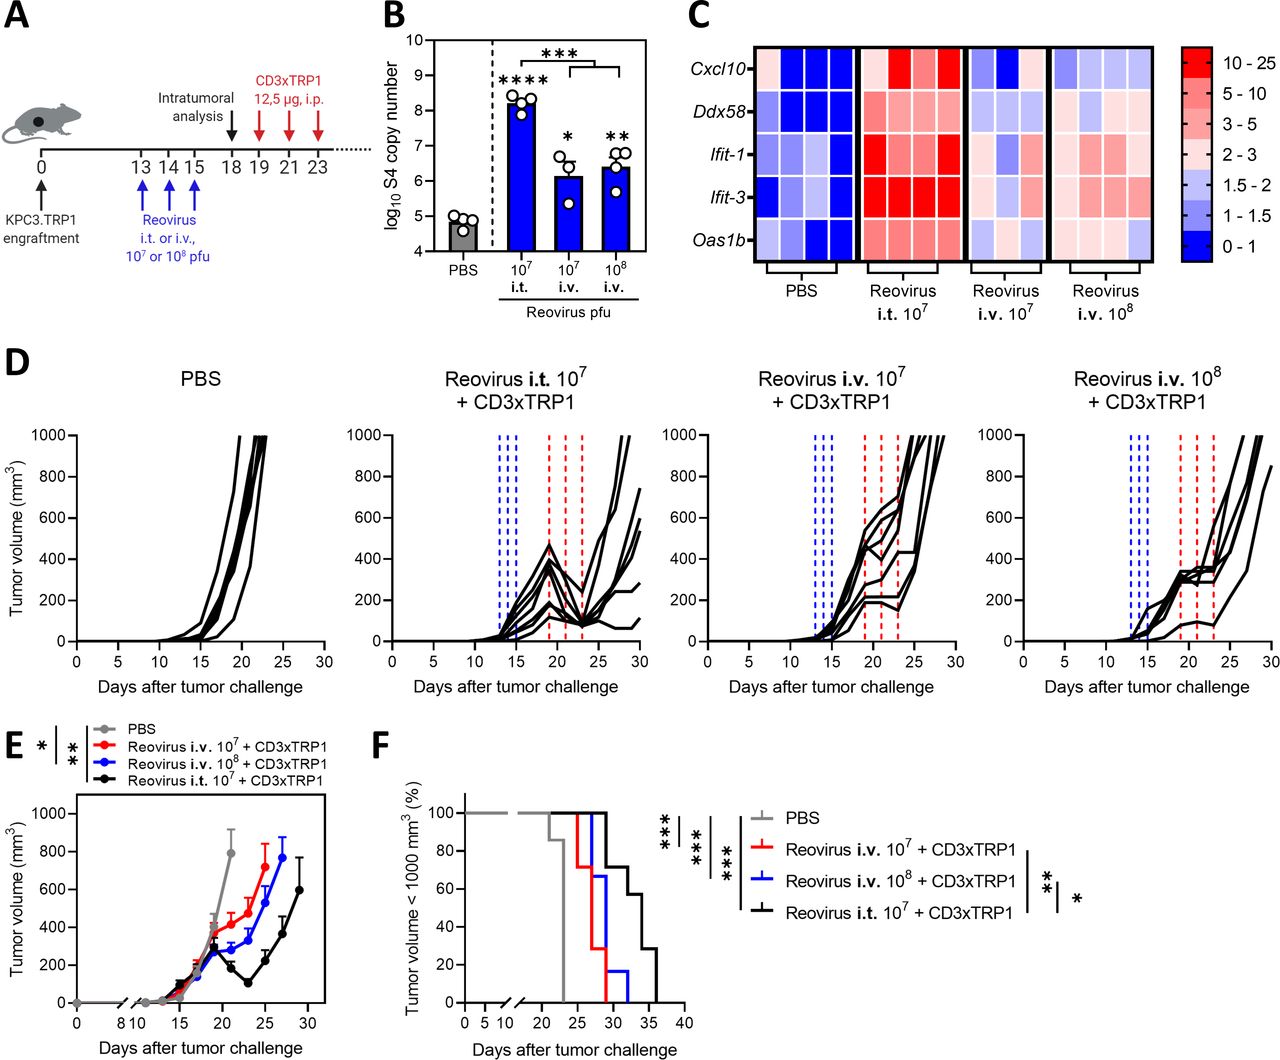
In the present study, reovirus was injected intratumorally to ensure efficient delivery at the tumor site. However, in most clinical studies, intravenous infusion of reovirus has been applied36 and effective delivery to tumor sites, including the brain, was demonstrated.11 We therefore tested the therapeutic efficacy of systemic delivery of reovirus (figure 8A). Intravenous administration of 107 and 108 pfu/injection resulted in detectable numbers of reovirus genomic copies in the tumor, although in significantly lower numbers compared with intratumoral administration of 107 pfu of reovirus (figure 8B). Increased expression of a selection of ISGs was observed in comparison to the PBS group (figure 8C), suggesting that intravenously administered reovirus is able to induce an IFN response in the TME. Intravenous administration of reovirus was effective as a preconditioning method, since tumor outgrowth was temporarily halted, but no regressions were observed as was the case after intratumoral administration (figure 8D–F). Mice treated with any of the combination treatments had smaller tumor volumes (figure 8E) and significantly prolonged survival times (figure 8F) in comparison to the untreated group. These data imply that preconditioning of the TME with both intravenous and local administration of reovirus is effective to turn CD3-bsAbs into a potent immunotherapy for solid cancers. Collectively, our data demonstrate that replication-competent reovirus turns an otherwise unsuccessful CD3-bsAb therapy into a powerful systemic treatment.
Intravenous (i.v.) administration of reovirus is also effective in preconditioning the tumor microenvironment. (A) Design of experiment described in (B–F). KPC3.TRP1-bearing mice were intratumorally (i.t.) or i.v. injected with reovirus (107 or 108 plaque-forming units (pfu)) on 3 consecutive days. Tumors were harvested 3 days after the last reovirus injection for intratumoral analysis (n=3–4/group) or received intraperitoneal (i.p.) injections of 12.5 µg CD3xTRP1 bispecific antibodies (bsAbs) (CD3xTRP1) or phosphate-buffered saline (PBS) as control (n=6–7/group). (B) Reovirus genomic segment 4 (S4) copy number in tumor lysates by quantitative reverse transcription PCR (RT-qPCR). Mean±SEM. (C) Heatmap of relative expression of interferon response genes in tumors versus phosphate-buffered saline (PBS) treatment, as determined by RT-qPCR. (D) Individual tumor growth curves of KPC3.TRP1-bearing mice (n=6–8/group) that were i.t. or i.v. injected with reovirus (107 or 108 pfu) on 3 consecutive days. After 4 days, mice received i.p. injections of 12.5 µg CD3xTRP1 bsAbs (CD3xTRP1) or PBS as control. Dashed vertical lines indicate timing of injection with reovirus (blue) or CD3xTRP1 (red). (E) Average±SEM tumor growth curves. Differences in mean tumor volumes versus PBS treatment on day 21 are determined by one-way analysis of variance with Dunnett’s post hoc test. (F) Kaplan-Meier survival curves of mice. Log-rank test was used to compare differences in survival. Significance levels: *p<0.05, **p<0.01, ***p<0.001 and ****p<0.0001.
Discussion
In this study, we demonstrated that preconditioning of the TME with oncolytic reovirus is an attractive strategy to prime immunologically cold tumors for T-cell-engaging antibody therapy (Graphical abstract). Tumor-selective replication of competent reovirus converted the TME to an inflamed site with a strong IFN signature and T-cell-attracting chemokines, followed by an enhanced influx of NK cells and activated T cells. Subsequent systemic administration of T-cell-engaging antibodies induced strong tumor regressions of reovirus-injected and distant non-injected lesions, implying that this strategy may be effective for the treatment of metastatic disease.
Although OVs are considered potent anticancer modalities, reovirus and several others have demonstrated limited therapeutic efficacy when used as a monotherapy. Since oncolytic activity may not be the main asset of reovirus as anticancer therapeutic, we focused on its potential to modify the TME. RNA viruses typically replicate with fast kinetics and induce a very potent type I IFN response.37 Indeed, our analysis of reovirus-induced immune dynamics revealed a very fast and potent induction of intratumoral IFN response, followed by a robust influx of T cells. UV-inactivated, replication-incompetent reovirus did not induce an IFN gene signature and T-cell influx in the TME, although it still contains pathogen-associated molecular patterns (PAMPs) that may be recognized by PRRs.38 Although UV-inactivated reovirus has shown to be effective in the induction of tumor-specific T cells by human DCs in an in vitro setting,31 in our in vivo setting replication was required to induce a potent IFN response and subsequent T-cell infiltration into the tumor. In contrast, modified vaccinia virus did induce intratumoral inflammation and T-cell influx after inactivation, indicating that this OV holds sufficient viral PAMPs in the absence of viral replication.39
Intratumoral injections lead to “islands” of reovirus production within the tumor, resulting in local amplification and release of virus particles. Concomitantly, we found viral spread in the animals from injected tumors to distant non-injected tumors, without affecting healthy tissues except for low levels in the TDLN. Previous work already showed that various cell types such as T cells, DCs, monocytes and granulocytes can act as cellular carriers and deliver infectious reovirus particles to tumor cells, even in the context of pre-existing antiviral immunity.40–42 We speculate that one of these immune cell types is involved in carrying infectious reovirus particles via the TDLN to distant tumors. Further research is required to elucidate the exact cellular carrier or if reovirus can migrate without any cellular carrier.
Local versus systemic delivery of OVs is a huge topic of debate. Local delivery of OVs is in clinical practice for talimogene laherparepvec (T-VEC)13 43 and is used in many preclinical studies including the present study to ensure efficient delivery to the tumor site.12 However, in most clinical studies, reovirus is administered intravenously.11 36 One advantage of intravenous delivery is that it does not rely on injectable tumor lesions, which are not available in the majority of cancer types. Here, we showed that intravenously injected reovirus is able to reach the tumor and sensitize tumors for subsequent CD3-bsAb therapy. However, the antitumor efficiency of the combination with CD3-bsAbs is lower when compared with intratumorally injected reovirus. Even a 10-fold higher dose of systemically administered reovirus significantly underperformed intratumoral delivery, suggesting that intravenous delivery would need to be improved to reach its full potential. One previously suggested method to enhance reovirus delivery is to load reovirus on the aforementioned cellular carriers.40 Nevertheless, the efficacy of the intravenous delivered reovirus in this model is an important finding since it paves the way for clinical application of such a combination regardless of the tumor location and route of administration.
Reovirus and other OVs have already demonstrated to combine well with checkpoint blockade, a therapy that depends on the presence of tumor-specific T cells.10–12 OVs and T-cell-engaging antibody therapy is an emerging and exciting new field of research. We demonstrated that prior sensitization with reovirus greatly enhanced the efficacy of CD3-bsAb therapy in immunologically cold tumors. However, others introduced bispecific T-cell engagers (BiTE) as transgenes into OVs.44–47 For instance, treatment with oncolytic measles virus encoding CD3-BiTEs demonstrated delayed tumor growth and prolonged survival in immunocompetent C57BL/6J mice harboring subcutaneous MC38 or B16 tumors.44 Similarly, oncolytic adenovirus engineered with a CD3-BiTE targeting epidermal growth factor receptor (EGFR) and an oncolytic vaccinia virus encoding a CD3xEPHA2 BiTE showed antitumor activity in xenograft models and an oncolytic adenovirus encoding a CD3-BiTE targeting epithelial cell adhesion molecule (EpCAM) was able to activate endogenous T cells to kill tumor cells in primary human tumor samples of malignant peritoneal ascites and pleural exudates.45–47 Although encoding bsAbs or BiTEs in OVs has several advantages such as reduction of treatment burden for patients,35 our data imply that these strategies do not exploit the full potential of this combination therapy as the T-cell influx peaks around a week after reovirus application, when viral genomic copies start to decline. In the studies with BiTE-encoding OVs, the kinetics of expression of the transgene may not parallel the kinetics of the OV-induced T-cell activation, especially since BiTE molecules have a very short half-life due to their small size and the absence of a stabilizing Fc tail.3 Most of the T-cell-engaging activity might already be declined at the peak of T-cell attracting chemokines. We therefore advocate to separate the administration of OVs from bsAbs and consider OV injection as a preconditioning strategy. Further research is, however, warranted to fully understand the optimal regimen of OV and bsAb delivery, including the biodistribution of the OVs and bsAbs, and how this differs between OVs, bsAbs and even tumor types.
The mechanism of action of CD3-bsAbs is not yet completely understood. For instance, in our studies, we did not assess whether CD3xTRP1 bsAbs first bind TRP1 in the tumor and then engage T cells that are infiltrating into the tumor due to reovirus-induced inflammation, or if bsAbs bind T cells in the lymph node, spleen or the circulation and subsequently activate these T cells on binding of TRP1 in the tumor.4 Elucidating this mode of-action might be important to further harness the full potential of CD3-bsAbs as a monotherapy and in combination with OVs since it will guide future improvements in therapeutic efficacy.
Importantly, our data demonstrated that the combination of OV and CD3-bsAbs is an extremely powerful therapy that imposed a strong, immunological selective pressure on the tumors, leading to initial regressions but later on in relapsed tumors that lost expression of the antigen. We used the melanoma-associated antigen TRP1 as a well-known model antigen. This surface-expressed protein is involved in melanin production but is not essential for cell growth or survival. The use of this particular model antigen allowed us to investigate therapy resistance on the one hand, but on the other can be considered a limitation of our study. It emphasizes the importance of the careful selection of the targeted antigen when this combination strategy is translated to the clinic. For effective bsAb therapy in humans, the ideal target antigen needs to be selectively and abundantly expressed on tumor cells but should also be essential for tumorigenesis. One such target is HER2, and we employed human CD3xHER2 as the second bsAb to demonstrate proof-of-concept of our combination strategy in the HER2+ BT474 model. In this model, we observed some close-to-complete regressions, but we were not able to determine durable responses in these animals due to increasing viremia over time, which we attributed to the lack of a functional adaptive immune system in these NSG mice. Although HER2 and other classical TAAs such as EpCAM and EGFR represent attractive targets, they are not entirely tumor specific. So-called “on-target, off-tumor toxicity” might limit the therapeutic potential of these targets.48 49
Instead, targeting of highly tumor-specific antigen glypican-3 (GPC3) or the tumor-specific mutant of EGFR (EGFRvIII) showed limited and manageable toxicity, and striking antitumor efficacy in immunocompetent mouse models or patients with recurrent glioblastoma.50 51 These data illustrate that further extensive target discovery and testing is required to create safe and effective bsAbs for clinical use. The intracellular proteome might even be considered as a good target for bsAbs, via surface display of tumor-specific peptide/MHC complexes.52
Together, our data demonstrate that combined local reovirus treatment and systemic T-cell-engaging antibody therapy induces strong tumor regressions of both local and distant solid tumors. Both CD3-bsAbs and OVs are already undergoing rigorous clinical testing, suggesting a possible fast translation of our work to the clinic.
Acknowledgments
The authors thank Lisa Griffioen, Noortje de Bie and Marjolein Sluijter for their technical assistance, the Animal Facility of the Leiden University Medical Center (LUMC) for their excellent care of the animals and Michael Fiebig (Absolute Antibody) for his collaboration. The hybridoma 4F2 (reovirus sigma 3), developed by T. S. Dermody from the University of Pittsburgh School of Medicine, was obtained from the Developmental Studies Hybridoma Bank, created by the Eunice Kennedy Shriver National Institute of Child Health and Human Development of the National Institutes of Health and maintained at Department of Biology, The University of Iowa, Iowa. Figures depicting experimental designs and graphical abstract are created with BioRender.com.
References
Supplementary materials
Supplementary Data
This web only file has been produced by the BMJ Publishing Group from an electronic file supplied by the author(s) and has not been edited for content.
Footnotes
Contributors Conceptualization: TvH and NvM. Methodology: CG, PK, DJMvdW, RLvdO, JM, DAMM, RCH, TvH and NvM. Formal analysis: CG, PK, DAMM. Investigation, CG, PK, RLvdO. Resources: DJMvdW, RCH. Writing—original draft: CG, TvH, NvM. Writing—review and editing: all authors. Visualization: CG. Supervision: SHvdB, TvH and NvM. Funding acquisition: SHvdB, TvH and NvM. All authors approved the final version of the manuscript.
Funding This work was financially supported by the Dutch Cancer Society Bas Mulder Award 11056 (to NvM), a PhD fellowship from Leiden University Medical Center (to CG) and the Support Casper campaign by the Dutch Foundation "Stichting Overleven met Alvleesklierkanker" (supportcasper.nl) project numbers SOAK 17.04 and 19.03.
Competing interests None declared.
Patient consent for publication Not required.
Ethics approval All mouse studies were approved by the institutional Animal Welfare Body of Leiden University Medical Center and carried out under project licenses AVD1160020187004 or AVD116002015271, issued by the Centrale Commissie Dierproeven, the competent authority on animal experiments in the Netherlands. Experiments were performed following the Dutch Act on Animal Experimentation and European Union (EU) Directive 2010/63/EU (On the protection of animals used for scientific purposes) at the animal facility of the Leiden University Medical Center (LUMC), the Netherlands.
Provenance and peer review Not commissioned; externally peer reviewed.
Data availability statement All data relevant to this study is included in the main text or in the supplementary materials and is available on reasonable request. Please contact NvM.
Supplemental material This content has been supplied by the author(s). It has not been vetted by BMJ Publishing Group Limited (BMJ) and may not have been peer-reviewed. Any opinions or recommendations discussed are solely those of the author(s) and are not endorsed by BMJ. BMJ disclaims all liability and responsibility arising from any reliance placed on the content. Where the content includes any translated material, BMJ does not warrant the accuracy and reliability of the translations (including but not limited to local regulations, clinical guidelines, terminology, drug names and drug dosages), and is not responsible for any error and/or omissions arising from translation and adaptation or otherwise.