Article Text

Abstract
Background Cytotoxic CD8+ T cell-mediated response is the most important arm of adaptive immunity, which dictates the capacity of the host immune response in eradicating tumor cells. Due to tumor intrinsic and/or extrinsic factors, the density and function of CD8+ tumor-infiltrating lymphocytes (TILs) could be compromised, leading to poor prognosis and survival.
Methods Using RNA-Seq, transcriptomes of sorted CD3+CD8+ TILs from treatment-naïve colorectal cancer (CRC) patients at advanced stages (III and IV) were compared with those from patients with early stages (I and II). A signature referred to as ‘poor prognosis CD8 gene signature (ppCD8sig)’ was identified and analyzed in The Cancer Genome Atlas CRC dataset. Scores for the ppCD8sig were calculated and classified as high, intermediate and low, and its prognostic significance was assessed using multivariate analysis and Cox proportional hazard model. Densities of CD3+ and CD8+ T cell infiltration in tumors from patients with high and low ppCD8sig scores were assessed by flow cytometry and immunostaining.
Results Genes related to epigenetic regulation and response to hypoxia were upregulated in CD8+ TILs from patients with advanced stages, while genes related to T cell activation, cell proliferation and cell cycle were downregulated. Patients with high ppCD8sig score had poorer disease-specific survival (DSS) and shorter progression-free interval (PFI). The ppCD8sig was an independent prognostic indicator for DSS (HR 1.83, 95% CI 1.40 to 2.38, p<0.0001) and PFI (HR 1.42, 95% CI 1.04 to 1.93, p=0.026). Additionally, patients with high ppCD8sig score were more likely to have advanced stages (χ2 p<0.0001) and residual disease after primary therapy (χ2 p=0.046). Patients with high ppCD8sig score had reduced levels of CD3+ and CD8+ TILs and low Immunoscores (IS), compared to patients with low ppCD8sig score.
Conclusions Our data provided insights into the altered regulation of biological mechanisms and signaling pathways in CD8+ TILs during CRC progression, and revealed a gene signature as an independent prognostic indicator. Patients with high ppCD8sig score had lower levels of TILs and low IS. These data further confirm the prognostic value of the identified ppCD8sig and potentially highlight its clinical relevance.
- CD8-positive T-lymphocytes
- gene expression profiling
- lymphocytes
- tumor-infiltrating
- tumor microenvironment
- adaptive immunity
This is an open access article distributed in accordance with the Creative Commons Attribution Non Commercial (CC BY-NC 4.0) license, which permits others to distribute, remix, adapt, build upon this work non-commercially, and license their derivative works on different terms, provided the original work is properly cited, appropriate credit is given, any changes made indicated, and the use is non-commercial. See http://creativecommons.org/licenses/by-nc/4.0/.
Statistics from Altmetric.com
- CD8-positive T-lymphocytes
- gene expression profiling
- lymphocytes
- tumor-infiltrating
- tumor microenvironment
- adaptive immunity
Introduction
Although current modalities of cancer immunotherapies, such as immune checkpoint inhibitors (ICIs) and adoptive T cell transfer, have revolutionized the treatment of several solid tumors and hematological malignancies, major health issues remain unresolved.1 2 Many patients with cancer with advanced stages and metastatic tumors remain unresponsive or show limited response rates to immunotherapies. The underlying mechanisms responsible for such outcomes can vary across cancer patients and include genetic, epigenetic, tumor-intrinsic and tumor-extrinsic factors.3 4 All of these factors can determine the host antitumor immune response, tumor subtype, and cellular and molecular composition of the tumor microenvironment (TME), and therefore, dictate tumor immunogenicity, and impact disease prognosis and the sensitivity of the host response to immunotherapy.2
Colorectal tumors are heterogeneous, characterized by multiple phenotypes, clinical and pathological features, which are influenced by multiple factors ranging from genetics, epigenetics, microbial to environmental factors.5 6 In colorectal cancer (CRC), response to therapy and clinical outcomes vary between patients with genetic variations, different tumor-node-metastasis (TNM) stages, anatomical sites and immune-associated factors, including the type, density, function and location of tumor-infiltrating lymphocytes (TILs), designated as ‘Immunoscore (IS)’.7–9 For instance, it has been shown that patients with CRC with microsatellite instability (MSI), caused by deficient DNA mismatch repair, and non-metastatic (stage I–III) tumors have a better prognosis; this is more likely due to a higher density of tumor-infiltrating immune cells, compared with patients with CRC with microsatellite stable (MSS) tumors.10–12 Indeed, it has been reported that non-metastatic tumors with MSI phenotype exhibit a higher density of CD8+ T cells, compared with non-MSI phenotype, and that CD8+ T cell density is an independent prognostic indicator for favorable disease-free survival.13 These results implicated that CD8+ T cell density can be used as a marker for prognosis in non-metastatic CRC, independently of their location within the TME, that is, core or invasive margin (IM).13 Additionally, metastatic patients with CRC with MSI tumors show worse prognosis,11 but they tend to respond better to ICIs than patients with MSS tumors.14 15 In regard to anatomical sites, it has been reported that patients with right-sided CRC tumors have worse prognosis, but respond better to immunotherapy as they have high tumor antigen load, compared with those with left-sided CRC tumors.16 17
Studies have shown that elevated levels of CD8+ TILs have been associated with prolonged overall survival and recurrence-free survival in patients with CRC, regardless of disease stages, suggesting that they could be indicators of improved prognosis.18 19 Furthermore, increased number of intraepithelial CD8+ TILs has been associated with prolonged disease-specific survival (DSS) in patients with CRC.20 IS of colon cancer, a trademark clinical measure based on the quantification of CD3+ and CD8+ T cells in the center of tumor (CT) and IM regions, has been considered as an independent prognostic indicator for the risk of tumor relapse in patients with stage I–III, even better than the traditional TNM staging.8 9 Time-dependent receiver operating characteristic curve analysis has shown that IS is the best predictor for clinical outcomes; the majority of patients with high CD8+ T cell infiltration in CT and IM regions presented with early CRC stages, while the majority of patients with low CD8+ T cell infiltration in both regions presented with advanced CRC stages.21 In the same study, it was reported that patients with tumor recurrence had low levels of CD8+ T cell infiltration in CT and IM regions. Patients with CRC with high IS (ie, high density of CD8+ T cell infiltration within both regions) usually have improved prognosis associated with favorable clinical outcomes.8 22 23
However, the prognostic value and clinical performance of the IS have only been validated in patients with CRC with localized tumors, stage I–III.24 More recently, it has been proposed that IS could serve as a biomarker to predict responder and non-responder patients to a particular cancer therapy.25 Although the use of IS in the clinic is useful for the aforementioned reasons, it cannot provide insights into the in vivo function of T cells within the tumor as it only quantifies the density of intratumoral and peritumoral T cells. The density and functional capacity of CD8+ TILs could vary with CRC stages; tumors from patients with advanced stages may display high numbers of CD8+ T cells, however, with impaired cytotoxic functions and exhausted phenotypes. Therefore, both functionality and density of tumor-reactive CD8+ T cells should be simultaneously examined to gain better understanding and comprehensive insights into the immune response within the TME.
In this study, we compared the transcriptomes of CD8+ TILs from 18 treatment-naïve CRC patients with advanced stages (III and IV; n=8) and early stages (I and II; n=10) to decipher their molecular and functional characteristics during disease progression. Based on transcriptomic data and The Cancer Genome Atlas (TCGA) analysis, we identified a gene signature, referred to as ppCD8sig and assessed its potential prognostic impact on survival and CRC progression. Moreover, we classified the patient cohort into two groups either with high or low ppCD8sig score and compared their CD8+ TIL transcriptomic profiles. We also determined the densities of CD3+ and CD8+ T cell infiltration in tumor tissues using flow cytometry and immunohistochemistry.
Materials and methods
Sample collection, processing and storage
Tumor tissue specimens were collected from 18 patients with CRC who underwent surgery at Hamad Medical Corporation, Doha, Qatar. Demographic details and clinicopathological characteristics of the study population are listed in table 1; all patients were treatment-naïve. Histological assessments of tumor samples were performed by pathologists to determine clinicopathological parameters including TNM staging. We combined patients with stages I and II (referred to early stages) and stages III and IV (referred to advanced stages). Samples of patients with CRC were collected over a year, and tissue samples were selected based on the tumor stage. We randomly selected five patients per stage, excluding tumor samples with fatty tissues and small size, and tumor samples from patients with polyps or other medical conditions such as other cancer types and peritoneal disease. Two patient samples from stage III were excluded post RNA-Seq as they did not pass quality controls.
Characteristic features of study populations
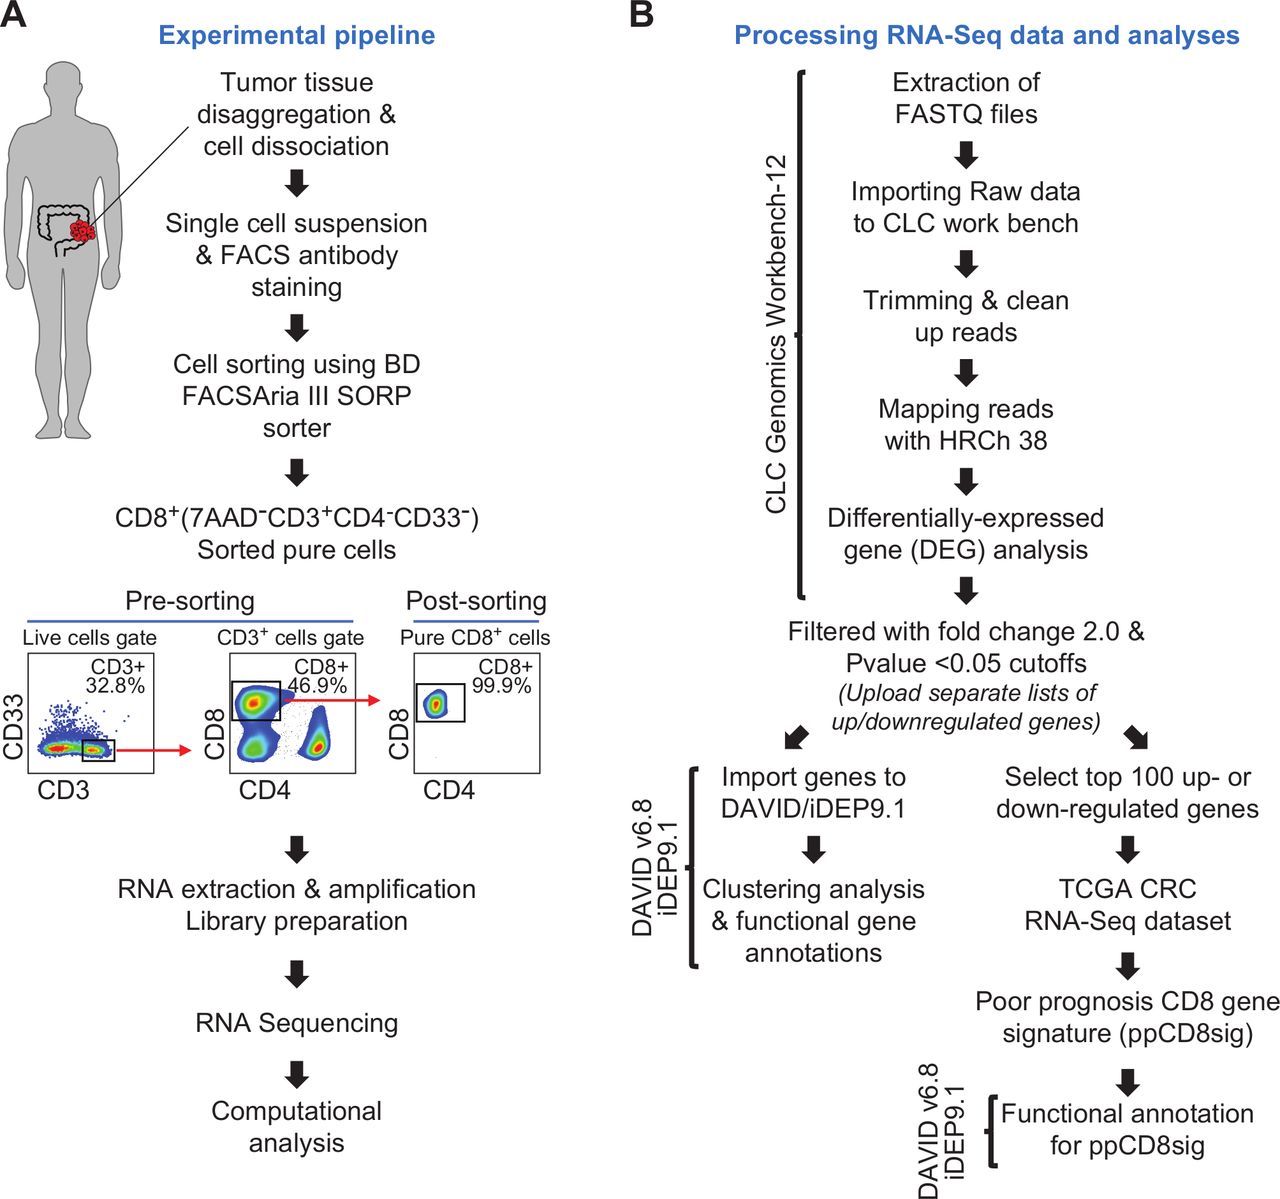
Patients gave written informed consent prior to surgery and sample collection. All experiments were performed in accordance with relevant guidelines and regulations. Tumor tissue specimens were processed and stored, as we have previously described.26 27 Using mechanical disaggregation, cells were dissociated from bulk tumor tissues, and single cell suspensions were obtained for subsequent experiments as we have previously described.27 The experimental pipeline is shown in figure 1A.

Schematic overview of the study design. (A) Pipeline of the experimental approach. (B) Pipeline of RNA-Seq data processing and analyses. Online bioinformatic tools used in each step are shown. CRC, colorectal cancer; TCGA, The Cancer Genome Atlas.
Fluorescence-activated cell sorting
Following phosphate-buffered saline (PBS) washing, single cell suspension from tumor tissue was washed and resuspended in 100 µL of flow cytometry staining buffer (PBS with 1% fetal calf serum (FCS) and 0.1% sodium azide). Fc receptor (FcR) Blocking Reagent, human (Miltenyi Biotec, Bergisch Gladbach, Germany) was used to block FcR. Cells were stained with cell surface antibodies against CD3-APC-Cy7 (clone SK7, BD Pharmingen, San Jose, USA), CD4-PE (clone RPA-T4, BD Pharmingen), CD8-FITC (clone RPA-T8; BD Pharmingen), CD33-APC (clone WM53, BD Pharmingen) and 7-AAD viability dye (eBioscience, San Diego, USA) to exclude dead cells and gate on live cells.
Cells were washed with flow cytometry staining buffer then re-suspended in Pre-Sort buffer (BD Biosciences). BD FACSAria III SORP cell sorter on BD FACSDiva software (BD Biosciences) was used for sorting pure CD8+ (7AAD–CD3+CD4–CD8+CD33–), CD4+ (7AAD–CD3+CD4+CD8–CD33–) and CD33+(7AAD–CD3–CD4–CD8–CD33+) populations. The sorting strategy is shown in figure 1A. We used stringent gating strategy and applicable measures to ensure minimal sorter-induced cell stress. High purities of sorted immune cell populations were always checked and confirmed. FlowJo V.10 software (FlowJo, Ashland, USA) was used for data analyzes.
RNA extraction and amplification
Total RNA was extracted from sorted CD8+ T cells isolated from CRC tumor tissues of 18 patients using RNA/DNA/protein purification Plus Micro Kit (Norgen Biotek Corporation, Ontario, Canada) following the manufacture’s protocol. Purified RNA was then amplified using 5X MessageAmp II aRNA Amplification Kit (Invitrogen, California, USA), according to the manufacturer’s protocol. RNA concentrations were quantified using Qubit RNA High Sensitivity or Broad Range Assay Kits (Invitrogen).
Library preparation
RNA samples from sorted CD8+ T cells were used to generate cDNA libraries using Exome TruSeq Stranded mRNA Library Prep Kit (illumina, San Diego, USA) following the manufacturer’s protocol and as previously described.28 cDNA libraries which passed quality controls were subjected to clustering using TruSeq PE Cluster Kit v3-cBot-HS (illumina). Sequencing of clustered samples was performed on an illumina HiSeq 4000 instrument, using HiSeq 3000/4000 SBS Kit (illumina).
Processing RNA sequencing data and analyses
CLC Genomics Workbench 12 (Qiagen, Hilden, Germany), with default settings, was used to trim cleaned pair end reads and align them to the hg19 human reference genome.28 In CLC Genomics Workbench 12, the abundance of gene expression was determined by the score of Transcripts Per Million (TPM) mapped reads. Abundance data were subsequently subjected to differential gene expression analyses. Using CLC genomics, datasets for patients with stage I–IV were generated, then each dataset was compared with another dataset in a stage pairwise comparison using differential gene expression analysis (online supplemental table 1). Transcriptomic data from patients with early stages (stages I and II) were also compared with patients with advanced stages (stages III and IV) (online supplemental table 1). Only differentially expressed genes (DEGs) with fold change >2 and p<0.05 cutoffs were subjected for functional annotation analyses using online bioinformatic tools, Database for Annotation, Visualization and Integrated Discovery (DAVID)29 and Integrated Differential Expression and Pathway analysis (iDEP.91).30 Functional annotation for DEGs was based on Gene Ontology Biological Process enrichment analyses. The differential expression of selected genes encoding T cell exhaustion markers and T cell-related transcription factors, cytokines and chemokines in CD8+ TILs from patients with advanced versus early stages was examined (online supplemental table 2). For heatmaps, Z-scores were calculated from TPM values, as previously described.31 Principal component analysis (PCA) and volcano plots for gene dataset comparing advanced and early stages were performed by OrignPro 2020 software (OriginLab Corporation, Massachusetts, USA). Clustering analyses, such as hierarchical clustering and k-means clustering, were performed on iDEP.91.30 Protein–protein interaction (PPI) networks and their statistics for some of the significantly up/downregulated genes were determined by an online tool, STRING V.11.0 (http://string-db.org).32 The pipeline for RNA sequencing data processing and analyzes is shown in figure 1B.
Supplemental material
The Cancer Genome Atlas analysis
The top 100 upregulated genes and 100 downregulated genes in CD8+ TILs from patients with CRC with advanced stages compared with those with early stages were selected for analysis in TCGA CRC dataset, accessed via the UCSC Xena platform (http://xena.ucsc.edu/). Genes aligned in TCGA dataset with similar expression trends were used to identify the ‘poor prognosis CD8+ T cell gene signature’ (ppCD8sig). The ppCD8sig score was calculated as the ratio of the average expression of the aligned upregulated genes to the average of the aligned downregulated genes (online supplemental table 3). Next, we divided patients into three groups by classifying the ppCD8sig score into high (top 33%), intermediate (middle 33%) and low (bottom 33%) scores based on the average calculated from the ratio of upregulated/downregulated genes in all the patients included in TCGA dataset (online supplemental table 3). Moreover, ppCD8sig score for patient cohort included in this study was also classified into high ppCD8sig score (n=9, top 50%) and low ppCD8sig score (n=9, bottom 50%) (online supplemental table 4).
Assessment of T cell infiltration and classifications of hot and cold tumors
Percentages of CD3+ and CD3+CD8+ TILs were calculated from flow cytometric data to determine the density of TILs in patients with low and high ppCD8sig scores. Tumors in patients with low and high ppCD8sig scores were classified into ‘hot’ and ‘cold’ tumors based on the mRNA expression of T cell-related marker genes, such as immune checkpoints (ICs) and interferon-γ (IFN-γ), in CD8+ TILs.33 34 For heatmap, the fold change in gene expression was represented as Z-score, which was calculated from TPM values, as previously described.31
Immunohistochemistry and determination of IS
Blocks of Formalin Fixed-Paraffin-Embedded tissue specimens were cut into 4 µm sections and processed for immunohistochemistry and immunoscoring. Tissue slides were stained with anti-CD3 (clone AB75, DAKO, Glostrup, Denmark) and anti-CD8 (clone C8/144B, DAKO), then visualized by EnVision Flex visualization system (DAKO) and counterstained with hematoxylin (DAKO). Immunostaining for CD3 and CD8 was performed using Autostainer linker (DAKO). Stained slides were scanned on Aperio AT2 scanner (Leica Microsystems, Wetzlar, Germany) with ×20 magnification and 0.5 µm/pixel resolution. QuPath software was used to quantify the density of CD3+ and CD8+ T cells in CT and IM regions.35 Regions of CT, IM and healthy epithelium were defined manually and validated by a pathologist. Areas of necrosis or artifacts were excluded. Densities of CD3+ and CD8+ T cells in the CT and IM regions per mm2 were quantified by QuPath, then converted into percentiles. For IS determination, the mean of 4 percentiles obtained for CD3+ CT, CD3+ IM, CD8+ CT and CD8+ IM was calculated, as previously described,25 and categorized into two groups: low IS (mean percentile 0%–50%) and high IS (51%–100%).
Statistical analyses
Statistical analyses were performed using GraphPad Prism V.8 software (GraphPad Software, California, USA). Mantel-Cox test was used to determine log-rank p value when comparing DSS and progression-free interval (PFI) among the patient groups with high, intermediate and low ppCD8sig score. Multivariate analyzes for DSS and PFI were performed using Cox proportional hazard model (MedCalculator V.12.7, https://www.medcalc.org/) in comparison to the ppCD8sig (high, intermediate, low), disease stage (IV, III, II, I), residual disease (yes, no), age (<55, 55–64, 65–74, >74 years of age), anatomic locations (seven different locations), and sex (male, female). χ2 test was used to determine the association between the different ppCD8sig scores and disease stage, the presence of residual disease, age, gender or different CRC anatomical locations. Unpaired t-test was performed on samples that passed the Shapiro-Wilk normality test, while non-parametric Mann-Whitney U tests were performed on samples that did not pass the Shapiro-Wilk normality test. Unpaired t-test was used to compare the differences in T cell infiltration between patients with low and high ppCD8sig scores. A p>0.05 was considered statistically non-significant. The p values are represented as follows; ***p<0.001, **p<0.01, *p<0.05. Data are presented as mean±standard error of the mean (SEM).
Results
Transcriptomes of colorectal tumor-infiltrating CD8+ T cells from patients with advanced and early stages form distinct clusters
The density, activity and molecular characteristics of T cell subsets infiltrating the tumor vary with multiple parameters, including tumor subtype, location and tumor stage. Thus, we sorted CD8+ TILs from 18 patients with CRC (stage I, n=5; stage II, n=5; stage III, n=3; stage IV, n=5) (figure 1A). Using multiple platforms and bioinformatic tools, differential gene expression analysis was performed to compare the transcriptomic profile of CD8+ TILs from patients with CRC with advanced stages (III and IV) versus early stages (I and II) (figure 1B). We found a total of 1672 genes which were differentially expressed between advanced versus early stages, with fold change >2 and p<0.05 cutoffs; 1044 were upregulated and 628 were downregulated (figure 2A). Hierarchical clustering and PCA based on the DEGs showed distinct clusters (online supplemental figure 1), reflecting the variability in cells isolated from patients with advanced stages, compared with early stages.
Supplemental material
Supplemental material
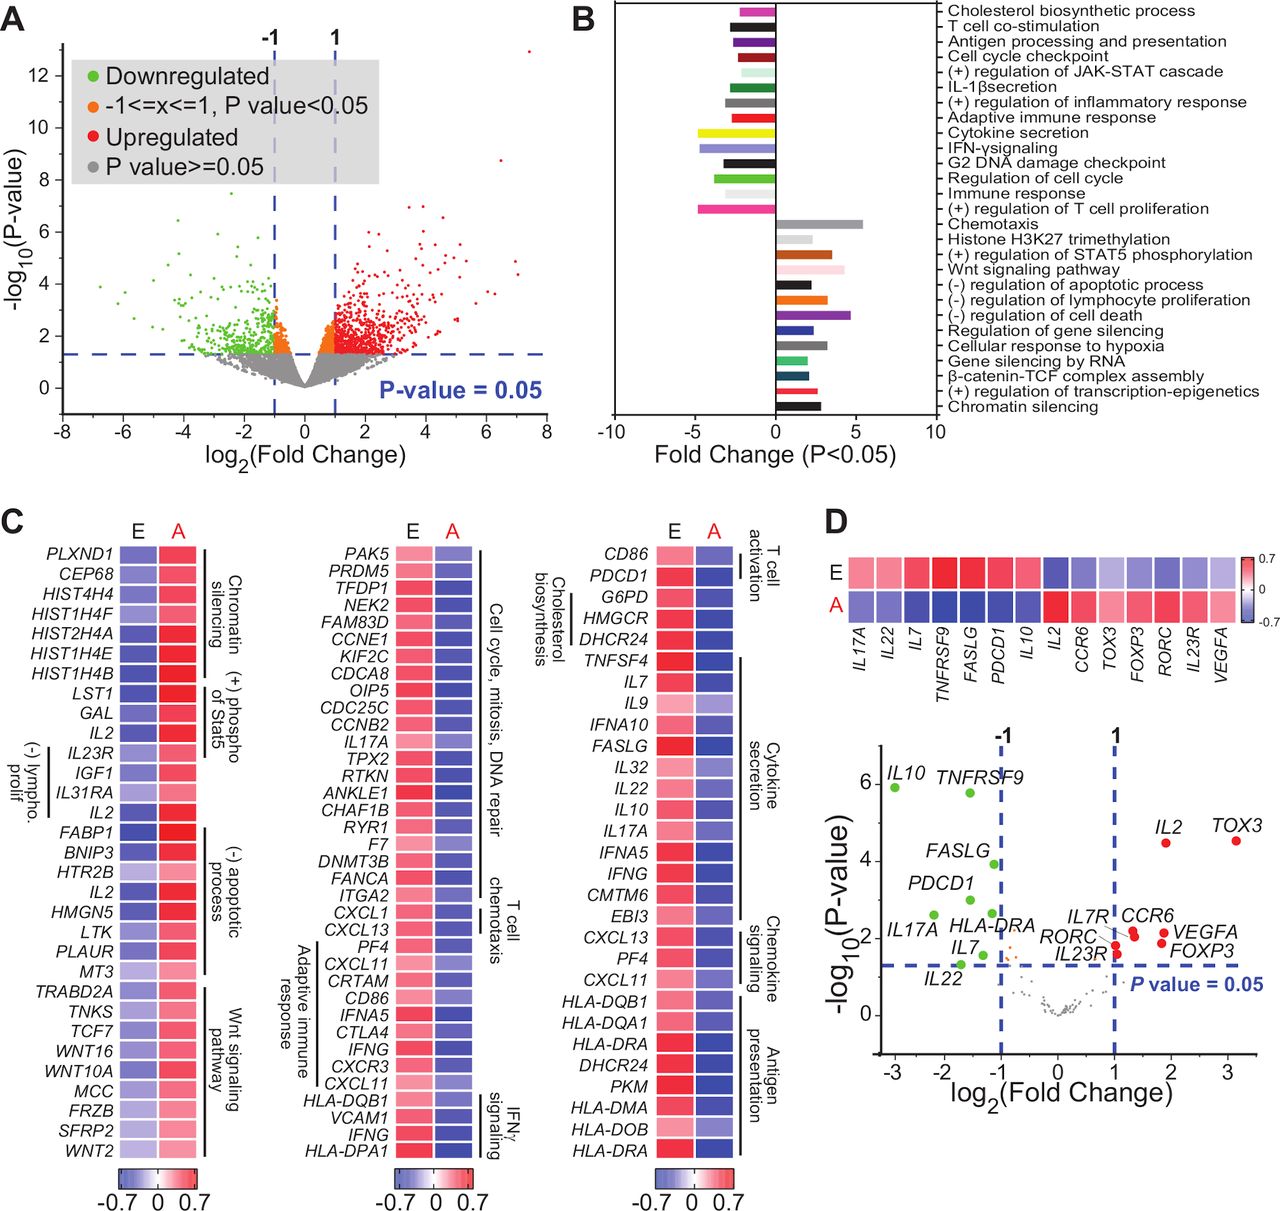
Differentially expressed genes in tumor-infiltrating CD8+ T cells in CRC advanced versus early stages. RNA-Seq was performed on samples from sorted CD8+ TILs, isolated from 18 patients with CRC. Patient samples were divided into two groups based on disease stage; advanced (A: III and IV) and early (E: I and II) stages. Volcano plot of genes that were significantly upregulated (in red), downregulated (in green), or remained unchanged (in gray) (A). Functional annotations of both significantly downregulated and upregulated genes (with fold change >2 and p<0.05) were performed in DAVID web-based tool. Bars show the fold enrichment of pathways that were significantly downregulated or upregulated in CD8+ TILs from advanced stages versus early stages (B). Heatmaps for selected pathways show the Z-score for genes that were differentially expressed in advanced versus early stages (C). Volcano plot of selected genes (shown in online supplemental table 2) and representative heatmap of the Z-score for significantly downregulated and upregulated genes in advanced versus early stages (D). CRC, colorectal cancer; IFN-γ, interferon-γ; IL22, interleukin 22; TILs, tumor-infiltrating lymphocytes.
DEGs with fold change >2 and p<0.05 cutoffs, obtained by comparing the transcriptome of CD8+ TILs from patients with advanced stages versus early stages (online supplemental table 1), were analyzed using DAVID platform to perform functional enrichment analysis based on Gene ontology (Biological Process). Downregulated genes in CD8+ TILs from patients with advanced stages were enriched in pathways related to T cell costimulation, adaptive immune response, cytokine secretion, IFN-γ signaling, cell cycle and DNA damage checkpoint (figure 2B). In contrast, upregulated genes were enriched in pathways related to chemotaxis, chromatin silencing, response to cellular hypoxia, Wnt signaling and negative regulation of lymphocyte proliferation and apoptotic process (figure 2B). Heatmaps for the expression of selected annotated genes are shown in figure 2C.
Next, we examined the expression of selected genes related to immune cell functions (online supplemental table 2), including those encoding ICs, T cell exhaustion markers, transcription factors related to T cell differentiation and function, cytokines and chemokines and chemokine receptors, and made a comparison between advanced and early stages. Genes that were significantly upregulated in advanced versus early stages included interleukin-2 (IL2), TOX3, FOXP3, VEGFA, RORC, IL23R and CCR6, while downregulated genes included IL10, PDCD1, IL17A, IL7, IL22, HLA-DRA, FASLG and TNFRSF9 (figure 2D).
Disease stage pairwise comparisons revealed unique pathways in CD8+ TILs
We generated datasets for the transcriptome of CD8+ TILs from patients with CRC with stages I–IV, and performed differential expression analysis using stage pairwise comparisons. Upregulated and downregulated genes with p<0.05 (online supplemental table 1 and figure 2) were subjected for functional enrichment analysis. The list of upregulated genes and downregulated genes, for each stage pairwise comparison, were imported separately into DAVID platform for functional annotation based on Gene Ontology (Biological Process). For upregulated genes, we found that chromatin silencing was a common pathway in stage III versus I and IV versus II; positive regulation of gene expression by epigenetics was shared between stages III versus I and IV versus I; positive regulation of cell proliferation between III versus II and IV versus I; and negative regulation of apoptotic process was shared between IV versus I and IV versus II (online supplemental figure 3A). These findings highlight the potential importance of biological mechanisms, such as the transcriptional control by epigenetic and regulation of cell proliferation and apoptotic process, in CD8+ TIL biology/function from patients with advanced disease stages. Additionally, negative regulation of apoptotic process was only observed in stage IV, possibly suggesting that CD8+ TILs in advanced stages are unable to induce apoptotic signals to eradicate tumor cells.
Supplemental material
Supplemental material
Based on the functional annotation of downregulated genes, we found that ERK1 and ERK2 cascade was shared between stage IV versus II and IV versus III; T cell costimulation, cell proliferation, cell signaling, cell migration, inflammatory response and IFN-γ signaling pathway were all shared between stage IV versus I and IV versus II; immune response and chemokine signaling pathway were shared between stage IV versus I and IV versus III (online supplemental figure 3B). These latter findings may suggest the functional impairment of CD8+ TILs and their limited capacity of cell proliferation/migration in patients with advanced disease stages.
Functional enrichment analysis of steadily deregulated genes during CRC progression
We sought to investigate the genes, which their expression levels steadily increase or decrease in CD8+ TILs as disease progressed from stages I–IV. We found that the expression of 71 genes steadily increased and 104 genes steadily decreased with disease progression (p<0.05, figure 3A,B). Using functional enrichment analysis through DAVID platform, we found that upregulated genes, such as HIST1H2AC, HIST1H2AB and HIST1H2AD, were significantly enriched within the chromatin silencing pathway (figure 3C,D). Downregulated genes, such as CCNE1, CCNB2, CCNG2, E2F1, PLK1, AURKA, KIF2C, CDC25C, PRR11 and FAM83D, were significantly enriched within cell cycle and proliferation pathways, and genes such as CXCL1, PF4, CLNK, IL22 and OAS2 were significantly enriched within immune response-related pathways, including IFN-γ signaling, T cell receptor (TCR) signaling and T cell costimulation (figure 3C,D).

Upregulated or downregulated genes and pathways in colorectal tumor-infiltrating CD8+ T cells with increasing stages. Genes which their expression levels significantly increase or decrease with increasing stages (from stages I–IV) were identified. Heatmaps representing the Z- score for genes which were upregulated (A) or downregulated (B) with increasing stages. Functional annotations of significantly downregulated and upregulated genes were performed in DAVID web-based tool. Bars show the fold enrichment of functional pathways that were significantly downregulated or upregulated in CD8+ TILs with increasing stages (C). Heatmaps showing the Z-score for significantly upregulated or downregulated genes selected based on the functional analysis in panel (C) (D). IFN-γ, interferon-γ; TCR, T cell receptor; TILs, tumor-infiltrating lymphocytes.
TCGA analysis of RNA-Seq data revealed a poor prognosis CD8+ T cell gene signature in patients with CRC
Out of the 100 upregulated genes, 97 genes were aligned in TCGA CRC RNA-Seq dataset, of which 35 genes (36%) had higher expression in patients with poorer DSS. For the 100 downregulated genes, 94 genes were aligned in TCGA dataset, of which 59 genes (63%) had lower expression in patients with poorer DSS. We used the 35 upregulated and 59 downregulated genes to calculate the ‘poor prognosis CD8+ T cell gene signature (ppCD8sig) score’, and the CRC TCGA cases were labeled as high, intermediate and low groups according to the ppCD8sig score (online supplemental table 3), as described in the Materials and Methods section. Using Kaplan-Meier analysis, we found that patients with high ppCD8sig score had poorer DSS (HR 1.83, 95% CI 1.40 to 2.38, log-rank p<0.0001, figure 4A) and shorter PFI (HR 1.42, 95% CI 1.04 to 1.93, log-rank p=0.0056, figure 4B), compared with patients with intermediate or low ppCD8sig scores.

The poor prognosis CD8+ T cell gene signature is an independent prognostic indicator. The ppCD8sig was evaluated in TGCA CRC RNA-Seq dataset. Kaplan-Meier curves for disease-specific survival (A) and progression-free interval (B) were compared among patients with high (top 33%), intermediate (interm, middle 33%) or low (bottom 33%) ppCD8sig scores. The number (n) of patients in each of ppCD8sig groups and the log-rank p value from Mantel-Cox test are indicated. Multivariate analysis using Cox proportional hazard model evaluating the prognostic indication for the ppCD8sig (high, interm, low), disease stage (stages IV, III, II, (I), residual disease (yes, no), age (<55, 55–64, 65–74, >74 years of age), anatomic locations (seven different locations), and sex (male, female) for disease-specific survival (C) and progression-free interval (D). Data shown is the HR ±95% CI and the multivariate p values are indicated. Distribution of patients with high, intermediate, or low ppCD8sig scores across disease stages (E). The presence of residual disease in patients with different ppCD8sig scores (F). χ2 test was used to determine the association between the different ppCD8sig scores and stages or residual disease. CRC, colorectal cancer; n.s, not significant; TGCA, The Cancer Genome Atlas.
Using multivariate analysis and Cox proportional hazard model, we found that the ppCD8sig was an independent prognostic indicator for DSS (p<0.0001, figure 4C) and PFI (p=0.026, figure 4D), even in the presence of disease stage as another indicator. Patients at advanced stages (III and IV) were more likely to have high ppCD8sig score (χ2 p<0.0001, figure 4E). Patients with high ppCD8sig score were more likely to have residual disease after primary therapy (χ2 p=0.0463, figure 4F). The splenic flexure, descending and sigmoid colon anatomical locations (left-sided colon cancer) were more likely to have a high ppCD8sig score, whereas the transverse colon and the right-sided colon cancers (hepatic flexure, ascending colon and the cecum) were more likely to have a low ppCD8sig score (χ2 p<0.0001, online supplemental figure 4A). This latter finding is consistent with results reported by Liang et al demonstrating that left-sided colon cancer in patients with advanced stages exhibit poorer survival than those with right-sided colon cancers.36 However, we found that the ppCD8sig scores did not differ between males and female (online supplemental figure 4B) or age groups (online supplemental figure 4C). Altogether, TCGA analysis supports that the gene signature identified from our gene expression profiling can predict poorer survival and more aggressive clinicopathological features, and could be reflective of the level or the activity of CD8+ T cells in human CRC.
Supplemental material
High score of poor prognosis CD8+ T cell gene signature is associated with limited proliferative capacity of lymphocytes
A dataset comparing the transcriptome of CD8+ TILs in nine patients with high ppCD8sig score versus nine patients with low ppCD8sig score was subjected to hierarchical clustering and PCA analyzes using iDEP.91 web-based tool (figure 5A,B, online supplemental table 4). The differential expression analysis showed 1239 upregulated genes and 862 downregulated genes in patients with high ppCD8sig score versus low score (figure 5A). PCA confirmed the close relativeness of the biological replicates; PC1 shows 35% variance, while PC2 shows 14% (figure 5B). Using iDEP.91 web-based tool, k-means clustering was performed on the dataset comparing the transcriptome of CD8+ TILs in patients with high ppCD8sig score versus those with low ppCD8sig score. DEGs were separated into two clusters (A and B) and annotated using Gene Ontology (Biological Process) enrichment analysis (figure 5C, online supplementary table 5). Upregulated genes in cluster A were enriched in pathways associated with translational initiation and protein targeting, while downregulated genes in cluster B were enriched in pathways involved in cell cycle, chromosome segregation, mitotic cell cycle and cell division (online supplemental table 5, adjusted p<0.0001). Some of the upregulated genes in high ppCD8sig score associated with nucleosome organization and chromatin silencing, such as HIST2H2BE, HIST2H2BD, HIST1H2BB and HIST1H2BD, were imported into STRING web-based tool to perform PPI and enrichment network analysis (online supplemental figure 5A). STRING database identified 5 nodes and 10 edges with PPI enrichment p=2.6E-09, average clustering coefficient of 1 and average node degree of 4 (online supplemental figure 5A). PPI and enrichment network analysis was also performed for the downregulated genes in high ppCD8sig score, which the majority of them were related to cell proliferation/cell division/mitosis/chromosome segregation, such as AURKA, KIF4A, CCNA2, CCNB2 and CDC25C (online supplemental figure 5B). STRING database identified 63 nodes and 1259 edges with PPI enrichment p<1.0E-16, average clustering coefficient of 0.861 and average node degree of 40 (online supplemental figure 5B). The ability to find the same pathways, as described in earlier results, confirms that the ppCD8sig score based on the 94 selected genes retain the difference between the transcriptomes of CD8+ T cells in patients with CRC with advanced versus early stages.
Supplemental material
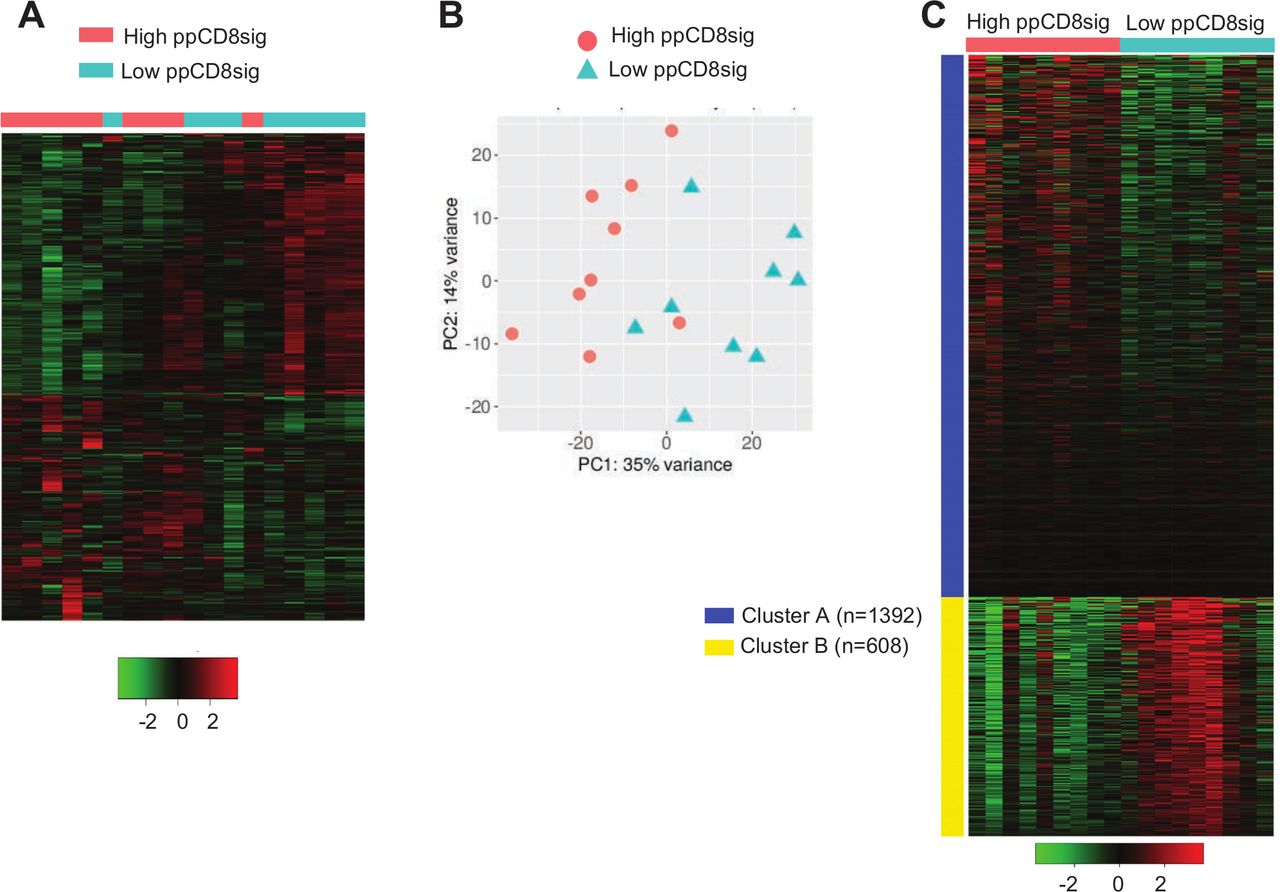
Differential gene expression between high and low scores of poor prognosis CD8 signature. The patients with CRC were divided into two groups based on their ppCD8sig scores, high or low. DEGs with fold change >2 and p<0.05 were subjected to iDEP.91 to perform clustering. Hierarchical clustering of CD8+ TILs from 18 patients with CRC based on ppCD8sig score (A). PCA based on DEGs in CD8+ TILs from patients with CRC with high and low ppCD8sig scores (B). Heatmap of k-Means clustering analysis comparing the CD8+ TIL transcriptomes in patients with high versus low CD8Sig score. The number (n) of genes for each cluster is shown (C). CRC, colorectal cancer; DEGs, differentially expressed genes; TILs, tumor-infiltrating lymphocytes.
Patients with high ppCD8sig score have relatively low tumor-infiltrating CD3+ and CD3+CD8+ T cells and low IS
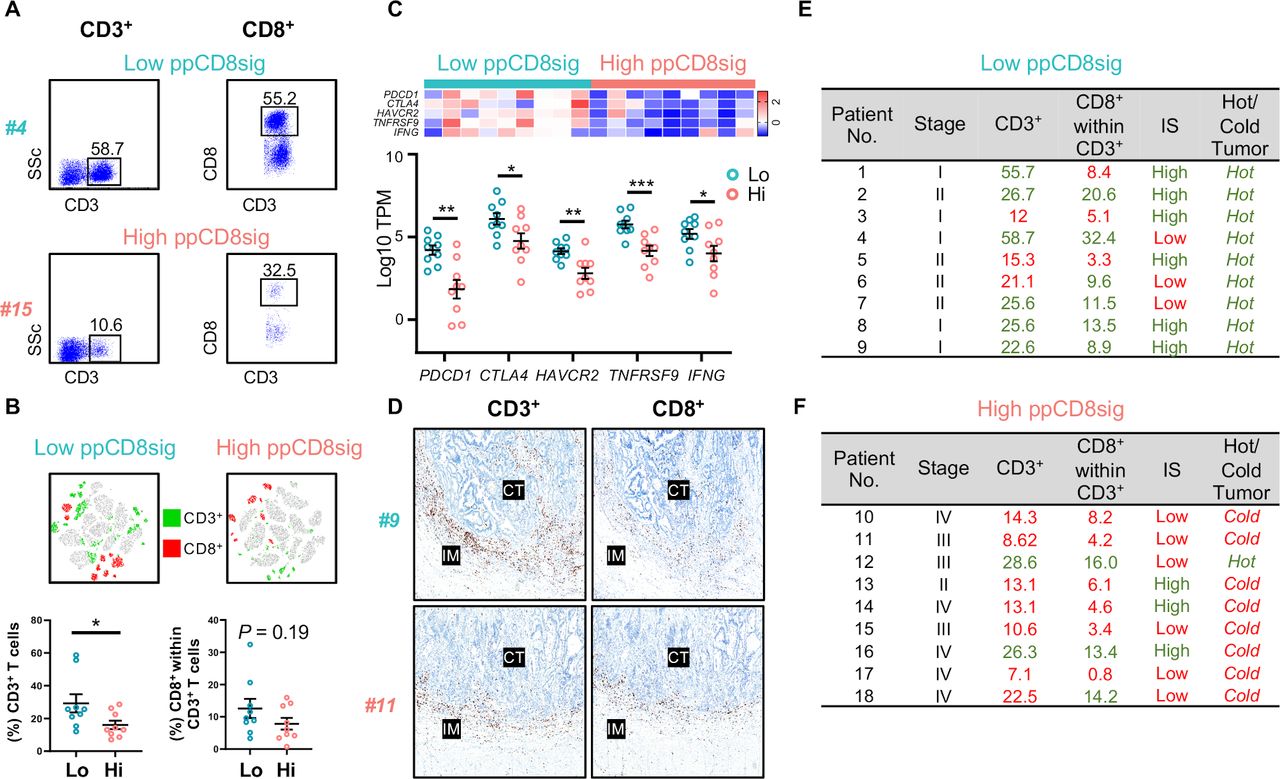
We analyzed our flow cytometric data and determined the percentages of tumor-infiltrating CD3+ and CD3+CD8+ T lymphocytes to determine the level of T cell infiltration, which might reflect the degree of immunogenicity present in the tumor tissue of patients with low and high ppCD8sig scores (figure 6A). We found that patients with high ppCD8sig score had significantly less CD3+ T cell infiltration, compared with those with low score (figure 6B). Additionally, a trend toward reduced levels of CD3+CD8+ T cell infiltrate was seen in patients with high ppCD8sig score, compared with those with low score; it did not reach statistical significance possibly due to small sample numbers (figure 6B). We also determined the expression of T cell-related marker genes, with particular interest on ICs and IFNG, in the two groups of patients with high and low ppCD8sig scores. Reports showed that tumors can be classified into ‘hot’ or ‘cold’ based on the degree of T cell infiltration and expression of ICs on T cell subsets.33 34 We found that patients with high ppCD8sig score exhibited lower mRNA levels of CTLA4, PDCD1 (PD-1), HAVCR2 (TIM-3), TNFRSF9 (4-1BB), in addition to IFNG (IFN-γ), compared with patients with low ppCD8sig score (figure 6C).
Densities of T cell infiltration, Immunoscores and classification of hot and cold tumors in patients with high and low ppCD8sig scores. Representative flow cytometric plots showing the percentage of CD3+ and CD3+CD8+ TILs from a patient with CRC with low ppCD8sig score (patient #4) and a patient with high ppCD8sig score (patient #15) (A). t-SNE plots representing the density of CD3+ and CD3+CD8+ TILs from nine patients with CRC with low ppCD8sig or nine patients with high ppCD8 score (B). Scatter plots for the percentage of CD3+ and CD3+CD8+ TILs from patients with CRC with low ppCD8sig and high ppCD8sig scores. Each dot represents an individual patient; mean±standard error of the mean (SEM) are shown (B). Heatmap representing the fold change in gene expression as Z-scores, and scatter plot representing gene expression as log10 TPM to compare the expression of immune checkpoint genes and IFNG in CD8+ TILs from patients with high versus low ppCD8sig scores (C). Representative images of immunohistochemical staining for CD3+ and CD8+ T cells in the center of tumor (CT) and invasive margin (IM) from a patient with low ppCD8sig score (patient #9) and a patient with high ppCD8sig score (patient #11) (D). The percentages of TILs, Immunoscore (IS) categorization, and tumor classification as ‘hot’ or ‘cold’ for patients with low ppCD8sig score (E) and patients with high ppCD8sig score (F). CRC, colorectal cancer; TILs, tumor-infiltrating lymphocytes; TPM, transcripts per million.
Using immunohistochemistry, we determined the category of IS for patients with low and high ppCD8sig score (figure 6D), as described in the Materials and Methods. We found that six out of nine patients with low ppCD8sig score showed high IS (figure 6E, shown in green), while only three out of nine patients with high ppCD8sig score showed high IS (figure 6F, shown in green). For flow cytometric analyses, we calculated the median of the percentage of CD3+ TILs and CD3+CD8+ TILs in all 18 patients with low and high ppCD8sig scores. For both patient groups, percentages above the median are indicated in green, and below the median are indicated in red (figure 6E,F). We found that six out of nine patients with low ppCD8sig score showed a high degree of CD3+ TILs, while six out of nine patients had a high degree of CD3+CD8+ TILs (% above the median as indicated in green, figure 6E). All patients with low ppCD8sig score exhibited ‘hot’ tumor based on the mRNA expression pattern of ICs and IFN-γ (figure 6E). On the other hand, seven out of nine patients with high ppCD8sig score showed a low degree of CD3+ TILs, while six out of nine patients had a low degree of CD3+CD8+ TILs (% below the median as indicated in red, figure 6F). Eight out of nine patients with high ppCD8sig score exhibited ‘cold’ tumors (figure 6F). It is worth noting that density of TILs determined by flow cytometry did not fully match the IS results (figure 6E,F), as immunoscoring was performed on tissue specimens containing a large amount of both tumor and normal tissue, with extensive representation of IM, taking into account the density of intratumoral and peritumoral CD3+ and CD8+ T cells. However, flow cytometric analyses were performed on cells isolated from tumor tissues only, and therefore quantify the density of intratumoral T cells.
Collectively, these data suggest that patients with high ppCD8sig score had low levels of CD3+ and CD3+CD8+ TILs, low IS and tumors, which could be classified as ‘cold’ tumors. In contrast, low ppCD8sig score had higher levels of CD3+ and CD3+CD8+ TILs, high IS and tumors, which could be classified as ‘hot’ tumors. These data further confirm the prognostic value of the identified gene signature and potentially highlight its clinical relevance.
Discussion
Although the prognostic impact of CD8+ TILs has been reported in many cancers, these cells vulnerable to the loss of proliferative capacity and antitumor effector functions. Moreover, functional and molecular characteristics of CD8+ TILs could vary with CRC stages, and may present within TME with impaired cytotoxic functions and/or exhausted phenotypes. In this study, we performed RNA-Seq data analyses on sorted CD8+ TILs from treatment-naïve CRC patients with stages from I to IV to identify and characterize genes that are differentially expressed in CD8+ TILs.
Lipid metabolism is one key biological mechanism, which can control the activation and phenotype of immune cells or alter/reprogram their functions.37 38 Here, genes related to cholesterol biosynthesis were downregulated in CD8+ TILs from patients with CRC with advanced stages; this could diminish CD8+ T cell activation and impair their ability to release cytolytic molecules such as granzymes.39 40 We found that genes associated with T cell activation/chemotaxis, cytolysis, adaptive immune response, cytokine secretion and IFN-γ signaling were downregulated in CD8+ TILs from patients with advanced stages. These data suggest that CD8+ TILs from advanced disease stages may have reduced T cell chemotaxis/migration into tumor sites, impaired activation and limited antitumor responses.
Epigenetics plays a pivotal role in the development and progression of cancer, and may also influence immune cell functions.41 In light of this, the differences in gene expression patterns we observed in advanced stages may be attributed to epigenetic modifications acquired during disease progression.42 43 We found that genes related to epigenetic modulations, such as chromatin silencing, histone H3K27 trimethylation and gene silencing by RNA, were upregulated in CD8+ TILs from advanced stages, suggesting their potential associations with transcriptional repression of genes involved in antitumor activities, drug resistance and DNA damage repair.44 We also found that genes associated with positive regulation of STAT5 phosphorylation (eg, IL2), a mean of assessing T cell proliferation,45 were upregulated in CD8+ TILs from advanced stages. Furthermore, Wnt signaling- and β-catenin/TCF complex-associated genes were among the significantly upregulated genes in CD8+ TILs from patients with advanced stages, implying that cytotoxic functions of CD8+ effector T cells, such as release of IFN-γ and granzymes could be compromised by Wnt/β-catenin signaling.46 47
Hypoxia is one of the characteristic features of the TME, which can negatively influence the cytotoxic activity of CD8+ T cells, and result in tumor aggressiveness and resistance to therapy.48 49 We found that genes related to cellular response to hypoxia were upregulated in CD8+ TILs from advanced stages, which potentially can lead to T cell apoptosis, increased secretion of suppressive cytokine IL-10 and limit T cell proliferative capacity.50
Cell proliferation is considered as one of the key determinant factors for lymphocyte activation.51 Moreover, increased cell proliferation is a hallmark feature for T cell exhaustion (Tex), which is characterized by the overexpression of inhibitory receptors, along with Tex transcription factors.52 53 IL2 encoding IL-2, an essential growth factor for T cell proliferation and effector T cell differentiation,54 was upregulated in advanced stages, whereas genes such as IFNG and genes related to cell proliferation were downregulated. This discrepancy could be explained by evidence suggesting that CD8+ T cells that produce IL-2 are refractory to STAT5-mediated proliferation and differentiation pathways,55 while another one indicating that both IL-2 and IFN-γ are required for optimal clonal expansion of CD8+ T effector cells following TCR stimulation.54 Furthermore, TOX3, T cell exhaustion marker56; FOXP3, master transcription factor for Treg differentiation57; and CCR6, chemokine receptor associated with Treg chemotaxis to tumor tissues,58 were upregulated in advanced stages, suggesting that cytotoxic T cell dysfunction in patients with CRC with advanced stages could be associated with T cell exhaustion and CD8+ Treg differentiation. On the other hand, activation marker PDCD1 26 59; inflammatory cytokines IL17A, IL7F and IL22 60, TCR stimulation-related gene HLA-DRA 61 62; and inducers of programmed cell death and CD8+ T cell-mediated apoptosis FASLG and TNFRSF9,63 64 were downregulated in advanced disease stages, suggesting that CD8+ TILs in advanced stages could be dysfunctional and may lack the capacity of inducing antitumor activities. Together, these data potentially implicate that CD8+ TILs in advanced stages have not only impaired activation and effector functions, but also limited capacity of cell proliferation and differentiation to memory T cells. Moreover, the downregulation of PDCD1 gene (which encodes PD-1; IC) in CD8+ TILs from advanced stages is parallel with our recent findings in bulk tumors from patients with CRC with advanced stages,26 implicating that anti-PD-1/PD-L1 therapies may not be effective in patients with CRC with advanced stages.
Reports have shown that tumor growth and poor prognosis in cancer patients are associated with reduced CD8+ T cell activation and impairment of cell proliferation.42 65 Based on TCGA analysis, we identified and calculated scores for the ‘ppCD8sig’, and found that patients with high ppCD8sig score were more likely to have residual disease after primary therapy, poorer DSS and shorter PFI, indicating the potential impact of the ppCD8sig on response to therapy and its prognostic significance. We found that cell cycle/cell division/cell proliferation/mitosis-related genes were downregulated in high ppCD8sig score, potentially implicating that high ppCD8sig is associated with cell cycle arrest and limited proliferative capacity of CD8+ TILs leading to poorer survival and worsened disease outcomes in patients with CRC with advanced stages. Flow cytometric and immunostaining data assessing T cell infiltration in tumor tissues of patients with high and low ppCD8sig scores, and transcriptomic data classifying patients with ‘hot’ or ‘cold’ tumors provided insights into the immune responses within the colorectal TME. We found that patients with high ppCD8sig score have less CD3+ and CD3+CD8+ T cell infiltration, compared with those with low ppCD8sig score. In addition, patients with high ppCD8sig score were found to have ‘cold’ tumors, while patients with low ppCD8sig score had ‘hot’ tumors. These findings suggest that the lower the ppCD8sig score, the higher T cell infiltration. Moreover, patients with low ppCD8sig score seem to exhibit ‘hot’ tumors, potentially reflecting the level of tumor immunogenicity and host sensitivity to immunotherapy. In light of this finding, it has been reported that patients with hot tumors can show promising responses to immunotherapies, as they have higher expression of ICs, unlike those patients with cold tumors.66 67 Therefore, the gene signature we identified in this study could be beneficial in distinguishing responders from non-responders to immunotherapy, and have the potential for improving the precision of personalized In conclusion, transcriptommedicine.
The RNA-Seq approach used in this study was performed to compare the transcriptomic profiling of CD8+ TILs between CRC advanced and early stages and to gain insights into the in vivo function of CD8+ T cells within the TME. RNA-Seq approach could be also applicable to other research investigations aiming to identify gene signatures associated with particular tumor molecular subtypes, for instance, CRC tumors with MSI and CRC tumors with MSS. Moreover, RNA-Seq approach could be useful in monitoring the immune response within the TME prior to or post immunotherapy by comparing the transcriptomes of bulk tumors or sorted tumor-infiltrating immune cells before and after the application of therapy. Potential outputs from such investigations could be helpful in stratifying patient treatment strategy, predicting the clinical response of patients to a particular treatment and identifying the molecular pathways altered in response to particular therapy.68 69 However, one of the limitations for using RNA-Seq approach is the inability to confirm their functional interactions in situ. Additionally, other approaches including multiplex immunohistochemistry, flow cytometry and Cytometry by Time-of-Flight platforms70 can complement RNA-Seq data, and provide protein expression data for multiple immune cell and tumor cell markers, which will give better insights into the immune profile of tumor and potentially reflect the interactions between immune and tumor cells within the TME.
In conclusion, transcriptomic profiling of sorted CD8+ TILs from patients with CRC and comparative analyses between advanced and early stages revealed biological mechanisms and molecular signaling pathways altered during disease progression. The identified ppCD8sig could be considered as a predictor of disease activity, which reflects the impact on tumor progression and survival rates in patients.
Acknowledgments
We would like to thank the Genomics Core for performing RNA-Seq and patients for donating their samples. We thank Ziyad Abusara, Imaging Core manager, for his help with imaging. We are also grateful to Roslyn Kemp, from University of Otago, New Zealand, for assistance with Immunoscore.
References
Footnotes
Contributors RS performed experimental work, data analyses and wrote the manuscript. VSN performed experimental work, data analyses and revised the manuscript. SMT and RZT assisted in experimental work and data analyses. KM helped in studying patients’ samples and provided the clinicopathological data and validated the selection of center of tumor and invasive margin for QuPath analysis. MA-D and MK contributed to sample collection and analyzing the clinical data. MAP helped in performing immunohistochemistry for Immunoscore acquisition. MAN contributed to sample collection. FA-E revised bioinformatics, performed data analysis and reviewed the manuscript. EE conceived the idea, designed the study, supervised the project, analyzed and interpreted data and wrote and revised the manuscript. All authors were involved in the final approval of the manuscript.
Funding This work was supported by a start-up grant (VR04) for EE from Qatar Biomedical research Institute, Qatar Foundation.
Competing interests None declared.
Patient consent for publication Obtained.
Ethics approval This study was executed under ethical approvals from Hamad Medical Corporation, Doha, Qatar (protocol no. MRC-02-18-012) and Qatar Biomedical Research Institute, Doha, Qatar (protocol no. 2017–006).
Provenance and peer review Not commissioned; externally peer reviewed.
Data availability statement All data generated or analyzed in this study are available upon reasonable request.