Article Text

Abstract
Purpose Given the unmet need for novel immunotherapy in soft tissue sarcoma (STS), we sought to characterize the phenotype and function of intratumoral natural killer (NK) and T cells to identify novel strategies to augment tumor-infiltrating lymphocyte (TIL) function.
Experimental design Using prospectively collected specimens from dogs and humans with sarcomas, archived specimens, and The Cancer Genome Atlas (TCGA) data, we evaluated blood and tumor NK and T cell phenotype and function and correlated those with outcome. We then assessed the effects of interleukin 15 (IL-15) stimulation on both NK and T cell activation and TIGIT upregulation. Finally, we evaluated cytotoxic effects of IL-15 combined with TIGIT blockade using a novel anti-TIGIT antibody.
Results TILs were strongly associated with survival outcome in both archived tissue and TCGA, but higher TIL content was also associated with higher TIGIT expression. Compared with blood, intratumoral NK and T cells showed significantly higher expression of both activation and exhaustion markers, in particular TIGIT. Ex vivo stimulation of blood and tumor NK and T cells from patients with STS with IL-15 further increased both activation and exhaustion markers, including TIGIT. Dogs with metastatic osteosarcoma receiving inhaled IL-15 also exhibited upregulation of activation markers and TIGIT. Ex vivo, combined IL-15 and TIGIT blockade using STS blood and tumor specimens significantly increased cytotoxicity against STS targets.
Conclusion Intratumoral NK and T cells are prognostic in STS, but their activation is marked by significant upregulation of TIGIT. Our data suggest that combined IL-15 and TIGIT blockade may be a promising clinical strategy in STS.
- immunity
- innate
- immunotherapy
- killer cells
- natural
- combined modality therapy
- cytokines
This is an open access article distributed in accordance with the Creative Commons Attribution Non Commercial (CC BY-NC 4.0) license, which permits others to distribute, remix, adapt, build upon this work non-commercially, and license their derivative works on different terms, provided the original work is properly cited, appropriate credit is given, any changes made indicated, and the use is non-commercial. See http://creativecommons.org/licenses/by-nc/4.0/.
Statistics from Altmetric.com
Background
Immunotherapy, using checkpoint blockade against programmed cell death protein 1 (PD-1), programmed death-ligand 1 (PD-L1), and cytotoxic T lymphocyte-associated antigen 4 (CTLA-4), as well as adoptive transfer of chimeric antigen receptor T cells, has been a clear paradigm shift in the treatment of patients with cancer, especially those with disseminated disease. In cancers where the impact of new therapies was previously measured in days or weeks,1 2 survival benefits are now measured in months or years, and the potential for long-term ‘cures’ has become a reality.3 4 Soft tissue sarcomas (STSs) represent a histologically diverse family of tumors for which the benefits of immunotherapy have been incremental.5–8 For example, the SARC028 Trial, one of the largest clinical trials evaluating the efficacy of checkpoint therapy for metastatic or unresectable soft tissue and bone sarcomas,5 identified an objective response rate of 18% in patients with STS, with the most promising results observed in patients with undifferentiated pleomorphic sarcoma and dedifferentiated liposarcoma. As a result, checkpoint blockade therapy remains unapproved for patients with STS, and the search for successful immunotherapy regimens remains a significant unmet need.
Although the majority of cancer immunotherapy currently focus on augmenting the antitumor functions of T cells, other arms of the immune system are capable of mounting cytotoxic responses against cancer. Natural killer (NK) cells, for example, are innate cytotoxic lymphocytes with potent cytotoxic capabilities against virally infected and malignantly transformed cells.9 NK cells are unique in their ability to target cells in the absence of prior sensitization or major histocompatibility complex (MHC) restriction.10 Because of these properties, NK cells are an attractive modality for cancer therapy since they can respond to diverse stimuli.11 In addition, NK cells have shown evidence of activity against STS in both preclinical models12–14 and clinical trials.15 Despite some early success, however, the results of adoptive NK therapy in the treatment of solid tumors, including sarcomas, have been largely disappointing,16 and dysfunction/diminished cytotoxicity in a pattern similar to T cell exhaustion has emerged as a barrier to successful translation of NK immunotherapy. This has led to active research efforts to characterize and reverse NK exhaustion.17–19
Another crucial concept that has emerged in the search to overcome resistance to both NK and T cell-based immunotherapy for solid tumors is the immunosuppressive tumor microenvironment (TME). Although multiple factors contribute to the immunosuppressive TME,20 these factors tend to converge on either the exclusion of cytotoxic cell populations or the induction of a dysfunctional and exhausted phenotype. Reversing the inhibitory effects of PD-1 on T cells has proven successful, but in patients who do not respond to PD-1/PD-L1 blockade, combination therapy and/or targeting of other immune checkpoints appears essential. Dual checkpoint blockade has been investigated in STS, with moderately improved results,6 but additional strategies are also needed. For example, immunostimulatory cytokines have been used to augment the function of circulating NK cells, T cells, and tumor-infiltrating lymphocytes (TILs) with evidence of clinical activity (recently reviewed in the study by Dwyer et al 21). However, cytokine immunotherapy approaches have been hampered by toxicity, especially when given intravenously, as well as the compensatory induction of inhibitory molecules and cell types (eg, regulatory T cells by IL-2), which limit the antitumor effects of stimulatory cytokines, thereby inducing NK and T cell dysfunction that in many ways resembles exhaustion.22 23
We and others have shown that T-cell immunoreceptor with immunoglobulin (Ig) and immunoreceptor tyrosine-based inhibitory motif domains (TIGIT) is a critical marker of NK and T cell exhaustion, which limits antitumor responses in multiple species.18 24 25 Given the need to identify novel immunotherapy strategies in STS, we sought to evaluate the phenotype and function of tumor-infiltrating NK and T cells in STS, including the expression of TIGIT, and to determine if STS TILs can be further activated by combination approaches using IL-15 and TIGIT blockade. We hypothesized that combination strategies would significantly augment anti-sarcoma effects in highly relevant human and dog translational models.
Methods
Preparation of human peripheral blood mononuclear cells
The collection of matched whole blood and tumor specimens was approved by the IRB at the University of California, Davis (Protocol # 2 18 204-9). Human peripheral blood mononuclear cells (PBMCs) were isolated from whole blood using a density gradient centrifugation (Lymphocyte Separation Medium, Corning Life Sciences), followed by red blood cell lysis, as described previously.24
Preparation of human STS tumors
Tumor tissue from patients undergoing STS resection was collected in sterile RPMI-1640 (Invitrogen Life Technologies), diluted with phosphate-buffered saline (PBS) and passed through a 70 µm filter, and then subjected to red blood cell lysis. Cells were either plated for in vitro assays or analyzed by flow cytometry as described below.
Flow cytometry
Human cells were washed with PBS and staining buffer, and then incubated with Human TruStain Fc receptor blocking solution (BioLegend, #422302) for 15 min. Cells were stained with the following fluorochrome-conjugated monoclonal antibodies: CD3-FITC (clone HIT3a, BioLegend), CD56-PE (clone HCD56, BioLegend), CD8-BV785 (clone RPA-T8, BioLegend), CD45-BV510 (clone HI30, BioLegend), PD-1-APC (clone EH12.2H7, BioLegend), TIGIT-BV421 (clone A15153G, BioLegend), CD69-BV711 (clone FN50, BioLegend), Ki-67-PE/Cy7 (clone 20Raj1, eBioscience), granzyme B-PE/TR (clone GB12, Invitrogen). Live/dead staining was performed using Fixable Viability Dye 780 (eBioscience #65-0865-14).
Canine cells were washed with PBS and staining buffer, incubated with Fc receptor blocking solution (Canine Fc Receptor Binding Inhibitor, Invitrogen #14-9162-42), and stained with the following fluorochrome-conjugated monoclonal antibodies: CD45-EF450 (clone YKIX716.13, Invitrogen #48-5450-42), CD3-FITC (clone CA17.2A12, BioRad #MCA1774F), NKp46-PE (clone 48A, kind gift of Dr Dean Lee), CD8-APC (clone YCATE55.9, Invitrogen #17-5080-42), granzyme B-PE/TR (clone GB11, Invitrogen #GRB17). Live/dead staining was performed using Fixable Viability Dye 780. All flow cytometry results were acquired using a BD LSRFortessa flow cytometer (Becton Dickinson, San Jose, California, USA) and analyzed using FlowJo Software (Beckton Dickinson, San Jose, California, USA).
Immunohistochemistry
Tissue microarrays were constructed as described previously.26 Immunohistochemical (IHC) staining was performed using mouse anti-human CD3 (Abcam, clone SP7), mouse anti-human CD8 (Dako, clone C8/144B), rabbit anti-human TIGIT (Abcam, clone BLR047F), and mouse anti-human CD56 (Dako, clone 123C3). TIL and IHC expression scores were determined by a blinded pathologist (MAD). TIL scores were calculated on H&E-stained slides as follows: 3 (>20 TIL/high-power field (hpf)), 2 (11–20 TIL/hpf), 1 (1–10 TIL/hpf), 0 (<1 TIL/hpf). IHC expression for CD3, CD8, CD56, and TIGIT was calculated as follows to derive an H-score: [1x (% 1+cells)+2x(% 2+cells)+3x(% 3+cells)] where 1+, 2+, and 3+ represent weak, moderate, and strong stain intensity, respectively. Final TIL and IHC expression scores were averaged when more than one consecutive section was present for scoring. PD-L1 staining of tumor samples was performed using a CLIA-certified laboratory.
Ex vivo stimulation with IL-15
After processing, human PBMCs and TILs were cultured at 37°C at 5% CO2 in RPMI media (Invitrogen Life Technologies) supplemented with 10% Nu-Serum (Corning Life Sciences), 2 mM L-glutamine (Glutamax, Gibco), 1% non-essential amino acids (Gibco), 5×10⁻⁵M β-mercaptoethanol (MP Biomedicals), 1 mM Hepes buffer (Corning Life Sciences), 1 mM sodium pyruvate (Gibco), and 1% penicillin/streptomycin (Corning Life Sciences). Recombinant human IL-15 was obtained from the National Cancer Institute, Biological Resources Branch (Frederick, Maryland, USA).
Ex vivo stimulation with TIGIT blockade
We precoated 96-well round-bottom plates with either anti-TIGIT monoclonal antibody (BMS-986207) or IgG control (both at 10 µg/mL in PBS) for 24 hours at 4°C. Plates were then washed once with PBS. PBMCs or TILs were plated in 200 µL media supplemented with anti-TIGIT or IgG at 10 µg/mL and with IL-15 at 1 ng/mL or 10 ng/mL. Half-volume media changes were performed every 3 days where indicated.
Cytotoxicity assays
Human sarcoma cell lines A673 (#CRL-1598, Ewing’s sarcoma) and SK-LMS (#HTB-88, leiomyosarcoma) were obtained from ATCC (Manassas, Virginia, USA) and cultured in Dulbecco’s Modified Eagle’s Medium (DMEM) supplemented with 10% Nu-Serum and 1% penicillin-streptomycin. Cells were passaged every 3–5 days or sooner as needed. Adherent cells were removed using Tryp-LE (Thermo Fisher #12604021). Where indicated, cell lines were added to preincubated PBMCs or TILs at the indicated effector-to-target ratios in a 1:1 mixture of RPMI complete media to DMEM. Cytotoxicity was assessed by labeling target cells with CFSE (Invitrogen #C34554) for 5 min at room temperature. After 4 hours of effector/target contact, cells were stained with Fixable Viability Dye 780 and analyzed by flow cytometry for CFSE+FVD780+ proportion. For phenotypic analysis, PBMCs were preincubated with IL-15 as indicated and then exposed to target cells. On addition of target cells, 2.5 µL of CD107A-BV605 or CD107A-BV421 (clone H4A3, BioLegend) was added. After 60 min, Golgi Plug (brefeldin A) and Golgi Stop (monensin) were added per manufacturer’s instructions (BD Biosciences). Cells were incubated for another 3–5 hours then analyzed by flow cytometry.
Analysis of canine PBMCs
Canine whole blood was collected from dogs with naturally occurring metastatic osteosarcoma receiving inhaled IL-15 as part of a clinical trial (IACUC #20179). PBMCs were isolated from whole blood using density gradient centrifugation (Lymphocyte Separation Medium, Corning Life Sciences), followed by red blood cell lysis as described previously.27
RNA sequencing of canine NK cells
Canine NK cells were isolated from canine PBMCs by CD5 depletion using the Easy Sep PE Positive Selection Kit (Stem Cell Technologies, Vancouver, BC, Canada) and PE-conjugated anti-canine CD5 (Invitrogen, clone YKIX322.3) as described previously.27 RNA was isolated using RNeasy Mini kits (Qiagen). Gene expression profiling was carried out using a 3′-Tag-RNA-Seq protocol. Up to 48 libraries were sequenced per lane on a HiSeq 4000 sequencer (Illumina, San Diego, California, USA) with single-end 100 bp reads. Raw fastq files underwent preprocessing using snakemake.28 Samples were trimmed and non-rRNA selected. Reads were then indexed to the reference transcriptome for canines (CanFam3.1).29 Count files generated by salmon were then read into R using the tximport package. Differential gene expression analysis was done using the DESeq2 package for R. The Benjamini-Hochberg procedure was used to control false discovery rate.
The Cancer Genome Atlas
Clinicodemographic and RNA expression data were retrieved from the The Cancer Genome Atlas (TCGA)-SARC dataset using the UCSC Xena platform (retrieved February 12, 2020).30 High and low expression groups were determined using upper and lower quartiles where indicated. Correlations were compared using Spearman correlation. Survival differences were evaluated using Kaplan-Meier analysis with a log-rank test. We also performed multivariable analysis of the TCGA dataset. For each of NK, CD8, and CD155 variables (all considered as continuous), we fit both univariable and multivariable Cox models adjusting for age, tumor size, histology, and sex. Schoenfeld residuals were examined to ensure that proportional hazard assumption held. Assumption of linearity of CD8, NK, and CD155 was examined by visually checking martingale residuals and no obvious non-linearity pattern was observed. Due to high proportion of missing tumor size (34%), we further conducted a sensitivity analysis using multiple imputation for missing tumor size (with 35 imputed datasets) under missing-at-random assumption.31
Statistical analysis
We used Excel (Microsoft), Prism software (GraphPad Software), and R V.3.6.1 (R Foundation for Statistical Computing, Vienna, Austria) for graph generation and statistical analysis. Data are expressed as mean±SEM. Where appropriate, normality of distribution was confirmed using Shapiro-Wilk normality test. Differences between two groups were analyzed using the paired or unpaired Student’s t-test as appropriate for parametric data and the Mann-Whitney test or Wilcoxon signed-rank test for non-parametric data. For analysis of three or more groups, one-way analysis of variance tests was performed with Tukey’s or Dunnett’s post-test as appropriate. p≤0.05 was considered statistically significant unless an adjusted p value was indicated. Correlations between two values were performed using Spearman correlation test. Kaplan-Meier curves and log-rank test were used to compare survival outcomes between subgroups. Univariate and multivariate survival analyses were performed by Cox proportional hazards models with distant recurrence time as outcomes. Schoenfeld residuals were examined to ensure that proportional hazard assumption was satisfied. Initial multivariable models included the four primary covariates (mean CD3, mean CD8, mean TIL, and mean TIGIT score) and other covariates with p value <0.25 in univariate analyses, and backward selection was conducted to keep only variables with p value <0.1 in final multivariable models.
Results
Variable TIGIT and PD-1 expression in circulating NK and T cells with prognostic role of lymphopenia
Prior reports indicate a prognostic role for the frequency and phenotype of circulating lymphocytes in patients with cancer at diagnosis and among those receiving checkpoint blockade.32 33 Therefore, we set out to determine the phenotype and function of circulating lymphocytes in the PBMCs of a prospective STS cohort (n=21). Figure 1A depicts the clinicopathologic characteristics and treatment outcomes of these patients. All patients had locally advanced tumors, although two patients (one well-differentiated liposarcoma and one myxoid liposarcoma) demonstrated low grade histology on final pathology despite cross-sectional imaging suggesting more aggressive disease. These two patients were excluded from further analysis. Our flow cytometry gating strategy is shown in figure 1B. NK cells were identified by CD56+CD3− expression, T cells by CD56−CD3+ expression, and NKT by CD56+CD3+ expression. CD3+ T cells were further classified by CD8+ expression (figure 1B). Although absolute lymphocyte count (ALC) has been shown to be predictive of survival and response to immunotherapy in other cancers,34 35 we did not observe an association in our cohort (figure 1C and D). Overall, we observed variability in baseline ALC and CD3+ T cell counts, while CD8+ T cell counts (0.4±0.2×10³ cells/µL) and NK cells counts in particular (0.2±0.03×10³ cells/µL) were more uniform (figure 1C). Although there was no relationship of ALC, circulating NK cell, or circulating CD8+ T cell absolute counts to STS recurrence, we did observe an association of higher circulating CD3+ T cells to a lower risk of disease recurrence on univariate analysis (1.3±0.3×10³ cells/µL vs 0.6±0.2×10³ cells/µL, p=0.025) (figure 1D).

Circulating NK and T cells in patients with STS. (A) Characteristics of the prospective STS cohort undergoing blood and tumor analysis. (B) Flow cytometry gating for analysis of peripheral blood with NK cells (CD56+CD3−), CD3+ T cells (CD56−CD3+), and CD8+ T cells (CD56−CD3+CD8+). (C) Distribution of absolute lymphocyte counts (ALCs) and lymphocyte subsets in the peripheral blood of all patients, and (D) comparison between patients experiencing no relapse (‘No Rel.’) or relapse (‘Relapse’) during follow-up. Circulating CD3+ T cells are significantly lower in patients experiencing relapse (1.3±0.3×10³ cells/µL vs 0.6±0.2×10³ cells/µL, p=0.025). Representative TIGIT and PD-1 flow cytometry and distribution of expression on (E, H) NK cells, (F, I) CD3+ T cells, and (G, J) CD8+ T cells. Mean±SEM. P values determined using the Mann-Whitney test. NK, natural killer; PD-1, programmed death 1; STS, soft tissue sarcoma.
Given the prognostic value of immune exhaustion markers like PD-1 and TIGIT from tumor-infiltrating cells,36 37 we then assessed circulating lymphocyte populations for expression of these markers since peripheral blood samples are more readily available and less heterogeneous than tumor samples. Representative staining for PD-1 and TIGIT on circulating NK and T cells is depicted in figure 1E–G. Overall, we observed notable variability in the expression of TIGIT on circulating NK (39%±3%) (figure 1H), CD3+ (25%±3%) (figure 1I), and CD8+ (34%±6%) (figure 1J) cells, while PD-1 expression was variable only on CD3+ (29%±3%) (figure 1I) and CD8+ (25%±4%) (figure 1J) T cells. NK expression of PD-1 was consistently low (1.6%±0.5%) (figure 1H), consistent with prior reports.24 38 39 These results highlight the heterogeneity of lymphocyte frequency and exhaustion marker expression in the circulation of patients with STS.
TILs are associated with superior outcome in STS
Given the limited prognostic information provided by circulating cytotoxic lymphocyte populations, we next evaluated archived STS tissue for TILs, CD3+ T cells, CD8+ T cells, NK cells, and TIGIT, using a retrospective cohort of patients with STS with annotated data available (figure 2A). Although other studies have used IHC staining of CD56 to identify NK cells,40 in our hands, the results appeared to be unreliable with wide variability in intensity of the staining (online supplemental figure 1A,B) likely due to overlap of CD56 expression with other cell types (eg, neuroendocrine cells) and the standard definition of human NK cells as being both CD3− and CD56+. Therefore, we focused our analysis on TILs using conventional H&E as well as CD3+ and CD8+ staining.
Supplemental material

Tumor-infiltrating T cells are associated with distant progression in soft tissue sarcoma. (A) Characteristics of the retrospectively analyzed cohort. (B) Representative H&E photomicrographs of TIL scores. (C) Distribution of mean TIL scores for the cohort. (D) Representative immunohistochemical photomicrographs of high and low staining for CD3, CD8, and TIGIT. (E) Distribution of mean expression scores (H-score) for CD3, CD8, and TIGIT for the cohort. Kaplan-Meier curves of distant recurrence-free survival (DRFS) stratified by (F) TIL score, (G) CD3 score, and (H) CD8 score. (I) Strong positive correlation between CD3 expression and TIL score. (J) Absence of association between DRFs and TIGIT score by Kaplan-Meier analysis. (K) Strong positive correlation between TIGIT expression and TIL score. Significance of Kaplan-Meier analysis determined by log-rank test. Correlations determined by two-tailed Spearman coefficient. TIL, tumor-infiltrating lymphocyte.
As shown in figure 2A, we retrospectively identified 45 patients with STS with complete clinical and pathological data. Median tumor size for this cohort was 12.3 cm, and 87% of tumors were high grade, also consistent with a high-risk cohort. With a median follow-up of 48 months, 22 patients (49%) developed metastases with 16 deaths (36%) due to sarcoma. As shown in figure 2B and C, the majority of patients with STS had low TIL infiltration by IHC (median=0) with only four patients (11%) showing TIL scores >1. We then examined CD3, CD8, and TIGIT expression by IHC as shown by representative photomicrographs in figure 2D. As with TIL scores, the majority of patients had low expression of these immune markers (figure 2E), with a median H-score for CD3 of 0.6 (range 0–68), for CD8 of 1 (range 0–77), and TIGIT of 0 (range 0–44). We then analyzed distant recurrence-free survival (DRFS) based on TIL score (<1, 1–2, 2–3) and H-score for CD3 and CD8 (using the median to stratify patients into high and low). We observed a significant difference in DRFS between all three TIL categories with DRFS increasing consistently with increasing TIL score (log-rank p=0.016) (figure 2F). We observed similar significant differences in DRFS based on intratumoral expression of CD3 (log-rank p=0.006) (figure 2G) and CD8 (log-rank p=0.0009) (figure 2H). Importantly, we also detected a significant positive correlation between TIL score and CD3 expression score (r=0.64, p<0.0001) (figure 2I) consistent with CD3+ T cells being a major component of TILs. In contrast, we did not observe an association of TIGIT expression by H-score with DRFS (figure 2J). However, we did identify a significant positive correlation between TIL score and TIGIT expression score (r=0.38, p=0.02) (figure 2K), suggesting that efforts to link intratumoral TIGIT expression with outcome are confounded by the presence of TILs since a prerequisite for TIGIT expression is the presence of TILs. Importantly, we confirmed the prognostic association of TILs with DRFS in our IHC cohort on multivariate analysis. CD8 infiltration was associated with improved DRFS (HR=0.76; 95% CI=0.59 to 0.98; p=0.036) after adjustment of other covariates (online supplemental table 1).
Sarcoma-infiltrating NK and T cells show phenotypic evidence of both increased activation and exhaustion, including TIGIT
Since IHC analysis provides limited information on immune phenotype and function, we next proceeded to analyze the impact of tumor-infiltrating NK and T cell phenotype on disease recurrence in our prospective cohort. Tumors were isolated directly from surgical specimens (figure 3A) for multicolor flow cytometry with representative gating for immune populations as shown (figure 3B). Timing of sample collection, histologic subtype, and receipt of additional therapies are detailed in online supplemental table 2. Importantly, no patients were receiving systemic therapies at the time of sample collection. Notably, as shown in figure 3C, we observed marked variability across immune populations, especially CD45+ immune cells (range 2%–65% of total cells present), TILs (range 0.01%–47%), and CD3+ T cells (range 0.002%–40%). Additionally, NK cells (range 0.002%–7%), CD8+ T cells (0.0%–5%), and NKT cells (0.001%–0.4%) were generally in low abundance (figure 3C). Among TIL populations, CD3+ T cells were predominant (52%±5.7%), followed by CD8+ T cells (22%±5.6%), and then NK cells (19%±3.4%) (figure 3D). Not only was there a significant difference in the per cent of NK and CD3+ T cells within the TIL population (with CD3+ T cells outnumbering NK cells, p=0.002, figure 3E) but interestingly there was also a negative correlation with more CD3+ T cells corresponding to fewer NK cells and vice versa (r=−0.52, p=0.03) (figure 3F).
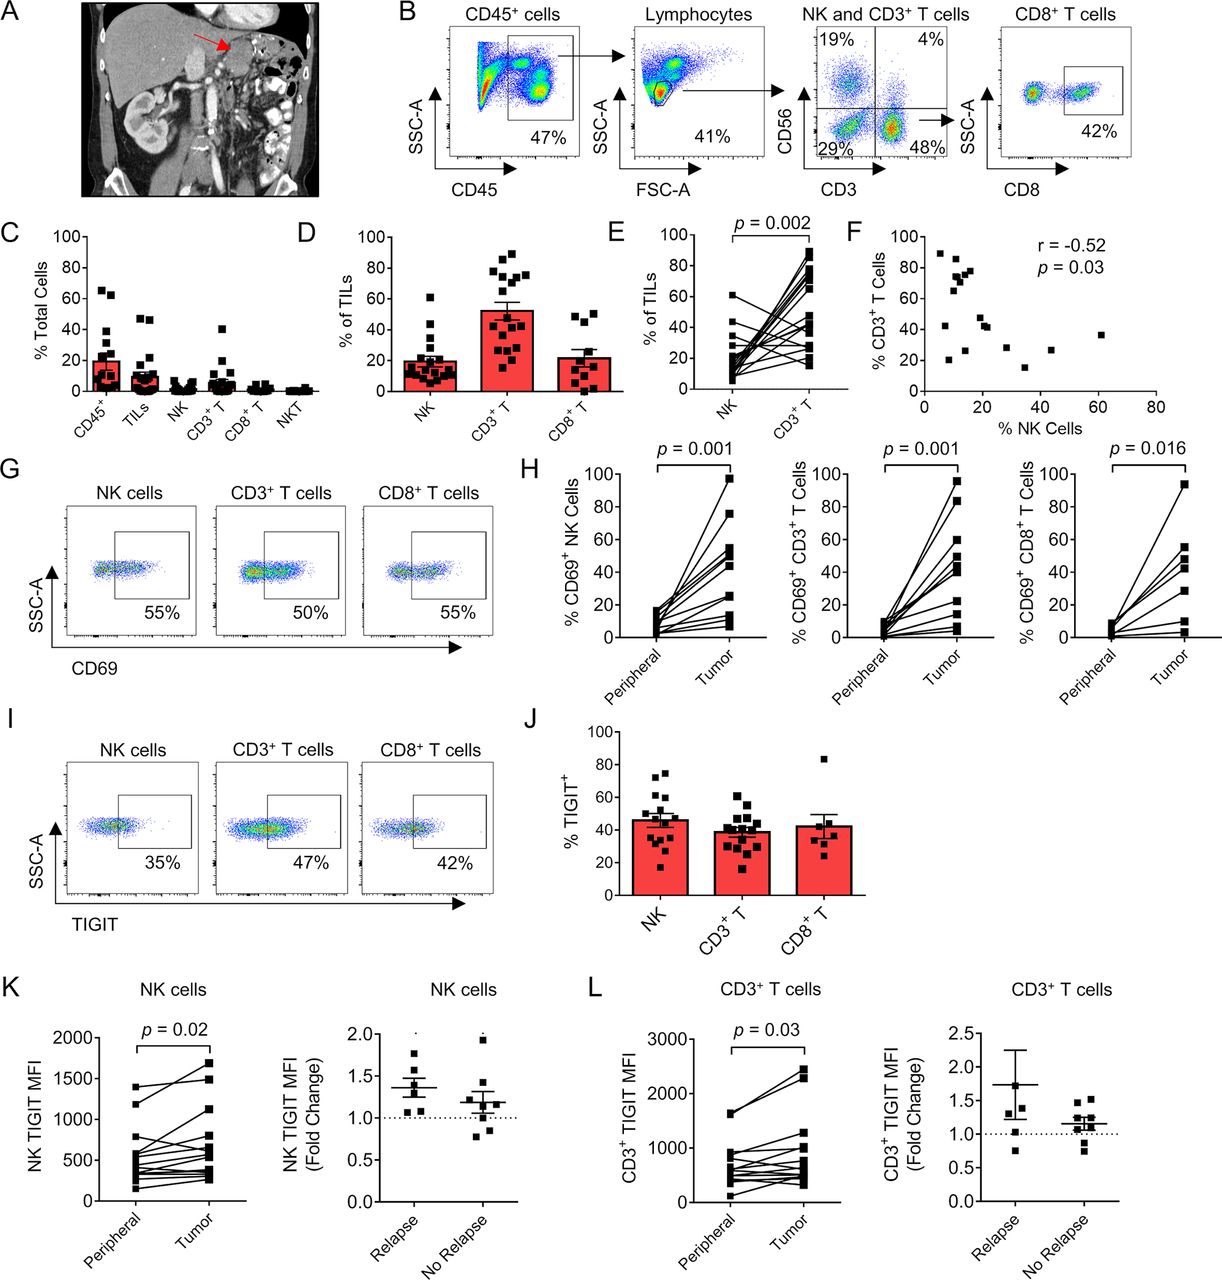
Sarcoma-infiltrating NK and T cells show phenotypic evidence of both increased activation and exhaustion, including TIGIT. (A) Preoperative CT imaging of a retroperitoneal dedifferentiated liposarcoma. (B) Representative flow cytometry gating showing CD45+ cells, lymphocytes, NK, CD3+ T cells, NKT cells, and CD8+ T cells. (C) Composition of the immune infiltrate as a per cent of total cells. (D) Proportion of NK, CD3+ T, and CD8+ T cells as a per cent of the TIL population. (E) Paired analysis per tumor of per cent NK cells and CD3+ T cells with significantly greater T cell infiltration present. (F) Strong negative correlation between per cent NK cells and per cent CD3+ T cells within the TIL population (r=−0.52, p=0.03). (G) Representative flow cytometry gating showing expression of activation marker CD69 in the TIL population. (H) Paired analysis per patient of CD69 expression between the periphery and tumor in NK, CD3+ T, and CD8+ T cells. (I) Representative flow cytometry gating showing expression of TIGIT in the TIL population. (J) Distribution of TIGIT expression in TIL subsets. Paired analysis of TIGIT MFI on peripheral and tumorous (K) NK cells and (L) CD3+ T cells showing overall increased expression within the tumor and fold change in patients with TIGIT MFI who relapsed compared with those who did not. Mean±SEM. P values determined using Wilcoxon test. correlations determined by two-tailed Spearman coefficient. MFI, median fluorescence intensity; NK, natural killer; TIL, tumor-infiltrating lymphocyte.
We then analyzed the expression of the lymphocyte activation marker CD69 (figure 3G). Among all three lymphocyte populations, there was a significant increase in CD69 expression when comparing blood with tumor: NK cells (7.5%±1.2% vs 41%±9%, p=0.001), CD3+ T cells (4.6%±0.9% vs 42%±9%, p=0.001), and CD8+ T cells (4.1%±0.8% vs 40%±12%, p=0.02) (figure 3H). Notably, PD-L1 expression was low or absent for most tumor samples (online supplemental figure 2). In the three patients with PD-L1 expression >30% using the DAKO PD-L1 IHC assay with clone 22C3, one patient presented with a diagnosis of widely metastatic pleomorphic rhabdomyosarcoma but has enjoyed a solid partial response (approximately 50% decrease in size of all nodules) following multiagent chemotherapy. Another patient developed a rapid recurrence of retroperitoneal dedifferentiated liposarcoma after neoadjuvant radiotherapy and surgery. He declined chemotherapy because of quality of life concerns and was initiated on PD-1 blockade with stable disease at first disease response assessment. The third patient was diagnosed with a locally advanced myxofibrosarcoma of the lower extremity. She was treated with preoperative radiotherapy and surgical resection. After 6 months of follow-up, she has no evidence of disease recurrence while under surveillance. Given reports of TME-induced immune exhaustion in solid tumors, we also evaluated expression of TIGIT (figure 3I). Similar to the values in circulating lymphocytes, the expression of TIGIT on intratumoral NK cells, CD3+ T cells, and CD8+ T cells was variable, but TIGIT expression was elevated on a large proportion of cytotoxic lymphocytes: NK cells (46%±4.2%), CD3+ T cells (39%±3.0%), and CD8+ T cells (42%±7.3%) (figure 3J). We also identified a significant increase in median fluorescence intensity (MFI) of TIGIT on intratumoral NK cells compared with peripheral NK cells (677±121 vs 526±85, p=0.02) (figure 3K) and intratumoral CD3+ T cells compared with peripheral CD3+ T cells (914±179 vs 687±106, p=0.03) (figure 3L). Additionally, the increase/fold change in TIGIT expression from peripheral blood to tumor was higher in patients who relapsed than who did not, although these differences were not statistically significant (figure 3K and L). Overall, these data show that STS NK and T cells are both more activated and more exhausted than their circulating counterparts. Moreover, TIGIT upregulation in the TME, especially on NK cells, may be associated with disease recurrence.
CD56dim subset is the predominant NK cell within STSs and expresses higher TIGIT
The differential roles and impact of NK cell subsets based on CD56bright and CD56dim expression have been extensively investigated with regard to NK cell maturation and immune responses.40–42 We analyzed our STS samples to evaluate for differences in CD56 subsets and TIGIT expression, with the hypothesis that TIGIT expression would be highest on the more mature and cytotoxic CD56dim NK subset. As shown in figure 4A, CD56bright and CD56dim subsets are clearly identified in the peripheral blood, while the CD56bright subset appears less prevalent in the TME, though there was no significant difference between the percentage of CD56bright NK cells in the peripheral blood or tumor infiltrate (peripheral blood: 9%±3%; tumor: 8%±1%, p=0.68) (figure 4B). We also evaluated the expression of activation marker CD69 among NK subsets. Within the blood, the CD56dim NK subset expressed higher levels of CD69 compared with CD56bright cells, although overall expression in both subsets was low (7.7%±1.5% vs 3.5%±0.7%, p=0.015). Within tumors, we also observed no difference in activation status between CD56 bright and CD56 dim subsets (37%±9.1% vs 45%±10%, p=0.5) (figure 4C), although expression for both subsets remained higher than the blood. In contrast, both within the periphery and in the tumor, TIGIT expression was significantly higher on CD56dim NK cells than CD56bright NK cells (peripheral: 45%±3.5% vs 17%±2.6%, p<0.0001; tumor: 51%±5.1% vs 28%±6.7%, p=0.01) (figure 4D). Additionally, we observed increased TIGIT on both NK cell subsets within the tumor as measured by MFI, although the results were only significant for the CD56dim NK subset (peripheral 518±88 vs tumor 1452±834, p=0.03) (figure 4E). This may be related to several tumors having no detectable infiltrating CD56bright NK cells, thus limiting paired analysis. Ultimately, these results suggest that the mature, cytotoxic CD56dim NK cell subset predominates within STSs, with corresponding increased expression of inhibitory marker TIGIT. Blocking TIGIT may therefore preferentially unleash the more cytotoxic NK cells for an antitumor effect.

CD56dim subset is the predominate NK cell within soft tissue sarcomas and expresses higher TIGIT. (A) Representative flow cytometry gating showing the CD56bright and CD56dim NK cell populations in the peripheral blood (left) and tumor (right). (B) No difference in proportion of NK cell subsets between the periphery and tumor. (C) Within the peripheral blood, CD56dim NK cells expressed higher levels of activation marker CD69 compared with CD56bright NK cells (p=0.015), which was not evident within the tumor. (D) Within the periphery (p<0.0001) and within the tumor (p=0.01), TIGIT expression was significantly higher on CD56dim NK cells compared with CD56bright NK cells. (E) CD56dim NK cell subset significantly increases TIGIT expression by MFI within the tumor (p=0.03). Mean±SEM. P values determined using paired Student’s t-test or Wilcoxon test. MFI, median fluorescence intensity; NK, natural killer.
Sarcoma-infiltrating NK and T cells are stimulated by IL-15 ex vivo with simultaneous increased upregulation of TIGIT
Given our data showing evidence of both activation and exhaustion of intratumoral STS NK and T cells, we next set out to determine if these TILs could respond to cytokine stimulation. As shown in figure 5A, we isolated TILs from the specimens of patients with STS undergoing surgery (online supplemental figure 3A-B). We then cultured the cells in IL-15 at 10 ng/mL for 72 hours. Representative flow cytometry from one of three patients analyzed shows the pertinent NK and CD8+ T cell populations following IL-15 exposure (figure 5B). Compared with co-culture with media alone, IL-15 exposure lead to statistically significant upregulation of both activation marker CD69 (figure 5C) and proliferation marker Ki67 (figure 5D) on NK cells and CD8+ T cells. IL-15 also increased expression of granzyme B (NK 62%±1.9% vs 87%±0.9%, p=0.0002; CD8+ T 38%±3.9% vs 69%±0.1%, p<0.0001) (figure 5E) and IFNγ (NK 9.7%±0.5% vs 23%±1.2%, p<0.0001) (figure 5F). Simultaneous with this robust IL-15-induced activation, there was also increased expression of TIGIT in both NK and CD8+ T cells (NK 69%±2.5% vs 88%±2.3%, p<0.0001; CD8+ T 84%±3.2% vs 96%±0.7%, p<0.0001; figure 5G) with corresponding significant increases in TIGIT expression as measured by MFI (figure 5H). Appropriate Fluorescence Minus One (FMO) controls for IFN-γ and TIGIT are shown in online supplemental figure 3C. Taken together, these data show that despite the evidence for increased activation and exhaustion marker expression at baseline in STS NK and T cells in the TME, these populations are capable of additional upregulation of activation and proliferation markers after ex vivo exposure to IL-15. This robust activation after IL-15 exposure is accompanied by simultaneous upregulation of TIGIT on both NK and CD8+ T cells, which may limit the therapeutic reach of stimulatory cytokine alone.

Sarcoma tumor-infiltrating NK and T cells can be activated ex vivo by exposure to IL-15 with simultaneous upregulation of inhibitory marker TIGIT. (A) Representative preoperative MRI and gross examination of extremity leiomyosarcoma specimen. (B) Representative flow cytometry gating showing NK, CD3+ T, and CD8+ T cells after culture of STS TILs in vitro for 72 hours with IL-15 at 10 ng/mL. Representative flow cytometry gating of IL-15-activated NK cells and summary data show significant increases in expression of (C) activation marker CD69, (D) proliferation marker Ki67, and (E) cytotoxicity markers granzyme B and (F) IFNg in NK and CD8+ T cells. IL-15-induced activation leads to simultaneous upregulation of inhibitory receptor TIGIT by (G) representative flow cytometry on NK cells and increase in per cent expression on NK and CD8+ T cells. (H) Representative histogram shows upregulation of TIGIT on NK cells and CD8 +T cells following IL-15 exposure with corresponding significant increase in MFI. These experiments were repeated independently in three patients with STS with representative data shown. P value determined using one-way analysis of variance with Tukey’s multiple comparison test using n=3–4 technical replicates per patient. IL, interleukin; MFI, median fluorescence intensity; NK, natural killer; STS, soft tissue sarcoma; TIL, tumor-infiltrating lymphocyte.
Inhaled IL-15 drives peripheral NK and CD8 T cell activation and TIGIT upregulation in dogs with metastatic osteosarcoma on a clinical trial
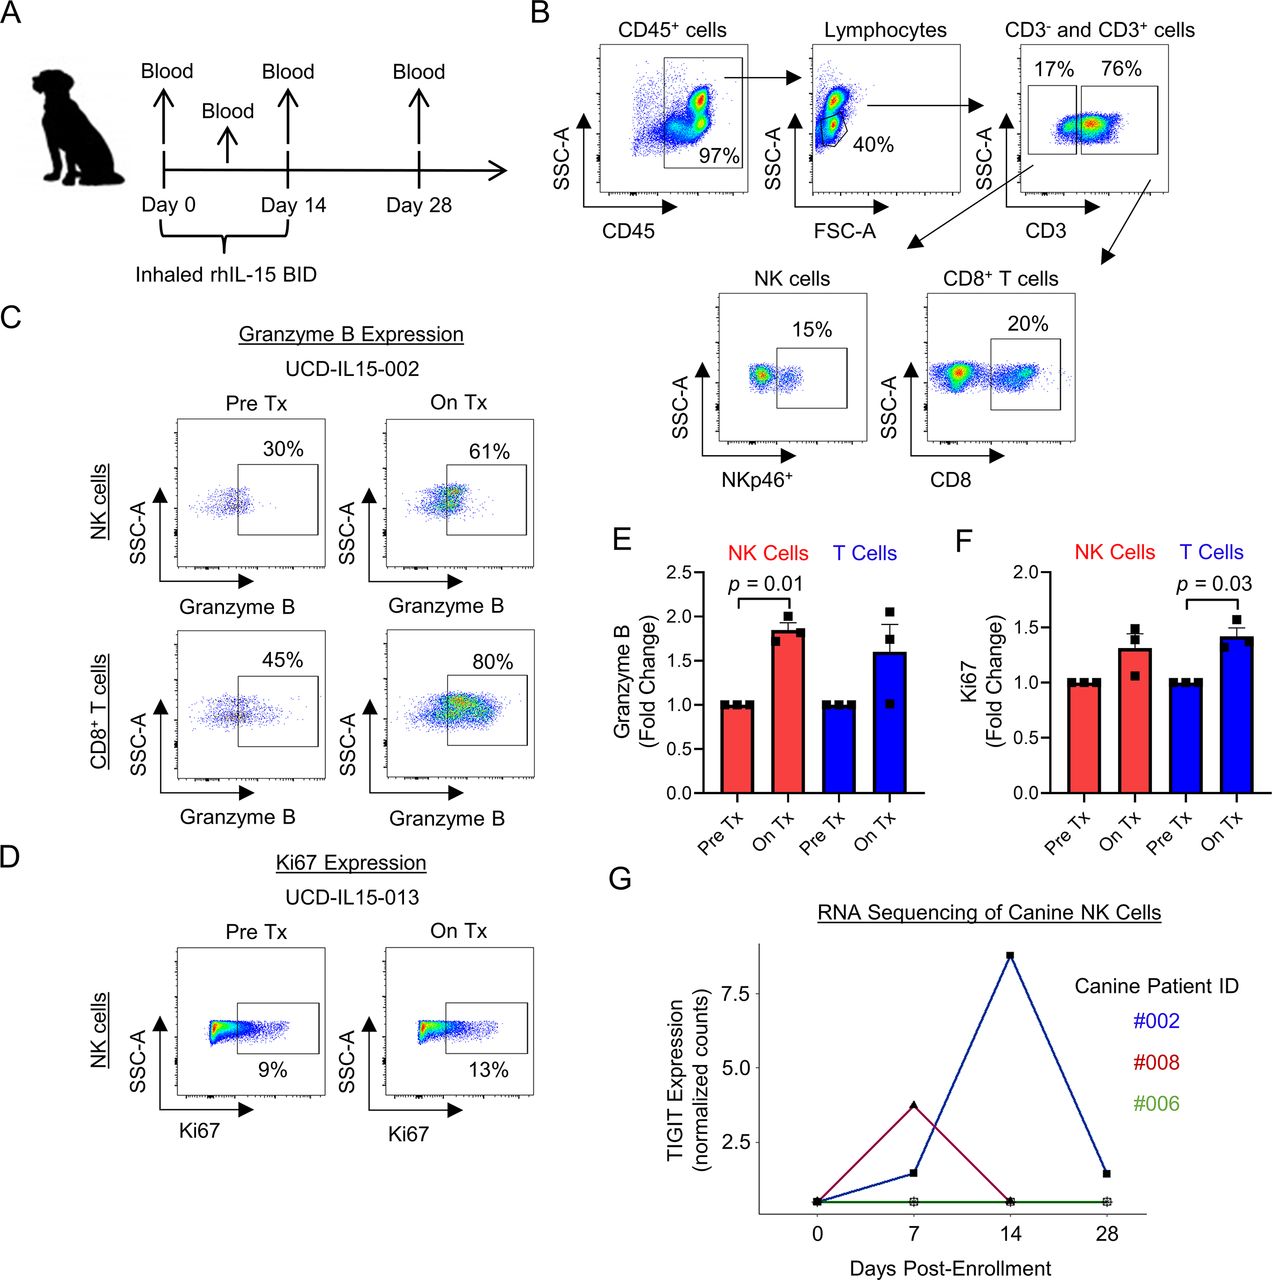
As part of our group’s interest in canine immunotherapy, we have recently implemented a first-in-dog clinical trial of inhaled recombinant human IL-15 for the treatment of pulmonary metastases in dogs with naturally occurring metastatic osteosarcoma. The schema for the trial is shown in figure 6A. Representative flow cytometry shows the pertinent immune populations in canine peripheral blood, including CD45+ cells, lymphocytes, CD3+ and CD3− parent populations, along with NK cells (CD3−NKp46+) and CD8+ T cells (CD3+CD8+) (figure 6B). Peripheral blood was analyzed pretreatment and on treatment for expression of cytotoxic marker granzyme B and proliferation marker Ki67 on NK cells and CD8+ T cells. Figure 6C,D shows representative flow cytometry for granzyme B and Ki67 expression. For the three dogs, fold change in granzyme B expression was significantly increased in NK cells (p=0.01), and fold change in Ki67 expression was significantly increased in T cells (p=0.03) (figure 6E,F). Using RNA sequencing analysis of three additional dogs, we also identified upregulation of TIGIT gene expression in two of three patients analyzed (figure 6G). These early results from our first-in-dog clinical trial of inhaled IL-15 for osteosarcoma metastases provide proof-in-principle data from an in vivo scenario that, similar to our human data, IL-15 stimulation of NK cells leads to simultaneous upregulation of markers of both activation and inhibition, including TIGIT.

Proof-in-concept that inhaled IL-15 drives peripheral NK and CD8+ T cell activation and TIGIT upregulation in dogs with metastatic osteosarcoma. (A) Schema for our first-in-dog clinical trial of inhaled IL-15 in dogs with naturally occurring metastatic osteosarcoma. (B) Representative flow cytometry showing peripheral blood CD45+, lymphocytes, CD3, CD3−NKp46+ NK, and CD3+CD8+ T cell populations. (C–D) Inhaled IL-15 stimulates peripheral cytotoxic lymphocytes in vivo leading to upregulation of granzyme B and Ki67 by flow cytometry analysis. (E–F) Fold change in granzyme B expression significantly increased on NK cells (p=0.01) and fold change in Ki67 expression significantly increased on T cells (p=0.03). (G) RNA sequencing analysis of CD5-depleted NK cells from three dogs on-trial showing TIGIT upregulation in 2/3 patients. Mean±SEM. P values determined using paired Student’s t-test. Fold change comparison using Pre Tx value of 1. IL-15, interleukin 15; NK, natural killer; On Tx, on treatment; Pre Tx, pretreatment.
Combined IL-15 stimulation and TIGIT blockade augments killing of sarcomas in vitro when target expression of TIGIT ligands is high
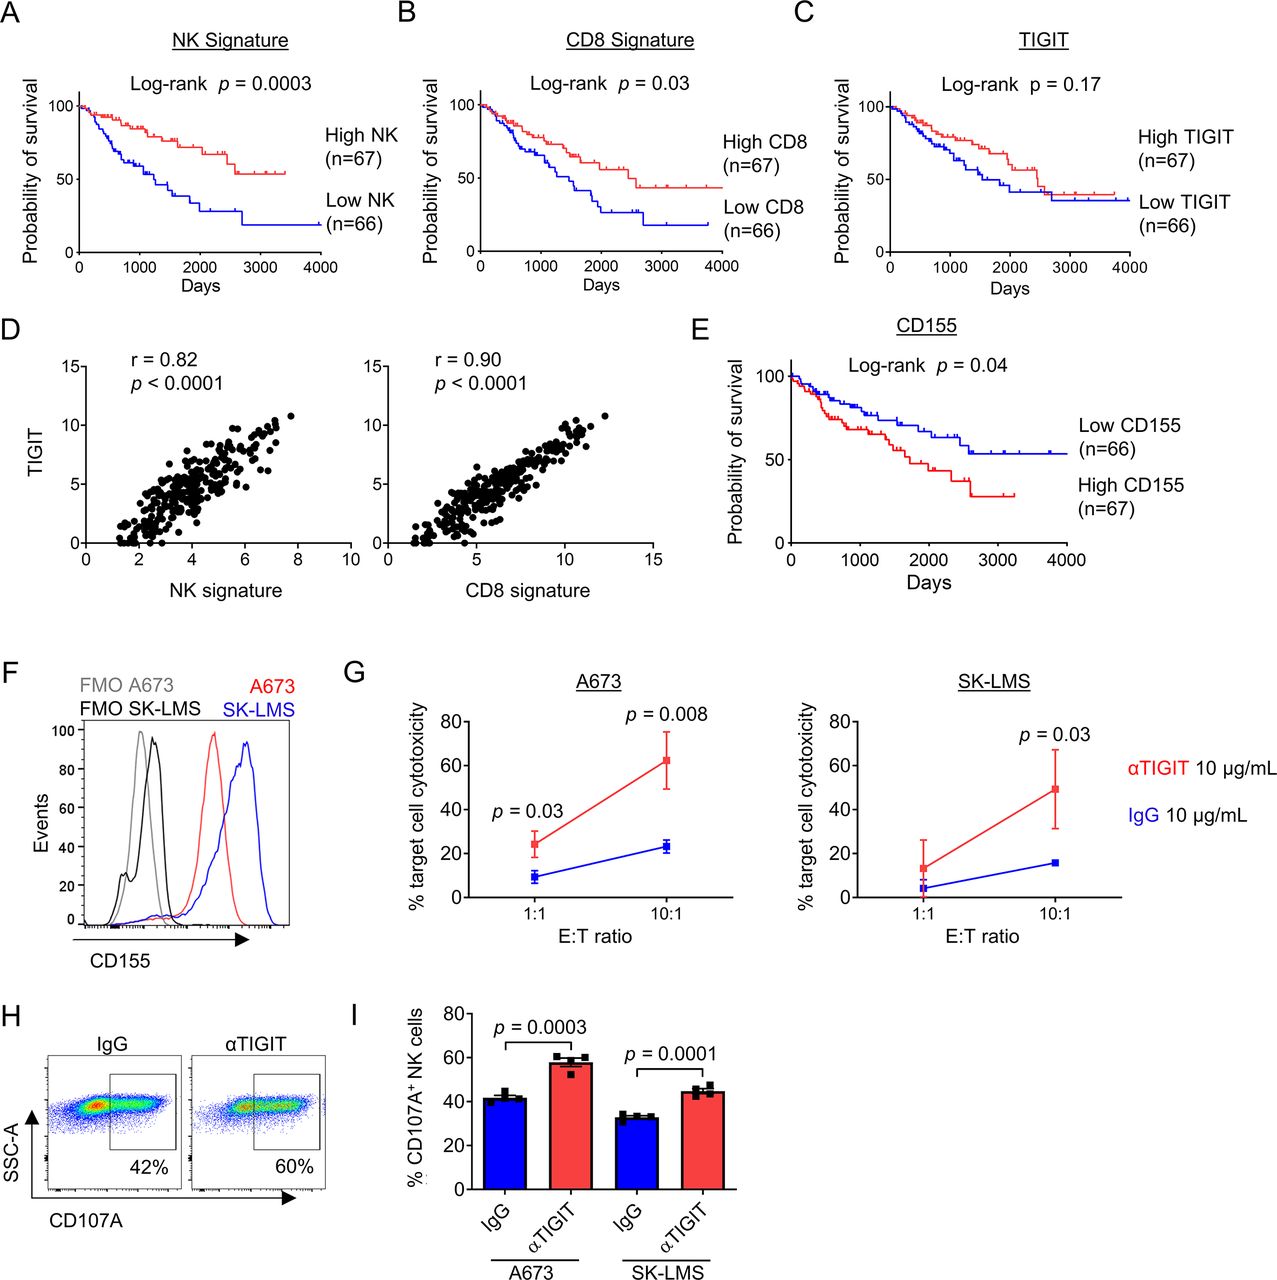
We next set out to validate our findings in a larger cohort and determine the effects of TIGIT blockade on NK and T cell activation and cytotoxicity. First, we queried the TCGA database for STS data. Using clinicodemographic data from 265 patients, we determined the association of NK cells, CD8+ T cells, and TIGIT with survival using previously published NK and CD8 gene signatures43 in addition to TIGIT expression. As shown in figure 7A and B, the presence of NK cells (log-rank p=0.0003) and CD8+ T cells (log-rank p=0.03) was both highly associated with improved overall survival. Importantly, and similar to our IHC analysis (in figure 2), there was no association of TIGIT expression with differences in survival (figure 7C), although there was a strong correlation of TIGIT expression with the presence of both NK (r=0.82, p<0.0001) and CD8 (r=0.90, p<0.0001) gene signatures (figure 7D). Additional analysis showed no association between CD4 or FOXP3 gene expression and overall survival in the same TCGA cohort, suggesting a more limited role for Tregs in STS (online supplemental figure 4A,B). We also analyzed the expression of CD155, the dominant ligand for TIGIT, using the TCGA. Notably, while TIGIT expression was not associated with survival in STS, high expression of CD155 was associated with significantly worse overall survival (log-rank p=0.04) (figure 7E). Multivariable survival analysis of the TCGA STS dataset demonstrated that poor prognosis was associated with lower NK (online supplemental table 3, HR=0.68, 95% CI=0.54 to 0.84, p<0.001) and lower CD8 gene signatures (online supplemental table 4, HR=0.86, 95% CI=0.77 to 0.98, p=0.019). However, significance of the association between CD155 expression with prognosis was not shown after adjustment for other covariables on multivariable analysis (online supplemental table 5, p=0.102).

Combined IL-15 stimulation and TIGIT blockade augments killing of sarcomas in vitro when target expression of TIGIT ligands is high. Analysis of the TCGA-SARC database by Kaplan-Meier analysis shows a significant survival advantage in tumors with a (A) high NK signature (p=0.0003), (B) high CD8 signature (p=0.03), but independent of (C) TIGIT expression (p=0.17). (D) TIGIT expression within STS tumors has a strong positive correlation with NK signature (r=0.82, p<0.0001) and CD8 signature (r=0.90, p<0.0001). (E) Low expression of the primary TIGIT ligand CD155 was associated with improved overall survival by Kaplan-Meier analysis of the TCGA-SARC database (p=0.04). (F) Expression of TIGIT ligand CD155 on sarcoma cell lines A673 (red) and SK-LMS (blue) compared with FMO staining. (G) Increased cytotoxicity of CFSE-labeled target cells A673 (left) and SK-LMS (right) following 4-hour incubation with in vitro IL-15-preactivated PBMCs from a patient with sarcoma in the presence anti-TIGIT 10 ug/mL (red) compared with IgG control 10 ug/mL (blue) at low and high E:T ratios. Increased expression of degranulation marker CD107a on NK cells from IL-15-preactivated PBMCs following 4-hour incubation with sarcoma cell lines shown by (H) representative flow cytometry against A673 cells, and (I) quantified per cent expression against A673 and SK-LMS cell lines in a 5:1 E:T ratio. These experiments were repeated independently in two patients with STS with representative data shown. P value determined using Student’s t-test using n=3–4 technical replicates. FMO, Fluorescence Minus One; IL, interleukin; PBMCs, peripheral blood mononuclear cells; STS, soft tissue sarcoma; TCGA, The Cancer Genome Atlas.
Given the potential for TIGIT upregulation to limit the stimulatory effects of IL-15 on NK and T cells, we next evaluated the combination of IL-15 and TIGIT blockade using a novel human anti-TIGIT monoclonal antibody (BMS-986207). Using CD155+ sarcoma cell lines A673 and SK-LMS (figure 7F), we detected significant increases in cytotoxicity of peripheral blood NK and T cells after 72 hours stimulation with IL-15 combined with TIGIT blockade (figure 7G). Given the rapid killing required for a 4-hour cytotoxicity assay, we also analyzed NK cells from these same conditions for the expression of degranulation marker CD107a. Representative flow cytometry staining shows the expression of CD107a on NK cells under control (IgG) or TIGIT blockade (αTIGIT) conditions (figure 7H). Overall, we observed a significant increase in CD107a expression in NK cells following IL-15 plus TIGIT blockade compared with IL-15 alone after exposure to both A673 (42%±1.1% vs 58%±1.9%, p=0.0003) and SK-LMS targets (30%±0.7% vs 45%±1.1%, p=0.0001) (figure 7I). Taken together, these data further highlight the prognostic significance of intratumoral NK and T cells in STS and the relevance of targeting the TIGIT inhibitory pathway for superior antitumor effects, especially when combined with an immunostimulatory cytokine like IL-15.
IL-15 stimulation and TIGIT blockade augments TIL cytotoxicity
Considering our findings supporting IL-15 and TIGIT blockade, we next set out to determine the effects of combination therapy on the cytotoxic potential of TILs against STS targets. We collected freshly resected tumors from three surgical specimens and processed them into single cell suspensions for ex vivo TIL co-culture and stimulation with IL-15 and TIGIT blockade. Figure 8A shows the appearance of a flank STS on preoperative MRI juxtaposed to the freshly resected surgical specimen. Figure 8B shows the morphology at low and high power of the infiltrative and pleomorphic dedifferentiated liposarcoma used for tumor digest and functional TIL analysis from the corresponding pathological evaluation. After 3 days of co-culture with IL-15 and anti-TIGIT antibody or IgG, CFSE-labeled SK-LMS targets were added at the indicated ratios and analyzed by flow cytometry after a 4-hour killing assay (figure 8C). As shown in figure 8D, the addition of TIGIT blockade led to significantly higher target cell cytotoxicity mediated by TILs at a 10:1 E:T ratio (43%±1.0% vs 22%±2.6%, p=0.002), consistent with the improved cytotoxicity we observed after combination therapy using peripheral lymphocytes in figure 7. Figure 8E depicts preoperative PET/CT imaging and the freshly resected surgical specimen from a 76-year-old man with dedifferentiated liposarcoma of the retroperitoneum . As shown in figure 8F, we again observed significantly greater cytotoxicity for TILs cultured with IL-15 and TIGIT blockade compared with IL-15 and IgG (p=0.025). Taken together, these results reinforce the capacity for combination therapy with IL-15 stimulation and TIGIT blockade to augment antitumor immunity of cytotoxic NK and T cells in STS.

IL-15 stimulation and TIGIT blockade augments TIL cytotoxicity. (A) Soft tissue sarcoma (STS) on preoperative MRI and resected surgical specimen. (B) Standard H&E imaging at 20x and 100x showing dedifferentiated liposarcoma. (C) schema for TIL cytotoxicity assay against CFSE-labeled SK-LMS target cells. (D) Increased target cell cytotoxicity mediated by STS TILs with IL-15 stimulation and TIGIT blockade at a 10:1 E:T ratio (p=0.002). (E) Preoperative PET/CT and resected surgical specimen of a retroperitoneal dedifferentiated liposarcoma. (F) Confirmation of increased target cell cytotoxicity at a 10:1 E:T ratio (p=0.025). P value determined using Student’s t-test using n=3–5 technical replicates. We repeated this experiment three times. IL-15, interleukin 15; TIL, tumor-infiltrating lymphocyte.
Discussion
Despite the breakthroughs of cancer immunotherapy, particularly using PD-1 and PD-L1 blockade, STS remain a family of tumors for which the promise of immunotherapy has remained largely unrealized. Although there are some STS histologies that have shown more favorable response rates, outcomes overall have largely been modest, and novel approaches are needed. Recent combination strategies, such as antiangiogenic inhibitors combined with PD-1 blockade in alveolar soft part sarcoma and oncolytic virus combined with PD-1 blockade in diverse STS,8 44 attest to the potential for combination immunotherapy to achieve superior results, but room for additional improvement remains in the search for improved therapies for these difficult-to-treat cancers.
Here, using both archived tumor samples and TCGA data, we show that tumor-infiltrating NK and T cells are prognostically relevant in STS with higher NK and T cell infiltration correlating with superior distant recurrence-free and overall survival. Overall, particularly in our archived data, the magnitude of TIL infiltration was generally low, which fits with the general impression of sarcomas as immunologically ‘cold’ tumors45 and may also explain why STS tend to be less responsive to T cell invigorating therapies like PD-1/PD-L1 and CTLA-4 blockade. However, our data also show that the infiltrating NK and T cells which are present in STS tumors can be activated with cytokine stimulation using IL-15, and this cytokine increases both cytotoxic function and expression of inhibitory marker TIGIT. In fact, within STS tumors, we observed features of both heightened activation and inhibition in infiltrating NK and T cells, suggesting that within the TME, there are signals that promote these pathways simultaneously. These data are interesting since the status of TILs as both dysfunctional and activated is an area of investigation.46 Our study is one of the few which shows features of both, suggesting that these pathways are not necessarily mutually exclusive and that the upregulation of inhibitory pathways like TIGIT is likely a predictable and expected immunoregulatory response following exposure to stimulatory signals and tumor cell targets.
For these reasons, the combination of a checkpoint inhibitor like TIGIT blockade with an immunstimulatory cytokine like IL-15 may be a rational and biomarker-driven approach to improve cancer immunotherapy outcomes, specifically in STS. We observed TIGIT to be expressed on circulating NK and T cells in patients with STS, but importantly, the expression was significantly greater in tumor-infiltrating NK and T cells. When stimulated with IL-15 alone, we observed activation, proliferation, and cytotoxic function of tumor-infiltrating NK and T cells as well as upregulation of TIGIT. When we combined IL-15 stimulation with TIGIT blockade, we observed significantly greater cytotoxic effects against target cells expressing TIGIT ligands compared with IL-15 alone. These data highlight the translational potential of this combination strategy since compensation and the upregulation of negative signals to avoid overstimulation are key principles of immune homeostasis, and it will be important to assess for potential toxicity of this approach, as in all immunotherapies.23 However, these data may also shed light on why exogenous cytokine approaches, like IL-2 and IL-15, have historically been met with relatively limited success as monotherapies.47
Importantly, we did not observe TIGIT expression to be prognostic for relapse in either our retrospective data or the TCGA. These results are potentially confounded by baseline TIL infiltration since low TIGIT expressors in both our IHC data and the TCGA data include a composite of immune-enriched tumors (where low TIGIT is hypothesized to predict superior outcome) as well as immune-desert tumors with low TIGIT (where low immune infiltration likely predicts inferior survival as has been shown in other studies). In addition, although intratumoral TIGIT expression may not be a prognostic marker for STS outcome even after appropriate stratification by baseline immune infiltrations, our data would suggest that TIGIT expression is likely to be a predictive marker, which identifies patients who will respond to TIGIT blockade, especially following IL-15 cytokine stimulation, which leads to upregulation of TIGIT on both NK and CD8+ T cells in the blood and tumors of patients with sarcoma. Since IL-15 is the prototypical survival signal for NK cells and regulates the activation and proliferation of both NK cells and memory T cells and since TIGIT appears to be a critical marker of NK exhaustion (unlike PD-1), the combination of IL-15 and TIGIT blockade appears to be a rational approach to maximize antitumor effects in tumors like sarcomas, which are less responsive to T-cell-based strategies.
The use of IL-2 as a cancer immunotherapy dates back to the 1980s, and this approach has a clear track record of success in a small but meaningful subset of patients with melanoma and renal cell carcinoma.48 However, broader success has been limited by systemic toxicity and modest antitumor effects despite evidence for significant proliferation and expansion of lymphocyte populations. Compared with the experience with IL-2, the experience with IL-15 has been more limited, but clinical trials of intravenous bolus dosing showed similar tendencies for potential dose-limiting toxicities. Conlon et al 49 conducted the first human trial using recombinant human IL-15. Although toxicities were evident, investigators also detected profound expansions of peripheral NK and CD8+ T cells. This led the same investigators to evaluate both continuous intravenous infusions and subcutaneous dosing, both of which have been safer with similar immune effects, but also limited clinical benefit as monotherapy.50 When Conlon et al administered IL-15 by continuous venous infusion over 10 days to 27 patients with diverse solid cancers (including four patients with STS), they observed a nearly 6-fold increase in circulating CD8+ T cells, a 38-fold increase in total NK cells, and a 358-fold increase in CD56bright NK cells. While several patients experienced stability of their disease, systemic toxicities remained prevalent with eight total serious adverse events documented.50 Our data here correlate with these clinical findings regarding the ability of IL-15 to stimulate NK and T cells, including intratumoral ones, but also show the concomitant increase in the inhibitory receptor TIGIT, a finding that may be limiting the clinical benefit of IL-15. Importantly, we observed in a canine co-clinical trial for dogs with osteosarcoma that in vivo treatment leads to activation of NK and T cells with simultaneous upregulation of TIGIT. As such, combination therapy of IL-15 with TIGIT blockade appears as a rational combination therapy for STS, although the optimal route of IL-15 administration remains to be determined as does the ability of systemic IL-15 to augment intratumoral NK and T cell activation and TIGIT expression in vivo in humans. These are important questions to determine in follow-up studies, and the overlap, or lack thereof, between the phenotype and function of circulating immune populations and those in the TME remains an unresolved question, as our data also show.
An important component of this particular work, and general clinical cancer care, is the interaction of systemic therapies with immune cell populations. Current therapy for locally advanced, but non-metastatic STSs routinely includes radiotherapy and surgery, while systemic chemotherapy is applied selectively. The impact of chemotherapies on the phenotype and function of circulating and tumor-infiltrating immune subsets, especially NK and T cells, is a subject of interest in tumor immunology and immunotherapy currently as chemotherapy can cause leukopenia and immunosuppression as well as immunogenic cell death. To help limit the effects of this confounding variable, no patients in our study underwent sample collection while undergoing systemic chemotherapy. The data in its current form represents our concerted effort to prospectively enroll all potential sarcoma patients to a blood and tissue collection protocol over time. We recognize that there is some heterogeneity in our study cohort, but heterogeneity in the patient population is a common and recurring limitation of sarcoma analyses given that this is a rare and difficult-to-treat family of cancers. Over time, as we develop a larger cohort of patients with sarcoma with additional immune monitoring data and longer follow-up for our prospective cohort, we will be able to conduct an analysis of a more homogeneous cohort.
Our analysis of TIGIT expression and antitumor augmentation focused on NK cells and CD8+ T cells. While we did evaluate expression of CD4 and FoxP3 in the TCGA dataset, this evaluation was not included in our prospectively collected, flow cytometry-based analysis. Because of that, we are not able to make any conclusions regarding the impact of CD4 and/or Treg levels on recurrence. The role of Tregs and other suppressive immune populations within the TME is of great interest given the unmet need to improve immunotherapy responses. Although a limited number of previous studies have demonstrated an association of FoxP3 expression as determined by IHC with worse survival in STS,51 52 the prognostic significance of FoxP3+ Tregs in solid tumors in general and STS in particular remains undefined. A recent meta-analysis did show that FoxP3 Tregs are inversely correlated with overall survival in multiple cancers, but the prognostic effect did notably vary by tumor site. In fact, in head and neck cancers as well as esophageal cancer, the presence of Tregs was associated with more favorable survival.53 In addition to the CD4 subsets of interest (Tregs), further evaluation of memory/naive CD8+ T cell subsets is warranted. We hypothesize that TIGIT expression is higher on memory T cells compared with other subsets as an effector CD8+ T cell population is antigen-experienced and has previously undergone priming. This would further support our rationale for IL-15 stimulation and TIGIT blockade because it is only the mature T cells (not naive T cells) along with NK cells that are capable of responding to cytokine stimulation alone (ie, signal 3). Naive T cells exposed to signal 3 only will undergo immune paralysis and will exhibit limited antitumor function.54 The memory CD8+ T cells and NK cells that do respond to cytokine stimulation (in a non-antigen-specific manner) are anticipated to respond to TIGIT blockade to further augment their effector function.
Despite the provocative findings of our work, it is also important to acknowledge the limitations. Our prospective cohort is relatively small with a relatively short follow-up, both of which limit our ability to draw robust conclusions regarding potential associations of the measured immune parameters with survival and relapse. Although our data suggest a trend toward increased TIGIT expression in tumor NK and T cells being associated with disease relapse, it is important to confirm or refute this association with further follow-up and with a larger cohort of patients in order to strengthen this observation. In addition, we have not tested IL-15 and TIGIT blockade combination therapy in a murine model. These studies, in particular, would shed light on the impact of systemic IL-15 and TIGIT blockade on changes in NK and T cell phenotype and function in the TME. However, even though murine models provide critical proof-in-concept and mechanistic data, syngeneic models are limited by important species differences in immune effector populations (NK cells in particular) and tumor formation (implantable vs naturally occurring), while xenogeneic models are limited by the absence of an intact immune system. Despite these limitations, our data show robust expression of TIGIT on STS TILs and increased activation and TIGIT expression on NK and T cells following exposure to IL-15, including from dogs receiving inhaled IL-15 on a first-in-dog clinical trial. Finally, the combination of IL-15 and TIGIT blockade showed significantly greater cytotoxic effects. Although this combination was only tested using ex vivo conditions, the strong reliance on primary STS tumor specimens is a notable strength of our study.
Although other molecules (such as LAG-3 and TIM-3) have also been shown to mediate important inhibitory immune signals in solid tumors, preliminary data from numerous ongoing clinical trials of anti-TIGIT antibodies attest to the potential clinical impact of a TIGIT-based approach. A search of clinicaltrials.gov shows at least eight high impact anti-TIGIT cancer clinical trials underway, although most of these trials are in combination with PD-1/PD-L1 blockade. Overall, these active clinical trials of TIGIT blockade highlight the clinical relevance of our data, as the search for novel immunotherapies continues for patients with innate or acquired resistance to standard checkpoint blockade. A strength of our data is that it points to a biomarker-driven strategy for an innovative combination approach in an immunotherapy-resistant tumor where NK cells appear to be a relevant effector population. The magnitude and diversity of combination immunotherapy options (at least 1000 clinical trials are estimated to be currently ongoing) highlight the need for a biomarker and hypothesis-driven approach, and we maintain that our data meet both of these criteria for testing in sarcomas.
Ultimately, our data suggest that TIGIT upregulation may be a key mechanism limiting efficacy of stimulatory IL-15 monotherapy and support the development of combination therapy using IL-15 and TIGIT blockade as a novel strategy in STS. As clinical trials continue to move beyond single-agent immunotherapy for solid cancers, rational combinations are critical. Clinical approaches using recombinant human IL-15 and TIGIT blockade are warranted, and STSs appear to be an attractive target for this novel therapeutic combination.
Acknowledgments
Special thanks to Dept. of Pathology technicians Doug Peabody, Jesse Low, and Lesha Salto for their work in sample preparation, Jane Chen and Dr A Borowsky of the UC Davis Center for Genomic Pathology Lab, and the research and administrative staff at Bristol-Myers Squibb for supplying the novel, anti-TIGIT antibody, BMS-986207.
References
Supplementary materials
Supplementary Data
This web only file has been produced by the BMJ Publishing Group from an electronic file supplied by the author(s) and has not been edited for content.
Footnotes
Contributors SJJ and RC designed the study. SJJ, MAD, SWT, AAG, EFO and ARB conducted the experiments and collected the data. IRS, LVV, CD and KMS provided technical assistance. YL and SC provided statistical analysis. SJJ and RC analyzed the data. SJJ and RC wrote the manuscript. All authors, including MC, RBR, AM and WJM, provided critical reviews of the manuscript.
Funding This work was supported in part by National Institutes of Health/National Cancer Institute grant U01 CA224166-01 (RJC). This work was also supported in part by funds from the UC Davis Comprehensive Cancer Center and the University of California Davis Flow Cytometry Shared Resource Laboratory with funding from the NCI P30 CA093373 (Cancer Center), and S10 OD018223 (Astrios Cell Sorter), and S10 RR 026825 (Fortessa Cytometer) grants, with technical assistance from Ms Bridget McLaughlin and Mr Jonathan Van Dyke. Specimens were provided by the UC Davis Pathology Biorepository which is jointly funded by the UC Davis Comprehensive Cancer Support Grant (CCSG) awarded by the National Cancer Institute (NCI P30 CA093373) and the UC Davis Department of Pathology and Laboratory Medicine. The sequencing was carried out at the DNA Technologies and Expression Analysis Cores at the UC Davis Genome Center, supported by NIH Shared Instrumentation Grant 1S10OD010786-01, with technical assistance from Ms Emily Kumimoto, Ms Claire Barron Goldman, and Dr Lutz Froenicke.
Competing interests None declared.
Patient consent for publication Not required.
Ethics approval All experiments involving human and canine patients were approved by the respective Institutional Review Boards at the University of California, Davis, Schools of Medicine and Veterinary Medicine.
Provenance and peer review Not commissioned; externally peer reviewed.
Data availability statement Data are available in a public, open access repository. Data are available upon reasonable request. RNA sequencing data will be made publicly available following publication.
Supplemental material This content has been supplied by the author(s). It has not been vetted by BMJ Publishing Group Limited (BMJ) and may not have been peer-reviewed. Any opinions or recommendations discussed are solely those of the author(s) and are not endorsed by BMJ. BMJ disclaims all liability and responsibility arising from any reliance placed on the content. Where the content includes any translated material, BMJ does not warrant the accuracy and reliability of the translations (including but not limited to local regulations, clinical guidelines, terminology, drug names and drug dosages), and is not responsible for any error and/or omissions arising from translation and adaptation or otherwise.