Article Text

Abstract
Background Although immune checkpoint blockade is effective for several malignancies, a substantial number of patients remain refractory to treatment. The future of immunotherapy will be a personalized approach adapted to each patient’s cancer-immune interactions in the tumor microenvironment (TME) to prevent suppression of antitumor immune responses. To demonstrate the feasibility of this kind of approach, we developed combination therapy for a preclinical model guided by deep immunophenotyping of the TME.
Methods Gastric cancer cell lines YTN2 and YTN16 were subcutaneously inoculated into C57BL/6 mice. YTN2 spontaneously regresses, while YTN16 grows progressively. Bulk RNA-Seq, single-cell RNA-Seq (scRNA-Seq) and flow cytometry were performed to investigate the immunological differences in the TME of these tumors.
Results Bulk RNA-Seq demonstrated that YTN16 tumor cells produced CCL20 and that CD8+ T cell responses were impaired in these tumors relative to YTN2. We have developed a vertical flow array chip (VFAC) for targeted scRNA-Seq to identify unique subtypes of T cells by employing a panel of genes reflecting T cell phenotypes and functions. CD8+ T cell dysfunction (cytotoxicity, proliferation and the recruitment of interleukin-17 (IL-17)-producing cells into YTN16 tumors) was identified by targeted scRNA-Seq. The presence of IL-17-producing T cells in YTN16 tumors was confirmed by flow cytometry, which also revealed neutrophil infiltration. IL-17 blockade suppressed YTN16 tumor growth, while tumors were rejected by the combination of anti-IL-17 and anti-PD-1 (Programmed cell death protein 1) mAb treatment. Reduced neutrophil activation and enhanced expansion of neoantigen-specific CD8+ T cells were observed in tumors of the mice receiving the combination therapy.
Conclusions Deep phenotyping of YTN16 tumors identified a sequence of events on the axis CCL20->IL-17-producing cells->IL-17-neutrophil-angiogenesis->suppression of neoantigen-specific CD8+ T cells which was responsible for the lack of tumor rejection. IL-17 blockade together with anti-PD-1 mAb therapy eradicated these YTN16 tumors. Thus, the deep immunological phenotyping can guide immunotherapy for the tailored treatment of each individual patient’s tumor.
- gene expression profiling
- cytokines
- tumor microenvironment
This is an open access article distributed in accordance with the Creative Commons Attribution Non Commercial (CC BY-NC 4.0) license, which permits others to distribute, remix, adapt, build upon this work non-commercially, and license their derivative works on different terms, provided the original work is properly cited, appropriate credit is given, any changes made indicated, and the use is non-commercial. See http://creativecommons.org/licenses/by-nc/4.0/.
Statistics from Altmetric.com
Background
Since immune checkpoint blockade therapies were approved for the treatment of many cancer types, remarkable clinical responses have been achieved in a certain proportion of patients.1 Nonetheless, many patients are unresponsive, and there remain several tumor types that are refractory to immunotherapy.2 Multiple immunosuppressive mechanisms operate in the tumor microenvironment (TME),3 and any antitumor immune cells that might be present are often impaired in the TME. Thus, future immunotherapy requires a combination of potent stimulation of antitumor immune responses and, additionally, manipulation of the immunosuppressive environment to prevent tumor escape.4 Therefore, elucidating the mechanisms of responsiveness or refractoriness and the molecular determinants thereof is required to improve cancer immunotherapy.
The Cancer Genome Atlas project provides valuable opportunities to analyze dynamic interactions occurring between cancer cells, immune cells and the TME. Thorsson et al 5 analyzed bulk RNA-Seq data of 10,000 tumors and classified the immune landscape of cancers into six molecular subtypes. Transcriptomic analysis of the TME will provide invaluable information for the identification of new targets for combination immunotherapies. Although bulk transcriptome analysis is robust, it is not sufficient to fully dissect the highly heterogeneous TME in which different immune cells and cancer cells themselves are involved in shaping the immunosuppressive environment. Because transcriptomic data of rare cell populations are lost among those of abundant cell populations, functional cell diversity and possible crucial interactions between cancer cells and immune cells within the TME might be obscured. To overcome these difficulties, single-cell RNA-Seq (scRNA-Seq) can be applied to investigate antitumor immune responses, sensitive even to very low frequencies of particular cell types.6 We have developed a highly efficient nucleic acid reaction chip (a vertical flow array chip (VFAC)) and have been able to identify unique subtypes of T cells by targeted scRNA-Seq using this approach.7 High-resolution analysis of the TME by scRNA-Seq will increase the chance of identifying novel targets for immunotherapy.
To demonstrate the feasibility of an immunological data-guided personalized adaptive approach to immunotherapy, whereby immunomodulatory strategies are tailored to the patient’s specific TME, we used mice-bearing subcutaneous YTN16 gastric cancers.8 The TME of growing YTN16 tumors was immunologically assessed and the animals were treated based on those results. Using scRNA-Seq, but not bulk RNA-Seq, it was possible to determine that interleukin-17 (IL-17)-producing cells in YTN16 tumors were involved in generating an immunosuppressive microenvironment. IL-17 blockade, combined with anti-PD-1 mAb treatment, was able to eradicate these tumors. Thus, tumors currently considered non-responsive to immune checkpoint therapy might be convertible to responders by elucidating and regulating the complicated network of cancer cells and immune cells in the individual patient TME.
Methods
Mice, tumor cells, and reagents
Six-week-old female C57BL/6N mice were purchased from Japan SLC (Shizuoka, Japan). All mice were kept in a specific pathogen-free environment. YTN2 and YTN16 are cell lines established from chemically induced gastric cancers and are maintained in Dulbecco's modified Eagle's medium (DMEM, Nacalai Tesque, Kyoto, Japan) with 10% heat-inactivated fetal bovine serum (Sigma-Aldrich, St. Louis, Missouri, USA), 100 µg/mL streptomycin, 100 U/mL penicillin (Wako Pure Chemical) and MITO+ serum extender (Corning, Corning, New York, USA). Antibodies specific for CD4 (GK1.5), CD8α (53–6.7), NK1.1 (PK136), PD-1 (RMP1-14), IL-17A (17F3) and CD16/32 (2.4G2) were all purchased from BioXcell (Lebanon, New Hampshire, USA). DimerX I:Recombinant Soluble Dimeric Mouse H-2Db:Ig, DimerX I:Recombinant Soluble Dimeric Mouse H-2Kb:Ig, APC-conjugated anti-CD103 and PE-CF594-conjugated anti-Ly6G mAbs were from BD Biosciences (Franklin Lakes, New Jersey, USA). FITC-conjugated anti-I-A/I-E and anti-CD3 mAbs, PE-conjugated anti-mouse IgG1, anti-IL-17, anti-NK1.1 and anti-CD64 mAbs, PerCP/Cy5.5-conjugated anti-CD11b, anti-CD4, anti-LAG-3 and anti-TCRγ/δ, APC-conjugated anti-IFNγ, anti-TIM-3 and anti-CTLA-4, PE/Cy7-conjugated anti-Ly6C and anti-PD-1, APC/Cy7-conjugated anti-CD8α and anti-CD45 and Pacific Blue-conjugated anti-CD45 mAbs were all from BioLegend (San Diego, California, USA).
Treatment of tumor-bearing mice
Mice were inoculated with 5×10⁶ YTN2 or YTN16 subcutaneously into the right flank on day 0. For depletion of CD4+ T or natural killer (NK) cells, anti-CD4 or -NK1.1 mAbs were injected intraperitoneally into tumor-bearing mice on days −2, 0, 3 and 6. CD8+ T cells were depleted by intraperitoneally injections of anti-CD8 mAb on days −3, 0, 3 and 6, or 4, 7, 10 and 13. For blocking IL-17 and/or PD-1 signaling, anti-IL-17 and/or -PD-1 mAbs were injected intraperitoneally on days 0, 3, 6 and 9 and/or days 3, 6 and 9, respectively. Tumor growth was monitored every 2–3 days with calipers, and tumor volume was calculated by the formula π/6×L1L2H, where L1 is the long diameter, L2 is the short diameter, and H is the height of the tumor.
Cell preparation and flow cytometry
Tumors were cut into pieces and incubated in RPMI-1640 (Nacalai Tesque, Kyoto, Japan) supplemented with 0.2% collagenase (FUJIFILM Wako Pure Chemical Corporation, Osaka, Japan) and 2 KU/mL DNase I (Sigma-Aldrich, St. Louis, Missouri, USA) for 40 min at 37℃. All material was passed through a 70 µm cell strainer to obtain single cell suspensions. After staining dead cells using the Zombie Aqua Fixable Viability Kit (BioLegend) and blocking Fc receptors with anti-CD16/32 mAb, the cells were stained with mAbs for cell surface antigens.
For intracellular cytokine staining, cells were first stimulated with 10 ng/mL PMA (Sigma-Aldrich) and 1 µM ionomycin (Sigma-Aldrich) in the presence of 10 µg/mL brefeldin A (Sigma-Aldrich) for 4 hours. After staining dead cells using the Zombie Aqua Fixable Viability Kit (BioLegend) and blocking Fcγ receptors with anti-CD16/32 mAb, cells were first stained with mAbs for cell surface antigens. After fixation and permeabilization using Fixation Buffer and Intracellular Staining Perm Wash Buffer (BioLegend) according to the manufacturer’s protocols, cells were then stained with PE-conjugated anti-IL-17A and APC-conjugated anti-IFNγ antibodies. Stained cells were acquired on a CytoFLEX S flow cytometer (Beckman Coulter, Atlanta, Georgia, USA) and analyzed using FlowJo software V.10.6.2 (BD Biosciences).
RNA-Seq
Total RNA was isolated from tumor tissues using TRIzol (Thermo Fisher Scientific, Waltham, Massachusetts, USA) and RNeasy spin columns (Qiagen, Venlo, The Netherlands) according to the manufacturer’s protocols. Libraries were prepared using Illumina TruSeq Stranded mRNA Library Prep (Illumina, San Diego, California, USA) or VAHTS Stranded mRNA-seq Library Prep Kit (Vazyme, Jiangsu, China) according to the manufacturer’s protocols. The libraries were sequenced as 150 base pair (bp) paired-end reads using the HiSeq X Ten or NovaSeq 6000 (Illumina). The sequence reads were aligned to the mm10 reference genome using STAR V.2.5.2b. Mapped reads were counted by HTSeq V.0.6.1. Raw counts were normalized and differentially expressed genes (DEGs) were calculated using R V.3.5.0 with TCC,9 DEseq10 and DEseq211 packages. Functional analyses were conducted using Cytoscape V.3.7.0 with ClueGO plugin V.2.5.2, gene set enrichment analysis (GSEA, V.4.0.3) using 50 hallmark gene sets from msigdbr package (V.7.1.1) of R, and single sample GSEA (ssGSEA, V.10.0.3) using gene ontology (GO) terms. Raw data were deposited in the Gene Expression Omnibus (GEO) database (accession number GSE146027).
Microarray analysis
Total RNA was isolated from YTN2 and YTN16 tumor cells. Gene expressions of tumor cell lines were evaluated using SurePrint G3 Mouse GE 8×60K Microarray Kit (Agilent Technologies, Santa Clara, California, USA). Fold changes to mean values were converted to log2. Raw data were deposited to GEO database (accession number GSE153231).
Peptide synthesis
Peptides were synthesized by standard solid-phase synthesis using a Syro I (Biotage, Uppsala, Sweden). Fmoc-protected amino acid-loaded resins and Fmoc-protected amino acids were purchased from Merck (Darmstadt, Germany). 1-[Bis(dimethylamino)methylene]-1H-1,2,3-triazolo[4,5-b]pyridinium 3-oxide hexafluorophosphate (HATU, Merck) was used in the coupling reaction. After cleavage and deprotection of peptides using reagent K (trifluoroacetic acid/phenol/thioanisole/1,2-ethanedithiol, 82.5/5/5/2.5), cold diethyl ether was added to precipitate the peptides. Sequences were confirmed by matrix-assisted laser desorption/ionization Time-of-flight mass spectrometry (MALDI-TOF MS) (TOF/TOF5800, AB SCIEX, Framingham, Massachusetts, USA).
Preparation of scRNA-Seq libraries
The scRNA-Seq libraries were prepared using Flow-cell devices composed of multiple VFACs to analyze the expression of 44 targeted genes associated with T cell phenotypes and functions (online supplemental table 1). The VFAC (1 mm2) contains 100 microchambers packed with 1~2×10⁵ magnetic beads (1 µm in diameter), and 7.5~15×109 immobilized RT probes consisting of 18 nucleotides (nt) of poly-T sequences, cell identifiers (Cell-ID) of 6 nt, and 7 nt random sequences as UMIs (Unique Molecular Identifiers),12 and finally 30 nt of common sequences (CS) for amplification (online supplemental table 2). All procedures from cell capture to cDNA synthesis were performed in the Flow-cell device. In brief, fluorescence-activated cell sorting (FACS)-sorted tumor-infiltrating cells (TICs) isolated from YTN2 and YTN16 tumor tissues were washed once with Phosphate-buffered saline (PBS) and resuspended in PBS containing 90 copies/μL of spiked cRNA to a final concentration of 80 cells/µL. After adding 80 cells per VFAC, the flow-cell device was connected to a vacuum pump (Ulback KOKI, Kanagawa, Japan) for applying negative pressure to the rear, and single cells were captured onto laser-created holes 4 µm in diameter at the top of the microchambers. Following treatment with cell lysis reagent, 4.5 µL of RT reagent (a mixture of 1.0 µL of 5 × FS buffer, 1.0 µL of 100 mM DTT, 1 µL of 10 mM dNTPs, 0.3 µL of 10% Tween20, 0.4 µL of RNase OUT, and 0.4 µL of SuperScript III (Thermo Fisher Scientific)) were added per VFAC in the flow-cell device, and reverse transcription was performed for 50 min at 50℃ in a thermostatic incubator. Each VFAC was taken out of the flow-cell device into a 0.2 mL tube containing 100 µL of resuspension buffer (50 mM Tris (pH 8.0) containing 0.1% Tween 20). Magnetic beads on which single-cell cDNA libraries were constructed were collected from microchambers of VFAC using a neodymium magnet and washed twice with 50 µL of resuspension buffer. After exonuclease I treatment, a first PCR was performed with primers listed in online supplemental table 3, and the product was purified with Ampure XP (Beckman Coulter). Following the second PCR performed with the primers listed in online supplemental table 4, the product was purified with Ampure XP. A third PCR was then performed with primers containing Illumina-tag sequences and indices (chip-ID), as listed in online supplemental table 5, and the product was again purified with Ampure XP. The single-cell libraries were finally analyzed using 2100 Bioanalyzer high sensitivity DNA kits (Agilent, Santa Clara, California, USA) to confirm fragment distribution within the size range 461–667 bp.
Supplemental material
Supplemental material
Supplemental material
Supplemental material
Supplemental material
scRNA-Seq and data analysis
More than 3M reads for each chip were assigned in order to acquire sufficient deep sequencing data. The final concentration of each third PCR product was diluted with 10 mM Tris:HCl (pH7.5) with 0.1% Tween20 to achieve a concentration of 3.2 nM. Denaturation was then carried out according to the user manual for MiSeq. Phi X control was mixed at 10%. Paired-end sequencing (read 1=60 bp, read 2=90 bp) was carried out using MiSeq (150 cycle (v3) reagents).
For analyzing sequencing data, CEL-Seq213 for UMI counting and SCANPY14 for clustering and visualization were used. UMI count data for each microchamber were normalized with UMIs for spiked luciferase cRNA and scaled to the unit variance for each gene after logarithmization. For visualization, Louvain clustering and UMAP embedding tools were applied as API of the SCANPY in the default setting. Raw data were deposited in GEO database (accession number GSE152888).
Droplet-based scRNA-Seq
CD45+ cells were sorted from untreated or anti-IL-17 mAb-treated day 10 YTN16 tumors. After sorting, cells were resuspended at 1000 cells/µl in 0.04%BSA/PBS and loaded onto the Chromium Controller (10X Genomics, Pleasanton, California, USA). cDNA libraries were generated using Chromium Single Cell 3’ Reagent Kits v2 (10X Genomics) according to the manufacturer’s protocol. The library was subsequently sequenced on MiSeq (Illumina). Sequencing data were processed using Cell Ranger (V.3.0.0) pipeline. The data were processed using Seurat (V.3.1.5) for downstream analyses. We filtered on cells expressing a minimum of 200 genes and genes that were expressed in at least 3 cells. Cells that contained >5% reads associated with mitochondria genes were removed. Count data were then normalized and scaled using NormalizeData and Scale Data functions. Cluster analysis was performed using FindNeighbors and FindClusters functions at a resolution of 0.8. Neutrophil and dendritic cell (DC) clusters were found based on the expression of S100a8 and S100a9, and H2-Aa genes, respectively. CD11b+DCs were identified as cells expressing Itgam in the DC cluster. Raw data were deposited in GEO database (accession number GSE156725).
Statistical analysis
Data are presented as mean±SD. Statistical analyses were performed with R or Prism software version 8.4.3 (GraphPad Software, LLC, San Diego, California, USA). Comparisons of results were carried out by Student’s t-test, Fisher’s exact test, or analysis of variance with Tukey tests for multiple comparisons.
Results
CD8+ T cell-dependent antitumor immune responses to gastric cancer
Growth of tumors initiated by subcutaneous injection of either the gastric cancer cell line YTN2 or YTN16 was compared. As shown in figure 1A, YTN2 initially formed a small nodule, growth peaked on day 7–10, after which the tumor started to regress, and had eventually disappeared by 3 weeks. In contrast, YTN16 slowly but continuously grew up to 4 weeks, and then continued to grow progressively.

Tumor growth and transcriptomic analysis of the gastric cancer cell lines YTN2 and YTN16. (A) Mice (n=5) were subcutaneously inoculated with 5×10⁶ YTN2 or YTN16 tumor cells and tumor growth was monitored every 2 or 3 days. P value was calculated by Fisher’s exact test. (B) Tumors (n=5) were harvested on day 7 after tumor inoculation. Total RNA was extracted from tumor tissues and subjected to bulk RNA-Seq. Volcano plot of the relative expression of differentially expressed genes (DEGs) between YTN2 and YTN16 tumors; relative expression (log2FC) and significance (-log10FDR) are shown. Red dots indicate DEGs defined as –log10FDR>5. (C) Heatmap showing expression of DEGs. Kyoto Encyclopedia of Genes and Genomes (KEGG) pathway analyses of DEGs highly expressed in YTN2 (D) and YTN16 (E). (F) Mice (n=5) were subcutaneously inoculated with 5×10⁶ YTN2 tumor cells on day 0. Anti-CD4 and anti-NK1.1 antibodies were injected on days −2, 0, 3 and 6. Anti-CD8 antibody was injected on days −3, 0, 3 and 6 or days 4, 7, 10 and 13. YTN2 tumor growth was monitored every 2 or 3 days.
To compare the TME in tumors developing from these two different gastric cancer cell lines, total RNA was extracted from day 7 tumors and subjected to bulk RNA-Seq analysis. DEGs were analyzed by pairwise comparisons of YTN2 with YTN16 tumors (figure 1B). We found that relative to YTN16 tumors, 1060 and 1282 unique genes were significantly upregulated or downregulated in YTN2 tumors, respectively (figure 1B,C). Upregulated DEGs in YTN2 were mainly enriched for immune response genes according to the Kyoto Encyclopedia of Genes and Genomes (KEGG) enrichment analysis (figure 1D). Signatures for NK cells, T cells, graft-versus-host disease and infection immunity were enriched in the YTN2 tumors (figure 1D), suggesting that cellular immune responses had been induced in these tumors. Higher expression of immune-related genes, including cytokines, chemokines, their receptors and checkpoint molecules, were detected in YTN2 relative to YTN16 tumors (online supplemental table 6). In contrast, upregulated DEGs in YTN16 were not associated with immune responses (figure 1E and online supplemental table 7).
Supplemental material
Supplemental material
We investigated the nature of the cells responsible for YTN2 regression by depleting CD4+ T cells, CD8+ T cells or NK cells (figure 1F). Depletion of neither CD4+ T cells nor NK cells hampered YTN2 rejection; in fact, tumors were even smaller when CD4+ T cells were eliminated.15 In contrast, tumors grew progressively when CD8+ T cells were depleted either at the priming phase or effector phase. Thus, CD8+ T cells were responsible for the rejection of YTN2 tumors in C57BL/6 mice.
Analysis of TICs
To examine the immunosuppressive microenvironment of these tumors, TICs were harvested from YTN2 and YTN16 tumors on days 4, 7, 10 and analyzed by flow cytometry (figure 2). Gating strategies are shown in online supplemental figure 1. CD3+, CD4+ and CD8+ T cells were barely detectable on day 4 (figure 2A–C). Infiltration by CD4+ T cells gradually increased up to day 10 in both YTN2 and YTN16 tumors. However, percentages of CD8+ T cells continued to increase thereafter in YTN2, while they decreased after day 10 in YTN16 tumors (figure 2C). More NK cells were detected in YTN2 than YTN16 on day 4, while the percentages of NK cells were comparable on days 7 and 10 (figure 2D). There were no differences in the percentages of CD103+ DCs, CD11b+ DCs or CD64+Ly6Clo macrophages between these tumors (figure 2E–G). More CD64+Ly6Chi monocytes were detected in day 10 YTN16 tumors than in YTN2 (figure 2H). On day 4, YTN2 and YTN16 tumors contained similar percentages of neutrophils (20%) (figure 2I), but these gradually decreased in YTN2 tumors, whereas they increased in YTN16 tumors, peaking on day 7 and then decreasing to a similar level as in YTN2 tumors on day 10. These results are consistent with the bulk RNA-Seq data indicating that gene signatures for NK cells and T cells were upregulated in YTN2 tumors, associated with tumor regression.
Supplemental material

Tumor-infiltrating cells (TICs) in YTN2 and YTN16 tumors. Mice were subcutaneously inoculated with 5×10⁶ YTN2 or YTN16 tumor cells. Tumor tissues (n=4) were harvested on days 4, 7 and 10; TICs were isolated and analyzed by flow cytometry. Panels show the percentages of CD3+ T cells (A), CD4+ T cells (B), CD8+ T cells (C), NK1.1+ NK cells (D), CD103+ DC (E), CD11b+ DC (F), CD64+Ly6Clo macrophages (G), CD64+Ly6Chi monocytes (H), and Ly6G+ neutrophils (I) in YTN2 tumors (open circles) and YTN16 tumors (filled circles). (J)Expression of PD-1, TIM-3, LAG-3, CTLA-4 in CD4+ and CD8+ T cells from day 14 tumors were shown. Gating strategies were shown in online supplemental figure 1. *p<0.05; **p<0.01, Student’s t-test. CTLA-4, cytotoxic T-lymphocyte-associated protein 4; DC, dendritic cell; LAG-3, Lymphocyte-activation gene 3; NK, natural killer; PD-1, Programmed cell death protein 1; TIM-3, T-cell immunoglobulin and mucin-domaincontaining-3.
The expression of checkpoint molecules in CD4+ and CD8+ TICs were examined (figure 2J). CD4+ T cells from YTN2 and YTN16 expressed PD-1 and CTLA-4 at a high level. PD-1 expression was higher in YTN16 than YTN2 (p<0.01), while more CTLA-4 was detected in YTN2 than YTN16 (p<0.05). CD8+ T cells from YTN2 and YTN16 expressed PD-1, while the expressions of TIM-3, LAG-3 and CTLA-4 in CD8+ T cells were low.
Single-cell RNA-Seq analysis
To further characterize the tumor-infiltrating T cells in these tumors, targeted scRNA-Seq with a panel of 44 genes for T cell phenotypes and functions was carried out (online supplemental table 1). We analyzed 1098 tumor-infiltrating CD4+ and CD8+ T cells isolated from YTN2 and YTN16 tumor tissues. Consistent with the results of flow cytometry (figure 2J), transcripts for checkpoint molecules were detected in tumor-infiltrating CD4+ and CD8+ T cells isolated from YTN2 and YTN16 tumors (online supplemental figure 2). Pdcd1+ cells expressed multiple other checkpoint molecules, including Ctla4, Havcr2, Lag3, Vsir, Tigit and Cd244.
Unsupervised clustering of all T cells using the Louvain method identified six clusters (figure 3A,B), including three clusters for CD4+ T cells (clusters 1, 2, 6) and three for CD8+ T cells (clusters 3–5) (figure 3B). Clusters 1–5 included T cells from both YTN2 and YTN16. Cluster 6 consisted of CD4+ T cells only from YTN16. The highly DEGs between clusters 1 and 2 by SCANPY analysis were Ctla4, Il2rb, Il2rg, Icos, Slc2a1, Tnfrsf9, Batf, Hif-1a, Mki67, Pdcd1, Runx3, Cxcr3, and Gzmb. This suggests that CD4+ T cells in cluster 1 displayed a more activated phenotype than those in cluster 2 (online supplemental file 3A). Il2rg, Il2rb, Tbx21, Ctla4, Pdcd1, Runx3, Cxcr3, Fas, Gzmb, Slc2a1, Eomes, Tnfrsf9, CD160 and Mki67 were more highly expressed in CD8+ T cells of clusters 3 and 5 than cluster 4 (online supplemental figure 3B,C). Gzmb and CD160 expression were higher in cluster 5 than cluster 3, suggesting that CD8+ T cells in cluster 5 were more exhausted than cluster 3 (online supplemental figure 3D). As shown in figure 3C, the most highly DEGs distinguishing CD8+ T cells from YTN2 and YTN16 tumors were Gzmb and Mki67, suggesting that CD8+ T cell dysfunction in terms of cytotoxicity and proliferation might be the reason for the inability to reject YTN16 tumors. In CD4+ T cells, Havcr2 and Ifng expression were higher in YTN2 than YTN16, while Il17a expression was higher in YTN16 than YTN2 (figure 3D).

Single-cell RNA-Seq analysis. Mice were inoculated with 5×10⁶ YTN2 or YTN16 on day 0. On day 7, tumor-infiltrating cells (TICs) were isolated from pooled tumor tissues of 13 YTN2 or 25 YTN16 tumor-bearing mice. CD4+ and CD8+ T cells were sorted and subjected to scRNA-Seq. (A) UMAP visualization. Unsupervised clustering by the Louvain method identified six clusters. Each dot represents a cell with a different color indicating each cluster. (B) Heatmap showing the expression of 44 genes in 1098 cells. (C, D) Genes differentially expressed between YTN2 and YTN16 in CD8+ (C) and CD4+ (D) T cells.
IL-17-producing cells in TICs
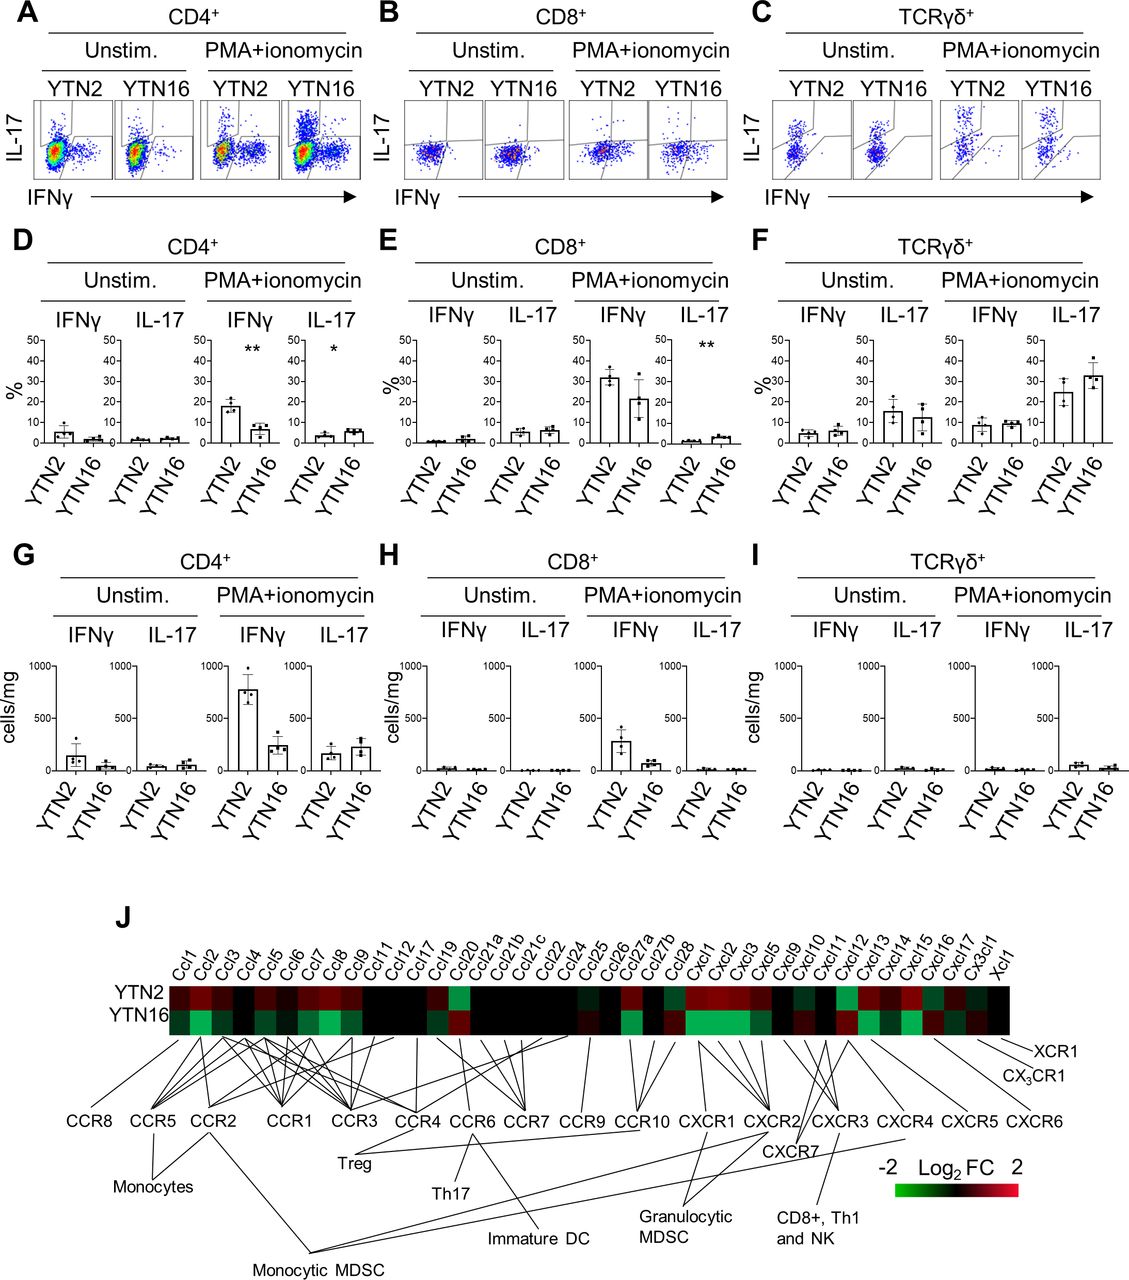
The presence of IL-17-producing cells was confirmed by flow cytometry (figure 4). TICs were isolated from day 7 tumors and stimulated with PMA/ionomycin to determine their cytokine-producing capacity. CD4+ T cells from YTN2 tumors produced more interferon γ (IFNγ) than IL-17, while CD4+ T cells from YTN16 tumors produced as much IL-17 as IFNγ (figure 4A,D). Consistent with the single-cell analysis, we detected IL-17-producing CD8+ T cells in the YTN16 tumor by flow cytometry (figure 4B,E). As it has been accepted that γδ T cells can be another source of IL-17 in tumors,16 we detected IL-17-producing γδ T cells in both YTN2 and YTN16 tumors (figure 4C,F). We found that the number of γδ T cells was smaller than IL-17-producing CD4+ T cells in YTN16 tumors, suggesting that Th17 cells were the major source of IL-17 in these tumors (figure 4G–I).

interleukin-17 (IL-17)-producing cells in YTN2 and YTN16 tumors. Seven days after tumor inoculation, YTN2 and YTN16 tumors (n=4) were harvested and digested to obtain single cell suspensions. The cells were cultured in the presence or absence of PMA and ionomycin for 4 hours. IL-17 and interferon γ (IFNγ) production by CD4, CD8 and γδ T cells was evaluated by intracellular cytokine staining. Dot plots show expression of IL-17 and IFNγ in CD4+ (A), CD8+ (B) and γδ (C) T cells with or without stimulation by PMA and ionomycin. Percentages (D–F) and absolute numbers (G–I) of IFNγ-producing and IL-17-producing cells in CD4+ (D, G), CD8+ (E,H) and γδ (F, I) T cells. (J) Heatmap showing relative expression of the indicated genes in YTN2 and YTN16 cell lines. *p<0.05; **p<0.01, Student’s t-test. DC, dendritic cell; MDSC, myeloid-derived suppressor cell; PMA, phorbol 12-myristate 13-acetate.
To investigate the mechanisms of Th17 infiltration into YTN16 tumors, the transcriptomic data of YTN2 and YTN16 cell lines were compared. There were several differences in the levels of gene expressions associated with cytokine–cytokine receptor interaction, chemokine signaling, adhesion molecules and metabolism between these two cell lines (online supplemental tables 8 and 9). Of note, CCL20 that binds to CCR6 and recruits Th17 cells was present only in YTN16 (figure 4J).17 18
Supplemental material
Supplemental material
Antitumor activity of IL-17 blockade
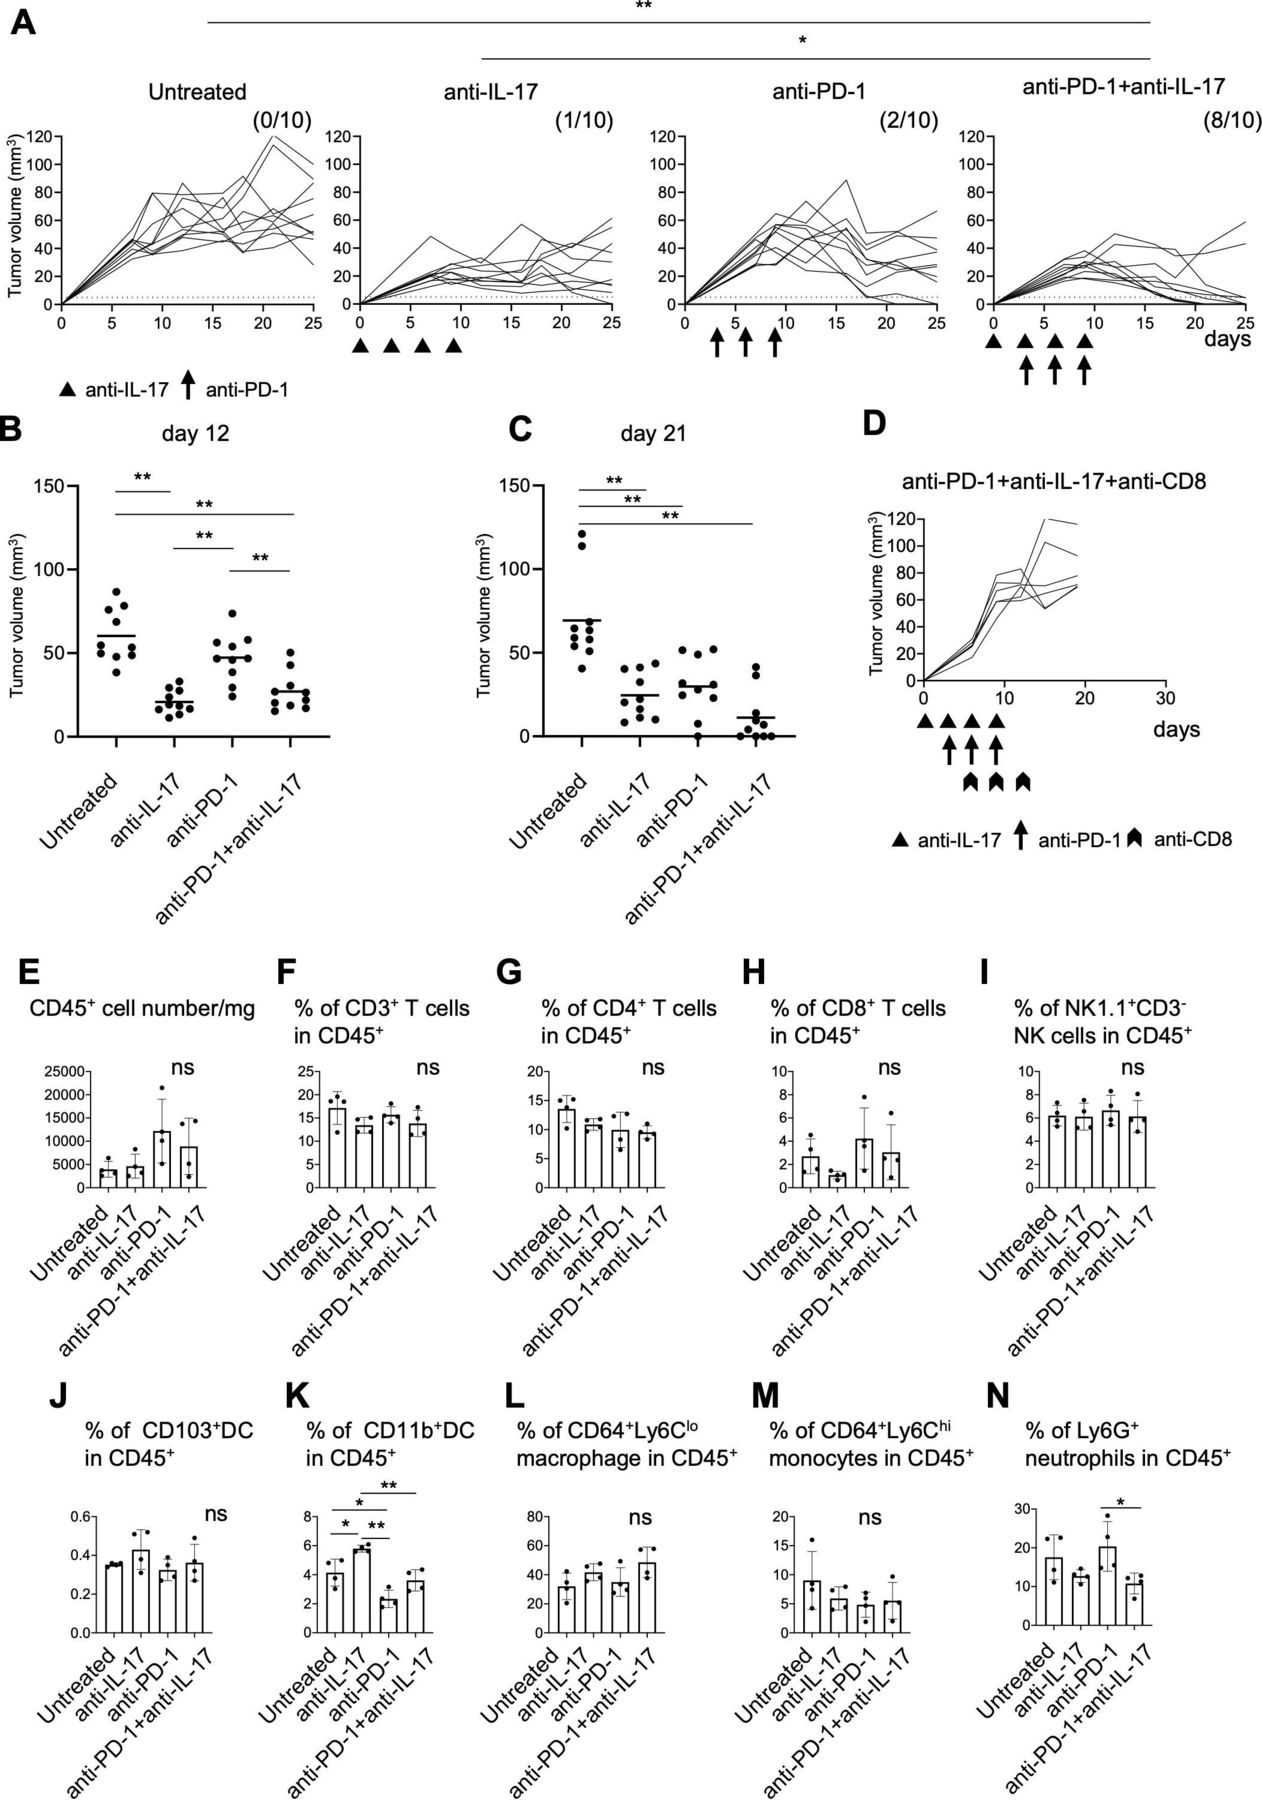
To elucidate the function of IL-17 in the TME, we tested the effects of anti-IL-17 blocking mAb on YTN16 tumor growth (figure 5A). Mice were inoculated with 5×10⁶ YTN16 cells on day 0. Anti-IL-17 mAb (200 µg/mouse) was intraperitoneally injected on days 0, 3, 6 and 9. Anti-IL-17 blockade reduced YTN16 tumor growth; tumor growth was arrested on day 7 and tumors remained small, but most were not completely eliminated; the tumor was completely rejected in only 1 of 10 mice (figure 5A–C).

Combination therapy with anti-interleukin-17 (anti-IL-17) and PD-1 checkpoint blockade. (A) Mice (n=10) were inoculated with 5×10⁶ YTN16 tumor cells on day 0. Anti-IL-17 mAb (200 µg/mouse) and/or anti-programmed cell death protein 1 (PD-1) mAb (200 µg/mouse) were intraperitoneally injected on days 0, 3, 6 and 9 and days 3, 6 and 9, respectively. Tumor volumes were monitored every 2–3 days. The numbers of tumor-free mice on day 25 are shown. *p<0.05; **p<0.01, Fisher’s exact test, p values were adjusted for multiple comparisons according to Hochberg’s method. Tumor volumes on days 12 (B) and 21 (C) are shown. Each dot indicates tumor volume in an individual mouse. (D) Mice (n=5) were subcutaneously inoculated with 5×10⁶ YTN16 tumor cells on day 0 and received anti-IL-17 and anti-PD-1 combination therapy. Anti-CD8 antibody was injected on days 6, 9 and 12 to deplete CD8+ T cells. (E–N) Tumors (n=4) were harvested 10 days after tumor cell inoculation and subjected to flow cytometry. Bar graphs show absolute numbers of CD45+ cells (E), percentages of CD3+ T cells (F), CD4+ T cells (G), CD8+ T cells (H), NK1.1+CD3- NK cells (I), CD103+DC (J), CD11b+DC (K), CD64+Ly6Clo macrophages (L), CD64+Ly6Chi monocytes (M), and Ly6G+ neutrophils (N). *p<0.05; **p<0.01, one-way analysis of variance with Tukey testing for multiple comparisons. PD-1, Programmed cell death protein 1.
Thus, IL-17 blockade suppressed the growth of the tumors but by itself could not eliminate them, probably because T cell responses were not improved by IL-17 blockade alone. Therefore, YTN16 tumor-bearing mice were treated with a combination of anti-IL-17 and anti-PD-1 mAbs. On anti-PD-1 mAb monotherapy, tumor growth peaked on days 7~10 and gradually decreased thereafter. However, tumors were rejected in only two of 10 mice, similar to that when using anti-IL-17 monotherapy. In contrast, a combination of both anti-IL-17 and anti-PD-1 mAbs caused robust tumor regression and resulted in their complete elimination in 8 of 10 mice (figure 5A–C). The depletion of CD8+ T cells abrogated YTN16 rejection (figure 5D), suggesting that the antitumor activity of the combination therapy was CD8+ T cell-dependent.
Modulation of the TME by IL-17 blockade
To examine the effects of these treatments on the TME, TICs were harvested from day 10 tumors and analyzed by flow cytometry (figure 5E–N). No differences were observed in the percentages of CD3+, CD4+, CD8+ T cells, NK cells, CD103+DC, CD64+Ly6Clo macrophages, or CD64+Ly6Chi monocytes among the TICs of these four groups (ie, untreated, anti-IL-17 alone, anti-PD-1 alone, or anti-IL-17 plus anti-PD-1). The percentage of CD11b+DC was increased by anti-IL-17 mAb treatment and decreased by anti-PD-1 mAb treatment (figure 5K). Although not statistically significant, anti-PD-1 treatment tended to increase the recruitment of Ly6G+ neutrophils (figure 5N). Combination treatment decreased the percentage of Ly6G+ neutrophils compared with anti-PD-1 mAb alone (p<0.05).
To investigate the molecular regulatory mechanisms of IL-17 in the TME, mRNA expression profiles were analyzed by bulk RNA-Seq in day 10 YTN16 tumors from treated and untreated mice (figure 6). Anti-IL-17 monotherapy did not alter the TME of YTN16 tumors relative to untreated mice (figure 6A,B), but anti-PD-1 monotherapy or combination treatment with anti-IL-17 resulted in upregulation of the gene signatures for CD4+ T cells, CD8+ T cells, NK cells, DCs and macrophage activation, monocyte chemotaxis and neutrophil activation (figure 6B). However, combined with anti-IL-17 mAb treatment, these alterations were reduced, especially neutrophil activation, relative to anti-PD-1 monotherapy (figure 6C). As shown in figure 6D, bulk RNA-Seq demonstrated that the levels of Ccl6-9, Cxcl1, Cxcl3, Cxcl5 and Cxcl12 expressions were upregulated in anti-PD-1-treated tumors. These chemokines were known to recruit CCR1+, CXCR1+, CXCR2+, and CXCR4+ cells, respectively.
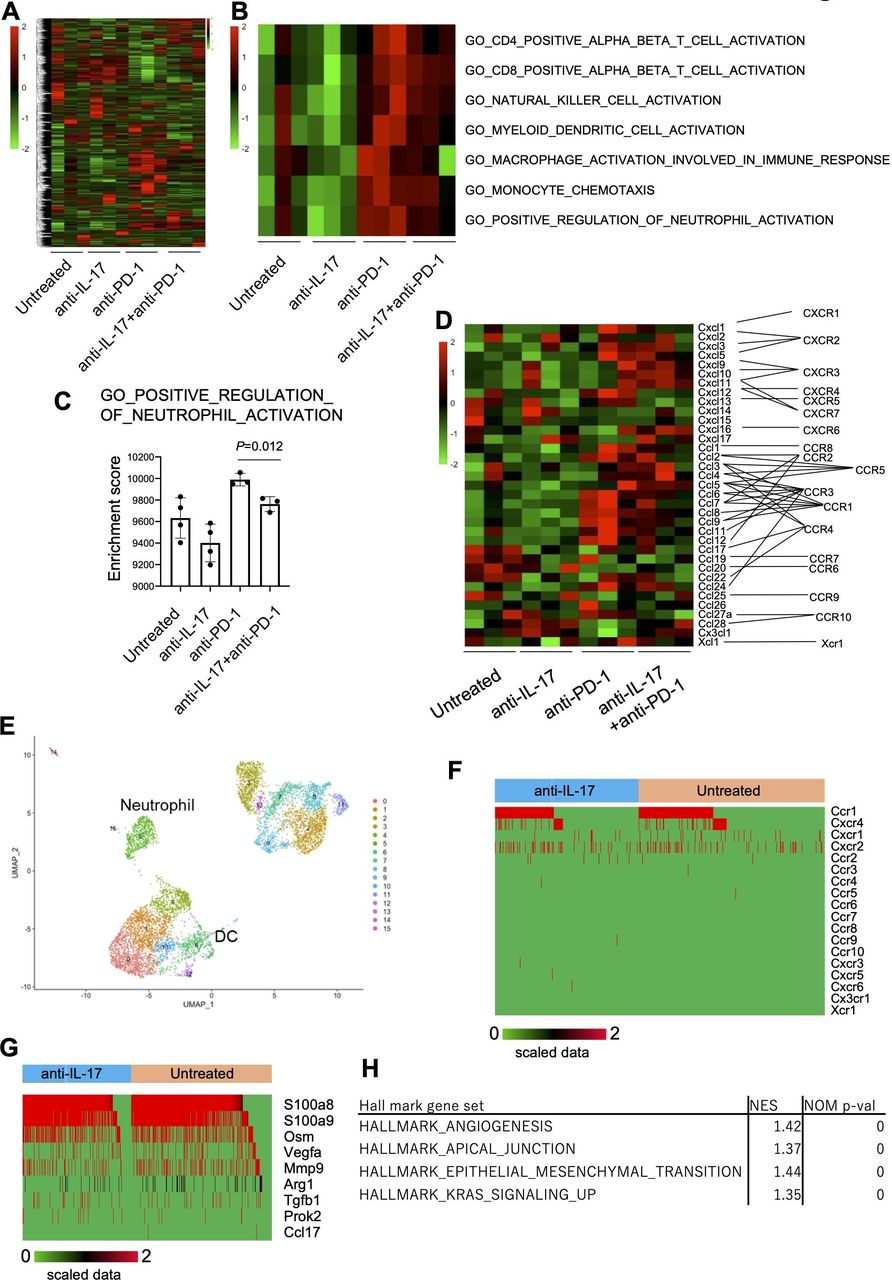
Inhibition of neutrophil infiltration and angiogenesis by interleukin-17 (IL-17) signaling blockade. Mice (n=3) were treated as described in the legend to figure 5. Tumors were harvested 10 days after inoculation and bulk-RNA-Seq was performed. (A) Heatmap of hierarchical clustering analysis of normalized and scaled counts. (B) Heatmap showing scaled ssGSEA enrichment scores. (C) ssGSEA enrichment scores of GO_POSITIVE_REGULATION_OF_NEUTROPHIL_ACTIVATION are shown. (D) The expression of chemokine transcripts in the tumor was shown. (E) CD45+ cells were sorted from untreated or anti-IL-17 mAb-treated day 10 YTN16 tumors and subjected to droplet-based single-cell RNA-Seq (scRNA-Seq). UMAP projections of scRNA-Seq data for CD45+ cells in anti-IL-17 mAb treated and untreated YTN16 tumors (n=8214). The number of cells in each cluster was shown in online supplemental table 10. (F) Chemokine receptor expression in neutrophils (n=636). (G) The expression of functional molecules in neutrophils. (H) GSEA using hallmark gene sets was performed on bulk RNA-Seq data. Gene sets enriched in anti-PD-1 at p<0.05 are shown. DC, dendritic cell. UMAP, Uniform manifold approximation and projection.
Supplemental material
To further examine myeloid cells in TICs, we sorted CD45+ TICs from anti-IL-17 treated and untreated YTN16 tumors on day 10 and performed droplet-based scRNA-Seq (figure 6E and online supplemental table 10). A total of 8214 CD45+ cells (3798 and 4416 cells from untreated and anti-IL-17-treated tumors, respectively) were subjected to cluster analysis using FindNeighbors and FindClusters functions of Seurat (V.3.1.5). Cells in neutrophil cluster express Ccr1, Cxcr4, Cxcr1 and Cxcr2 (figure 6F). Therefore, neutrophils were recruited into YTN16 tumors, especially anti-PD-1-treated tumors, which strongly expressed these ligands (figure 6D). They also expressed S100a8, S100a9, Osm (oncostatin-M), Vegfa, Mmp9, Arg1 and Tgfb1 (figure 6G). These results were consistent with GSEA using bulk RNA-Seq data. GSEA of upregulated and downregulated genes on combination therapy using HALLMARK gene sets identified angiogenesis, apical junction, epithelial-mesenchymal transition, and KRAS signaling were enriched among the downregulated genes (figure 6H). These results indicate that IL-17 blockade modulated the immunosuppressive microenvironment by inhibiting neutrophil recruitment into the tumor, which in turn resulted in decreased angiogenesis and EMT transition.
Neoantigen-specific CD8+ T cells
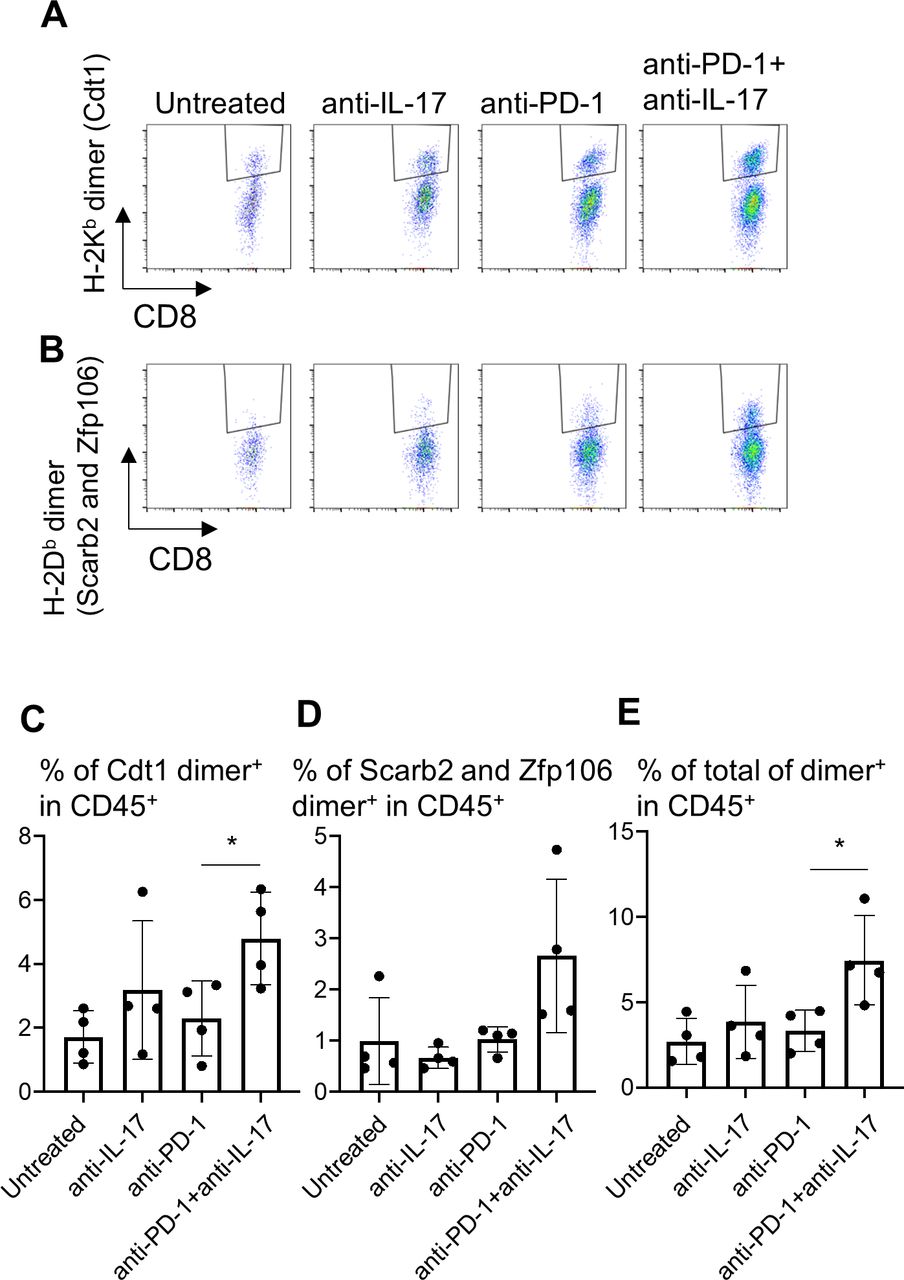
To examine the effects of immune modulation by IL-17 blockade on tumor-specific T cell responses, the infiltration of neoantigen-specific CD8+ T cells into the tumors was investigated (figure 7). We have established YTN16-specific CTLs from spleens of mice that rejected YTN16 tumors. We also showed that these cytotoxic T lymophocytes (CTLs) recognize the mutation-associated neoantigens H-2Kb-restricted mutant Cdt1 (mCdt1), H-2Db-restricted mutant Scarb2 (mScarb2) and mutant Zfp106 (mZfp106) (manuscript in preparation). Therefore, we prepared H-2Db and H-2Kb dimeric molecules with corresponding neoepitope peptides to detect the presence of neoantigen-specific CTLs in the tumor. H-2Kb-restricted mCdt1-specific CD8+ T cells and H-2Db-restricted mScarb2-specific and mZfp106-specific CD8+ T cells in TICs from day 20 tumors were analyzed (figure 7A,B). Neoantigen-specific CD8+ T cells were induced and recruited into YTN16 tumors regardless of the treatment. Anti-IL-17 alone or anti-PD-1 monotherapy did not increase neoantigen-specific CD8+ T cells in the tumor, while combination therapy increased the sum of mCdt1-specific, mScarb2-specific and mZfp106-specific CD8+ T cells (figure 7C–E).

Therapy combining anti-interleukin-17 (anti-IL-17) with anti-PD-1 increases neoantigen-specific CD8+ T cell infiltration into YTN16 tumors. YTN16 tumor cells were inoculated into four mice as in figure 5. On day 20, tumors were harvested, and tumor-infiltrating cells (TICs) were stained with MHC class I dimer complexed with neoantigen peptides. (A) Dot plots show H-2Kb-restricted mCdt1-specific CD8+ T cells and (B) H-2Db-restricted mScarb2-specific and mZfp106-specific CD8+ T cells. (C) Bar graphs show the percentages of H-2Kb-dimer+ CD8+ T cells in CD45+ TICs. (D) The percentage of H-2Db-dimer+ CD8+ T cells in CD45+ TICs. (E) The sum of these dimer+ CD8+ T cells in CD45+ cells. *p<0.05, Student’s t-test between anti-PD-1 and anti-PD-1+anti-IL-17. MHC, major histocompatibility complex; PD-1, Programmed cell death protein 1.
Discussion
YTN2 and YTN16 gastric cancer cell lines are subclones of one line established from a tumor induced by N-methyl-N-nitrosourea treatment of a male heterozygous p53 knockout mouse.8 YTN2 spontaneously regresses in C57BL/6 mice in a CD8+ T cell-dependent manner, while YTN16 grows progressively (figure 1). These two related cell lines both harbor a similar number of mutation-associated neoantigens. They offer an excellent model for investigating the mechanisms of resistance to antitumor immunity.
Bulk RNA-seq demonstrated that more T cell-dependent immune responses were active in YTN2 than YTN16 tumors (figure 1); however, the presence of small subpopulations of tumor-infiltrating immune cells cannot be precisely determined in this way. In contrast, our targeted scRNA-Seq can detect very small populations and in this study resulted in the identification of IL-17-producing T cells in YTN16 tumors (figure 3). IL-17 signaling was not detected in YTN16 tumors by the analysis of DEGs by bulk RNA-Seq, probably because the IL-17 signals were swamped by the expression of many other genes in the tumors. Given the presence of IL-17-producing cells, upstream CCL20 production by YTN16 cancer cells (figure 4J)17 18 and downstream recruitment of neutrophils19 as detected by flow cytometry (figure 2I), bulk RNA-Seq (figure 6B) and scRNA-Seq (figure 6E) was not unexpected. Based on these data, mice were treated with anti-IL-17 mAb, resulting in the inhibition of neutrophil recruitment (figure 5N). A combination of anti-IL-17 and anti-PD-1 mAb treatment eradicated YTN16 tumors, associated with increased infiltration of neoantigen-specific CD8+ T cells into the tumors (figure 7).
Currently, nivolumab, anti-PD-1 mAb, was approved in several countries for the second-line or third-line treatment of gastric cancer.20 21 However, not all patients respond equally well to therapy and only a subset of patients experiences durable responses and favorable long-term outcomes. Several combinations of immunotherapy with chemotherapy,22–24 molecular targeted drugs,25 or combinations of different ICIs26 27 are now approved for the first-line treatment of various cancers. To select appropriate combination immunotherapy, identification of the impaired steps of the antitumor immune response in each patient individually is warranted. In this study, we identified IL-17->neutrophil axis and successfully eradicated YTN16 tumors by the combination of PD-1 and IL-17 blockade. Besides PD-1, dysfunctional T cells in YTN16 tumors expressed CTLA-4, VISTA, and TIGIT (online supplemental figure 2). Targeting these signaling is also expected for the combination of immunotherapy.
IL-17 has dual aspects of tumor-promoting and tumor-protecting functions.28 As Coffelt et al 16 reported, IL-17 producing γδ T cells and neutrophils suppressed cytotoxic CD8+ T cells and promoted breast cancer metastasis; IL-17 is now being examined as a cause of tumor progression and resistance to therapy. It has been reported that IL-17 signature was associated with the resistance to anti-PD-1 therapy in colorectal cancer29 and melanoma.30 In this preclinical model, we identified CD4+ T cells and γδ T cells in the tumor produced IL-17. IL-17 and neutrophil axis was indeed responsible for the resistance to anti-PD-1 treatment; the combination blockade of both signaling successfully eradicated the YTN16 tumors in CD8+ T cell-dependent manner (figure 5A,D).
We also observed the increased or decreased recruitment of CD11b+DC into YTN16 tumors by anti-IL-17 or anti-PD-1 treatment, respectively (figure 5K). By scRNA-Seq, CD11b+DC expressed Ccr1, Ccr2 and Ccr5 (online supplemental figure 4). However, we could not detect corresponding changes in their ligand expressions in the tumor by bulk RNA-seq (figure 6D). We need to improve the sensitivity of these assays. It has been reported that CD103-CD11b+DC induced IL-17 producing T cells.31 The increased recruitment of CD11b+ DC might counteract the anti-IL-17 treatment, although molecular mechanisms remain to be elucidated.
We have previously reported that tumor growth, metastatic rate and peritoneal dissemination rate of YTN16 were higher than YTN2; FGFR4 expression by YTN16 cells was 121-fold higher than YTN2.8 We demonstrated that FGFR4 disruption by CRISPER-Cas9 system or pharmacological inhibition of FGFR signaling in YTN16 resulted in the reduction of peritoneal dissemination. In this study, we focused on the immunological aspects of these two tumor cell lines. YTN2 expressed more proinflammatory molecules than YTN16 (online supplemental table 8), while YTN16 expressed CCL20 that triggered the formation of an immunosuppressive microenvironment (figure 4J). We successfully demonstrated that the TME shaped by the different gene expressions of these tumor cells, as well as the signals for tumor proliferation, is also a good therapeutic target.
Immune profiling, including bulk transcriptome assays with microarrays or bulk RNA-Seq as well as fluorescence-based flow cytometry, contributes valuable insights into the mechanisms behind tumor-immune cell interactions and can uncover mechanisms and biomarkers for prediction of therapeutic responses.32 Recently, high-dimensional technologies such as scRNA-Seq and cytometry by time of flight (CyTOF) are being increasingly employed for immune profiling in cancer in order to detect rare immune subsets and dissect phenotypic and functional heterogeneity.33 34 Using these new technologies, deep immunophenotyping at the single-cell level is possible in the individual patient.
CyTOF can be employed to analyze TME components using more than 40 markers at the single-cell level by means of panels of antibodies conjugated with stable isotopes of rare earth metals.35 In the present study, we have developed a highly efficient nucleic acid reaction chip (a VFAC),7 which we used for targeted scRNA-Seq of a panel of 44 genes (online supplemental table 1) to identify unique subtypes of T cells at the single-cell level. Thus, our targeted scRNA-Seq in this study was similar to the CyTOF in terms of the number of genes or gene products analyzed. Of note, scRNA-Seq has the potential of expanding the number of target genes to thousands (at a cost). A limitation of this study is that the genes analyzed by scRNA-Seq were limited to those related to T cell phenotypes and functions. Another limitation is that although we identified IL-17-producing T cells in YTN16 tumors using our targeted scRNA-Seq system, other immunosuppressive mechanisms that might also be operating in YTN16 tumors were not investigated. These might have been responsible for the 2 of 10 mice that were not cured by combined anti-IL-17 and anti-PD-1 treatment. Additional appropriate targets might be detected by using panels of genes for other immunosuppressive molecular pathways. This issue could be resolved by incorporating additional genes into the test panels. Thus, targeted scRNA-Seq is a flexible tool for analyzing the TME using custom panels of the genes of interest; we are, for example, currently preparing gene panels for myeloid cells.
The future of immunotherapy will be combinatorial and personalized treatments adapted to each patient’s cancer-immune interactions in the TME. Clearly, instigating this type of personalized therapy will be challenging for many reasons, not the least of which will be the high cost and labor-intensive nature. However, it is to be expected that technical advances will overcome some of these difficulties. Fortunately, the cost of NGS is decreasing every year, and the development of a cost-effective targeted scRNA-Seq platform using our original VFAC will hopefully contribute to this. Here, we have demonstrated that such an approach with high-dimensional targeted scRNA-Seq is feasible in a mouse model. Based on the deep immunophenotyping data obtained by flow cytometry, bulk RNA-Seq and scRNA-Seq, YTN16 tumor-bearing mice were treated with both IL-17 and PD-1 blockade, leading to the increased infiltration of neoantigen-specific CD8+ T cells into the tumors and their eradication. This approach can equally well be applied to human tumors. Deep phenotyping of the TME of each patient will be a useful guide to potential individual target molecules or cells and to determining the therapeutic strategies to be adapted for each patient.
Conclusions
We developed a cost-effective targeted scRNA-Seq using VFACs for deep immunophenotyping of the TME. In tumor-bearing mice, we demonstrated that the immunological insights acquired using these assays led to the design of personalized combination immunotherapy.
Supplemental material
Acknowledgments
We thank Ms Mikiko Shibuya and Ms Jelena Arsenic for their excellent technical assistance.
References
Supplementary materials
Supplementary Data
This web only file has been produced by the BMJ Publishing Group from an electronic file supplied by the author(s) and has not been edited for content.
Footnotes
Contributors KN and KK conceived the study. SN established and maintained gastric cancer cell lines. MS and KT performed targeted scRNA-Seq. KN, AH, and CS performed in vivo experiments. KN, YK, KM, and MF carried out bioinformatic analyses. KN, MS, HN and KK interpreted experimental data. KN and KK wrote the manuscript. All authors read and discussed the manuscript.
Funding This work was financed from RIKEN institutional support. This study was also supported in part by the Japan Agency for Medical Research and Development (AMED) Project for Cancer Research and Therapeutic Evolution (P-CREATE).
Disclaimer The funders had no role in study design, data collection and analysis, interpretation, decision to publish, or preparation of the manuscript; or any aspect of the study.
Competing interests KK reports grants from TAKARA BIO, grants from MSD, outside the submitted work. The Department of Immunotherapeutics, University of Tokyo Hospital, is endowed by TAKARA BIO.
Patient consent for publication Not required.
Ethics approval The animal use proposal and experimental protocol have been reviewed and approved by The University of Tokyo Animal Care and Use Committee (ID: P15-125) and all animal procedures were conducted following institutional guidelines.
Provenance and peer review Not commissioned; externally peer reviewed.
Data availability statement Data are available in a public, open access repository. Data are available in the Gene Expression Omnibus (GEO) database (GSE146027, GSE153231, GSE152888 and GSE156725).
Supplemental material This content has been supplied by the author(s). It has not been vetted by BMJ Publishing Group Limited (BMJ) and may not have been peer-reviewed. Any opinions or recommendations discussed are solely those of the author(s) and are not endorsed by BMJ. BMJ disclaims all liability and responsibility arising from any reliance placed on the content. Where the content includes any translated material, BMJ does not warrant the accuracy and reliability of the translations (including but not limited to local regulations, clinical guidelines, terminology, drug names and drug dosages), and is not responsible for any error and/or omissions arising from translation and adaptation or otherwise.