Article Text

Abstract
Background NF-κB is a key link between inflammation and cancer. Previous studies of NF-κB have largely focused on tumor cells, and the intrinsic function of NF-κB in T cells in tumor development and response to immunotherapy is largely unknown. We aimed at testing the hypothesis that NF-κB1 (p50) activation in T cells underlies human colon cancer immune escape and human cancer non-response to anti-PD-1 immunotherapy.
Methods We screened NF-κB activation in human colon carcinoma and used mouse models to determine p50 function in tumor cells and immune cells. RNA-Seq was used to identify p50 target genes. p50 binding to target gene promoters were determined by electrophoresis mobility shift assay and chromatin immunoprecipitation. A p50 activation score was generated from gene expression profiling and used to link p50 activation to T-cell activation and function pre-nivolumab and post-nivolumab immunotherapy in human patients with cancer.
Results p50 is the dominant form of NF-κB that is highly activated in immune cells in the human colorectal carcinoma microenvironment and neighboring non-neoplastic colon epithelial cells. Tumor cell intrinsic p50 signaling and T-cell intrinsic p50 signaling exert opposing functions in tumor growth control in vivo. Deleting Nfkb1 in tumor cells increased whereas in T cells decreased tumor growth in preclinical mouse models. Gene expression profiling identified Gzmb as a p50 target in T cells. p50 binds directly to a previously uncharacterized κB sequence at the Gzmb promoter in T cells, resulting in repression of Gzmb expression in tumor-infiltrating cytotoxic T lymphocytes (CTLs) to induce a dysfunctional CTL phenotype to promote tumor immune escape. p50 activation is inversely correlated with both GZMB expression and T-cell tumor infiltration in human colorectal carcinoma. Furthermore, nivolumab immunotherapy decreased p50 activation and increased GZMB expression in human patients with melanoma.
Conclusions Inflammation activates p50 that binds to the Gzmb promoter to repress granzyme B expression in T cells, resulting in CTL dysfunction to confer tumor immune escape and decreased response to anti-PD-1 immunotherapy.
- CD8-positive T-lymphocytes
- gastrointestinal neoplasms
- immune evation
- immunotherapy
- inflammation
This is an open access article distributed in accordance with the Creative Commons Attribution Non Commercial (CC BY-NC 4.0) license, which permits others to distribute, remix, adapt, build upon this work non-commercially, and license their derivative works on different terms, provided the original work is properly cited, appropriate credit is given, any changes made indicated, and the use is non-commercial. See http://creativecommons.org/licenses/by-nc/4.0/.
Statistics from Altmetric.com
Background
Chronic inflammation is an established driver of human cancer.1 In human patients with inflammatory disease such as ulcerative colitis, massive accumulation of immune cells, particularly T cells, immature myeloid cells and/or myeloid-derived suppressor cells is a hallmark of colonic inflammation. It has recently been determined that myeloid cells induce genome-wide DNA mutations in intestinal epithelial cells.2 It is therefore not surprising that both colitis-associated human colorectal cancer and adjacent non-neoplastic colon epithelial cells from patients with colitis harbor abundant somatic mutations.3 While these somatic mutations may drive epithelial cell tumorigenesis, they also serve as neoantigens to elicit tumor-reactive cytotoxic T lymphocytes (CTLs).4 This is also consistent with the early findings that colon cancer is under constant host immunosurveillance by T cells.5 Therefore, it might be expected that the host immune system would naturally eliminate transformed epithelial cells and early-stage tumors long before the clinically relevant tumor occurs. However, this does not happen since patients with ulcerative colitis have a significantly higher risk of developing colorectal cancer.1 It is likely that colonic inflammation compromises CTL effector functions, resulting in transformed epithelial cell immune escape and tumor development despite significant tumor mutation burden that serves as neoantigens. However, this is a hypothesis that remains to be tested.
NF-κB is a key molecule that links inflammation to cancer and NF-κB deficiency in intestinal epithelial cells decreased colon tumorigenesis.6 Emerging data indicate a key role of NF-κB in regulation of immune cell activation and function in the context of tumor development. It is well documented that myeloid cell intrinsic NF-κB signaling promotes tumor initiation and progression.7–12 NF-κB may directly and indirectly regulate T-cell activation, tumor infiltration and function.7–10 13–16 However, polymorphisms in NFKB1 that diminish its expression have been linked to increased risk of colorectal cancer in humans.17 18 Furthermore, NF-κB1–deficient mice develop gastric cancer and this gastric cancer development requires loss of Nfkb1 in both epithelial and hematopoietic cells.19 This contrasting function of NF-κB in tumor development is at least attributed to its function in regulating T-cell tumor infiltration.12 20 21 Despite these extensive studies, the intrinsic function of NF-κB in T cells in the context of tumor immune evasion and response to immunotherapy, however, is still incompletely understood. We report here the identification of NF-κB1 p50 (termed p50 thereafter) as a transcriptional repressor of Gzmb, the gene that encodes T-cell effector granzyme B, in T cells, and a key function of the p50–Gzmb axis in tumor immune evasion and response to anti-PD-1 immunotherapy.
Methods
Human tumor specimens and clinical datasets
Human colon carcinoma tumor specimens and matched tumor adjacent non-neoplastic colon tissues were provided by Dr. Shannon McCall, Ms. Aubrey Coulas and Ms. Kellie Soafer at the Cooperative Human Tissue Network Southern Division (BioRepository & Precision Pathology Center, Duke University, Durham, NC). The patient pathological and treatment reports are presented in online supplemental table S1. Human colorectal cancer patient datasets were extracted from UCSC xenabrowser TCGA Colon and Rectal Cancer (COADREAD) database. Survival analyses were calculated using the R survival and survminer packages. Datasets from human patients with melanoma with nivolumab immunotherapy were obtained from the BMS038 trial (https://www.ncbi.nlm.nih.gov/pubmed/29033130, GSE91061). All studies with human specimens were performed under a protocol approved by Augusta University Institutional Review Board (#1354508-1).
Supplemental material
Mice and cell lines
C57BL/6J, Nfkb1 KO (p50 KO, B6.Cg-Nfkb1tm1Bal /J), Relafl mice (B6.129S1-Relatm1Ukl /J) and Lck-cre (B6.Cg-Tg(Lck-cre)548Jxm/J) were obtained from the Jackson Laboratory (Bar Harbor, ME). WT and p50 KO chimera mice were created by adoptively transferring bone marrow cells from WT and p50 KO mice to lethally irradiated (900 RAD) recipient C57BL/6J mice. All animal studies are approved in advance by Augusta University Institutional Animal Care and Use Committee. The murine colon epithelial cell line MC38 were provided by Dr. Jeffrey Schlom. EL4 T cells were obtained from ATCC.
Mouse tumor models
Mice were injected with azoxymethane (AOM, Sigma-Aldrich, 10 mg/kg body weight) intraperitoneally once, followed by administration of 2% dextran sulfate sodium (DSS; MP Biomedicals, Santa Ana, CA) through the drinking water 1 day later for 1 week. DSS was replaced with water for 2 weeks. The DSS/water cycle was repeated two more times. Mice were maintained with regular drinking water for one more month after the third cycle and then sacrificed for analysis. Colon tissues were dissected from the mice, flushed and cleaned with PBS, and cut open longitudinally to examine tumor nodules. Anti-PD-1 immunotherapy in the MC38 tumor model was performed as previously described.22
RNA sequencing and p50 signature gene panel identification
RNA was purified from tumor tissues collected from the AOM–DSS-induced tumors in WT and p50 KO mice. RNA-Seq was performed in Novogene Corp. Genes in p50 score were identified as those having >2-fold change in expression and adjusted p value <0.05. Genes were then filtered to known human NFKB targets using an online database (https://www.bu.edu/nf-kb/gene-resources/target-genes/). p50 score was calculated using the singscore R package.
Flow cytometry, RT-PCR analysis and Western blotting analysis
Flow cytometry, NF-κB activation, RT-PCR and Western blotting analysis were performed as previously described.23 The sequences of primers are listed in online supplemental table S2. All antibodies are listed in online supplemental table S3.
Electrophoresis mobility shift assay (EMSA)
Eight putative κB DNA sequences at the Gzmb promoter region were identified using the MacVector program (Apex, NC). These sequences are for all NF-κB subunits. Oligonucleotides were synthesized based on these sequences. The DNA probes containing these κB sequences are P1 (GAGGGCAGAGGTCTTTCTCAG), P2 (TTGGGAAAGTGTCAATTGTAG), P3 (GCAAAGTGGATCTTCCTAGAA), P4 (CATAGAATCCTCTAGATGCTA), P5 (CAGTCAGTGATTCCACTTTCA), P6 (TCTGCAAAGTGGATCTTCCTA), P7 (GTGTTGGAGCTTTCCATTTAT) and P8 (CAGAAGGAAATTTCCCAAATC). The positive control κB probe sequence is AGTTGAGGGGACTTTCCCAGGC (Santa Cruz cat no. sc-2505). The end-labeled probes were incubated with nuclear extracts with IgG or specific antibodies and analyzed.
Chromatin immunoprecipitation (ChIP)
ChIP was performed using anti-p50 (Santa Cruz) and the Chromatin Immunoprecipitation (ChIP) Assay Kit (Millipore, Burlington, MA) according to the manufacturer’s instructions. Normal rabbit IgG (Santa Cruz Biotechnology, Dallas, TX) was used as negative control for the antibody. The immunoprecipitated genomic DNA was amplified by qPCR using PCR primers (online supplemental table S2) covering the region of the Fas and Gzmb promoter regions.
Immunohistochemistry
Immunohistochemistry was performed essentially as described previously.22 Human and mouse tissue sections were probed with Anti-p50 antibody (Santa Cruz) overnight at 4°C, followed by incubation with HRP Universal Anti-Mouse/Anti-Rabbit IgG Antibody (Vector Laboratories, Burlingame, CA) according to the manufacturer’s instructions.
Statistical analysis
Statistical comparisons between any two groups were conducted using unpaired two-tailed Student t-test and p values were indicated in their corresponding graphs. GraphPad Prism program was used to analyze correlation and linear regression. P values <0.05 were considered as statistically significant, and error bars are indicated as mean±SD. Two-factor analysis of variance using SAS V.9.4 and an overall alpha level of 0.05 was performed to examine the effect of treatment on tumor volume and weight between the WT and p50 KO mice. The main effects of mouse strain and treatment and two-factor interaction were included in each model, and the statistical test of interest was the F-test for the two-factor interaction. A Tukey multiple comparison procedure was used to examine post hoc differences between mouse strain and treatment groups.
Results
Colonic inflammation preferentially activates p50 in colonic and tumor microenvironment
The subunits of NF-κB complexes have contrasting functions in tumor development.12 14 15 19 24 We first aimed at profiling inflammation-driven NF-κB activation using a DNA probe with κB consensus sequence for all five Rel subunits. In the colitis model, p50 activation was predominant in the inflamed non-neoplastic colon over the other four NF-κB Rel subunits (figure 1A). A similar p50 activation profile was also observed in the colon carcinoma of the AOM–DSS colon cancer model (figure 1B). It seems that p50 also primarily exist as p50–p50 homodimer in the inflamed colon and colon carcinoma since no significant activation of the other four Rel subunits were detected (figure 1A,B). DSS-mediated inflammation induced p50 activation in the colon in a time-dependent manner (figure 1C, online supplemental figure S1). In addition, the degree of colonic inflammation is correlated with p50 activation (online supplemental figure S1). The p50 protein level also increased with time and correlated with increased activation and the degree of colonic inflammation (online supplemental figure S1). The colon-infiltrating immune cells have higher level of p50 protein than the colon epithelial cells (online supplemental figure S1).

Colonic inflammation induces p50 activation primarily in immune cells in colon carcinoma and neighboring colon epithelium. (A) EMSA of NF-κB activation in DSS-treated colon tissues. The five NF-κB subunit-specific antibodies as indicated were used to identify activation of the respective subunits. The black arrow indicates the NF-κB–DNA complexes and the blue arrow indicates supershift. Shown are representative results of one of two mice. (B) EMSA of NF-κB activation in AOM–DSS-induced colon carcinoma. Shown are representative results of one of three tumor-bearing mice. (C) EMSA of NF-κB activation kinetics in DSS-treated colon as indicated. (D) Human colon carcinoma (A1 and 2) and the matched adjacent non-neoplastic colon tissues (B1 and 2) were stained with p50-specific antibody. Shown are representative images of one pair of 10 patients with colon cancer. Scale bar=100 µM. A2 is magnified image of A1 and B2 is magnified image of B1. (E) Epithelial cells, tumor cells and immune cells in the colons and colon carcinoma as shown in (D) were examined and counted for nuclear p50 staining in each matched pair of tumor and non-neoplastic colon tissues. The % p50 nucleus+ cells are used as p50 activation. (F) Datasets of NFKB1 mRNA in human colorectal carcinoma (n=380) and normal colon tissues (n=51) were extracted from TCGA database and plotted as dot plot.
Ten matched pairs of human colon carcinoma and adjacent non-neoplastic colon tissues were analyzed by immunohistochemistry. The nuclear staining of p50 was analyzed and used as marker of p50 activation in epithelial, tumor and immune cells. p50 protein level is higher in colon epithelial cells than in tumor cells (figure 1D,E) and also p50 activation level is higher in colon epithelial cells than in the tumor cells (figure 1D,E). Furthermore, immune cells have higher p50 activation than epithelial cells and tumor cells, respectively (figure 1D,E). As a complimentary approach, analysis of p50 mRNA expression level of human colorectal carcinoma and adjacent non-neoplastic colon from the TCGA database also determined that p50 expression level is significantly higher in the adjacent non-neoplastic colon tissue than in colorectal carcinoma in human patients with colorectal cancer (figure 1F).
p50 promotes tumorigenesis and growth through an immune cell–dependent mechanism
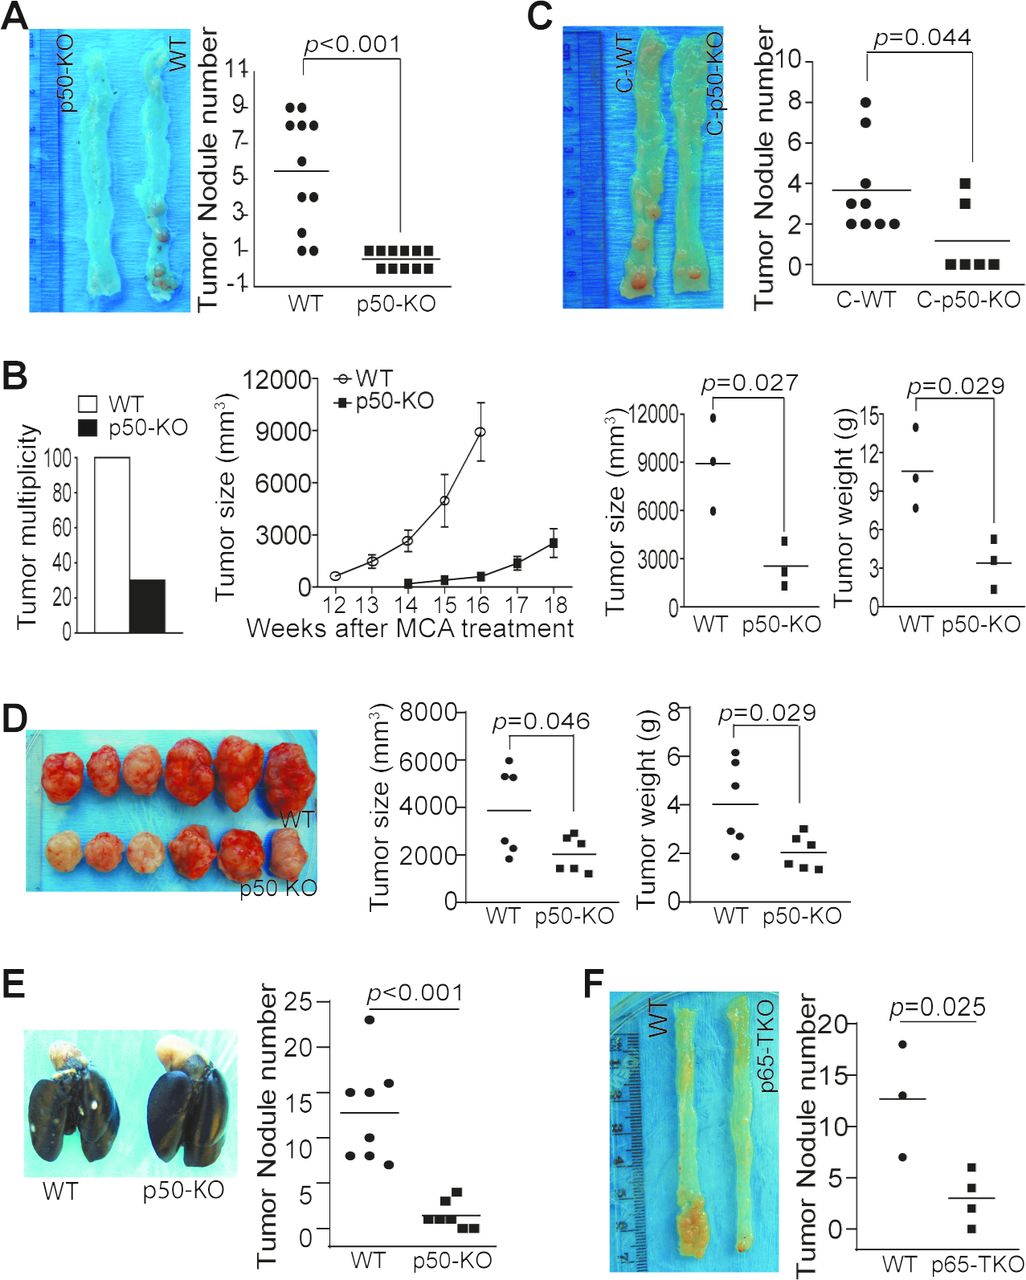
The p50 NF-κB has a contrasting role in tumor development.12 14 15 17–19 24–27 We next aimed at determining the function of p50 in colon tumorigenesis. Colon tumorigenesis incidence was significantly lower in mice with global p50 deficiency as compared with WT mice (figure 2A). p50 deficiency also resulted in a significant decrease in Methylcholanthrene (MCA)-induced tumorigenesis (figure 2B). However, chimera mice with p50 deficiency only in immune cells also exhibited a significant decrease in colon tumorigenesis incidence (figure 2C). Consistent with p50 intrinsic function in immune cells as a tumor promoter, p50-sufficient colon tumor grew significantly slower in mice with p50 deficiency as compared with WT mice (figure 2D,E). We next took advantage of the existing p65-floxed mice and generated mice with p65 deficiency only in T cells (p65 TKO mice). As observed in the p50 chimera mice, the p65 TKO mice developed significantly less tumor than the control mice (figure 2F).

NF-κB negatively regulates T-cell function to promote colon tumorigenesis and growth in vivo. (A) WT (n=11) and p50 KO (n=11) mice were treated with the AOM–DSS cycles. Shown are representative images of tumor-bearing colon tissues and quantification of tumor nodules of pooled results of two independent experiments. (B) WT (n=10) and p50 KO (n=10) mice were treated with MCA. The tumor incidence was determined at the end of the experiments (left panel). Seven WT mice were sacrificed before 12 weeks due to large tumor size. Only the last three WT mice were monitored for tumor growth. Only three of the 10 p50 KO mice developed tumor. Tumor growth was monitored starting at week 14. These three mice were sacrificed at week 18 (middle panel). The tumor size and weight from the three WT and three p50 KO mice were determined at week 16 (WT mice) and week 18 (p50 KO mice) and quantified (right two panels). (C) The WT (n=9) and p50 KO (n=6) chimera mice were treated with the AOM-DSS cycles. Shown are representative images of tumor-bearing colon tissues. The tumor nodule numbers were quantified and presented in the right panel. (D) WT (n=6) and p50 KO (n=6) mice were injected with MC38 cells subcutaneously. Shown are representative images of MC38 tumors (left panel). The tumor size and tumor weight were measured and presented in the right panel. (E) WT (n=8) and p50 KO (n=7) mice were injected with MC38-met cells intravenously. Lungs were collected 16 days later and inflated with ink. Shown are representative images of tumor-bearing lungs and quantification of tumor nodule number. (F) WT (Lck-cre, n=3) and p65 TKO (n=4) mice were treated as in (A). Shown are representative images of tumor-bearing colon tissues from WT and p65 TKO mice (left panel) and quantification of tumor nodules (right panel).
p50 tumor intrinsic signaling suppresses colon tumor growth in vivo
To dissect the relative functions of p50 in tumor cells from immune cells, Nfkb1 gene was knocked out in CT26 cells using CRISPR (online supplemental figure S2A). EMSA confirmed that p50 activation is diminished in p50 KO CT26 cells (online supplemental figure S2A). Interestingly, the p65 NF-κB activation was also diminished in the p50 KO tumor cells (online supplemental figure S2A). In contrast to what was observed in p50 global KO mice, knocking out p50 only in tumor cells significantly increased tumor nodule number in WT mice (online supplemental figure S2B). As in the CT26 cells, p65 activation was also diminished in the p50-deficient MCA tumor cells (online supplemental figure S2C). Again, p50 deficiency only in tumor cells significantly increased tumor growth in vivo (online supplemental figure S2D & 2E). We next blocked the canonical NF-κB activation in CT26 and MC38-met tumor cells using the IκBα-AA super suppressor.28 Blocking NF-κB activation significantly increased tumor nodule numbers in both CT26 and MC38-met experimental metastasis tumor models (online supplemental figure S2F). Taken together, our findings indicate that p50 tumor cell intrinsic signaling acts as a tumor suppressor. p50 immune cell intrinsic function overweighs its intrinsic function in tumor cells.
Our aforementioned findings determined that p50 has opposing functions in T cells and tumor cells in tumor growth control in vivo. To determine the relative contributions of p50 in immune cells and tumor cells, we transplanted WT and p50-deficient tumor cells to NSG mice. As in the immune competent mice (online supplemental figure S2D & 2E), p50-deficient tumor also grew significantly faster than WT tumor in NSG mice (online supplemental figure S3A). However, the degree of increased p50-deficient tumor growth is significantly less in NSG mice as compared with that in C57BL/6 mice (online supplemental figure S3B). This observation indicates that p50 intrinsic function in immune cells overwhelms its intrinsic function in tumor cells in vivo.
Granzyme B is upregulated in p50-deficient tumor-infiltrating immune cells
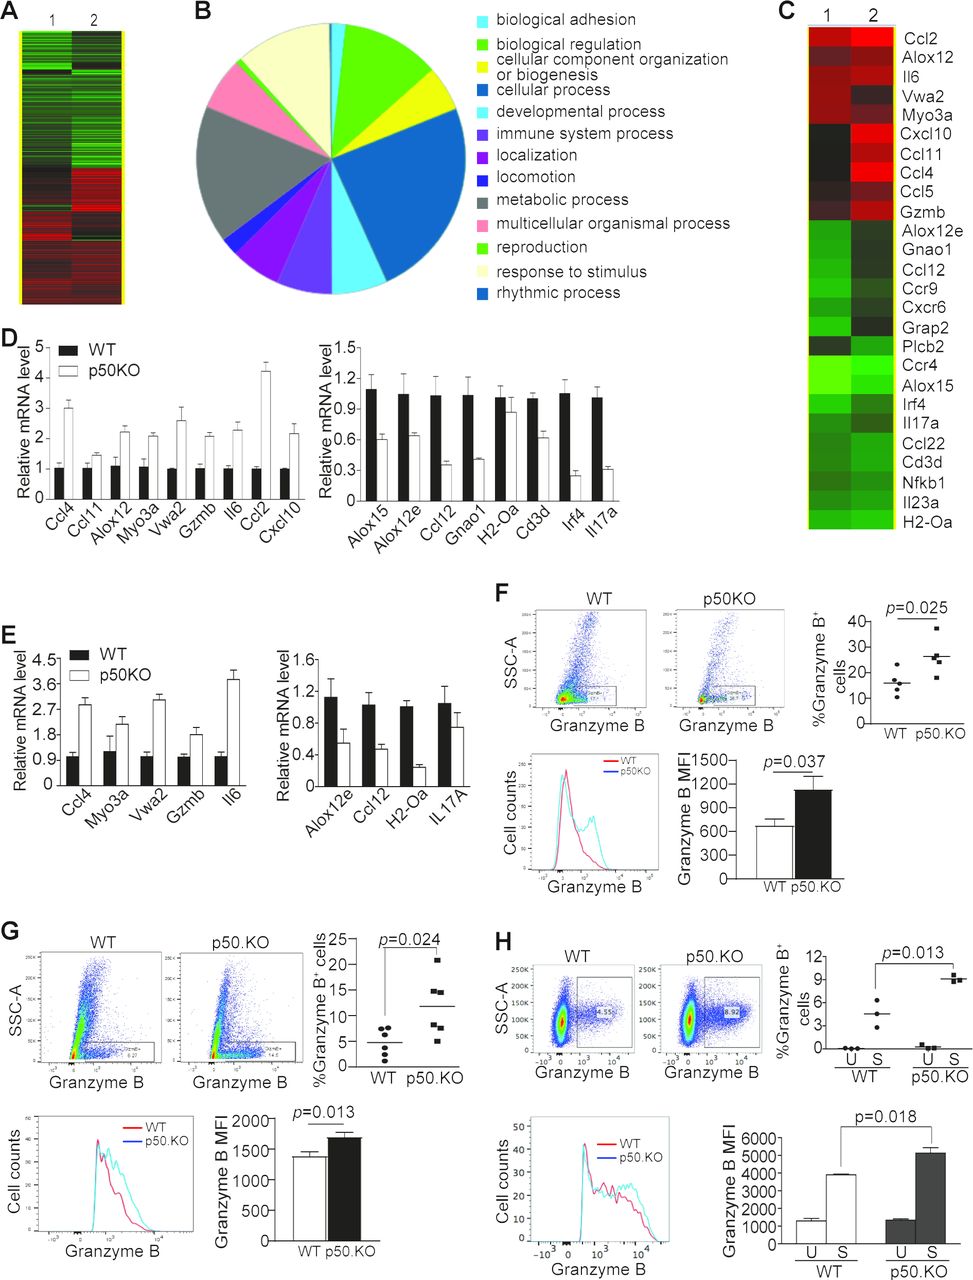
CD8+ CTLs are the primary T cells that mediate host cancer immunosurveillance. Although p50-deficient mice exhibited a decrease in tumorigenesis and tumor growth, analysis of the tumor tissues revealed that p50 deficiency did not increase tumor-infiltrating CTL level in colon tumor-bearing mice (online supplemental figure S4), suggesting that p50 may negatively regulate tumor-infiltrating CTL function in the tumor microenvironment. To test this hypothesis, tumor tissues were dissected from the WT and p50 KO mice as shown in figure 2A and analyzed by RNA-Seq (figure 3A). The differentially expressed genes were then functionally grouped and genes with known function in immune system process were filtered out (figure 3B,C) and validated by qPCR (figure 3D). We further analyzed these genes in tumor-infiltrating CD45+ cells. Five genes were upregulated and four genes were downregulated in p50 KO tumor-infiltrating CD45+ cells as compared with WT CD45+ cells (figure 3E). One of the upregulated genes is Gzmb (figure 3C–E). p50 negatively regulates granzyme B+ tumor-infiltrating CTLs.

p50 represses Gzmb expression in CD8+ T cells. (A) RNA-Seq analysis of AOM–DSS-induced tumors of WT (n=2) and p50 KO (n=2) mice as shown in figure 2A. (B) The differentially expressed genes were functionally grouped. (C) Genes with known functions in the immune system were then clustered and presented. (D) The expression levels of the genes as shown in (C) were analyzed by qPCR. Shown are validated genes. (E) CD45+ cells were isolated from the colon tumor tissues as in figure 2D. RNA was isolated from the purified tumor-infiltrating CD45+ cells and analyzed by qPCR for the expression levels of genes shown in (D). The validated genes are shown. (F) MC38 tumors as shown in figure 2D were collected from WT (n=6) and p50 KO (n=6) mice and analyzed by flow cytometry. The live cells were gated for CD45.2+ and CD8+ cells. The CD8+ cells were then gated for granzyme B+ cells and granzyme B MFI in CD8+granzyme B+ cells. Shown are representative dot plots of granzyme B staining (upper left panels) and quantification of % granzyme B+ cells (upper right panel). Each dot represents one mouse. The CD8+granzyme B+ cells were also quantified for granzyme B MFI and shown as overlay (bottom left panel) and quantification (bottom right panel). (G) MC38 tumor cells were surgically transplanted to cecal wall of WT (n=5) and p50 KO (n=5) mice. The orthotopic tumors were collected 30 days later and analyzed for granzyme B+ cells in CD8+ tumor-infiltrating T cells as in (F). (H) CD3+ T cells were purified from spleens of WT (n=3) and p50 KO (n=3) mice and stimulated in anti-CD3 and anti-CD28-coated plates for 3 days. The unstimulated cells (U) and the stimulated cells (S) were stained with anti-CD8 and anti-granzyme B mAbs and analyzed by flow cytometry.
Granzyme B is the master CTL effector that executes CTL anti-tumor cytotoxicity.29 The aforementioned observations prompted us to test the hypothesis that p50 negatively regulates Gzmb expression to decrease granzyme B+ tumor-infiltrating CTLs to promote tumor development. To test this hypothesis, tumor-infiltrating CD8+ T cells were analyzed for granzyme B expression. It is clear that granzyme B+ tumor-infiltrating CD8+ T-cell level is significantly higher in p50-deficient mice than in WT mice (figure 3F,G). Granzyme B protein level of these CD8+ granzyme B+ CTLs is also significantly higher in p50-deficient mice than in WT mice (figure 3F,G). In vitro activated p50-deficient CD8+ T cells also have a significantly higher level of granzyme B+ cells than those of WT CD8+ T cells (figure 3H). The granzyme B Mean Fluorescence Intensity (MFI) is also higher in p50-deficient CD8+ T cells than that in the WT CD8+ T cells (figure 3H). Taken together, our findings indicate that p50 represses Gzmb expression in tumor-infiltrating CTLs.
p50 binds to a κB element at the Gzmb promoter to repress Gzmb expression in T cells
The previously mentioned observations indicate that p50 may directly repress Gzmb expression in T cells. We screened the murine Gzmb promoter DNA sequence and identified eight putative κB consensus sequence elements (figure 4A). Analysis of DNA–protein interaction using these κB sequence-containing DNA probes and T-cell nuclear extracts determined that p50 binds to one of these eight putative κB DNA elements (figure 4B and online supplemental figure S5). ChIP analysis determined that p50 binds to the chromatin region containing this unique κB DNA sequence at the Gzmb promoter in T cells (figure 4C). Taken together, we have identified a previously uncharacterized κB sequence element in the Gzmb promoter and determined that p50 directly binds to this specific κB DNA sequence at the Gzmb promoter to repress Gzmb expression in T cells.
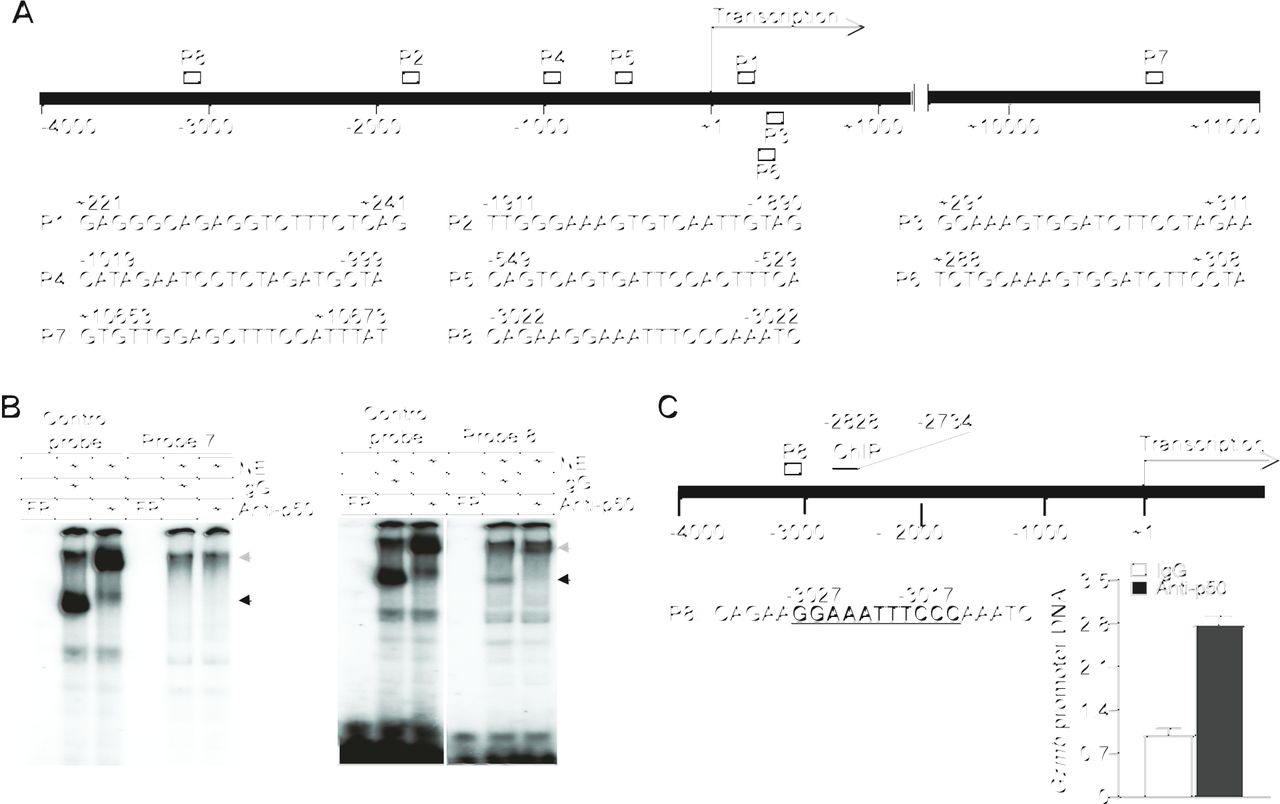
p50 binds to a κB sequence element in the Gzmb promoter to repress Gzmb expression in T cells. (A) The structure of the mouse Gzmb promoter region showing the putative NF-κB-binding sequences (P1–8) and locations. (B) Nuclear extracts were prepared from EL4 T cells and analyzed by EMSA using putative Gzmb promoter DNA probes 7 and 8 as shown in (A). The NF-κB consensus sequence probe (control probe) was used as positive control. The black arrow indicates the NF-κB–DNA complex and the gray arrow indicates p50 mAb-induced supershift. Shown are p50 binding to probe 8. Probe 7 is shown here as a negative control. (C) The left panel shows the mouse Gzmb promoter structure. The putative NF-κB-binding sequence (P8) and the ChIP PCR primer sequence locations are shown. The numbers under the bar and above the P8 probe sequence indicate the nucleotide locations relative to Gzmb transcription start site. EL4 T cells were analyzed by ChIP using IgG and p50-specific antibody, respectively. The immunoprecipitated DNA were quantified by qPCR using primers that amplify the Gzmb promoter DNA as shown at the left panel.
GZMB expression and T-cell infiltration is negatively regulated by p50 in human colorectal carcinoma
To determine whether the aforementioned findings can be translated to human cancer, we analyzed the genomic dataset in human TCGA database. Because Gzmb is repressed by p50 in mouse colon carcinoma, we focused on p50-repressed genes. We extracted the top upregulated genes in p50 KO tumor from our RNA-Seq dataset (figure 3A) and filtered out these genes against the known human NF-κB target genes.30 Twenty-one human genes were generated and defined as p50 signature (figure 5A,B). We defined p50 score as the level of upregulation of these 21 p50 signature genes in p50 KO tumor. The lower the p50 signature gene expression, the higher p50 activation/p50 score. As observed in mouse models, p50 activation is higher in tumor adjacent non-neoplastic colon tissues as compared with the tumor tissues in human patients with colorectal cancer since p50 score is lower in colorectal carcinoma than in adjacent non-neoplastic colon tissues (figure 5C). Furthermore, p50 score is inversely correlated with GZMB expression level in human colorectal carcinoma (figure 5D), indicating that p50 represses GZMB expression in human colorectal carcinoma.

p50 activation and function in human colorectal carcinoma. (A) Experimental scheme of determination of the p50 signature in human colorectal carcinoma. (B) The 21 human genes for p50 signature. The p50 score is defined as the upregulation level of the 21 human p50 signature genes in p50 KO tumor. (C) Datasets of the p50 signature genes as listed in (B) in human colon carcinoma (n=380) and normal colon tissues (n=51) were extracted from TCGA database and plotted. The p50 signature gene mRNA level was compared between colon carcinoma and normal colon tissues. Two-tailed t-tests were used to determine differences with p<0.05 as being statistically significant. (D) Datasets of human colorectal carcinoma (n=380) were extracted from TCGA database and divided into p50 score high (p50 signature expression low, n=190) and p50 score low (p50 signature high, n=190) group, and analyzed for GZMB mRNA level and the CD8+ T-cell filtration level. Two-tailed t-tests were used to determine differences with p<0.05 as being statistically significant.
To determine whether p50 regulates T-cell tumor infiltration in human patients with colorectal cancer, we used the CIBERSORT algorithm to deconvolute CD8+ T-cell infiltration.31 p50 score high human colorectal carcinomas have a lower T-cell infiltration and p50 score low human colorectal carcinoma exhibit a higher T-cell infiltration (figure 5D). This finding indicates that p50 suppress T-cell tumor infiltration in human colorectal carcinoma.
Anti-PD-1 immunotherapy efficacy and p50-mediated immune suppression
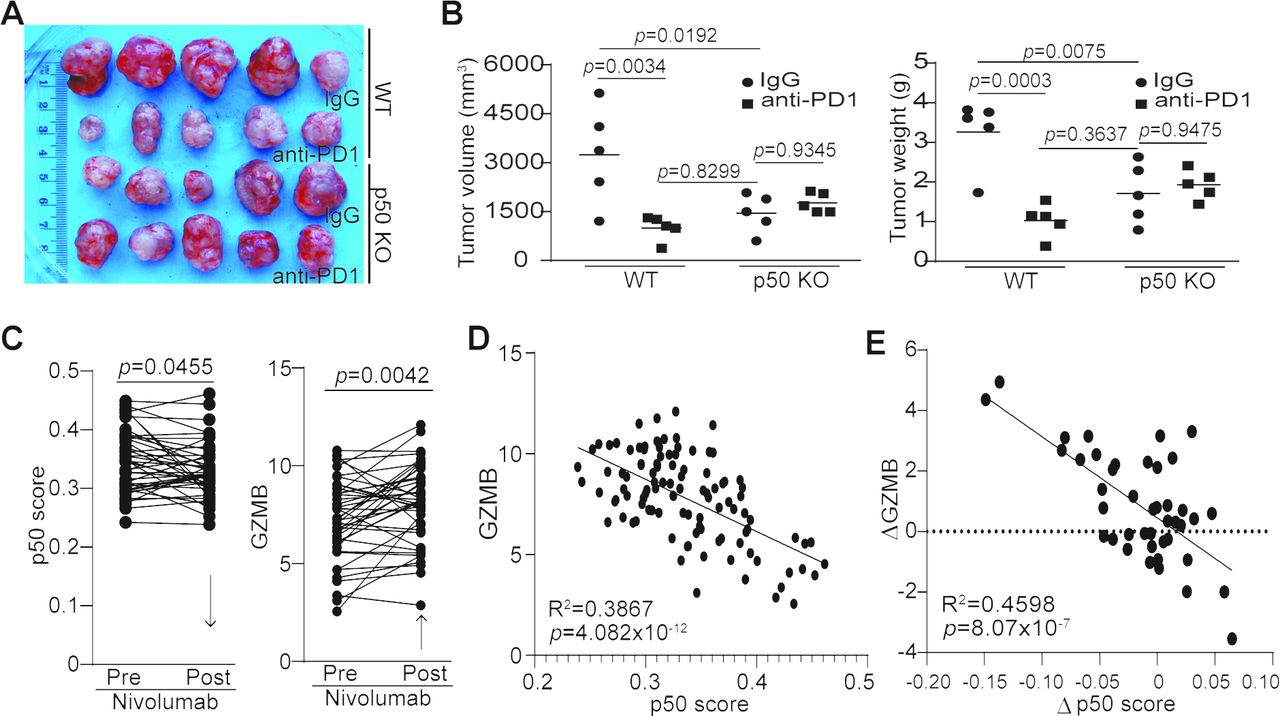
Our previously mentioned observations suggest that p50 activation may negatively regulate cancer patient response to anti-PD-1 immunotherapy. To test this hypothesis, we used WT and p50 KO mice to test the efficacy of anti-PD-1 immunotherapy in the MC38 tumor model. MC38 is a type of tumor that is responsive to anti-PD-1 immunotherapy.32 As expected, anti-PD-1 immunotherapy significantly suppressed the MC38 colon tumor growth in WT mice (figure 6A,B). p50 KO mice also showed a significantly decreased tumor growth as compared with the WT mice (figure 6A,B). However, anti-PD-1 immunotherapy did not further suppress the established MC38 tumor growth (figure 6A,B).

p50 represses GZMB expression to regulate tumor response to anti-PD-1 immunotherapy. (A) MC38 tumor-bearing WT (n=10) and p50 KO (n=10) mice were randomly assigned into two groups (n=5 per group) at day 8 after tumor cell injection. One group of WT and p50 KO mice were treated with IgG, and the other group of WT and p50 KO mice were treated with anti-PD-1 (200 µg/mouse) every 3 days for 14 days. Shown are tumor images. (B) Mice were sacrificed at day 22 after tumor cell injection. Tumors were dissected and measured for volume (left panel) and weight (right panel). (C) Datasets of the p50 signature genes (p50 score) and GZMB in tumors from human patients with melanoma before and after anti-PD-1 immunotherapy (n=42) were obtained from the BMS038 trial. The expression levels of p50 signature genes (p50 score, left panel) and GZMB (right panel) for each patient were compared. Arrows indicate net change pre-nivolumab and post-nivolumab therapy. (D) p50 signature gene level and GZMB of human melanoma (n=107) were plotted. The correlation between p50 score and GZMB expression was analyzed (left panel). (E) The change in GZMB expression level post anti-PD1 immunotherapy (GZMB expression level post-therapy−GZMB expression level pre-therapy) and the change of p50 score post anti-PD-1 immunotherapy (p50 score post-therapy−p50 score pre-therapy) were analyzed for correlation by linear regression using GraphPad Prism program (n=42).
A statistically significant two-factor interaction between mouse strains and treatment was found for tumor volume (F(1,16)=11.45, p=0.0038) (online supplemental table S4). Tumor volumes were higher with IgG treatment than with anti-PD-1 immunotherapy in WT mice, but in p50 KO mice tumor volumes were slightly lower with IgG treatment than with anti-PD-1 immunotherapy. The Tukey multiple comparison post hoc tests indicated that IgG control mice had significantly higher tumor volumes than mice with anti-PD-1 immunotherapy (p=0.0034) and IgG control p50 KO mice (p=0.0192). There were no other significant differences (WT mice with anti-PD-1 vs p50 KO mice with anti-PD-1 (p=0.4958), WT mice with anti-PD-1 vs p50 KO mice with IgG (p=0.8299), WT mice with IgG vs p50 KO mice with anti-PD-1 (p=0.0604), p50 KO mice with anti-PD-1 vs p50 KO mice with IgG (p=0.9345)) (figure 6B).
A statistically significant two-factor interaction between strain and treatment was found for tumor weight (F(1,16)=18.21, p=0.0006) (online supplemental table S4). Tumor weight was higher in IgG control WT mice than with anti-PD-1-treated WT mice, but in p50 KO mice tumor weight was slightly lower with IgG than with anti-PD-1 treatment. The Tukey multiple comparison post hoc tests indicated that IgG control WT mice had significantly higher tumor weight than WT mice with anti-PD-1 immunotherapy (p=0.0003), p50 KO mice with anti-PD-1 immunotherapy (p=0.0225) and IgG control p50 KO mice (p=0.0075). There were no other significant differences (WT mice with anti-PD-1 vs p50 KO mice with anti-PD-1 (p=0.1586), WT mice with anti-PD-1 vs IgG control p50 mice (p=0.3637), p50 KO with anti-PD-1 vs IgG control p50 KO mice (p=0.9475)) (figure 6B).
There is a rich literature of immune checkpoint immunotherapy datasets from human patients with melanoma.33 34 To determine the role of p50 in human patients who respond to anti-PD-1 immunotherapy, we analyzed p50 activation and GZMB expression in human melanoma patient specimens taken pre-immunotherapy and during immunotherapy. Nivolumab immunotherapy significantly decreased p50 activation and increased GZMB expression in human patients with melanoma (figure 6C). Furthermore, GZMB expression level is inversely correlated with p50 activation level (figure 6D), and nivolumab-induced increase in GZMB expression level is significantly correlated with decreased p50 activation in human patients with melanoma (figure 6E).
In summary, our data indicate that inflammation in the tumor microenvironment activates p50 NF-κB that represses GZMB expression in tumor-infiltrating CTLs to induce CTL exhaustion/dysfunction. Anti-PD-1 immunotherapy may act through unleashing the p50-suppressed dysfunctional CTL subsets of tumor-infiltrating CTLs to suppress tumor growth.
Discussion
A recent study determined that both human colitis–associated colorectal tumor cells and adjacent non-tumor epithelial cells harbor a high tumor mutation burden.3 Although these mutations may drive tumor development, recent studies have also shown that higher nonsynonymous mutations in tumor cells may serve as neoantigens to elicit anti-tumor immune response.35 These findings indicate that the host cancer immunosurveillance may be activated long before the mutated/transformed colon epithelial cells develop into tumor cells in the inflamed colon. However, the immunogenic colorectal cancer is not naturally eliminated. Both Microsatellite Instability (MSI) and Microsatellite Stability (MSS) human colon cancer harbor abundant CTLs.22 However, the majority of human colon cancers (eg, MSS colon cancer) do not respond to anti-PD-1 immunotherapy, suggesting that the tumor-infiltrating CTLs are functionally impaired. Our findings that p50 expression and activation level is significantly higher in tumor-infiltrating and adjacent non-neoplastic colonic immune cells in human patients with colorectal cancer suggest that colonic inflammation may preferentially activate p50 to induce CTL dysfunction, leading to impaired CTL function and resultant immune escape of transformed colon epithelial cells and tumorigenesis. This notion is also supported by our findings that GZMB expression is downregulated and T-cell infiltration is decreased in human colorectal carcinoma with higher p50 activation level than those with lower p50 activation level.
Although the function of and mechanism underlying NF-κB in tumor development have been largely focused on tumor cells, recent studies have started to shed light on the critical role of NF-κB in regulation of anti-tumor immunity.7–16 36 Specifically, a recent CRISPR-based systemic immunotherapy target screening identified NF-κB as the strongest potential regulator of CTL effector function.13 In this study, we extended p50 function to T-cell anti-tumor effector function and determined that p50 directly represses Gzmb expression in T cells to decrease Gzmb+ CTLs in the tumor microenvironment. Furthermore, we identified a previously uncharacterized κB element in the Gzmb promoter and functionally determined that p50 directly binds to this κB element in the Gzmb promoter to repress Gzmb transcription in T cells.
T-cell exhaustion/dysfunction is characterized by PD-1 upreregulation that is a consequence of chronic inflammation during viral infection and is associated with the tumor microenvironment.23 37–42 Gzmblo has recently been proposed as a dysfunctional CTL phenotype.41 Our findings thus suggest that the p50 may confer tumor-infiltrating CTL a Gzmblo exhaustion/dysfunctional phenotype and immune checkpoint inhibitor immunotherapy activates this Gzmblo subset of T cells to suppress tumor.
Only subsets of CTLs respond to immune checkpoint inhibitor immunotherapy.41 43 In this study, we observed that anti-PD-1 immunotherapy in tumor-bearing WT and p50 deficiency mice have similar efficacy in suppressing colon tumor growth in vivo. However, p50 deficiency and anti-PD-1 immunotherapy did not show additive or synergistic efficacy. This observation suggests that p50 deficiency and anti-PD-1 immunotherapy may activate the same subset of CTLs in the colon tumor microenvironment. This notion is supported by the clinical findings that nivolumab immunotherapy decreased p50 activation and increased Gzmb expression in human melanoma, a responder type of human cancer to immune checkpoint inhibitor immunotherapy.34 40 44
NF-κB functions as dimers. The five NF-κB Rel family subunits can form dimers in any combinations and 10 dimers have been identified so far including p50–p50 dimers.45 In this study, we determined by EMSA that the NF-κB in the inflamed colon and colon carcinoma is primarily p50–p50 dimer. Furthermore, this p50–p50 dimer acts as a repressor for Gzmb transcription in T cells. The mechanism underlying the preferential activation of p50 in the colon and T cells requires further studies. NF-κB activation is a key link between colonic inflammation and colorectal cancer in humans.1 NF-κB is activated by colonic inflammatory mediators. Emerging experimental data indicate that innate lymphoid cells (ILCs) play a critical role in colonic inflammation and colon tumorigenesis.46 47 Furthermore, intestinal ILCs produce IL1748 and IL17 has been shown to activate NF-κB in immune cells.49 It is therefore possible that colitis-associated ILCs may contribute to p50 NF-κB activation in the inflamed colon. However, the role of the ILC-IL17 axis in inducing p50 NF-κB activation in CTLs in the inflamed colon and colon tumor remains to be determined. Furthermore, a recent study has shown that ILCs express PD-L1 and conditional deletion of ILC-expressed PD-L1 impairs T-cell differentiation and cytokine production.50 It is therefore also possible that anti-PD-1 immunotherapy may target ILC-expressed PD-L1 to suppress production of cytokines such as IL17 to inhibit NF-κB activation, resulting in increased Gzmb expression in CTLs, which also remains to be determined. Nonetheless, our findings suggest that selective targeting of p50 activation in CTLs in the inflamed tumor microenvironment is potentially an effective strategy to reverse CTL dysfunction to restore host cancer immune surveillance to suppress tumorigenesis and progression.
Conclusion
p50 binds to the Gzmb promoter to repress Gzmb transcription in T cells to induce CTL dysfunction to promote tumor immune escape. p50 activation is inversely correlated with both GZMB expression and T-cell tumor infiltration levels in human colorectal carcinoma. Furthermore, GZMB expression level is also inversely correlated with p50 activation in human melanoma and nivolumab immunotherapy significantly decreased p50 activation to increase GZMB expression in responder patients with melanoma. Our data indicate that selectively targeting the p50–GZMB axis is potentially an effective approach to suppress cancer immune escape and to enhance the efficacy of anti-PD-1 immunotherapy.
Acknowledgments
We thank Ms. Penny Roon and Donna Kumiski at the Medical College of Georgia Electron Microscopy and Histology Core for technical assistance in tissue preparation and histology work.
References
Supplementary materials
Supplementary Data
This web only file has been produced by the BMJ Publishing Group from an electronic file supplied by the author(s) and has not been edited for content.
Footnotes
Contributors CL, DDB, DHM, KL: concept and design. CL, JDK: development of methodology. CL, JDK, ADS, DY: acquisition of data. CL, JDK, JLW, DDB, DHM, KL: analysis and interpretation of data. CL, JDK, DDB, DHM, KL: writing and review of manuscript.
Funding This work was supported by the National Institutes of Health (R01 CA182518, R01 CA133085 and R01 CA227433 to KL; F30 CA236436 to JDK) and US Department of Veterans Affairs (CX001364 to KL).
Competing interests None declared.
Patient consent for publication Not required.
Ethics approval Augusta University IACUC Protocol No. 2008-0162.
Provenance and peer review Not commissioned; externally peer reviewed.
Data availability statement All data relevant to the study are included in the article or uploaded as online supplemental information.