Article Text

Abstract
Background The positive role of CD8+ tumor-infiltrating lymphocytes (TIL) in patients with colorectal cancer (CRC) has been well described but the prognostic value of CD4 T cell subsets remained to be investigated. In this study, we expanded TIL from surgically resected liver metastases of patients with CRC and characterized the phenotype and the prognostic value of expanded-CD4 T cells.
Methods Liver metastases were surgically resected from 23 patients with CRC. Tumors were enzymatically digested and cultured in high dose of interleukin-2 for up to 5 weeks. T cell phenotype and reactivity of cultured-T cells were measured by flow cytometry and correlated with patients’ clinical outcomes.
Results We successfully expanded 21 over 23 TIL from liver metastases of patients with CRC. Interestingly, we distinguished two subsets of expanded T cells based on T cell immunoglobulin mucin domain-containing protein 3 (TIM-3) expression. Medians fold expansion of expanded T cells after rapid expansion protocol was higher in CD3+TIM-3low cultures. In an attempt to investigate the correlation between the phenotype of expanded CD4 T cells and clinical outcomes, we observed on one hand that the level of Tregs in culture as well as the expression of both PD1 and TIM-3 by expanded T cells was not correlated to the clinical outcomes. Interestingly, on the other hand, cultures containing high levels of Th17 cells were associated with a poor prognosis (p=0.0007).
Conclusions Our data confirmed the presence of Th17 cells in expanded T cells from liver metastases. Among CD4 T cell characteristics investigated, TIM-3 but not programmed cell death protein 1 predicted the expansion capacity of TIL while only the Th17 phenotype showed correlation with patients’ survival, suggesting a particular role of this T cell subset in CRC immune contexture.
Trial registration number NCT02817178.
- adaptive immunity
- biomarkers
- tumor
- CD4-positive t-lymphocytes
- gastrointestinal neoplasms
- lymphocytes
- tumor-infiltrating
This is an open access article distributed in accordance with the Creative Commons Attribution Non Commercial (CC BY-NC 4.0) license, which permits others to distribute, remix, adapt, build upon this work non-commercially, and license their derivative works on different terms, provided the original work is properly cited, appropriate credit is given, any changes made indicated, and the use is non-commercial. See http://creativecommons.org/licenses/by-nc/4.0/.
Statistics from Altmetric.com
- adaptive immunity
- biomarkers
- tumor
- CD4-positive t-lymphocytes
- gastrointestinal neoplasms
- lymphocytes
- tumor-infiltrating
Background
The immune system and particularly T cells play a crucial role in the survival of patients with colorectal cancer (CRC).1–4 Indeed, the type, density and functional orientation of T cell infiltration in an early stage of a primary CRC are associated with patients’ prognosis.1 2 Moreover, the immunoscore developed by Galon and colleagues appears to be the most relevant predictor of risk of death of patients with CRC, when combined with the TNM Classification of Malignant Tumors.5 6 Liver is the most common metastatic site of CRC disease.7 Investigating the immune contexture specifically in liver metastases is an important issue. Indeed, the feasibility to expand ex vivo tumor-infiltrating lymphocytes (TIL) from liver metastases of gastrointestinal (GI) cancer has been demonstrated by Turcotte et al.8 9 In these studies, only a few specific cytotoxic CD8 T cells able to recognize autologous cancer cells were identified in metastases of patients with GI cancer (frequency of tumor reactive CD8 T cells within expanded TIL was estimated between 0% and 3%) as compared with melanoma.8 10 Therefore, a discrepancy is highlighted by these results since high CD8 T cell infiltration levels in both primary and metastatic CRC are associated with good prognosis whereas expanded CD8 TIL from GI cancer’s metastases lack of antigen specificity.2 4 8 9 11
TIL can be expanded, ex vivo, and reinfused, inducing durable objective tumor responses in cancers such as advanced melanoma and cervical carcinoma.12 13 For effective adoptive cellular therapy (ACT), short-term expansion ex vivo has been developed simultaneously with enrichment for tumor reactive CD8 T cells of TIL therapy product. Such approaches demonstrated efficacy in terms of clinical responses.14 15 Nevertheless, selecting CD8 T cells to the detriment of CD4 T cells remains controversial.16 However, the clinical potential of CD4 T cells has already been demonstrated in ACT contexts with TIL products.17 18
CD4 T helper cells (Th) exert a key role in antitumor immunity, especially specific Th1 cells that produce cytokines such as interferon (IFN)-γ, tumor necrosis factor (TNF)-α and interleukin-2 (IL-2) essential for the initiation of cell-mediated antitumor immunity.19 20 Th1 cells promote the acquisition of potent CD8 T cell functions including homing, survival and recall responses.21 22 CD4 Th cell polarization in a CRC context might be one pitfall to overcome in order to restore effective immune responses. Indeed, the involvement of Th17 cells in inflammatory diseases and CRC is nowadays widely accepted.23 24 Breaking the integrity of the intestinal barrier can cause gut dysbiosis contributing to a chronic Th17-dependent inflammation of the intestine that favor angiogenesis, immune subversion and promotes tumor outgrowth.25 Considering both, Th cell polarization and CTL signature in primary CRC have enabled Tosolini and coauthors to predict a patients’ outcome using ribonucleic acid (RNA)-based genomic analyses performed over 125 patients.26 Those with high expression of Th17 signature had a poor prognosis whereas patients in whom a Th1-related transcriptional activity was observed had a prolonged disease-free survival. The presence of such Th17 polarization in the context of CRC liver metastases is still unknown. Therefore, it remains an important issue to assess whether CD4 T cells are also present or enriched in liver metastases. Regarding the poor prognosis of the Th17 cells demonstrated by the RNA analyses performed on patients with primary CRC, we addressed the subject of whether it exists a Th17 infiltration in expanded T cells derived from liver metastases of patients with CRC, or not.
In the present study, we successfully expanded T cells from liver metastases in 21 of 23 patients with metastatic CRC confirming the results obtained by Turcotte et al in a homogenous cohort of patients. The phenotype and prognostic impact of expanded CD4 T cells from CRC liver metastases have never been characterized yet. Remarkably, high levels of expanded Th17 cells associated with low levels of expanded Th1 cells dictate poor prognosis of patients following resection of CRC liver metastases.
Patients, materials, and methods
Patients and healthy donor-derived materials
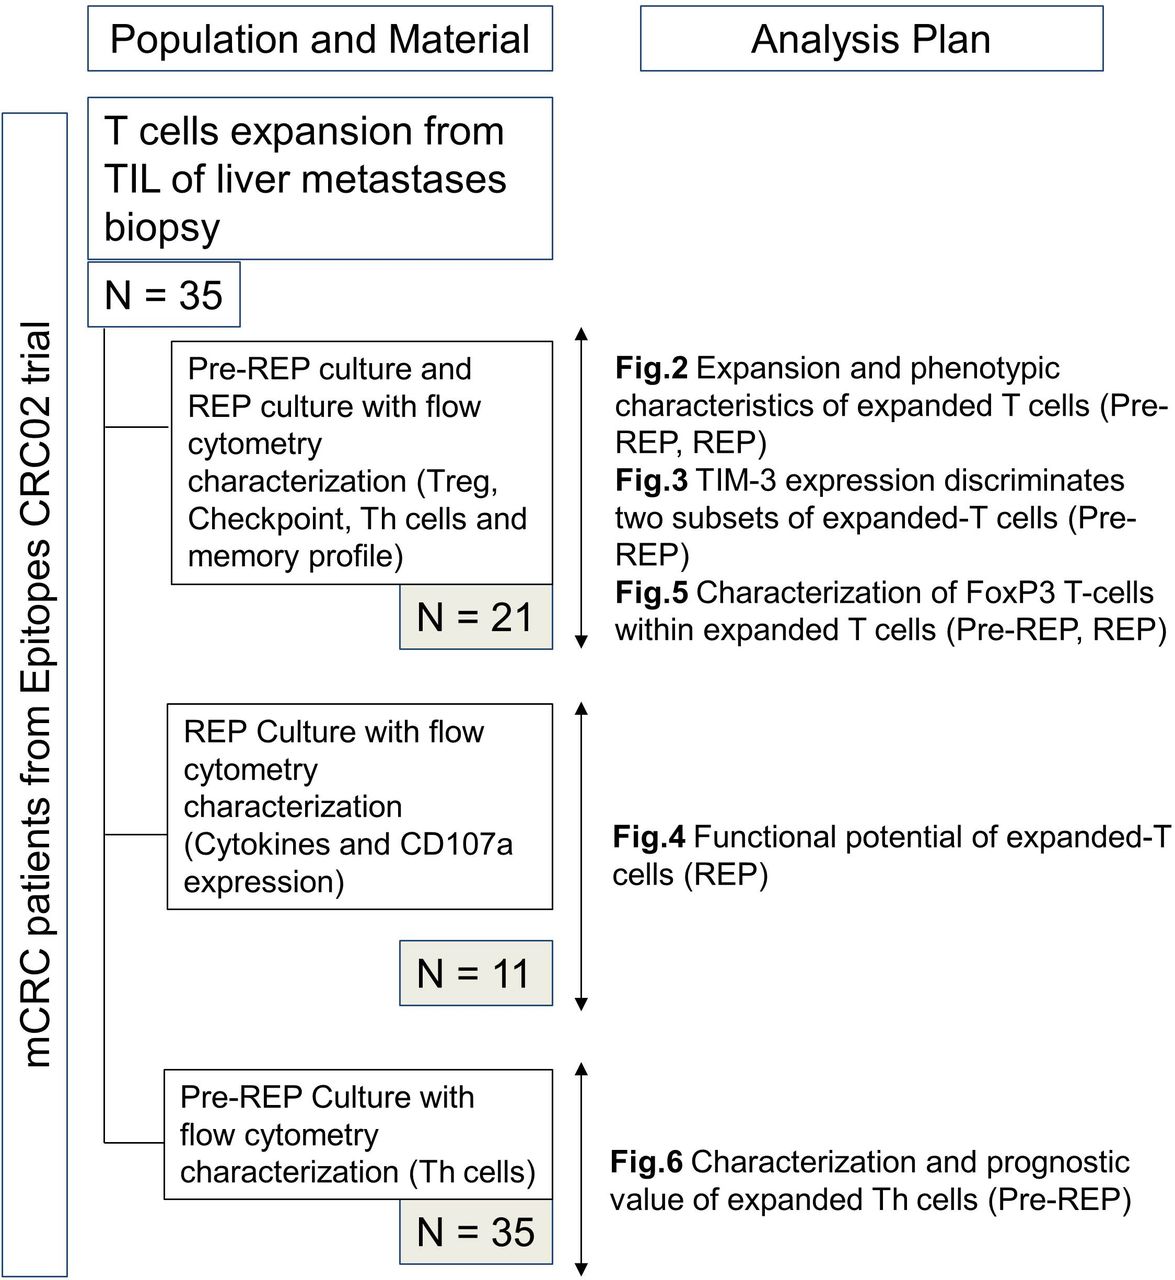
All tumor samples were excised by surgeons from the department of digestive surgery at the University Hospital of Besançon from January 2014 to October 2016. Cells were isolated from the leading edge of liver metastases. All patients were enrolled in the Epitopes-CRC02 (NCT02817178) cohort after the signature of informed consent in accordance with the French regulation and after approval by the local and national ethic committees. The materials used and analysis plan are illustrated in figure 1. Peripheral blood products were collected from anonymous healthy donors at the Etablissement Français du Sang (EFS Besançon, France) after the signature of informed consent and following the EFS guidelines.

Flow chart of available material and analysis plan. mCRC, metastatic colorectal cancer; REP, rapid expansion protocol; TIL, tumor-infiltrating lymphocytes.
Initiation of TIL cultures
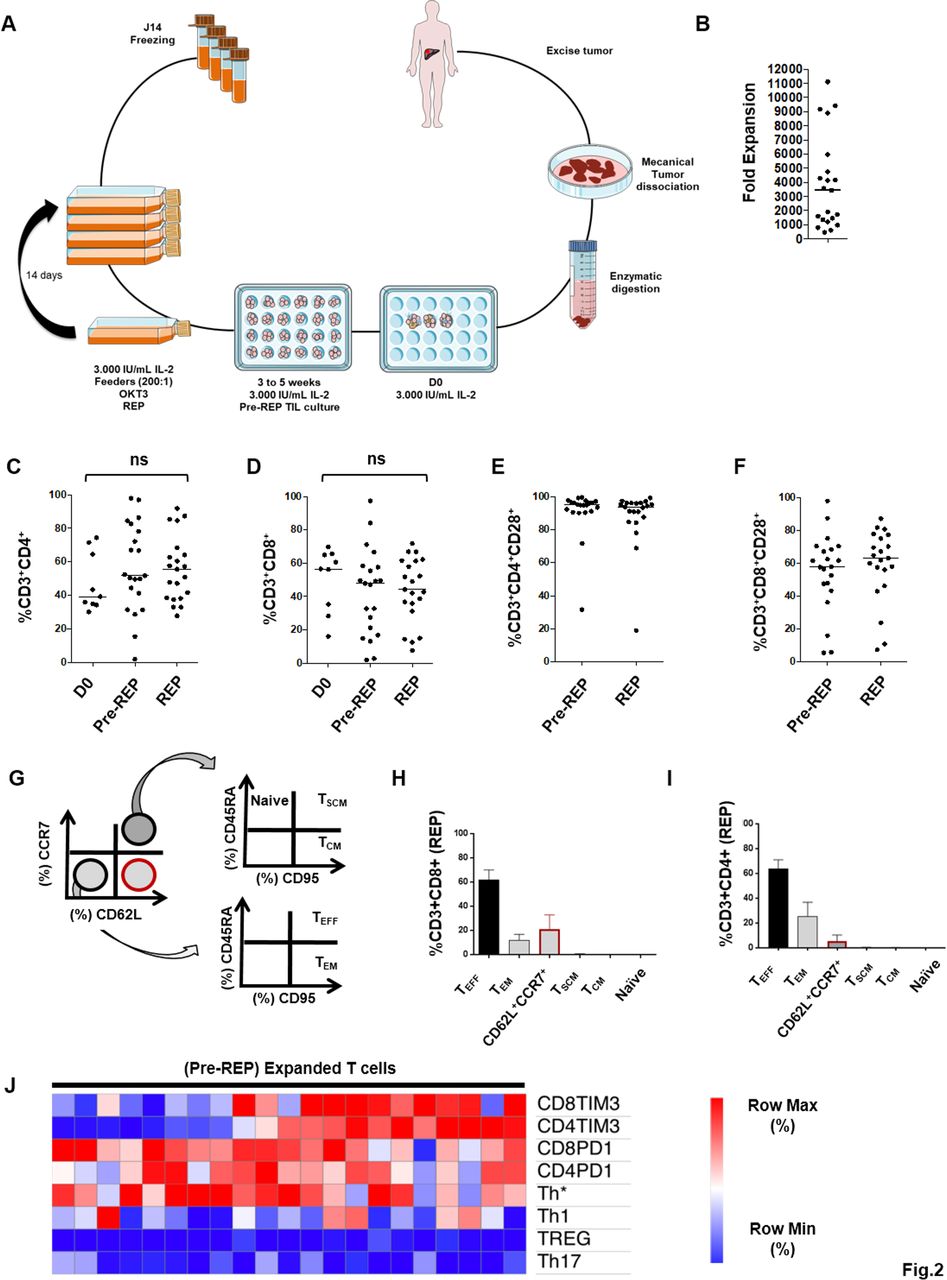
The generation of expanded T-cells was based on the methodology previously established by Dudley et al. 27 Our procedure is depicted in figure 2A. Each tumor sample was weighed and cut into small fragments of 2–3 mm in length. Fragments were then subjected to a mechanical/enzymatic dissociation system (Miltenyi Biotec). Briefly, fragments were put in a C-tube (Miltenyi Biotech) with an enzyme digest mix consisting of RPMI 1640 (Gibco), 1 mg/mL collagenase and 30 U/mL DNAse (both from Sigma-Aldrich). Fragments were incubated 1 hour at 37°C interspersed by three 36 s mechanical disaggregation steps (programs h_tumor_01.01, 02.01 and 03.01) performed in the GentleMACS dissociator (Miltenyi biotec) just before, 30 min and 1 hour after the beginning of enzymatic digestion. After disaggregation, the cell slurry was filtered using 70 µm and 30 µm sterile strainers (Miltenyi biotec) to remove undigested tissue chunks. The resultant cell suspension was washed twice in phosphate buffered saline (PBS) and plated in a 24 wells plate at a concentration of 106/mL viable cells in 2 mL. Culture media were composed of: RPMI 1640 supplemented with 10% heat inactivated human serum (SH), 10 000 IU/mL penicillin, 10 mg/mL streptomycin and 3000 IU/mL recombinant IL-2 (Novartis). Plate was placed in a humidified incubator at 37°C with 5% CO2. Half the media was replaced with fresh media no later than 5 days after culture initiation, whether or not lymphocyte growth was visible. Half the media was then exchanged every 2–3 days. When confluent, wells were mixed forcefully and split to maintain a cell density of approximately 0.5 to 1.106 viable cells/mL. When a sufficient number of cells were obtained (at least 50.106 cells), all wells were pooled and a rapid expansion was initiated.

Fold expansion and characteristics of expanded tumor-infiltrating lymphocytes (TIL). (A) Scheme of isolation and expansion of liver metastases-derived TIL. (B) Median fold expansion after rapid expansion protocol (REP) (3438 (451–11 118)). (C, D) Frequencies of CD4 and CD8 T cells at three major steps : isolation day (n=10), Pre-REP (n=21) and Post-REP (n=21). (E, F) Median frequencies of CD28, respectively, on CD4 and CD8 T cells before REP (94.9 (31.6–99.4), 93.7 (19.0–99.0)) and after (58.1 (5.4–98.3), 63.3 (7.3–87.5)). (G) Gating strategy of REP T-cells memory profile. (H, I) CD8 and CD4 T cells memory profile after REP. (J) Unsupervised hierarchical clustering of the percentages of CD4 and CD8 T cells expressing T cell immunoglobulin mucin domain-containing protein 3 and programmed cell death protein 1, CD4 T cells polarization and Treg level (CD4+CD25HighFoxP3+CD127−) from pre-REP T cells. Statistical differences were calculated using Mann-Whitney test. Median (min−max). ns, not significant.
Rapid expansion protocol
Active T cell (derived from TIL) cultures were expanded using a rapid expansion protocol (REP). REP used irradiated peripheral blood mononuclear cells (PBMC) feeder cells from healthy donors at a 200:1 ratio of feeder cells to T cells; anti-CD3 antibody OKT3 (30 ng/mL Miltenyi biotec); 6000 IU/mL recombinant IL-2. PBMC from healthy donors (2.108) were suspended in the culture medium previously described (75 mL) and irradiated (50 Gy). T cells (1.106) were suspended in 75 mL of AIM V medium (Life Technology), combined to feeder cells as well as OKT3 antibody, and placed in a 175 cm2 tissue culture flask. IL-2 was added only on day 2. The fifth day, 120 mL of culture medium was removed by aspiration and replaced by culture medium at 1:1 ratio of culture medium/AIM V containing 6000 IU/mL of recombinant IL-2. On day 6 and every day thereafter, cell concentration was determined and cells were split into additional flasks with additional medium containing 6000/IU mL recombinant IL-2 in order to maintain a cell concentration around 1.106 viable cells per mL. REP was over after 14 days of culture. Analyses of T cells were performed following their expansion after at least 3–5 weeks of culture in high-dose IL-2 and following REP.
Flow cytometry
The following antihuman antibodies and appropriate isotype controls were used for cell surface staining: Pe/Cy7 anti-CD4 (clone OKT4), PE anti-CD127 (clone A019D5), Pe/Cy7 anti-CCR7 (G043H7), PerCP/Cy5.5 anti-CD95 (DX2), Pe/Cy7 antiprogrammed cell death protein 1 (PD1) (clone EH12.2H7) Pe/Cy7 anti-CCR7 (clone G043H7 and Pe/Cy7 anti-CCR6 (clone G034E3) from Biolegend; FITC anti-CD8 (clone B-231), FITC anti-CD25 (clone B-F2) and PE anti-CD107a (clone B-T47) from Diaclone; Pacific-blue anti-CD3 (clone OKT3), APC anti-CD28 (clone CD28.2), PE anti-TIM3 (clone F38-2E2), APC anti-CTLA4 (clone L3D10), APC anti-CCR6 (clone GO34E3), PE anti-CXCR3 (clone G025H7), PercP/Cy5 anti-CD39 (clone A1) from Sony; APC anti-GARP (clone 7B11), anti-CD45RA (HI100), APC anti-CD62L (DREG56) from eBiosciences. For surface staining cells were washed and stained in PBS 30 min at 4°C in the dark with the following fixable viability dye-eFluor 780 (eBioscience). For intracytoplasmic transcription factor staining, cells were fixed and permeabilized using transcription factor buffer set kit (BD Bioscience) before staining with AF647 anti-FoxP3 (clone 259D) from Biolegend, according to manufacturer instructions. For intracytoplasmic cytokine staining, the cells were fixed and permeabilized using Cytofix/CytoPerm Plus KIT (BD Bioscience) before staining with APC-IFN-γ (clone 45–15), FITC-IL-17A (clone CZ8-2361), PE-vio770-TNF-α (clone cA2), PE-IL-2 (clone N7.48A) all from Miltenyi Biotec, according to manufacturer instructions. Samples were directly acquired at the end of the staining on FACS Canto II (BD Bioscience) and data analyzed with DIVA software. The experiments were performed on a median TIL count of 1.106.
Stimulation of cultured-T cells
To evaluate intracellular cytokine production, REP-T cells were stimulated with anti-CD3/CD28 coated beads (Dynabeads Human T-Activator CD3/CD28, Life Technologies). Short-term (16 hours) stimulation was performed in RPMI 1640 HS medium.
To evaluate GARP expression, REP-T cells were stimulated with anti-CD3/CD28 coated beads (Dynabeads Human T-Activator CD3/CD28, Life Technologies). Three days stimulation was performed in RPMI 1640 HS medium.
To evaluate CD107a degranulation, REP-T cells were stimulated either with medium alone as a negative control or with phorbol 12-myristate 13-acetate/ionomycin (PMA/Iono) as a positive control (250 ng/mL and 10 g/mL, respectively, Sigma-Aldrich). Short-term (8 hours) stimulation was performed in RPMI 1640 SH medium.
Statistical analysis
Statistical analyses were carried out with Prism 7 software. All tests were two sided and the level of significance was set at p<0.05 (*p<0.05, **p<0.01, ***p<0.001, ****p<0.0001). Variables were expressed as median (min−max). For two-group comparisons, the nonparametric Student t-test (Mann-Whitney U test) was used. Frequency (percentage) was provided for the description of categorical variables. Proportions were compared using the χ2 test (or Fisher exact test, if appropriate). Patients’ progression relapse free survival (RFS) was estimated using the Kaplan-Meier method. The log-rank tests were used to compare survival distribution.
Hierarchical clustering analysis was performed using the online Morpheus software (https://software.broadinstitute.org/morpheus/). Briefly, percentages were first tabulated in a (.txt) file and then loaded in Morpheus software. Data were normalized with log2 and robust Z-score according to the software guidelines.
Results
Expansion and phenotypic characteristics of TIL from liver CRC metastases
Expanded T cells initially extracted from 21 over 23 liver metastases were obtained from patients with CRC whose characteristics are described in table 1. Tumor samples were mechanically dissociated into small fragments, enzymatically digested, and seeded on a 24-well plate (1×10⁶ cells/mL–3000 IU/mL of recombinant IL-2) (figure 2A). We named Pre-REP (Pre-REP) the time of culture (3–5 weeks) required to generate at least 50.106 T cells from liver metastasis fragments recovered after surgery. The median fold expansion of T cells after REP was 3438 (451–11 118) (figure 2B), above the expansion rate achieved by Turcotte et al with T cells extracted from GI cancer metastases (3438 vs approximately 1000).8
Patients with metastatic colorectal cancer characteristics (n=21)
Next, the frequencies of CD4 and CD8 T cells were analyzed at three major culture steps: D0, Pre-REP and post-REP. Median percentages of CD4 T cells and CD8 T cells at D0 were, respectively, 39.3% (30.2–74.5) and 56.4% (16.2–69.8) (figure 2C,D). Following Pre-REP and REP, the median of CD4 T cell percentages observed was, respectively, 51.8% (2.0–97.9) and 55.7% (27.9–91.9) (p=0.5214), compared with 47.9% (2.1–97.4) and 44.3% (7.7–71.8) for CD8 T cells (p=0.5523) (figure 2C,D). CD28 positive T cells are capable of long-term survival and expansion in vivo. Thus, we assessed CD28 expression before and after the REP.28 Expanded T cells expressed high levels of CD28 costimulatory receptor, both in CD4 and CD8 T cells as described in figure 2E,F. Median frequencies of CD28 on CD4 and CD8 T cells were 94.9% (31.6–99.4) and 93.7% (19.0–99.0), respectively, before the REP, and 58.1% (5.4–98.3) and 63.3% (7.3–87.5), respectively, after the REP. Additionally, since the clinical efficacy of adoptive cell therapy was previously correlated with expansion and persistence of transferred T cells, we decided to characterize the memory profile of REP T cells (figure 2G–I).29 REP expanded CD8 T cells were mostly effector T cells (TEFF) and effector memory T cells (TEM) with a median frequency of 61.1% (31.3–91.6) and 11.7% (1.2–59.2), respectively (figure 2H). A significant percentage of T cells was CD62L+CCR7− (21.6% (3.5–52.1)) suggesting a transition state of differentiation. As observed with CD8 T cells, REP expanded CD4 T cells were mostly TEFF and TEM with a median frequency of 63.9% (20.1–90.6) and 25.4% (3.3–74.9), respectively (figure 2I). Even if the term “T cell exhaustion” described various distinctive states of post-thymic T cells, the expression of both TIM-3 and PD1 is recurrent markers of reduced proliferative capacity and effector functions.30 Thus, the high rate of TEFF in REP expanded T cells led us to explore the expression of exhaustion-related proteins such as PD1 and TIM-3 on Pre-REP T cells. In addition, the expression of chemokine receptors related to CD4 T cell polarization states was also characterized.31 Based on percentage values of T cell subsets, an unsupervised hierarchical clustering analysis was performed using Morpheus software (figure 2J). We first identified that TIM-3 expression distinguished two subsets of Pre-REP T cells according to the level of TIM-3 expression. By contrast, PD1, Foxp3 or chemokine receptor expression did not display a specific distribution in the different T cell cultures. Then, this first set of experiments showed that lymphocytes from CRC liver metastases were successfully expanded with a median fold expansion suitable with a clinical scale processing. Moreover, TIM-3 expression distinguished two profiles of T cells expanded (Pre-REP) from CRC liver metastases.
TIM-3 expression discriminates T-cell cultures fold expansion
Previous studies reported that checkpoint inhibitory receptors altered T cell function and expansion in vitro and in vivo.30 32 Thus, we investigated the expression of three inhibitory receptors : PD1, cytotoxic T-lymphocyte antigen 4 (CTLA4) and TIM-3 on pre-REP T cell cultures according to the gating strategy presented in figure 3A. Medians for CTLA4, TIM-3 and PD1 expression on CD4 T cells were respectively 1.7% (0.1–7.2), 56.6% (3.2–96.2) and 47.8% (21.7–86.4) (figure 3B). Medians for CTLA4, TIM-3 and PD1 expression on CD8 T cells were, respectively, 1.3% (0.4–13.7), 45.8% (6.7–99.5) and 57.1% (11.2–87.0) (figure 2C). As suggested previously, these results enabled us to distinguish two subsets of pre-REP T cells based on TIM-3 expression: TIM-3 low T cells in which TIM-3 expression was lower than 45% both on CD4 and CD8 T cells and TIM-3 high T cells (figure 3B,C). We noted that regardless of TIM-3 expression status, PD1 expression was high on both CD4 and CD8 T cells (over 40%). Next, we observed a decrease of PD-1 expression both in CD4 and CD8 T cells after REP (CD4 T cells, p=0.0026 and CD8 T cells, p<0.0001). (figure 3D,E). Then, expression of PD-1 and CTLA-4 was analyzed according to TIM-3. CTLA-4 and PD-1 distributions were similar in CD4+ and CD8+ T cells expressing either high or low levels of TIM-3 (figure 3F,G). Finally, the median fold expansion of T cells after the REP was investigated according to Pre-REP TIM-3 expression (figure 3H,I). In CD4+TIM-3low culture, the median fold expansion was equal to 5126 (1458–11 118) compared with 1 353 (451–4756) within CD4+TIM-3high culture (p=0.0037) (figure 3H). The median fold expansion was equal to 4177 (1458–11 118) and 1273 (451–8892) within T cells cultures containing high levels of CD8+TIM-3low or CD8+TIM-3high, respectively (p=0.0197) (figure 3I). Collectively, these data showed that TIM-3 molecule expressed by Pre-REP T cells could predict the expansion capacities of liver metastases derived lymphocytes.
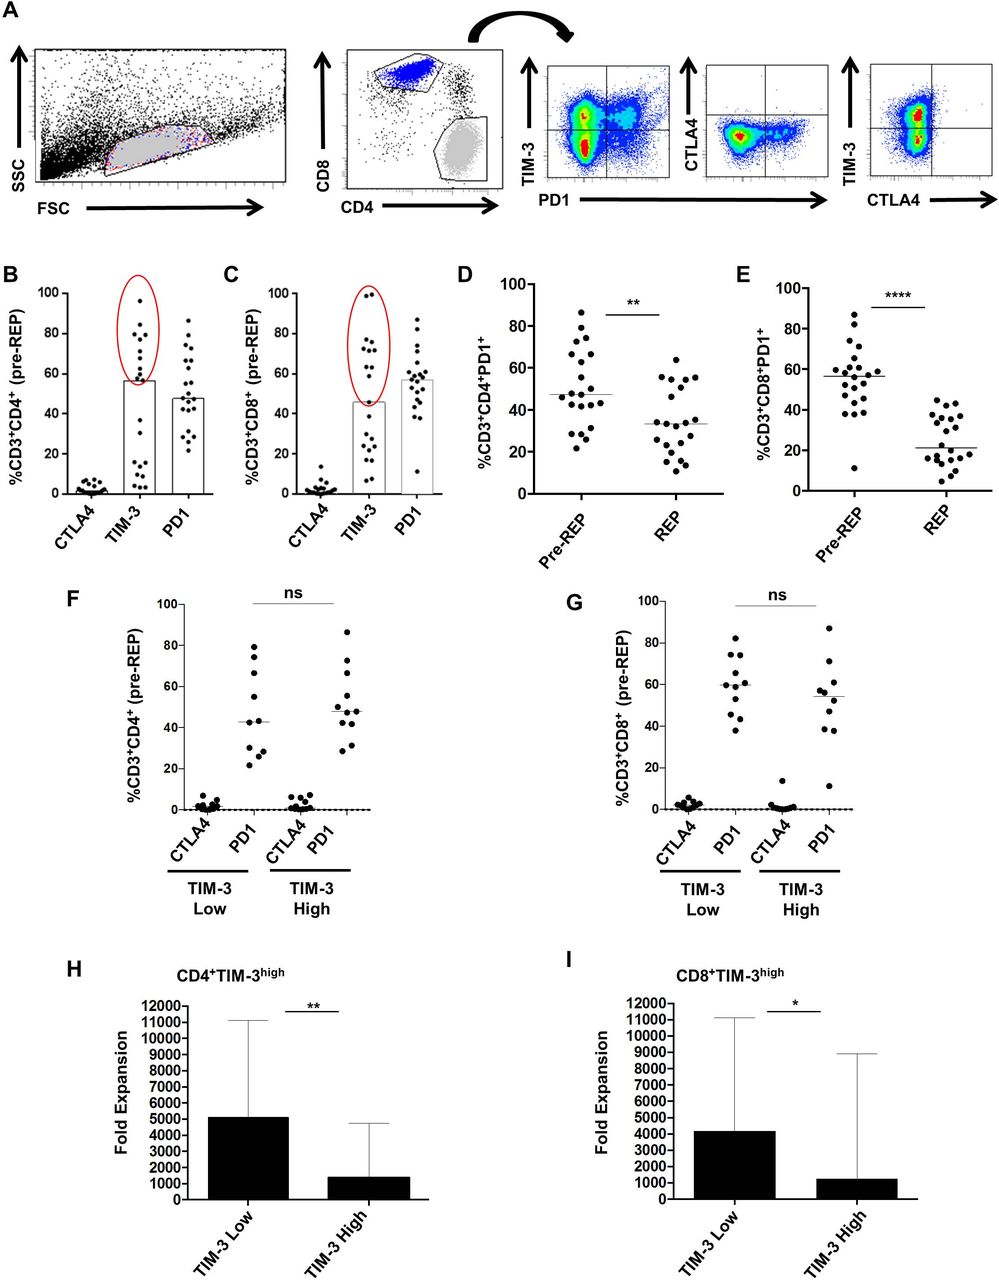
T cell immunoglobulin mucin domain-containing protein 3 (TIM-3) expression discriminates T-cell cultures fold expansion. (A) Gating strategy of inhibitory receptor expression profile on pre-rapid expansion protocol (REP) T-cells. (B, C) CTLA4, TIM-3 and programmed cell death protein 1 (PD1) expression (%) on CD4 and CD8 T cells were, respectively, 1.7% (0.1–7.2) and 1.3% (0.0–13.7), 56.6% (3.2–96.2) and 45.8% (6.7–99.5), 47.8% (21.7–86.4) and 57.1% (11.2–87.0). (D, E) Medians for PD1 expression (%) before and after REP, respectively, on CD4 (47.3 (21.7–86.4) and 33.4 (10.7–63.8) (p=0.0026)) and CD8 T cells (56.6 (11.2–87.0) and 21.2 (4.6–44.7) (p<0.0001)). (F, G) CTLA4 and PD1 frequencies according to TIM-3 expression on both CD4 and CD8 T cells. (H, I) Median fold expansion in TIM-3 low culture was higher than the one of TIM-3 high culture, both with CD4T and CD8T-cell (p<0.0037 and p<0.0196). Statistical differences were calculated using Mann-Whitney test.*P<0.05 ; **p<0.01 ; ****p<0.0001. ns, not significant. FSC, forward scatter; SSC, side scattered.
Functional potential of REP T cells
Our results have illustrated that Pre-REP expanded T cells expressed both PD1 and TIM-3 inhibitory receptors and that TIM-3 might predict T cell expansion capacities (figures 1J and 2F–I). A major characteristic of PD1+/TIM-3+ T cells is their loss of function in a hierarchical manner as described above.33 34 Thus, the next set of experiments was dedicated to determine the level of REP-TIL effector functions. First, we analyzed IFN-γ, TNF-α and IL-2 expression by CD4 and CD8 T cells, following a short CD3/CD28 stimulation. Median percentages of IFN-γ, TNF-α and IL-2 produced by CD4 T cells were, respectively, 72.9% (25.5–84.1), 68.8% (38.9–91.1) and 23.4% (2.4–69.8) (figure 4A). Median percentages of IFN-γ, TNF-α and IL-2 produced by CD8 T cells were, respectively, 62.5% (28.1–87.7), 56.2% (28.5–80.8) and 21.8% (8.0–52.9). Next, the cytokine production was analyzed with regards to TIM-3 expression (figure 4B). TIM-3 low CD4 T cells produced a higher amount of IL-2 when compared with TIM-3 high CD4 T cells (31.3% (18.9–69.8) vs 17.1% (2.4–39.3) p=0.0296). Additionally, we evaluated the presence of tumor reactive T cells within REP cultures. The detection of tumor-reactive T-cells using cryopreserved autologous tumor cell suspensions was not successful (n=4, data not shown). Then, we determined human leukocyte antigen (HLA)-A/B genotypes of the 21 patients for whom T cells cultures (pre-REP and REP) were generated. We found HLA-matched CRC cell lines for eight patients. Coculture of REP T cells and HLA-match CRC cell line (Colo 205, Colo 320 and HT29) was performed. We did not observe any CD107a expression suggesting the absence of shared tumor associated antigen recognition by the expanded T cells (data not shown). Nevertheless, in the presence of PMA/Iono, surface expression of CD107a was significantly higher when compared with control medium suggesting their capacity to degranulate following a proper activation (figure 4C). Despite high expression of both PD1 and TIM-3 within pre-REP T cell cultures, these experiments showed that CD3+ REP T cells produced Th1 cytokines such as IFN-γ, TNF-α and IL-2 on appropriate stimulation. As previously reported by Turcotte et al, these results suggest the absence or low level of shared tumor associated antigen recognition of T cells in liver metastasis from patients with CRC.8 Then, we decided to analyze if CD4 T cells derived from CRC liver metastases might contribute to immune suppression or inflammation.

Functional potential of rapid expansion protocol (REP) T-cells. REP T cells were subjected to a 16 hours CD3/28 bead stimulation (1:1) and analyzed by flow cytometry using intracellular staining for Th1 cytokines (IFN-γ, TNF-α and interleukin-2 (IL-2)) gating on CD4 and CD8 T cell populations (n=11). (A, B) IFN-γ, TNF-α and IL-2 expression by (A) CD4 and CD8 REP T cells and (B) according to TIM-3 expression. (C) CD107a production by previously stimulated CD8 REP T cells (n=8). Median (%) with 95 CI or median (%) (min–max). Mann-Whitney tests: *p<0.05; ns, not significant; TIM-3, T cell immunoglobulin mucin domain-containing protein 3; PMA/Iono, phorbol 12-myristate 13-acetate/ionomycin.
Foxp3 and TIM-3 expression within TIL derived from liver metastases are not correlated with clinical outcomes
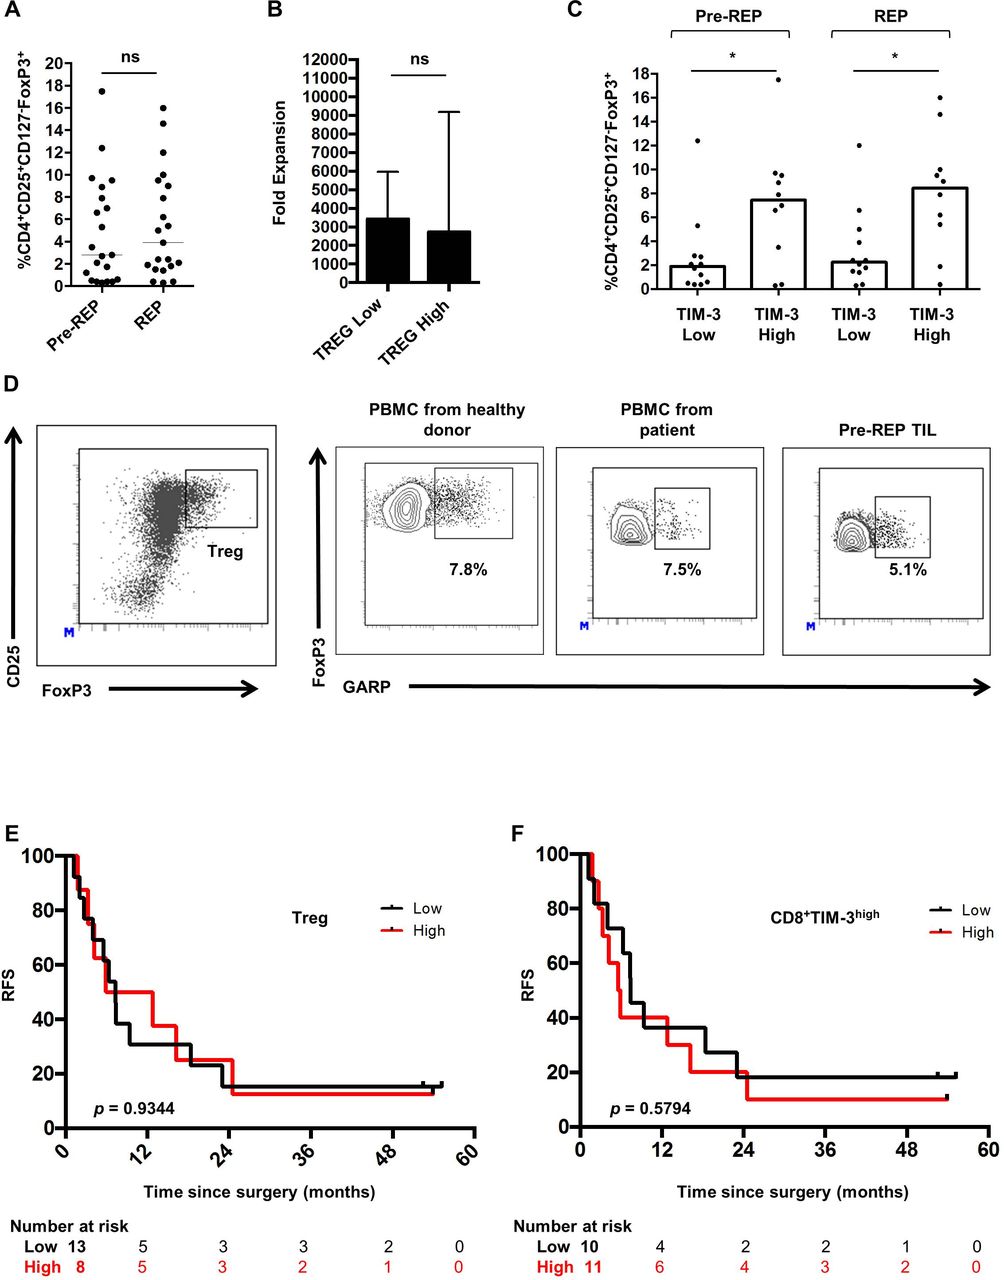
The presence of Treg cells might be another issue limiting both expansion and functional status of T cells. We therefore assess the percentage of FoxP3 positive lymphocytes within expanded CD4 T cells using FoxP3 intracellular staining on the CD3 +CD4+CD25highCD127− cell population (Treg) (figure 5A). Median frequencies of Pre-REP and REP-Treg were, respectively, 3.0% (0.3–17.5) and 3.9% (0.3–16.0). These results indicate that high doses of IL-2 did not polarized expanded T cells toward an immunosuppressive Treg phenotype. In line with previous results, the median fold expansion of T cells after the REP was investigated according to the rate of Treg in Pre-REP culture (figure 5B). The median fold expansion was 3438 (792–11 118) in Treg low culture and 2741 (451–9185) in Treg high culture (p=0.5920). Then, Tregs’ distribution was analyzed according to TIM-3 expression in T cells. Treg levels were lower in CD4+TIM-3low when compared with CD4+TIM-3high both in pre-REP cultures (p=0.0114) and REP cultures (p=0.0068) (figure 5C). Results were similar when Tregs’ frequencies were analyzed regarding TIM-3 expression on CD8 T cells (data not shown). Immunosuppressive potential of Treg cells is potentiated by the glycoprotein-A repetitions predominant (GARP), a transmembrane protein present on Treg but not on other T cells.33 In the next set of experiments, we hypothesized that Treg within Pre-REP T cells might express GARP protein. Over five Pre-REP expanded T cells, GARP level was low and most of Treg did not express this molecule. Moreover, GARP was expressed at similar levels on Treg from blood of healthy donors, patients with CRC and matched Pre-REP T cells (figure 5D). Next, we decided to elucidate whether the presence of Treg and exhausted CD8 T cells characterized by TIM-3 expression in Pre-REP T cells was correlated with clinical outcomes. First, the prognostic value of expanded Treg (Pre-REP) after liver surgery was investigated. Patients were separated into two groups (low vs high) using the median as a cut-off. A high level of Treg on expanded T cells did not influence patients’ RFS (p=0.9344) (figure 5E). Additionally, we investigated the prognostic value of expanded CD8 T cells according to TIM-3 expression (%) (low vs high) using the median as a cut-off. TIM-3 expression by CD8 T cells did not influenced patients’ RFS (p=0.5420) (figure 5F). Overall, both Treg and TIM-3 levels on CD8 T cells within pre-REP cultured T cells did not correlate with clinical outcomes of patients with CRC following liver metastasis surgery. Beyond the presence of Treg lymphocytes, the Th17 subset has been shown to exert immunosuppressive and cancer promoting functions.35 However, the presence of Th17 cells has been poorly investigated in the context of CRC liver metastases.

Characterization of Treg within T-cell cultures. (A) Regulatory T cells (Treg) was investigated by intracellular staining for FoxP3 on the CD4+CD25HighCD127− population before and after the rapid expansion protocol (REP) (p=0.2921). (B) Median fold expansion in Treg low and in Treg high culture. There was no significant difference (p=0.5920) (C) Percentage of Treg before and after REP according to T cell immunoglobulin mucin domain-containing protein 3 (TIM-3) expression on CD8 T cells. (D) Glycoprotein-A repetitions predominant (GARP) expression (%) on Treg within peripheral blood mononuclear cells isolated from healthy donors, patients with metastatic colorectal cancer (mCRC) and match Pre-REP T cells. Plots are representative of at least five experiments. (E, F) Kaplan-Meier curve for relapse free survival () according to the percentage of (E) Treg and (F) CD8+TIM-3+ T cells (low vs high) in Pre-REP T cell cultures following resection of liver metastases from patients with mCRC. Log-rank test was used for the comparison of survival curves. Mann-Whitney tests: *p<0.05, ns, not significant; PBMC, peripheral blood mononuclear cells; TIL, tumor-infiltrating lymphocytes.
Characterization and prognostic value of expanded Th17 lymphocytes
Th17 lymphocyte infiltration in primary CRC was suggested as a negative prognostic factor due to the secretion of proinflammatory cytokines such as IL-17A that notably promote angiogenesis and tumor resistance.29 34 Nevertheless, assessing the presence of Th17 directly into liver metastases remains an important issue. Here, we investigated the Th1 (CXCR3+CCR6−), Th17 (CXCR3−CCR6+) and Th1* (CXCR3+CCR6+) T cell subsets distribution within 35 pre-REP cultured T cells based on chemokine receptors CXCR3 and CCR6 expression. Patients’ characteristics according to Th17 level within expanded T cells (Pre-REP) (low vs high) are presented in table 2. Moreover, the functional polarization of lymphocyte subsets was validated based on IL-17A and IFN-γ production (figure 6A). TIM-3 expression was first analyzed according to CD4 T cell polarization respectively on CD4 and CD8 T cells (figure 6B,C). We highlighted that CD4 T cell polarization was not linked to TIM-3 expression. PBMC were not collected at the time of surgery for the 35 patients presented here. However, the levels of Th1, Th1* and Th17 were investigated in 17 other patients from whom we had PBMC at the time of surgery (online supplemental figure 1A). Additionally, we presented T cell polarization according to chemokine receptors expression both in PBMC and pre-REP cultured T cells for four patients in online supplemental figure 1B. Then, median frequencies of Th1, Th1* and Th17 cells were determined as being respectively equal to 34.0% (0.2–81.5), 50.7% (10.5–99.4) and 5.9% (0.2–33.0) (figure 6D). Finally, the prognostic value of expanded CD4 T cell subsets after liver surgery was investigated. Patients were separated into two groups (low and high) based on the median of each subset frequency as a cut-off. A high level of Th1 subset on expanded T cells did not influence patients’ RFS (p=0.2221) (figure 6E) as well as a high level of Th1* subset (p=0.3260) (figure 6F). Remarkably, a high level of Th17 subset was significantly associated with a poor RFS (p=0.0007) (figure 6G). Intriguingly, the level of Th17 within freshly isolated T-cells from liver metastases was not associated to patients RFS (data not shown). Together, these data showed that expanded T cells from liver metastases of patients with CRC with high levels of Th17 subset were associated with a poor prognosis in our cohort.
Supplemental material

Characterization and prognostic value of expanded Th17 lymphocytes. (A) Gating strategy of CD4 T cells Th1, Th17 and Th1* subsets relied on cytokine production of interleukin (IL)-17A and IFN-γ in regard of their chemokine receptors expression. (B, C) Levels of each Th cells within pre-rapid expansion protocol (REP) culture were analyzed according to (B) CD4+TIM-3low/high populations and (C) CD8+TIM-3low/high population.(D) Median frequencies of Th1, Th17, Th1* CD4 T cells and double negative subsets were, respectively, 34.0% (0.2–81.5), 50.7% (10.5–99.4), 5.9% (0.2–33.0) and 4.2% (0.0–29.5).(E–G) Kaplan-Meier curve for rapid expansion protocol (RFS) according to the percentage of Th1, Th1* and Th17 T cell (low vs high) in Pre-REP T cell cultures following resection of liver metastases from patients with metastatic colorectal cancer. Log-rank test was used for the comparison of survival curves. Median (%). *P<0.05, **p<0.01; ***p<0.001, ****, p<0.0001; ns, not significant; TIM-3, T cell immunoglobulin mucin domain-containing protein 3.
Patients with metastatic colorectal cancer characteristics according to Th17 level within expanded T cells (Pre-REP) (low vs high) (n=35)
Discussion
Tumor infiltration by T cells within primary tumor and its metastases represents an endogenous oligoclonal repertoire of T cell receptor (TCR) specific for tumor-associated antigens and tumor-specific neoantigens.9 22 36 The immune contexture defined by T cell infiltration is known to be a prognostic biomarker. Gathered evidence shows a correlation between immune infiltrate in CRC liver metastases and patients’ prognosis.37–39 In particular, Katz et al have demonstrated that the presence of a high CD8 T cell and a low CD4 T cell counts in tumor infiltrate were associated with patients’ survival following resection of CRC liver metastases.38 In some cancer subtypes (melanoma, human papillomavirus (HPV), sarcoma), lymphocytes expanded from tumor metastases were able to elicit an efficient, durable and complete antitumor response underscoring the opportunity to exploit them for therapeutic purposes.12 36 40 However, TIL expanded from metastases of GI cancers reacted poorly in previous studies.9 11 Indeed, Turcotte et al had demonstrated the feasibility to expand T cells from metastases of GI cancer in a small cohort of patients.8 TIL specificity from this cohort was low, despite a significant rate of 4-1BB, OX-40 and PD1 on T cells that were comparable to those from melanoma. Among others, one hypothesis for the absence of T cells reactivation capacity is the acquisition of an exhaustion phenotype-related program.41 One of the main interests of our study was to analyze the component of the expanded T cells which might be linked with survival of patients with CRC.
Exhaustion is characterized by poor effector functions (IL-2, TNF-α, IFN-γ production and killing capacity are lost), sustained expression of inhibitory receptors and a transcriptional state distinct from that of functional effector or memory T cells.42 In the present study, T cells’ exhaustion was analyzed through the expression of three inhibitory immune checkpoints, CTLA-4, PD1 and TIM-3, on expanded T cells. Our results confirmed the exhausted phenotype of T cells derived from CRC liver metastases as shown by PD1 and TIM-3 expression level in pre-REP culture (approximately 50% on both CD4 and CD8 T cells) and PD1 expression level in REP culture (approximately 33% and 21%, respectively, on CD4 and CD8 T cells). By contrast, CTLA4 was barely expressed. These results are in line with a previous study showing PD1 expression level on CD3 T cell from REP culture equal to 57%±21% and 42%±25%, respectively, in melanoma and lung cancers.43 Additionally, TIM-3 expression level but not PD1 was associated with a limiting expansion rate and discriminate two different Pre-REP T cells’ profiles. The negative correlation of TIM-3 with T cells expansion was observed both on CD4 and CD8 expanded T cells. The rate of Treg cells was higher in CD8+TIM-3high T cells cultures. This observation raises the hypothesis that CRC oncogenic signaling pathways are involved in direct regulation of both TIM-3 and Treg. In line with this hypothesis, Yan et al have shown in hepatocellular cell carcinoma that TGF-β signaling contributes to the coexpression of TIM-3 and FoxP3 within T cell cultures.44 Nevertheless, nor TIM-3 positive T cells neither Treg levels were correlated with clinical outcome of patients with CRC. In future research, it will be interesting to assess other transcriptional and phenotypic exhaustion markers in expanded T cells such as the transcriptional factors TCF-1 and TOX.41 Yet, Beltra et al recently described a four-stage developmental hierarchy of exhausted CD8 T cells in which the loss of TCF1 and the acquisition of TOX predicted terminally exhausted T cells. The aim should be to combine all these results with TCR profiling in order to identify tumor reactive T cells suitable for ACT based on their phenotypic and transcriptional profile.
The level of Treg in liver metastases from patients with CRC might be another element accounting from the poor T cells’ tumor reactivity. In CRC, the influence of Treg on the course of the disease is still a matter of debate.45 Yet, Foxp3 positive T cells are a heterogeneous population including various Treg subsets, such as nTreg and iTreg which can be defined using the transcription factor Helios. Another marker, CD15 can be used to distinguish immunosuppressive Treg (CD15+) from a non-immunosuppressive one.46 Another limitation regarding the influence of Treg is that most studies evaluated their prognostic significance in primary CRC. In the present study, we observed a high level of Treg in expanded T cells from CRC liver metastases. GARP expression was shown to characterize a Treg subset endowed with immunosuppressive activity. GARP function consists in binding latent TGF-β and to a latter extend confers immunosuppressive properties to Treg that suppresses other immune cells by activating latent TGF-β on their surface.47 GARP expression was never investigated in liver metastases from CRC. We presented the first analysis of GARP expression within CRC-derived T cells and matched PBMC. The analysis of GARP expression is among others, an attractive approach to estimate Treg immunosuppressive capacities. We report here that GARP was expressed at similar levels on Treg from blood of healthy donors, patients with CRC and matched Pre-REP T cells suggesting no increase in immunosuppressive capacities of Treg within expanded T cells (Pre-REP). These results also suggest that GARP is not an appropriate target for cancer immunotherapy in CRC.
T cells isolation is also an attractive tool to characterize the status of CD4 T cell polarization in tumor metastases of CRC. A previous work on CRC has shown multifactorial roles of Th17 cells promoting CRC outgrowth.35 Because CD4 T cell polarization is associated to an early stage CRC prognosis, we analyzed CD4 T cell polarization in cultured T cells using CXCR3 and CCR6 chemokine receptors, and IL-17A and IFN-γ cytokines, as previously described.26 35 Remarkably, we have highlighted a link between a high percentage of Th17 in expanded T cells and RFS following resection of liver metastases. By contrast, patients’ RFS is not linked to CCR6 expression (Th1*+Th17), suggesting the necessity to analyze CD4, CCR6 and CXCR3 together, which is a limit of immunohistochemistry. Th17 has been described as a heterogeneous subset. Indeed, Gaublomme et al demonstrated using single cell RNA-seq distinct Th17 subpopulations (n=5) in mice with experimental autoimmune encephalomyelitis (EAE) according to the disease pathogenicity.48 Additionally, key signatures related to EAE pathogenicity were identified using single cell scores in this study. Recently, Omenetti et al also described two populations of Th17 cells within mice gut microbiota elicited by Citrobacter rodentium and commensal bacteria.49 These Th17 cells had various inflammatory cytokine profile as well as transcriptomic and metabolic heterogeneity. Altogether, these results highlighted the heterogeneity of Th17 cells. In this study, we postulated that unexpanded Th17 cells were heterogeneous and that a particular subpopulation pre-existing in some patients might arises and take over other Th17 subpopulations within expanded T cells. This subpopulation might be the underlying cause of the prognostic value of Th17 cells within pre-REP cultured T cells. The presence of Th1* cells among tumor T cell infiltration had already been described.50 Kryczek et al demonstrated that IL-17A and IFN-γ secreted by Th17 cells act synergistically to stimulate CXCL9 and CXCL10 production to recruit effector T cell to the tumor microenvironment.51 Here, levels of Th1* by contrast to Th17 did not predict clinical outcomes and both subsets seem to play different roles in CRC metastases. Yet, literature suggests that epigenetic remodeling plays a key role in Th17/Th1* cell plasticity and differentiation.52 Ongoing studies investing on epigenetic modification of Th17 within CRC liver metastases could shed light to better understand their biology in views of remodeling the tumor microenvironment using molecule targeting epigenetic enzymes to reprogram Th17 toward a Th1 phenotype.
Taken together, our results show that T cells expanded from CRC liver metastases contain Th17 and high levels of TIM-3. The distribution of Th17 and not of other parameters monitored in this study was linked to patients’ clinical outcomes suggesting their strong biomarker potential in CRC context and a new promising treatment perspective.
Acknowledgments
The authors thank the patients for their participation in the study. They also acknowledge surgeons from the department of digestive surgery for their excellent work. They thank Guadalupe Tizon for English writing assistance.
References
Supplementary materials
Supplementary Data
This web only file has been produced by the BMJ Publishing Group from an electronic file supplied by the author(s) and has not been edited for content.
Footnotes
MK and CT contributed equally.
Contributors Conception, design and supervision: CB. Development of methodology: CB, OA and MJ. Acquisition of data: MK, CT, AB, II, and ER. Analysis and interpretation of data: MK, CT, LS, and JV. Writing, review and/or revision of the manuscript: MK, CT, and CB. Administrative, technical, or material support: MC, BH, YG, RL, and MJ.
Funding EFS Bourgogne Franche-Comté.
Competing interests None declared.
Patient consent for publication Not required.
Ethics approval Written informed consent was obtained from all individuals. ClinicalTrials.gov identifier of the study is NCT02817178. The study was conducted in accordance with the Good Clinical Practice guidelines and with the provisions of the Declaration of Helsinki (October 9th 2004).
Provenance and peer review Not commissioned; externally peer reviewed.
Data availability statement Data are available upon reasonable request.