Article Text

Abstract
Background The profound disparity in response to immune checkpoint blockade (ICB) by cutaneous melanoma (CM) and uveal melanoma (UM) patients is not well understood. Therefore, we characterized metastases of CM and UM from the same metastatic site (liver), in order to dissect the potential underlying mechanism in differential response on ICB.
Methods Tumor liver samples from CM (n=38) and UM (n=28) patients were analyzed at the genomic (whole exome sequencing), transcriptional (RNA sequencing) and protein (immunohistochemistry and GeoMx Digital Spatial Profiling) level.
Results Comparison of CM and UM metastases from the same metastatic site revealed that, although originating from the same melanocyte lineage, CM and UM differed in somatic mutation profile, copy number profile, tumor mutational burden (TMB) and consequently predicted neoantigens. A higher melanin content and higher expression of the melanoma differentiation antigen MelanA was observed in liver metastases of UM patients. No difference in B2M and human leukocyte antigen-DR (HLA-DR) expression was observed. A higher expression of programmed cell death ligand 1 (PD-L1) was found in CM compared with UM liver metastases, although the majority of CM and UM liver metastases lacked PD-L1 expression. There was no difference in the extent of immune infiltration observed between CM and UM metastases, with the exception of a higher expression of CD163 (p<0.0001) in CM liver samples. While the extent of immune infiltration was similar for CM and UM metastases, the ratio of exhausted CD8 T cells to cytotoxic T cells, to total CD8 T cells and to Th1 cells, was significantly higher in UM metastases.
Conclusions While TMB was different between CM and UM metastases, tumor immune infiltration was similar. The greater dependency on PD-L1 as an immune checkpoint in CM and the identification of higher exhaustion ratios in UM may both serve as explanations for the difference in response to ICB. Consequently, in order to improve current treatment for metastatic UM, reversal of T cell exhaustion beyond programmed cell death 1 blockade should be considered.
- melanoma
- immunity
- immunotherapy
- translational medical research
- tumor microenvironment
This is an open access article distributed in accordance with the Creative Commons Attribution Non Commercial (CC BY-NC 4.0) license, which permits others to distribute, remix, adapt, build upon this work non-commercially, and license their derivative works on different terms, provided the original work is properly cited, appropriate credit is given, any changes made indicated, and the use is non-commercial. See http://creativecommons.org/licenses/by-nc/4.0/.
Statistics from Altmetric.com
Background
Immune checkpoint blockade (ICB) by anti-cytotoxic T-lymphocyte-associated protein 4 (anti-CTLA-4) and/or anti-programmed cell death 1 (anti-PD-1), or anti-programmed cell death ligand 1 (anti-PD-L1) currently forms the most effective therapy in late stage cutaneous melanoma (CM). Long-term benefit in a fraction of patients has been observed,1–4 with a 5-year progression-free and overall survival (OS) rate for the combination of ipilimumab plus nivolumab of 36% and 52%, respectively.5 In contrast, the response rates in uveal melanoma (UM), a rare subset of melanoma (3%–5% of all melanomas, 0.6–0.7 cases/100,000/year), are disappointing (ranging from 0% to 15%), and none of the conducted phase III trials has reported significant OS benefit.6–13
To date, the underlying cause for the differences in response rate of CM and UM on ICB is unclear. The lack of success of immunotherapy modulatory therapeutics in UM could be explained by the lower average mutational burden in UM as compared with CM.14 A high tumor mutational burden (TMB) is predictive for response to ICB therapy across various cancer types.15 High TMB is thought to be associated with a high neoantigen load, thus possibly increasing the chance of being recognized by tumor-specific T cells.16 17 Interestingly, CM and UM originate from the transformation of the same cell type, that is, melanocytes, and as a consequence express the same melanoma differentiation antigens (MDA), for example, melanocyte protein (PMEL)/glycoprotein 100 (gp100), melanoma antigen recognized by T cells 1 (MART-1 or MelanA) and tyrosinase.18 19 Despite this similarity, CM and UM differ in oncogenic mutations and copy number alterations.20–23
Additional predictors for response to ICB include the presence of CD8+ T cells within the tumor, PD-L1 expression on tumor cells, PD-1 expression on T cells and alterations in the major histocompatibility complex (MHC) and interferon-gamma (IFN-γ) receptor pathways.24–27 In this study, we determined TMB, oncogenic mutations and expression of MDA in liver metastasis of patients with metastatic CM or UM. In order to determine whether these were associated with other predictors of response to ICB, we also compared the expression of PD-L1, MHC, IFN-γ induced gene signature and immune infiltration of CM and UM liver metastases (UM predominant metastatic site28). Prior comparisons of PD-L1 and immune infiltration in CM and UM were performed at different metastatic sites, or based on small numbers,29 30 thereby ignoring potential organ-specific influences. Our comprehensive comparison of CM and UM lesions from the same tissue site provides a unique opportunity to avoid possible site-specific bias to determine potential resistance mechanisms to ICB harbored by UM metastases.
Material and methods
Study population
A retrospective review of pathology records at the Netherlands Cancer Institute (NKI) identified 50 patients who underwent a liver biopsy or partial liver resection with a diagnosis of metastatic cutaneous or UM between 2002 and 2017 (online supplemental figure 1). As the number of liver biopsies/resections of patients with CM were low, we included an additional 16 samples from patients that underwent a liver biopsy or partial liver resection for metastatic CM between 1999 and 2017 at the Melanoma Institute Australia (MIA). The CM cohort consisted of 38 patients. The majority of patients (80%) did not receive any treatment prior to the liver biopsy. Some patients received treatment prior to the liver biopsy (online supplemental table 1), but all patients had progressive disease at the moment of the biopsy. In total, 22 patients underwent a biopsy/resection at the NKI and 16 patients at MIA. The UM cohort included 28 untreated patients who underwent a biopsy of a liver metastasis between 2012 and 2016 at the NKI within the SECIRA-UM study, in which all patients were treated with a combination of ipilimumab and radiofrequency ablation,31 following written informed consent. The study was approved by the Institutional Review Board of the NKI.
Supplemental material
DNA and RNA extraction
Tumor DNA and RNA was isolated from formalin-fixed, paraffin-embedded (FFPE) sections. A pathologist scored the tumor percentage and indicated the most tumor-dense region on a H&E stain slide for subsequent DNA/RNA isolation. A total of 5–10 FFPE slides (10 µm) were used for simultaneous isolation of DNA and RNA using the AllPrep DNA/RNA FFPE isolation kit (Qiagen, 80234) and the QIAcube, according to the manufacturer’s protocol.
Germline DNA was isolated from peripheral blood mononuclear cells using AllPrep DNA/RNA/miRNA Universal isolation kit (Qiagen, 80224) and the QIAcube, according to the manufacturer’s protocol.
RNA and whole exome sequencing
Strand-specific libraries were generated using the TruSeq RNA Exome Library Prep Kit (Illumina), according to the manufacturer’s instructions. In brief, total RNA was randomly primed and reverse transcribed using SuperScript II Reverse Transcriptase (Invitrogen) with the addition of Actinomycin D. Second strand synthesis was performed using Polymerase I and RNaseH, replacing dTTP with dUTP. Resulting cDNA fragments were 3′ end adenylated and ligated to Illumina Paired-end sequencing adapters and subsequently amplified by PCR. Libraries were validated on a 2100 Bioanalyzer using a 7500 chip (Agilent) and pooled. The pooled libraries were enriched for target regions using the probe Coding Exome Oligos set (CEX, 45MB), according to the manufacturer’s instructions (Illumina). The enriched libraries were subjected to a second round of enrichment followed by a 10-cycle PCR amplification and cleanup using AMPure XP beads (Beckman). Resulting target enriched pools were analyzed on a 2100 Bioanalyzer using a 7500 chip (Agilent), diluted and pooled equimolar into a multiplexed sequencing pool. Next, libraries were sequenced with 65 base pair (bp) single-end reads on a HiSeq2500 using V4 chemistry (Illumina). Fastq files were mapped to the human reference genome (Homo.sapiens.GRCh38.v82) using STAR(2.6.0 c)32 with default settings. Count data generated with HTseq-count33 was analyzed with DESeq2.34 Centering of the normalized gene expression data per dataset was performed by subtracting the row means and scaling by dividing the columns by the SD. Next, previously defined gene expression signatures (IFN-γ,35 microenvironment cell populations-counter (MCP-counter)36 and Danaher immune cell37) were analyzed. The average IFN-γ signature was calculated by the average z-score of all genes within the IFN-γ signature. Immune cell populations of the Danaher immune cell signature were evaluated by comparing the z-score of the immune subset. The distance among samples was computed using the Euclidean distance. DNA was fragmented up to 160–180 bp fragments by Covaris DNA shearing and purified using 2X Agencourt AMPure XP PCR Purification beads, according to the manufacturer’s instructions (Beckman Coulter). Library preparation for Illumina sequencing of the sheared DNA was performed using the KAPA Hyper Prep Kit (KAPA Biosystems, KK8504). DNA libraries were cleaned up using 1X AMPure XP beads. The libraries were sequenced with 100 bp paired-end reads on a HiSeq2500 System, according to the manufacturer’s instructions.
Whole exome sequencing data analysis
Fastq files were aligned to GRCh38 using Burrows-Wheeler Aligner,38 followed by marking of duplicate reads by Picard MarkDuplicates. Subsequently, base quality scores were recalibrated using GATK BaseRecalibrator and single nucleotide variants were called using GATK MuTect2.39 All identified mutations were required to have passed all Mutect2 tests (FILTER field equals “PASS”). Variants were subsequently annotated using Variant Effect Predictor (VEP).40 TMB was calculated by summarizing the total number of non-synonymous, somatic mutations per sample with minimal variant allele frequency (VAF) of 0.05 (5%).
The COSMIC mutational signatures (V2—March 2015)14 41–44 were assessed using MutationalPatterns.45 Both non-synonymous as well as synonymous somatic mutations with a minimal VAF of 0.05 were used to calculate the relative contribution of each of the 30 COSMIC signatures in each sample.
DNA copy number profiles were generated from the exome sequence data using CopywriteR46 with default settings and a 500 kb bins size. Segmentation was performed using circular binary segmentation47 after which gains and losses were identified using CGHcall.48
For neoantigen prediction, variants were annotated using SnpEff 4.3t.49 Based on these variants, candidate tumor-specific neoepitopes were predicted and annotated using an in-house epitope prediction pipeline, which uses a random forest model to score the probability of surface expression of candidate neoepitopes based on the major prerequisites for (neo-)antigen presentation: RNA expression level (Salmon V.0.9.1),50 proteasomal processing (NetChop V.3.1)51 52 and human leukocyte antigen binding (netMHCpan V.4).53 Candidate neoepitopes that have a model prediction score below 0.02 were filtered out.
Immunohistochemistry
Immunohistochemistry (IHC) of FFPE tumor samples was performed on a BenchMark Ultra autostainer (Ventana Medical Systems). In brief, paraffin sections were cut in 3 µm, heated at 75°C for 28 min and deparaffinized in the instrument with EZ prep solution (Ventana Medical Systems). Heat-induced antigen retrieval was carried out using Cell Conditioning 1 (CC1, Ventana Medical Systems) for 48 min at 95°C.
PD-L1 was detected using clone 22C3 (1/40 dilution, 1 hour at RT, Agilent/DAKO). Bound antibody was detected using the OptiView DAB Detection Kit (Ventana Medical Systems). Slides were counterstained with Hematoxylin and Bluing Reagent (Ventana Medical Systems). A scoring system of three levels of PD-L1 expression by IHC stain was used: less than 1%, between 1% and 50% and more than 50%. FFPE sections were stained for CD163 (clone: ERP14643-36, Abcam). Pigmentation was scored by a pathologist as 0–3 (0=no melanin pigment, 1=pigmentation visible at high power, 2=moderate pigmentation visible at low power, 3=high pigmentation readily visible at low power with dense melanin content).54
Digital spatial profiling of tumor biopsy FFPE tissues
Using NanoString’s GeoMx digital spatial profiling (DSP) we performed multiplexed and spatially resolved profiling analysis on pretreatment FFPE liver metastasis samples. The DSP technology uses a cocktail of primary antibodies conjugated to unique oligonucleotide tags with an ultraviolet (UV) photocleavable linker. Here, 4 µm-thick FFPE tissues were incubated with an antibody cocktail of 44 unique oligonucleotide-labeled antibodies (online supplemental table 2). Melanoma cells, leukocytes and T cells were defined by fluorescence imaging with antibodies for S100B/PMEL17, CD45 and CD3, respectively (online supplemental table 1). Based on fluorescence imaging, regions of interest (ROIs) (200 µm–600 µm in diameter) within the tumor-enriched tissue areas (S100B/PMEL17 positive) were chosen for multiplex profiling. Tumor-infiltrating lymphocyte (TIL) high and low ROIs were selected based on CD3 positive staining within these tumor-enriched tissue areas. Photocleaved oligos were transferred into a microwell and quantified using optical barcodes in the nCounter platform. For analysis, digital counts were first normalized with internal spike-in controls (External RNA Control Consortium; ERCCs) to account for technical variation, then normalized to the geometric mean of housekeeping controls of their defined ROIs, and subsequently background was subtracted using the IgG controls (rabbit, mouse).
Statistics
Statistical analysis was performed using GraphPad Prism 7 software (GraphPad Software, San Diego, California, USA) or with the R programing language. Measures of spread in PD-L1 and pigmentation were calculated using χ2 test. Measured of spread in immune infiltration, mean centered DSP data, or ratios in CM and UM patients were calculated using an independent t-test. For DSP analysis of individual data points, a linear mixed effect model was used to control for multiple sampling within a slide, using the Satterthwaite’s approximation for df for p value calculation. All analyzes were two-sided and used a significant level of p value ≤0.05.
Results
Distinct genomic profile of CM and UM at the same metastatic site
CM and UM have previously been shown to have a different genetic profile at the primary tumor site. Genome characterization has largely been restricted to primary tumors and a wide variety of metastatic sites, however, genome profiling of these melanomas at the same metastatic site is lacking. We performed whole exome sequencing on liver tumor samples and paired germline DNA from 16 CM patients and 15 UM patients to determine mutational burden and oncogenic drivers. As expected, a strong difference in TMB and oncogenic drivers between CM and UM liver metastases was observed (figure 1). UM liver metastases have significantly lower non-synonymous mutational load than CM liver metastases (p<0.0001, figure 1A,B), and consequently displayed fewer predicted neoepitopes (figure 1C).

Whole exome sequencing (WES) analysis of cutaneous melanoma (CM) and uveal melanoma (UM) liver metastases. (A) Mutation rates and mutational patterns of recurrent mutated CM and UM genes (with different mutation types coded differently) found by WES. Each column represents one patient. (B) Non-synonymous mutational load (altering amino acid sequence of protein) of CM and UM patients. The mean and SD are shown. (C) Number of predicted neoepitopes and tumor mutational burden (TMB) per patient. Predicted neoantigens were ordered from the lowest to highest rank. (D) Mutation Lolliplot displaying somatic mutations in BRAF. (E) Copy number alterations of CM (left) and UM (right) liver metastases. Alterations are ordered from chromosome 1–22. Red bar: copy-number gain; blue bar: copy-number loss. Orange: CM patients; blue: UM patients. Gray: untreated patients; pink: patient with prior treatment to biopsy. ****p≤0.0001.
Previous analyzes indicated that CM patients most frequently harbor alterations in BRAF, RAS, NF1, TP53 and CDKN2A, resulting in deregulation of the MAPK/ERK pathway in the majority of the CM patients.20 In UM, the most commonly mutated genes are GNA11, GNAQ, BAP1, EIF1AX and SF3B1, which leads to upregulated signaling via MEK, Akt and protein kinase C.21 22 These CM-specific and UM-specific mutations were also observed in the liver metastases samples (figure 1A). BRAF kinase mutations were present in 81% of the CM patients, 46% were located at codon 600 (figure 1D). In addition, BRAF mutations at other codons were observed, which could be a consequence of a high TMB and are therefore most likely passenger mutations (figure 1A,D). Most UM liver metastases carried mutations in GNA11 (67%), BAP1 (80%) and/or GNAQ (27%). Only one CM tumor carried a GNA11 mutation, which has previously been described in a rare subgroup of CM which is also characterized by a lower mutational burden.55 The UM-specific mutations in EIF1AX and SF3B1 were observed less frequently than the UM-specific GNAQ/11 and BAP1 mutations, which may potentially be explained by a lower metastatic rate of UM tumors with EIF1AX and SF3B1 mutations.56
Chromosomal anomalies that are often found in primary tumors of CM and UM patients were also detected in the liver metastases of these patients.23 57 Specifically, loss of chromosome 6q, 8p, 9 and 10, and copy number gains in chromosome 6p, 7, 8, 20 were observed in CM metastases (figure 1E). Copy number aberrations on chromosome 1 (1p loss, 1q gain), chromosome 3 (loss), chromosome 6 (6p gain, 6q loss) and chromosome 8 (8p loss, 8q gain) were observed in UM metastases (figure 1E). Overall, the genetic differences between CM and UM are maintained at the metastatic site.
Pigmentation and MDA expression of CM and UM liver metastases
Both CM and UM arise from the transformation of melanocytes. Regardless of the fact that they have common lineage from melanin-producing cells, CM and UM showed a significant difference in the level of pigmentation. Whereas 58% of the UM metastases displayed pigmentation (score 1, 2 or 3), only 27% of CM metastases showed presence of melanin pigmentation (p=0.0265) (online supplemental figure 2A,B). These pigment-producing cells can express the same MDA (PMEL, MelanA, tyrosinase), however there was only significant difference for MelanA (MLANA) (p=0.0062) (online supplemental figure 2C,D); UM patients had a significantly higher expression of MelanA compared with CM patients.
Comparison of PD-L1 and MHC expression between CM and UM liver metastases
PD-L1 expression was analyzed by conventional IHC and DSP, in order to determine if this predictor could explain the difference in response rate of CM and UM patients to ICB. Both techniques identified higher and more frequent PD-L1 expression on CM liver samples compared with UM samples (figure 2A–C). Specifically, although the majority of both UM and CM liver metastases lacked PD-L1 expression, the percentage of PD-L1 positive CM metastases, as determined by IHC, was significantly higher (11/41, 27%) as compared with UM metastases (2/31, 6%) (p=0.0260, figure 2A). This observation was confirmed by DSP analyzes, showing a significantly higher expression of PD-L1 (p=0.0068) in CM as compared with UM liver metastases (figure 2C). CM patients that received treatment prior to biopsy did not show higher PD-L1 expression to untreated CM patients (online supplemental figure 2E).

Programmed cell death ligand 1 (PD-L1) expression and major histocompatibility complex (MHC) expression of cutaneous melanoma (CM) and uveal melanoma (UM) liver metastases. (A) Immunohistochemistry (IHC) quantification of PD-L1 expression of CM and UM liver metastases. (B) Representative IHC for PD-L1 scoring. (C) Comparison of PD-L1 expression of CM and UM liver metastases by digital spatial profiling (DSP) analysis, showing the mean and SD. (D) B2M and (E) human leukocyte antigen-DR (HLA-DR) expression by DSP analysis of CM and UM liver metastases. The mean and SD are shown. Orange: CM patients; blue: UM patients. ns p>0.05, **p≤0.01.
Loss of MHC has previously been described as an escape mechanism from ICB therapy.25 58 Using DSP analysis, we assessed expression of MHC class I and class II proteins by staining for β2 microglobulin (B2M) and HLA-DR, respectively (figure 2D,E). No significant difference in B2M and HLA-DR expression between CM and UM was found.
Immune cell infiltrates in CM and UM liver metastases unveil similarities
PD-L1 expression has been reported to be positively correlated with immune cell infiltration,59 and the observed difference in PD-L1 expression between CM and UM could therefore potentially be coupled to a difference in immune cell infiltrate. To address this, immune-related signatures that have previously been correlated with clinical benefit to ICB therapy in late stage malignancies35–37 were assessed. In this analysis, we focused on the previously defined IFN-γ,35 MCP-counter36 and Danaher immune cell37 signature. The IFN-γ response signature showed no apparent difference in expression between CM and UM samples (figure 3A). As PD-L1 forms one of the IFN-γ responsive genes,60 we also evaluated the association between PD-L1 expression and IFN-γ gene expression profile of CM and UM metastases. A positive correlation between IFN-γ (defined as the average expression of genes included in the IFN-γ signature) and PD-L1 expression was observed (figure 3B).

Comparison of immune cell infiltration of cutaneous melanoma (CM) and uveal melanoma (UM) liver metastases. Heatmaps of the gene signatures (A) interferon-gamma (IFN-γ)35 (C) microenvironment cell population (MCP) counter36 and (D) Danaher immune cell signature.37 Columns represent patients (CM patients (orange); UM patients (blue). Hierarchical clustering of the gene signatures is displayed MCP counter and Danaher immune cell signature.) and rows genes. Positive values (red) are indicated as higher expression, negative values (blue) are indicated as lower expression. (B) Programmed cell death ligand 1 expression (quantified by immunohistochemistry) and average expression of IFN-γ gene signature for CM (orange) and UM (blue) patients. (E) Normalized expression of immune cell subsets of the Danaher immune cell signature for CM and UM liver metastases, displaying the mean and SD. (F) Digital spatial analysis of CM and UM liver metastases for CD3, CD4 and CD8 expression. The mean and SD are shown. (G) The ratio of immune cell subsets values of the Danaher immune cell signature. The mean and SD are shown. (H) Non-synonymous tumor mutational load (TMB) and ratio of immune cell subsets of panel (G) for CM (orange) and UM (blue) patients. (I) IFN-γ score (positive (+) or negative (−) average expression of IFN-γ gene signature expression) and ratio of exhausted T cells to CD8 T cells (defined by the Danaher immune cell signature) for CM (orange) and UM (blue) patients. The median is shown. The statistical differences of the different immune cell infiltration were compared through independent t-test. ns p>0.05, *p≤0.05, **p≤0.01.
The MCP-counter signature, which quantifies the absolute abundance of eight immune and two stromal cell populations, showed also no difference in immune cell infiltrates between CM and UM samples (figure 3C). When applying the Danaher immune cell signature evaluating a set of marker genes for different immune cell subpopulations, no distinct difference between CM and UM patients was found (figure 3D). Comparing the different immune subsets of the Danaher signature, showed no significant difference in expression between CM and UM patients (figure 3E). These findings on RNA level were also confirmed by DSP data, in which no difference in protein level of CD4 and CD8 was observed between CM and UM patient samples (figure 3F). However, a significantly lower expression of CD3 in UM liver metastases was found compared with CM liver metastases (p=0.0433). This could potentially indicate a higher expression of CD3+CD4−CD8− double-negative T cells61 in CM liver metastases compared with UM liver metastasis, however, a single cell characterization (eg, multiplex IHC or flow cytometry) for CD3, CD4 and CD8 expression would be required in order to prove this.
Next, we examined the ratio between different immune subsets identified by the Danaher immune cell signature. Strikingly, the ratio of exhausted CD8+ T cells (defined by the RNA expression of LAG3, CD244, EOMES, PTGER4) to cytotoxic T cells (defined by the RNA expression of Perforin 1, Granzyme A/B/H, NKG7, KLRK1, KLRB1, KLRD1, CTSW, GNLY), CD8+ T cells (defined by the RNA expression of CD8A and CD8B) and Th1 cells (defined by the RNA expression of TBX21) was significantly higher in metastases of UM patients compared with CM patients (p=0.0061, p=0.0058, p=0.0312, respectively, figure 3G), while the individual subsets of these T cells (exhausted CD8+ T cells, cytotoxic T cells, CD8+ T cells and Th1 cells) in both tumors was similar (figure 3E). In addition, the ratio of exhausted CD8+ T cells to cytotoxic T cells, to CD8+ T cells and to Th1 cells were also associated with TMB (figure 3H), in which a higher TMB was associated with a lower ratio of exhausted CD8+ T cells to the other immune populations. Furthermore, a high IFN-γ score (defined as average expression IFN-γ signature) was likewise associated with a lower ratio of exhausted CD8+ T cells to CD8+ T cells in UM metastases (p=0.0386) (figure 3I). These data are both consistent with a model in which the relative level of T cell exhaustion is associated with melanoma subtype and with a model in which low TMB—and consequently low immunogenicity—is associated with increased T cell exhaustion.
CM and UM liver metastases show differences at the transcriptome level
To further explore the dissimilarities between CM and UM liver metastases, we performed additional transcriptional analyzes of CM and UM liver metastasis samples. First, we evaluated the distance among samples. An apparent clustering of CM and UM samples was detected (figure 4A). In order to further investigate which genes contribute to this difference, we analyzed the genes that were differentially expressed genes (DEGs) between CM and UM liver metastases (figure 4B), and identified 6523 DEGs (p<0.05). The genes with the lowest p values that were found to be more highly expressed in CM liver metastases were hardly expressed in UM liver metastases, and vice versa (figure 4C). The stark difference between CM and UM liver metastases was also highlighted when CM and UM were analyzed for disparities by principal component analysis. Comparing PC1 to PC2 showed a close clustering of UM samples, more closely to PC2, while CM samples cluster less together (figure 4D).

Transcriptional profile of cutaneous melanoma (CM) and uveal melanoma (UM) liver metastases. (A) Distance matrix with hierarchical clustering of CM (orange) and UM (blue) patient sample. (B) Volcano plot of differentially expressed genes (DEGs), showing 6523 significant genes (p≤0.05) in blue and p>0.05 in red. Left: genes higher expressed in UM; right: genes higher expressed in CM. (C) Heatmap based on the top 20 most significant DEGs higher in CM (orange) and UM (blue). Positive values (red) are indicated as higher expression, negative values (blue) are indicated as lower expression. (D) Comparison of CM and UM samples by principle component analysis, showing PC1 and PC2. CM in orange dots, UM in blue dots. (E) Gene set enrichment analysis of DEGs between CM (orange) and UM (blue) patient samples, ordered according to the false discovery rate (FDR), in which the pathways with an FDR<0.05 are shown.
Gene set enrichment analyzes (GSEA) on DEGs and PC1/PC2 (figure 4E, online supplemental figure 3) demonstrated increased expression of hallmark gene sets involved in metabolic pathways, such as oxidative phosphorylation (OXPHOS), xenobiotic metabolism and fatty acid metabolism in UM. It has previously been described that UM is ranked among the tumors with the highest OXPHOS signature,62 and this property has been associated with invasiveness and drug resistance.63 Pathways upregulated in CM involved proliferation (mitotic spindle, E2F targets, MYC targets and G2M checkpoint) and immune pathway (tumornecrosefactor-alfa (TNFA) signaling via NFKB) (figure 4E). GSEA on PC1 showed a diversity of enriched biological states or processes, and revealed significant enrichment of genes upregulated in response to UV radiation. An estimated 60%–70% of CM are thought to be caused by UV radiation exposure. This fits with the observation that a part of the CM samples tend to correlate to PC1, which was not observed for the UM samples. In addition, analyzes for the presence of COSMIC mutational signatures showed a contribution of UV-related mutations (COSMIC signature 7) in the CM samples (online supplemental figure 4). GSEA on PC2 also revealed in the highest ranked pathways (based on false discovery rate) an enrichment for immune associated pathways (TNFA signaling via NFKB, IL6 JAK STAT3 signaling, interferon alpha and gamma response) (online supplemental figure 3).
DSP analysis of CM and UM liver metastases
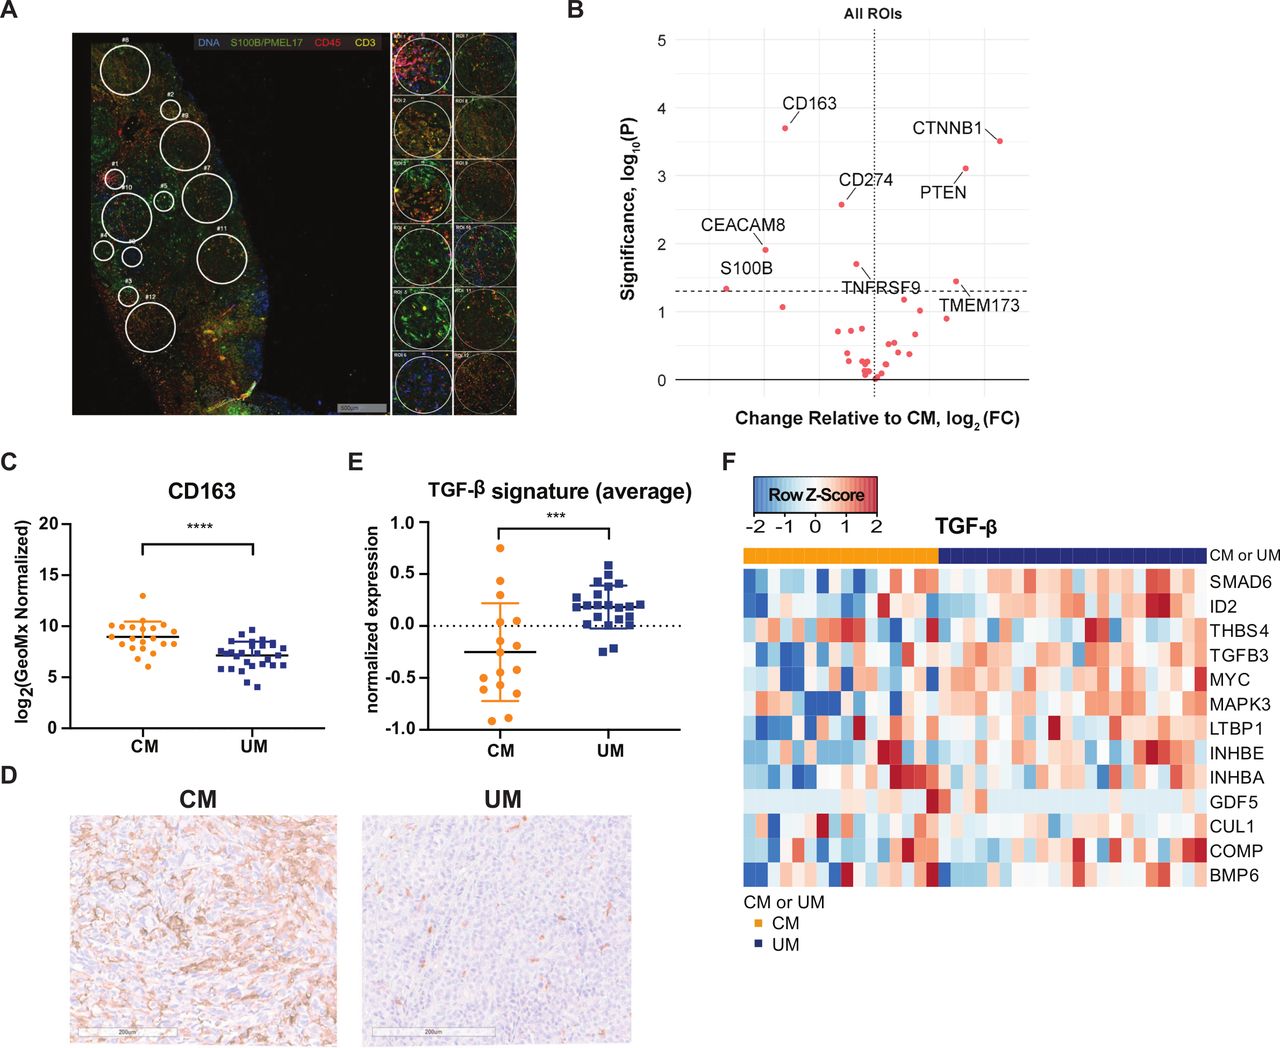
Unbiased comparison of CM and UM by DSP analysis revealed significantly higher expression of phosphatase and tensin homolog (PTEN) and β-catenin (CTNNB1) in UM liver metastases compared with CM liver metastases when taking both areas with high and low TIL infiltration into consideration (figure 5A,B, online supplemental figure 5). The higher expression of PTEN in UM liver metastases is in line with the previous observation that a part of CM liver samples have a missense mutation in the tumor suppressor gene Pten and a loss of chromosome 10 (location Pten) (figure 1A,E), and as a consequence lower or absent protein expression (figure 5B). In addition, a significantly higher expression of β-catenin is observed in UM liver metastases compared with CM liver metastases.
Digital spatial profiling (DSP) analysis of cutaneous melanoma (CM) and uveal melanoma (UM) liver metastases. (A) Example of regions of interest (ROI) selection using the visualization makers syto13 (blue), S100B/PMEL17 (green), CD45 (red) and CD3 (yellow). Per patient 12 ROIs were selected in tumor-infiltrating lymphocyte (TIL) high, low or random areas. areas of 200 µm in diameter (n=6) and 600 µm in diameter (n=6) were placed. (B) Volcano plot of differently expressed markers by DSP analysis. Left: markers higher expressed in CM; right: markers higher expressed in µm. Dotted line p value cut-off. (C) DSP analysis of CM and UM liver metastases for CD163. The mean and SD are shown. (D) Representative immunohistochemistry for CD163 staining. (E) Average expression of transforming growth factor beta (TGF-β) gene signature for CM (orange) and UM (blue) patients. The mean and SD are shown. (F) Heatmap of transcription TGF-β gene signature.65 Columns represent patients (CM patients (orange); UM patients (blue)). Positive values (red) are indicated as higher expression, negative values (blue) are indicated as lower expression. ***p≤0.001, ****p≤0.0001.
DSP analysis also revealed significantly higher expression of CD163 (marker for monocytes/macrophage lineage) (p<0.0001) and CD66b/CEACAM8 (marker for granulocytes) in CM liver metastases compared with UM (figure 5B,C). To confirm our DSP analysis observation, an IHC stain for CD163 was performed on the FFPE slides, and a clear difference in CD163 expression was observed (figure 5D). This implies that CM liver metastases have a higher infiltration of CD163+tumor associated macrophages (TAMs). TAMs in the tumor microenvironment (TME) could release anti-inflammatory cytokines, such as interleukin (IL)-10 and transforming growth factor beta (TGF-β), which inhibit other immune cell functions.64 In order to determine whether there was an associated higher expression of TGF-β in CM liver metastases compared with UM liver metastases, we examined for the TGF-β pathway associated gene signature.65 However, we observed that liver metastases of CM patients exhibit a lower (average) expression of the TGF-β signature compared with UM patients in general (p=0.0005, figure 5E,F).
Discussion
Despite their shared origin, CM and UM respond differently to ICB. This makes these tumors an interesting model to identify parameters that may be responsible for ICB resistance. The major reason for the difference in response to ICB is postulated to be a higher TMB in CM,14 and consequently an expression of a higher number of neoantigens that can be recognized by tumor-specific T cells.17 However, until now, CM and UM have been predominantly analyzed by comparison of primary tumors or metastases at different sites. The former comparison is complicated by the fact that, contrary to skin, the eye is considered an immune privileged site, and the latter analysis includes possible site-specific influences on tumor immune infiltrates as a potential confounder. In this study, we performed the first comprehensive comparison of CM and UM liver metastases for predictors for response; TMB, predicted neoantigens, immune infiltration, PD-L1 expression and MHC expression.
TMB is predictive for the response to ICB across multiple cancer types.15 The neoantigens that are generated as a consequence of tumor-specific mutations can induce a tumor-specific immune response, likely explaining the observed relationship.17 In line with prior data, we demonstrated that liver metastases of CM patients have a significantly higher TMB, and hence a higher amount of predicted neoepitopes, than UM liver metastasis, and this difference is likely to contribute to the low response rate of UM patients to ICB.6–13 While TMB and predicted neoantigen load were higher in CM, expression of MDA (PMEL, MelanA, tyrosinase), which are common targets for endogenous self-antigen reactive T cells, was as high or even higher for UM patients than for CM patients. While the evidence is indirect, collectively these data are consistent with a dominant role of neoantigens relative to MDA in clinical response to ICB.17 Potentially, the activity of MDA reactive T cells is capped by self-tolerance, and therapies targeting these MDA (eg, CAR-T-cell therapy or bispecific molecules) might be a potential treatment option for UM.66 A phase I study with bispecific IMCgp100 (tebentafusp) antibody consisting of a soluble affinity enhanced TCR for gp100 and an anti-CD3 fragment, has shown promising results, with a progression-free survival and 1-year OS of 62% and 73%, respectively in patients with advanced UM.67
Genetic alterations in the MHC and IFN-γ pathways have been shown to be predictors for response to ICB.25–27 In this study, MHC class I and II protein expression was not specifically assessed on tumor cells only, indicating that our result could have been biased by expression of MHC on infiltrated immune cells. However, assessment of MHC class I and II expression in TIL low regions also revealed no difference in the expression of B2M and HLA-DR. This is in line with findings by Rothermel et al,68 where no difference in loss of MHC class I between CM and UM samples was found. This makes MHC loss as an unlikely immune escape mechanism in UM, although a complete analysis for HLA stains (HLA-A/B/C and HLA-DR/DP/DQ) is required to be conclusive. Due to the scarce and small biopsies of liver metastases, no material was left to perform this additional staining.
PD-L1 expression on tumor cells and PD-1 expression on T cells, is also predictive for response to anti-PD-(L)1 therapy.24 69 A significantly lower PD-L1 expression was found in UM metastases compared with CM metastases, which could potentially contribute to low response rate to ICB in UM patients. Although higher expression of PD-L1 was observed in CM metastases, we observed that the majority of liver metastases of CM and UM patients lacked PD-L1 expression, which could be a consequence of less IFN-γ driven PD-L1 expression60 and is in line with another trial that reports low PD-L1 expression in liver metastases of CM patients compared with other metastatic sites.29 Furthermore, it has been shown that liver metastases are the least responsive metastatic site to ICB.70–72
Interestingly, and despite the stark difference in TMB, the infiltration of different T cell subpopulations (cytotoxic T cells, exhausted CD8 T cells, CD8 T cells, Th1 cells) was comparable between CM and UM. Our observation is in line with previous work, comparing metastatic UM to metastatic CM samples, that also found no difference in CD8+ T cell infiltration.29 30 Moreover, clonal expansion of T cells, indicative of prior antigen driven proliferation, was found in UM tumors.73 In a subset of UM patients TIL reactivity to autologous tumor was found in the same magnitude as CM TIL, and an absence of pigmentation was correlated with TIL reactivity to autologous tumor.68 In our study a loss of pigmentation in UM liver metastases was also found. The reactivity of TIL to autologous tumor implies that metastatic UM patients express antigens that can be recognized by the adaptive immune system. This was also illustrated by a phase II clinical trial, in which 20 metastatic UM patients were treated with adoptive cell transfer of autologous TILs, achieving an objective response in seven patients (35%).74 The activity of tumor-specific T cells in UM may be held back by immunosuppressive molecules in the TME, such as an overall higher expression of TGF-β pathway associated gene signature was found in UM compared with CM liver metastases. In addition, we found a higher expression of β-catenin in UM compared with CM liver metastasis, which has been reported to negatively regulate T cell activation.75 76 Our data, together with previous reported data, indicate that the resistance to ICB by UM tumors can neither be explained by a lack of immune infiltration, nor fully by invisibility of the tumor cells mediated by MHC loss.
The only differences in immune infiltrates between CM and UM was found for the expression of CD163 (marker for tumor-associated macrophages; TAMs) and in composition of the T cell infiltration. Liver metastases of UM showed a lower expression of CD163 compared with CM (based on DSP analyzes). Previous studies observed infiltration CD163+TAMs in both CM and UM,77 but also fewer TAMs in metastatic UM compared with metastatic CM were observed.78 However, the presence of TAMs is associated with worse patient outcome for both metastatic CM and UM,79 80 which makes it unlikely that the disparity in CD163 explains the difference in response rate to ICB. The striking difference in composition of the T cell infiltration that we observed was that UM patients have a higher ratio of exhausted CD8 T cells, as defined by expression of LAG-3, CD244, EOMES and PTGER4, to Th1, cytotoxic and CD8 T cells. LAG-3 and CD244 have been associated with impaired T cell activation in a variety of malignancies.81 82 Our data are in line with a single cell sequencing analysis of UM tumors that revealed that tumor infiltrating immune cells expressed predominantly LAG-3, rather than PD-1 or CTLA-4.73 Targeting these molecules, for example, through anti-LAG-3, might re-invigorate the dysfunctional T cells, or in an adjuvant approach in early stage UM might even prevent exhaustion. The first clinical trial with an anti-LAG-3 antibody in combination with nivolumab reported responses in anti-PD-1 refractory LAG-3 high CM patients.83 No (ongoing) trials testing combination therapy with anti-LAG-3 antibody have been reported for UM. In addition, exhausted TILs have been described to be reversed in their functionality as a result of high dose IL-2.84–86 Thus, addition of IL-2 to PD-1±CTLA-4 blockade might be an option to restore the observed unfavorable T exhausted/T effector ratio in UM. Whether these exhausted CD8 T cell are terminally dysfunctional needs to be tested in subsequent work. If this would be the case, then combined blockade of LAG-3 and PD-1 might remain challenging.87
In summary, this is the largest analysis of UM and CM metastases in one organ site, and showed that UM liver metastases are similarly immune infiltrated as CM liver metastases. A lower PD-L1 expression, TMB, and subsequent neoantigens density could explain the lack of success of immunotherapy in late stage UM. One could think of a “neoantigen lottery model,” in which UM patients need more chances to get the one activated tumor-specific T cell clone to eradicate their tumor.17 Our data on a higher T cell exhaustion ratio and higher expression of MDA, indicate that therapeutic approaches that can reverse exhaustion of TILs, for example, TIL, IL-2, CAR-T (targeting MDA) or anti-LAG-3, might be promising approaches for successful immunotherapy in UM.
Acknowledgments
We thank other members of the Blank and Peeper laboratory for valuable discussion. We would like to acknowledge the NKI-AVL Core Facility Molecular Pathology & Biobanking (CFMPB) for supplying NKI-AVL Biobank material and/or lab support. We would like to acknowledge the NKI Genomics Core Facility (GCF) for the quality control of the RNA and DNA samples, for the preparation of sequencing libraries for Illumina TruSeq RNA Exome Sequencing and for IDT Exome Sequencing, for operating the HiSeq2500 machines, for demultiplexing the FASTQ files, for the alignment to the genome and/or transcriptome, for variant calling and for storing the datasets. GVL and RAS are supported by NHMRC Practicitioner Fellowships, and GVL is supported by the Medical Foundation at the University of Sydney. MIA acknowledge the Lady Fairfax Charitable Trust.
References
Supplementary materials
Supplementary Data
This web only file has been produced by the BMJ Publishing Group from an electronic file supplied by the author(s) and has not been edited for content.
Footnotes
Twitter @Twitter @ProfRScolyerMIA
Contributors EPH wrote the manuscript with input from EAR, TMV and CB. Data was analyzed and interpreted by EPH, EAR, OK, TMV and CB. PD, OK SLCK and KB performed the bioinformatics analysis. DSP gave input and supervised OK. PK gave input and supervised SLCK. EAR, JWC, IPdS and EK selected and provided the tumor samples. GVL and RAS supervised JWC and IPdS. RAS provided pathological oversight. TMV did the digital spatial profiling analysis. JvdW assessed the samples and scored PD-L1 staining and pigmentation. AB was responsible for storing and processing the tumor samples. RMK was responsible for sequencing of the tumor samples. JWR performed the statistical analysis of the DSP data. SW was responsible for the DSP analysis. Outline of study proposal and critical input was given by TS and CB. All authors critically revised the manuscript.
Funding This work was supported by Bristol-Myers Squibb (BMS) under I-O project OT123-284.
Competing interests EAR received travel support from NanoString Technologies and MSD. TMV received travel support from BMS. JWR is an employee and stockholder of Nanostring Technologies. SW is an employee and stockholder of Nanostring Technologies. PK reports receiving commercial research grants from Bristol-Myers Squibb and Merck and is a consultant/advisory board member for Neon Therapeutics and Personalis. RAS reports having received fees for professional services from Qbiotics, Novartis, MSD Sharp & Dohme, NeraCare, AMGEN, Bristol-Myers Squibb, Myriad Genetics, GlaxoSmithKline and us supported by a National Health and Medical Research Council of Australia (NHMRC) Program Grant and NHMRC Practitioner Fellowship. Support from the Ainsworth Foundation, ClearBRIDGE Foundation and colleagues at Melanoma Institute Australia and Royal Prince Alfred Hospital are also gratefully acknowledged. EK has served as a consultant advisor for BMS, Novartis, Roche, Merck, Amgen, Pierre-Fabre, EISAI, Bayer, Genzyme-Sanofi for which the institution (LUMC) received funding, and received research grants from BMS. DSP is cofounder, shareholder and advisor of Immagene B.V. GVL is consultant advisor for Aduro, Amgen, Bristol-Myers Squibb, Highlight Therapeutics S.L., Mass-Array, Merck, MSD, Novartis, OncoSec Medical, Pierre Fabre, Roche, QBiotics, Skyline DX and Sandoz. TS has served as a consultant advisor for Adaptive Biotechnologies, AIMM Therapeutics, Allogene Therapeutics, Amgen, Merus, Neon Therapeutics, and Scenic Biotech; is recipient of grant and research support from MSD, BMS, and Merck KGaA; is a stockholder in AIMM Therapeutics, Allogene Therapeutics, Merus, Neogene Therapeutics, and Neon Therapeutics; and is a venture partner at Third Rock Ventures. CB reports personal fees as a consultant advisor for BMS, MSD, Novartis, Lilly, Pfizer, GSK, GenMab, Pierre Fabre and Third Rock Venture for which the institute (Netherlands Cancer Institute) received payments, has received research grants from BMS, Novartis, and NanoString Technologies all paid to the institute (Netherlands Cancer Institute), and is cofounder of Immagene B.V.
Patient consent for publication Not required.
Ethics approval All retrospective medical data/biospecimen studies at the Netherlands Cancer Institute have been executed pursuant to Dutch legislation and international standards (reference N03LAM, N11RFA). Prior to May 25, 2018, national legislation on data protection applied, as well as the International Guideline on Good Clinical Practice. From May 25, 2019 we also adhere to the GDPR. Within this framework, patients are informed and have always had the opportunity to object or actively consent to the (continued) use of their personal data and biospecimens in research. Hence, the procedure comply both with (inter-)national legislative and ethical standards. All Melanoma Institute Australia patient samples included in this study have approval from Sydney Local Health District (RPA zone) Human Research Ethics Committee (reference X17-0312 and HREC/11/RPAH/32). Patients have provided their written informed consent and a small number of FFPE samples have been included via a waiver of consent.
Provenance and peer review Not commissioned; externally peer reviewed.
Data availability statement Data are available upon reasonable request. The RNA and DNA sequencing datasets generated for this study is deposited into the European Genome-phenome Archive under accession number EGAD00001006577 and are available on request. Every request will be reviewed by the institutional reviewboard of the NKI; the researcher will need to sign a data access agreement withthe NKI after approval.
Supplemental material This content has been supplied by the author(s). It has not been vetted by BMJ Publishing Group Limited (BMJ) and may not have been peer-reviewed. Any opinions or recommendations discussed are solely those of the author(s) and are not endorsed by BMJ. BMJ disclaims all liability and responsibility arising from any reliance placed on the content. Where the content includes any translated material, BMJ does not warrant the accuracy and reliability of the translations (including but not limited to local regulations, clinical guidelines, terminology, drug names and drug dosages), and is not responsible for any error and/or omissions arising from translation and adaptation or otherwise.