Article Text

Abstract
Background Previous studies of prostate cancer autoantibodies have largely focused on diagnostic applications. So far, there have been no reports attempting to more comprehensively profile the landscape of prostate cancer-associated antibodies. Specifically, it is unknown whether the quantity of antibodies or the types of proteins recognized change with disease progression.
Methods A peptide microarray spanning the amino acid sequences of the gene products of 1611 prostate cancer-associated genes was synthesized. Serum samples from healthy male volunteers (n=15) and patients with prostate cancer (n=85) were used to probe the array. These samples included patients with various clinical stages of disease: newly diagnosed localized prostate cancer (n=15), castration-sensitive non-metastatic prostate cancer (nmCSPC, n=40), castration-resistant non-metastatic prostate cancer (n=15) and castration-resistant metastatic disease (n=15). The patients with nmCSPC received treatment with either standard androgen deprivation therapy (ADT) or an antitumor DNA vaccine encoding prostatic acid phosphatase. Serial sera samples from these individuals were also used to probe the array, to secondarily determine whether this approach could be used to detect treatment-related changes.
Results We demonstrated that this peptide array yielded highly reproducible measurements of serum IgG levels. We found that the overall number of antibody responses did not increase with disease burden. However, the composition of recognized proteins shifted with clinical stage of disease. Our analysis revealed that the largest difference was between patients with castration-sensitive and castration-resistant disease. Patients with castration-resistant disease recognized more proteins associated with nucleic acid binding and gene regulation compared with men in other groups. Our longitudinal data showed that treatments can elicit antibodies detectable by this array, and notably vaccine-treated patients developed increased responses to more proteins over the course of treatment than did ADT-treated patients.
Conclusions This study represents the largest survey of prostate cancer-associated antibodies to date. We have been able to characterize the classes of proteins recognized by patients and determine how they change with disease burden. Our findings further demonstrate the potential of this platform for measuring antigen spread and studying responses to immunomodulatory therapies.
- antibodies
- neoplasm
- antigens
- neoplasm
- prostatic neoplasms
- vaccination
This is an open access article distributed in accordance with the Creative Commons Attribution Non Commercial (CC BY-NC 4.0) license, which permits others to distribute, remix, adapt, build upon this work non-commercially, and license their derivative works on different terms, provided the original work is properly cited, appropriate credit is given, any changes made indicated, and the use is non-commercial. See http://creativecommons.org/licenses/by-nc/4.0/.
Statistics from Altmetric.com
Background
It has been previously reported that patients with cancer develop antibodies to autologous proteins.1 2 This phenomenon has been described across a wide variety of cancer types, including colon, melanoma, bladder, lung and prostate.3–7 These antibodies may arise due to overexpression of self-antigens, inflammation or tumor cell lysis.8 Studies of serum antibodies may be particularly attractive for a variety of diagnostic applications because serum samples are relatively easy to obtain, antibodies can be present at early stages of disease and antibodies can be present at high levels even when their target antigen is expressed at low levels. In contrast, monitoring serum proteins in patients with cancer has been more challenging because they are often much less abundant and have more variable expression over time.9 10 Antibody presence can also provide information about the relative immunogenicity of a given antigen. Many groups have used naturally existing antibody responses in patients with cancer to identify targets for antibody therapies or vaccination strategies.11–13 Similarly, profiling antibody responses has been used to detect antigen spread following immunotherapy.14 Thus, further study of these antibodies may have important implications for cancer diagnostics, biomarkers of response to therapy and in guiding the design and targets of future therapies.
In the case of prostate cancer, several groups have developed methods to evaluate serum antibodies.7 15 16 Chinnaiyan et al used phage display to screen patient serum for responses against many candidate prostate cancer-associated peptides. They identified 22 proteins against which antibody responses could distinguish patients with prostate cancer and healthy individuals more reliably than detection of serum prostate-specific antigen (PSA) protein. Taylor et al and Ummanni et al took similar approaches, probing prostate tumor lysates with patient serum and then performing mass spectrometry to identify the proteins that reacted more with serum of cancer patient than control serum. Our group has also interrogated patient serum samples to discover prostate tumor-associated antibodies using ELISA for known prostate cancer tumor antigens and the serological identification of antigens by recombinant expression (SEREX) methodology to identify antibody targets from tissue expression libraries.17–19 These previous studies of antibodies in patients with prostate cancer focused primarily on diagnostic applications or on changes in antibody responses. This approach has resulted in the discovery of small panels of shared antigens that may be useful for monitoring development of disease or response to treatment. However, to date, no studies have performed a more complete profile of the repertoires of prostate cancer-associated antibodies in individuals. In addition, data on whether the quantity or composition of antibody responses differ between patients with different disease severity are lacking.
Early studies were able to characterize antibodies against small numbers of antigens, but advancements such as phage display and now microarray-based platforms have made it possible to develop more thorough profiles of antibodies in patients with cancer. We sought to develop a microarray capable of detecting serum IgG responses against peptides using gene products from genes highly expressed in prostate cancer and predicted products of open reading frames (ORFs) from prostate cancer-associated long non-coding RNAs (lncRNAs). Our goal was to evaluate the number and character of proteins recognized by individuals with different clinical stages of disease, and secondarily whether a peptide microarray could be used to detect changes in antibody profiles following cancer treatment.
Here, we describe the use of the largest reported prostate cancer-specific peptide microarray. We demonstrate that the composition of antibodies does change with stage, with the largest differences evident between patients with castration-resistant disease and castration-sensitive disease, but the overall number of proteins recognized by these antibodies does not change with stage. We provide a detailed examination of the types of proteins that are recognized in patients with different clinical stages of prostate cancer and that have received treatment. We detect many more proteins with increased antibody recognition following vaccination than following androgen deprivation therapy (ADT), suggesting that the microarray platform could be used to measure prostate cancer-associated antigen spread as a future direction.
Methods
Patient populations
Sera were previously collected from male volunteer blood donors without cancer (n=15, controls), or patients with prostate cancer (n=85). Sera from patients were grouped according to stage of disease: newly diagnosed localized prostate cancer (new Dx, n=15), castration-sensitive non-metastatic prostate cancer (nmCSPC, n=40), castration-resistant non-metastatic prostate cancer (nmCRPC, n=15) and castration-resistant metastatic disease (mCRPC, n=15). Sera were also collected serially from the individuals with nmCSPC, who were enrolled on clinical trials in which 20 patients were treated with standard ADT (gonadotropin-releasing hormone analog given every 3 months)20 and the other 20 were treated with an investigational antitumor DNA vaccine encoding prostatic acid phosphatase (PAP; pTVG-HP, with granulocyte-macrophage colony-stimulating factor co-delivered as a vaccine adjuvant, given every 14 days for 6 administrations).21 Sera were collected at baseline, and at 3 months and 6 months following initiation of treatment for these patients. All samples were stored between −20°C and −80°C until use for analysis.
Antigen selection
Gene products from 1463 of the most highly expressed transcripts in prostate cancer22 23 and 148 predicted ORFs in prostate cancer were selected for inclusion on the array (online supplemental table 1). Gene products included 125 antigens previously identified as recognized by IgG from patients with prostate cancer.24 The potential ORFs were selected from a list by Iyer et al of long RNAs with in silico evidence of coding potential.25 There were 74 transcripts designated as having a ‘Cancer Association’, ‘prostate’ tissue association and category of ‘tucp’ (transcript of unknown coding potential).26 ORFs were then predicted using EMBOSS: getorf, with the top two longest ORFs for each long RNA included on the microarray.
Supplemental material
Peptide array synthesis and antibody screening
Peptide synthesis was performed as previously described, using a light-directed array synthesis in a Roche Nimblegen (Madison, Wisconsin, USA) maskless array synthesizer.27 Cycles of amino acid coupling were repeated until 16-mer peptides were synthesized on arrays containing 12 replicates of 177,604 peptides per subarray. Sera were diluted 1:100 with binding buffer (0.1 M Tris, 1% alkali-soluble casein, 0.05% Tween-20), incubated overnight at 4°C and washed. IgG was detected using an Alexa Fluor 647-labeled antihuman IgG secondary antibody (Jackson ImmunoResearch Labs, West Grove, Pennsylvania, USA). After final washing, arrays were dried and read using a Roche MS 200 microarray scanner, and signals were extracted using Roche internally developed software. Fluorescent signals were converted into arbitrary units (AU) with intensity plots ranging from 0 to 65 000 AU. Spatial correction, background correction and quantile normalization were performed on raw array signal intensities by Roche as previously described.28 All samples were evaluated in triplicate on separate arrays. Samples were considered positive for an antibody response at a given probe if the signal crossed 212 fluorescence units, with a sliding scale p value <0.05 in at least two of three technical replicates.28 A binding buffer only control was also run to confirm the absence of signal above the 212 threshold.
Data analysis
Data analyses were performed in R V.3.6.229 and RStudio30 using many available extension packages and visualization tools as well as custom scripts. To support reproducibility, workflow details are supplied in an R markdown document and the rendered online supplemental statistical. These materials are also available at: https://github.com/wiscstatman/immunostat-prostate
Supplemental material
Array reproducibility
Pearson’s correlation coefficients were calculated for each pair of observations of fluorescence data, creating a 345×345 matrix. The Fisher transformation was then applied before averaging coefficients together to assess reproducibility of the array. In a complementary analysis (online supplemental statistical section 2.3), a peptide-specific linear mixed-effects model was fit to measure the relative size of technical variation to biological variation in this system. This used the R package lme431 on log-transformed fluorescence intensity levels to compute variance components while adjusting for possible fixed effects of disease stage.
Differences between clinical groups
Analysis of variance (ANOVA) with the Tukey’s Honest Significant Differences post-test was used to compare the overall numbers of proteins and peptides recognized among patients with different clinical stages. Peptide-specific logistic regression testing for cancer-stage effects while controlling the false discovery rate (FDR) using the Benjamini-Hochberg (BH) method was also performed (online supplemental statistical section 2.4).
We reasoned that detectable antibody signatures between clinical groups may be present below the threshold of the stringent definition of a positive peptide. To test for such signals in the fluorescence intensity data, peptide-specific ANOVA according to the rank-based Kruskal-Wallis (KW) procedure was applied, followed by filtering peptides with significant clinical-group effects at 5% FDR by the BH method. Subject data were preprocessed to collapse triplicate profiles per person to a single, consensus profile per person by using median per peptide (online supplemental statistical section 2.5). The rank-based KW procedure is robust to distributional anomalies and is expected to provide a conservative assessment of antibody-profile differences between the clinical groups.32 Peptides exhibiting sufficiently small BH-adjusted KW p value were examined for differences in various pairwise comparisons, which invoked both a median fold-change filter (at least twofold difference) as well as a significance filter by two-sample Wilcoxon rank-sum p value, again with BH adjustment at 5% FDR (online supplemental statistical section 2.6).
Temporal changes
A linear mixed-effects model was fit to each peptide, separately for the groups of vaccinated patients and ADT-administered patients, to determine if there was an increase in signal over time, again using lme4; this allows a linear increase or decrease in mean log-transformed intensity over time per subject and per peptide. Patient-specific random effects allow for among subject variation in the temporal response, while a fixed time effect per peptide expresses the average response over subjects in that clinical group. Statistical significance was assessed using both the Kenward Roger and Satterthwaite approximate F tests33 using the R package lmerTest34 as well as BH for FDR control (online supplemental statistical section 3). Peptides with a coefficient of at least 0.3333 and a BH-adjusted p value <0.05 were considered to have increased antibody response over time.
Gene ontology analysis
Gene ontology (GO) analysis was performed using allez.35 The set of all proteins on the microarray was used as the background list and the subset of proteins of interest was used as the target list, with a Bonferroni-corrected p value threshold of 0.05 in allez. The output was visualized using waterfall plots in allez. These reveal dominant functional categories enriched in the protein list while accounting for set redundancies.36 37
UniProt analysis
Proteins from the array were matched with UniProt IDs using UniGene IDs when available and protein names otherwise. Data were then retrieved from UniProt38 on gene names, protein length and subcellular location. UniProt may designate a protein with multiple subcellular localizations, in which case all localizations were kept in the analysis. This sometimes leads to percentages that add up to over 100%.
Results
A prostate cancer-specific peptide microarray was able to reproducibly measure antibody signatures from serum of healthy individuals and patients with prostate cancer
To characterize antibody responses to a wide variety of prostate cancer-associated proteins in patients with prostate cancer, we designed a peptide microarray able to be screened with patient sera. This array included peptides spanning the amino acid sequences of 1463 of the most abundantly expressed gene products in metastatic prostate cancer,22 23 including 125 proteins identified in previous studies examining serum antibody responses in patients with prostate cancer.24 39 We also included peptides spanning the predicted amino acid sequences of 148 potential open reading frames (ORFs) from lncRNAs that have been shown to be highly expressed in prostate cancer. We included these given their strong association with prostate cancer. While most would likely serve as negative controls as they would not be expected to encode gene products, other groups have shown that some lncRNAs may be translated into unstable peptides or even functional proteins, especially with the dysregulation induced by cancer.40–42 Hence, we reasoned that a few might serve as antibody targets in patients with prostate cancer.
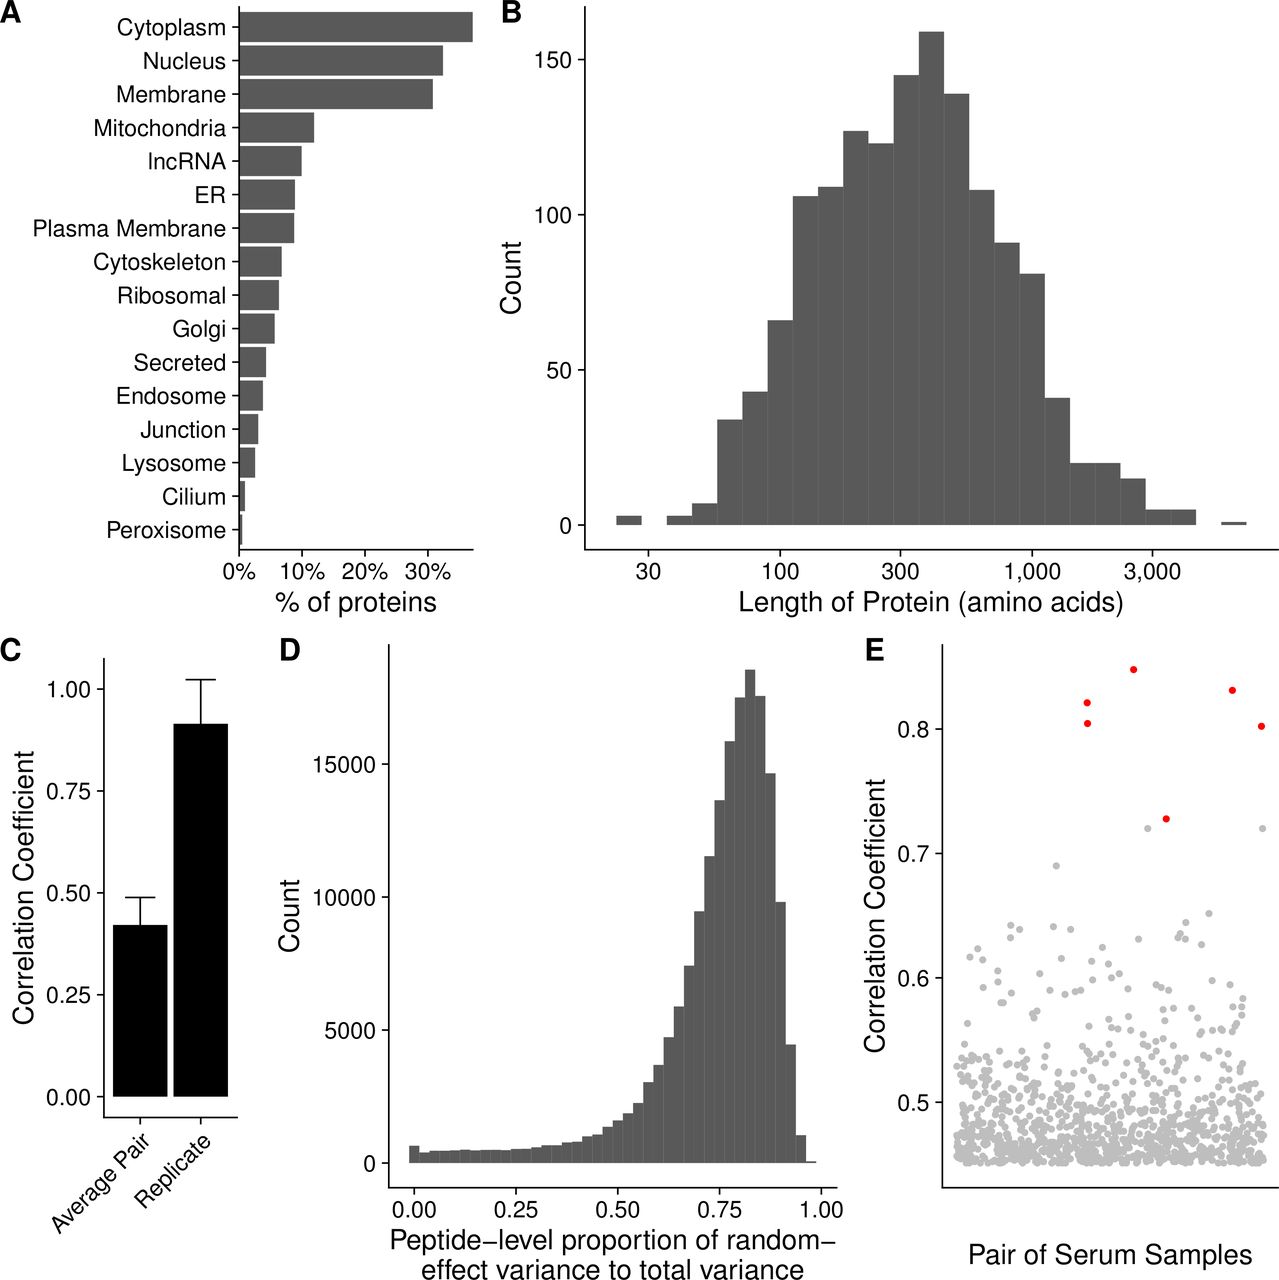
The 16-mer peptides spanning the amino acid sequences of these 1611 gene products, and overlapping by 12 amino acids, were used to generate a microarray comprising 177 604 peptides. The complete list of probes and corresponding proteins is available in online supplemental table 1. The manufacture of the array and synthesis of peptides was performed as previously described.43 The characteristics of the proteins included in the array are summarized in figure 1, using data retrieved from UniProt.38 Sixty-nine per cent of proteins included were those typically localized within the cytoplasm or nucleus, or that traffic between the two compartments (figure 1A). Approximately 6% of the proteins were localized to the ribosomes. The median protein length was 483 amino acids (figure 1B).

A prostate cancer-specific peptide microarray was able to reproducibly measure antibody signatures from serum of healthy individuals and patients with prostate cancer. Summary of the (A) subcellular localization and (B) length in amino acids of all 1611 unique proteins on the array according to UniProt. (C) The mean correlation coefficient among all pairs of different individuals (average pair) compared with the average correlation coefficient among all technical replicates (replicate). Error bars represent SD. (D) Histogram depicting the ratio of the biological variation to the total variation of the array data for each peptide as estimated by a linear mixed-effects model. (E) Each point represents the correlation coefficient between antibody responses in two different serum samples. Points marked in red are instances when the same individual had serum collected at two different time points with different stages of disease. ER, endoplasmic reticulum; lncRNA, long non-coding RNAs.
We next assayed serum samples collected from controls and patients with different stages of prostate cancer for peptide-specific IgG responses using the microarray. Examples of the primary data are shown in online supplemental figure 1A,B. To assess the reproducibility of the assay, we calculated Pearson’s correlation coefficents between each pair of technical replicates and found high correlation on average among replicates (figure 1C). To determine the degree of variability among serum samples, we calculated the mean correlation coefficient across all pairs of distinct serum samples. We observed low correlation between the average pair of serum samples (figure 1C). In a complementary approach, we fit a linear mixed-effects model to estimate the amount of biological variation and technical variation across our triplicate data for each peptide. We found that the average ratio of biological variation to total variation was 0.74, indicating low technical variation (figure 1D).
Supplemental material
Included in this study were six patients who had serum collected at two different time points, when they had an early stage of disease and again when they had a later stage of disease. Notably, these serum samples from the same patients had especially high correlation coefficients (figure 1E). This suggests that while there is high variation among individuals, each particular individual had smaller variation in his antibody repertoire over time. These six patients had their first serum collection removed from further analysis to prevent inflating their impact on our results.
Frequency of protein recognition did not correlate with stage of disease
To determine whether the array could detect IgG to common prostate antigens, we first defined a ‘positive’ antibody response to individual peptides using previously described criteria.28 Using binding buffer as a negative control, no peptides met these criteria (not shown). Two examples of positive responses are shown in figure 2A. We specifically evaluated responses to peptides derived from well-defined prostate target antigens PSA, PAP and the androgen receptor (AR). Overall, 7.1% of patients with prostate cancer (13.3% of patients with mCRPC) assayed on the array displayed antibody responses against peptides derived from PSA, while 6.7% of controls had PSA responses; 8.2% of patients with prostate cancer (13.3% of patients with mCRPC) and 0% of controls had responses to PAP. Finally, 5.9% of patients with prostate cancer (13.3% of patients with mCRPC) and 20.0% of controls recognized peptides derived from the ligand-binding domain of AR. Given the small sample sizes, none of the antibody responses to these proteins was significantly different in frequency in patients with cancer compared with controls.
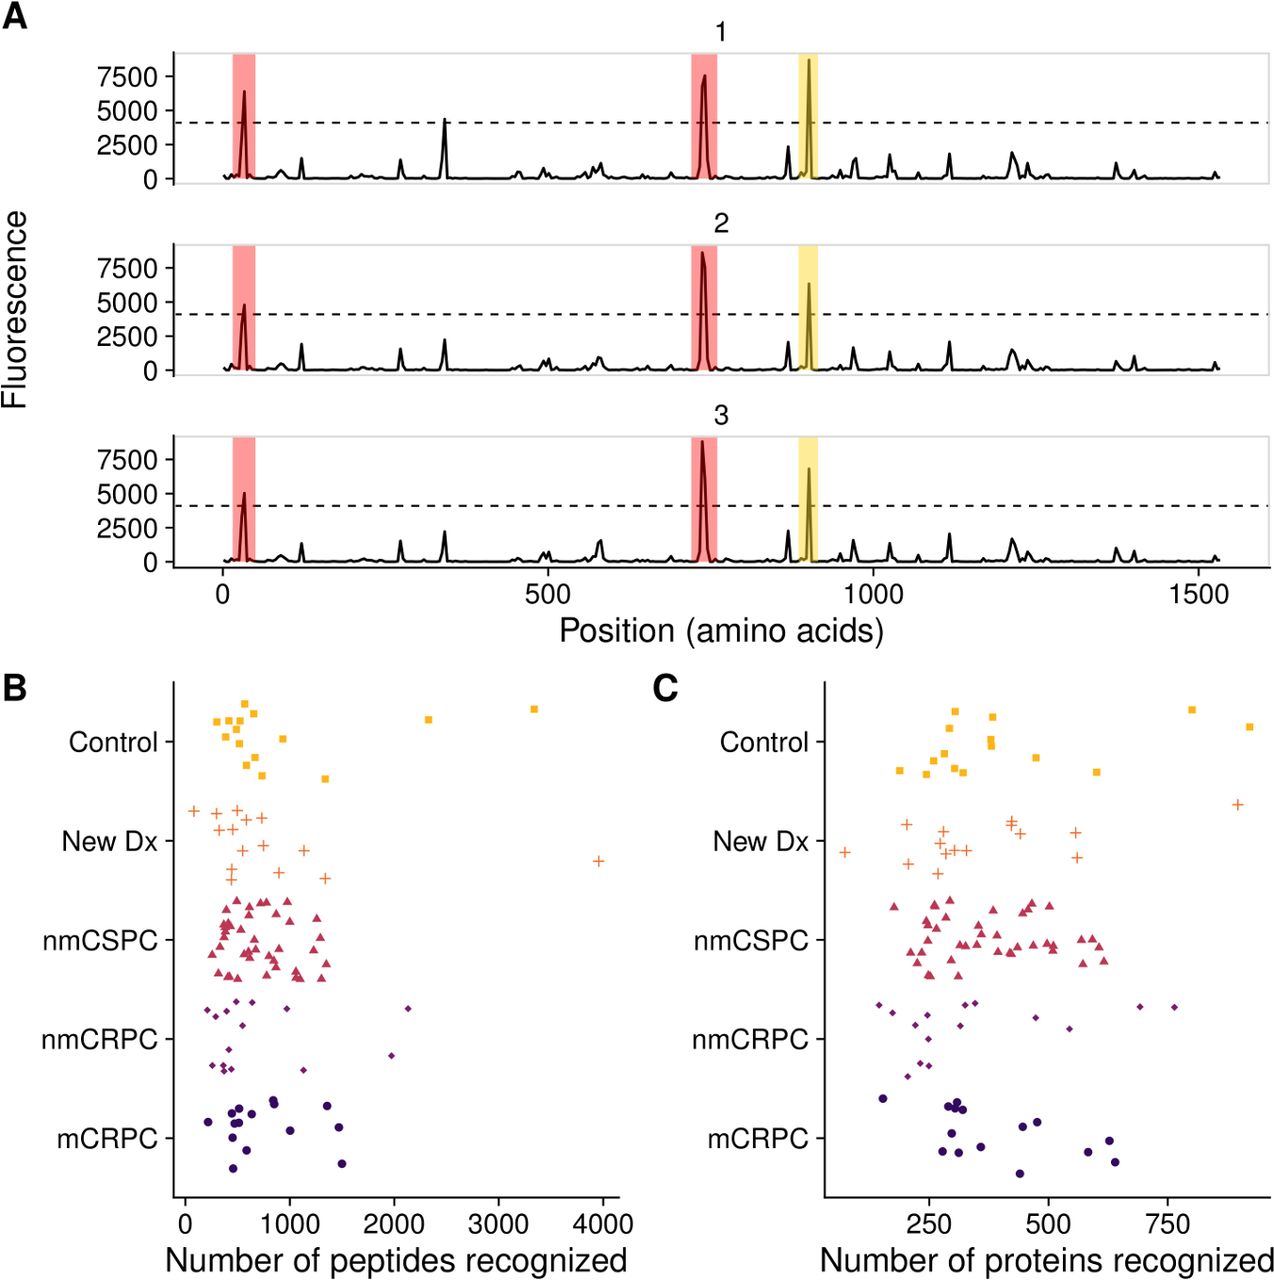
Frequency of protein recognition did not correlate with stage of disease. (A) Example microarray data for technical replicates of a single protein (ADT14) with the 212 signal threshold indicated by the dashed line. Positive calls are marked in red. In yellow is a negative call that did not meet the sliding window criterion. The number of (B) peptides and (C) proteins recognized by each patient, categorized by clinical stage of disease. mCRPC, castration-resistant metastatic disease; nmCRPC, castration-resistant non-metastatic prostate cancer; nmCSPC, castration-sensitive non-metastatic prostate cancer.
We next tested the hypothesis that patients with higher disease burden would recognize more peptides, potentially due to increased presentation of cancer-associated proteins.44 We found no correlation between stage of disease and the number of probes recognized at either the peptide level or the protein level. The median numbers of proteins recognized were 321 for controls, 303 for new Dx, 353 for nmCSPC, 249 for nmCRPC and 320 for mCRPC (figure 2B,C). The median numbers of peptides were 919 for controls, 832 for new Dx, 712 for nmCSPC, 708 for nmCRPC and 754 for mCRPC. We noted a substantial amount of heterogeneity in antibody responses among patients. For instance, the number of proteins recognized by controls ranged from 188 to 922. Similarly, we did not observe an association between subject age and number of proteins recognized (data not shown).
Nearly all proteins on the array were recognized by serum antibodies of patients with prostate cancer
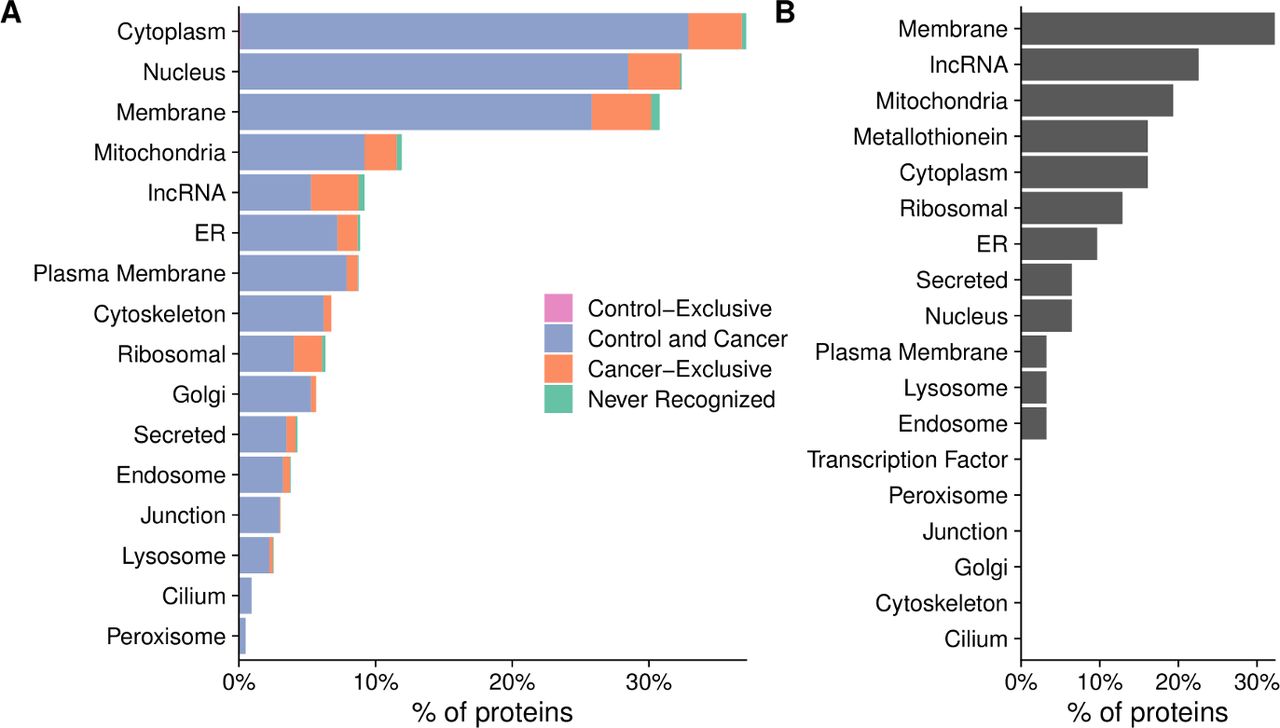
Having established that there was a large diversity in antibody repertoires among patients, we next examined whether there were any broad trends in the types of proteins that were recognized. While only 0.4% of calls were positive overall, 20% of peptides were recognized by at least one subject. Nearly all proteins (1570 of 1611, 97%) had one or more peptides recognized by at least one subject. Conversely, there were no proteins that were recognized by all patients. Most proteins (1326 of 1611, 82%) were recognized by both controls and patients with cancer (figure 3A). As expected, one of the largest categories of proteins that were not recognized were ORFs from lncRNAs (figure 3B, online supplemental table 2); however, contrary to our expectations, the majority of lncRNAs (141 of 148, 95%) were recognized by at least one patient (figure 3A).

Nearly all proteins on the array were recognized by serum antibodies of patients with prostate cancer. Percentage of proteins that were recognized by only controls (control-exclusive), percentage of proteins recognized by at least one control and one cancer patient (control and cancer), percentage of proteins not recognized by any controls but recognized by at least one cancer patient (cancer-exclusive) and percentage not recognized at all (never recognized), categorized by subcellular localization. (B) Characteristics of the proteins that were not recognized by any controls or patients tested. The x-axis represents the percentage of the 41 proteins that were not recognized that fall into each category.
The composition of antibody targets changes with clinical stage of disease
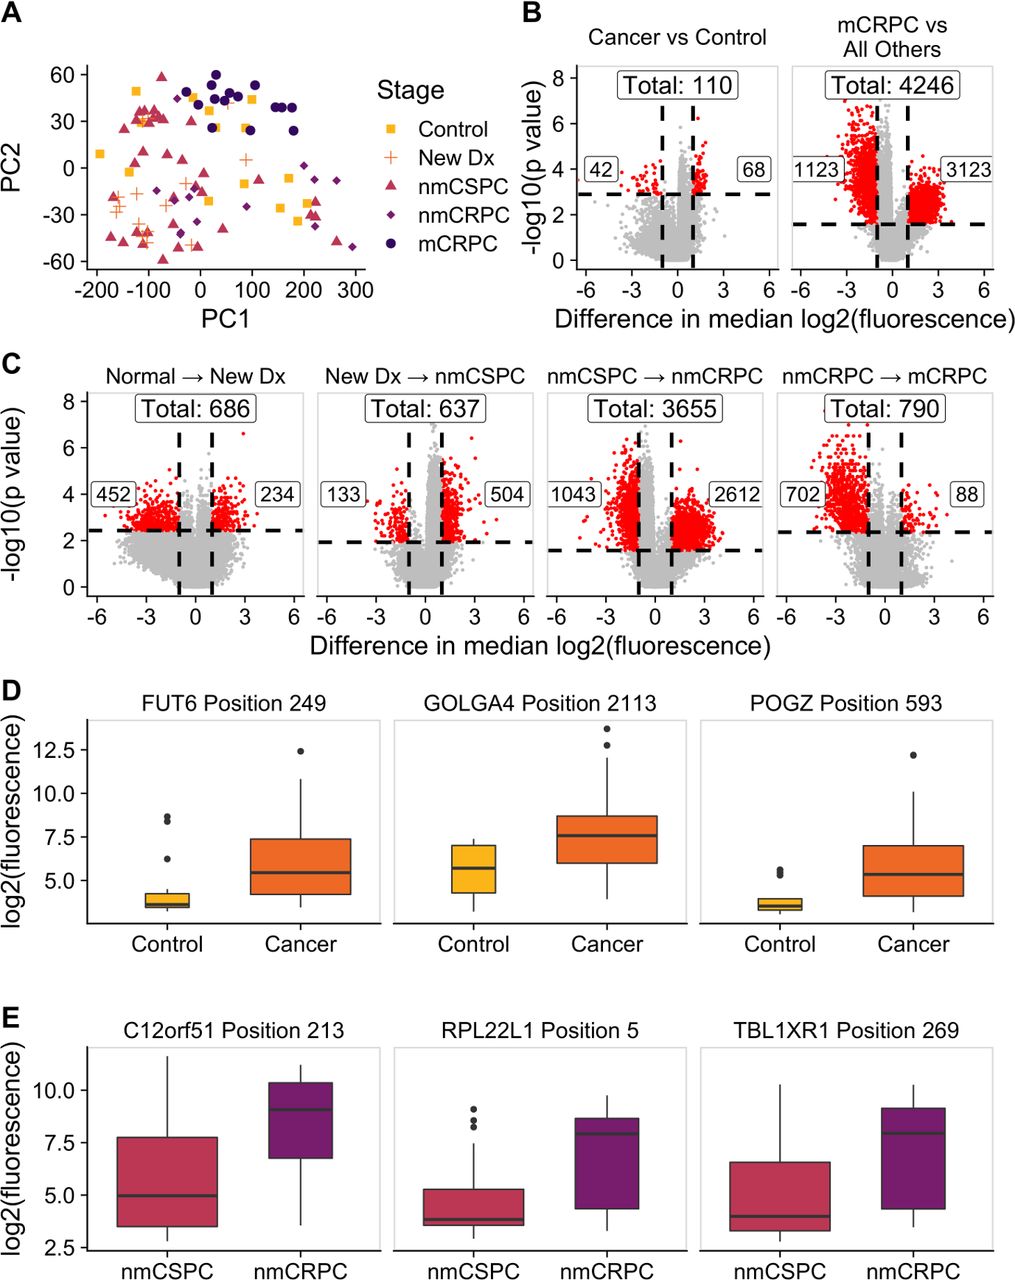
We hypothesized that while the overall number of proteins recognized may not increase with burden of disease, the composition of proteins recognized may be different. We employed a KW test to identify peptides that had significantly different fluorescence intensities across clinical stages and controls. This test identified 13 279 significant peptides (online supplemental table 3). We used principal component analysis (PCA) to visualize the residual fluorescence levels after subtracting the grand mean fluorescence level for each peptide and observed that patients tended to group with other patients with the same clinical stage of disease (figure 4A). Patients with castration-resistant tumors, and mCRPC in particular, tended to cluster especially closely to one another. Notably, controls did not exhibit this clustering. We were particularly interested in the subset of peptides that had significantly different fluorescence signals in patients with cancer compared with controls. We identified these peptides by using a Wilcoxon rank-sum test and specifically focused on those that had differences in median fluorescence of at least twofold in patients with cancer compared with controls (figure 4B, left; online supplemental table 4). To discover which peptides were driving the especially strong clustering of patients with mCRPC, we repeated this procedure to find peptides with significantly different fluorescence in patients with mCRPC compared with all other patients (figure 5B, right; online supplemental table 5). Unexpectedly, we detected only 110 peptides associated with the cancer versus control comparison, but found 4246 peptides in the mCRPC versus all other comparisons.

The composition of antibody targets changes with clinical stage of disease. (A) Principal component analysis plot obtained by using the set of 13 279 significantly changed peptides identified by the Kruskal-Wallis test then subtracting the grand mean of log2 fluorescence levels across patients for each peptide. Each point represents a patient, colored by clinical stage. (B) Volcano plots depicting peptides that met the 5% Benjamini-Hochberg (BH) false discovery rate (FDR) cut-off based on the Wilcoxon p values (horizontal lines) and had at least a twofold difference in median log2 fluorescence values between the stages being compared (vertical lines). The number of significantly increased peptides is shown on the right of each plot, the number of significantly decreased peptides is shown on the left, and the overall number of significantly changed peptides is shown at the top. Significant peptides are colored red. The left plot indicates peptides that had significantly different signals in patients with cancer compared with controls. The right plot indicates peptides that had significantly different signals in patients with mCRPC compared with all other groups. (C) Volcano plots indicating peptides that had significantly different signals between patients with consecutive clinical stages of disease. Box plots displaying fluorescence signals in (D) all patients with cancer compared with controls and (E) patients with nmCRPC compared with patients with nmCSPC in three example peptides that met both the twofold signal change and BH-adjusted p-value criteria. Box width is proportional to sample size. mCRPC, castration-resistant metastatic disease; nmCRPC, castration-resistant non-metastatic prostate cancer; nmCSPC, castration-sensitive non-metastatic prostate cancer.

Specific proteins were preferentially recognized in patients with cancer and patients with mCRPC. (A) Heatmap depicting the difference in log2 fluorescence levels between each peptide in each patient and its grand mean across patients, displaying only the set of 6708 peptides that met the secondary selection criteria. Patients are grouped by stage across the x-axis, while peptides are clustered along the y-axis. (B) Waterfall plot depicting a gene ontology (GO) analysis of proteins that had significantly more antibody recognition in patients with cancer than controls. The top row indicates the GO term that encompasses the most genes corresponding to significant peptides. For the second row, these genes are then removed from the list and the GO term that encompasses the most genes in the remainder of the list is chosen. Genes identified by this process are counted along the x-axis to visualize overlapping GO terms. Waterfall plots depicting GO analysis of proteins that had significantly increased antibody responses in (C) patients with mCRPC compared with all other patients or (D) patients with nmCRPC compared with patients with nmCSPC. mCRPC, castration-resistant metastatic disease; nmCRPC, castration-resistant non-metastatic prostate cancer; nmCSPC, castration-sensitive non-metastatic prostate cancer.
We applied this same approach to identify the number of peptides that had significantly higher or lower signals in patients in one clinical stage of disease compared with patients in the previous clinical stage. The largest change in number of recognized peptides occurred between the castration-sensitive (nmCSPC) and castration-resistant (nmCRPC) populations (figure 4C; online supplemental tables 6–9). Examples of the fluorescence signals of peptides that are detected by this strategy are shown in figure 4D,E.
Specific proteins were preferentially recognized in patients with cancer and patients with mCRPC
From our initial list of 13,279 peptides, we identified 6708 of these peptides that were significant in one of the six comparisons made in figure 4B,C. We visualized the residual fluorescence levels of these peptides after removing the grand mean for each peptide in figure 5A. As in figure 4A, we observed high similarity in antibody profiles between patients with the same stage of disease. We next more closely examined the sets of proteins we had identified earlier for common features and associations with cellular processes. GO analysis revealed that the genes corresponding to the 68 peptides that were recognized more robustly in patients with cancer compared with controls were associated with mRNA export from the nucleus and the cell-cell contact zone (figure 5B). GO analysis of the 3123 peptides that had particularly strong antibody responses in patients with mCRPC showed an enrichment for proteins associated with nucleic acid binding, RNA metabolism, gene regulation and downregulation of metabolism (figure 5C). One of the significant terms within the ‘non-membrane-bounded organelle’ term was the cytosolic large ribosomal subunit. To investigate the large difference in antibody repertoires between patients with nmCSPC and nmCRPC, we performed GO analysis on the 2612 peptides with significantly higher signal in nmCRPC than nmCSPC. We identified differences in recognition of proteins associated with nucleic acid binding, chromatin structure, amide metabolism and protein localization to the membrane (figure 5D).
Antitumor vaccination elicited increased antibody responses over time, unlike androgen deprivation therapy
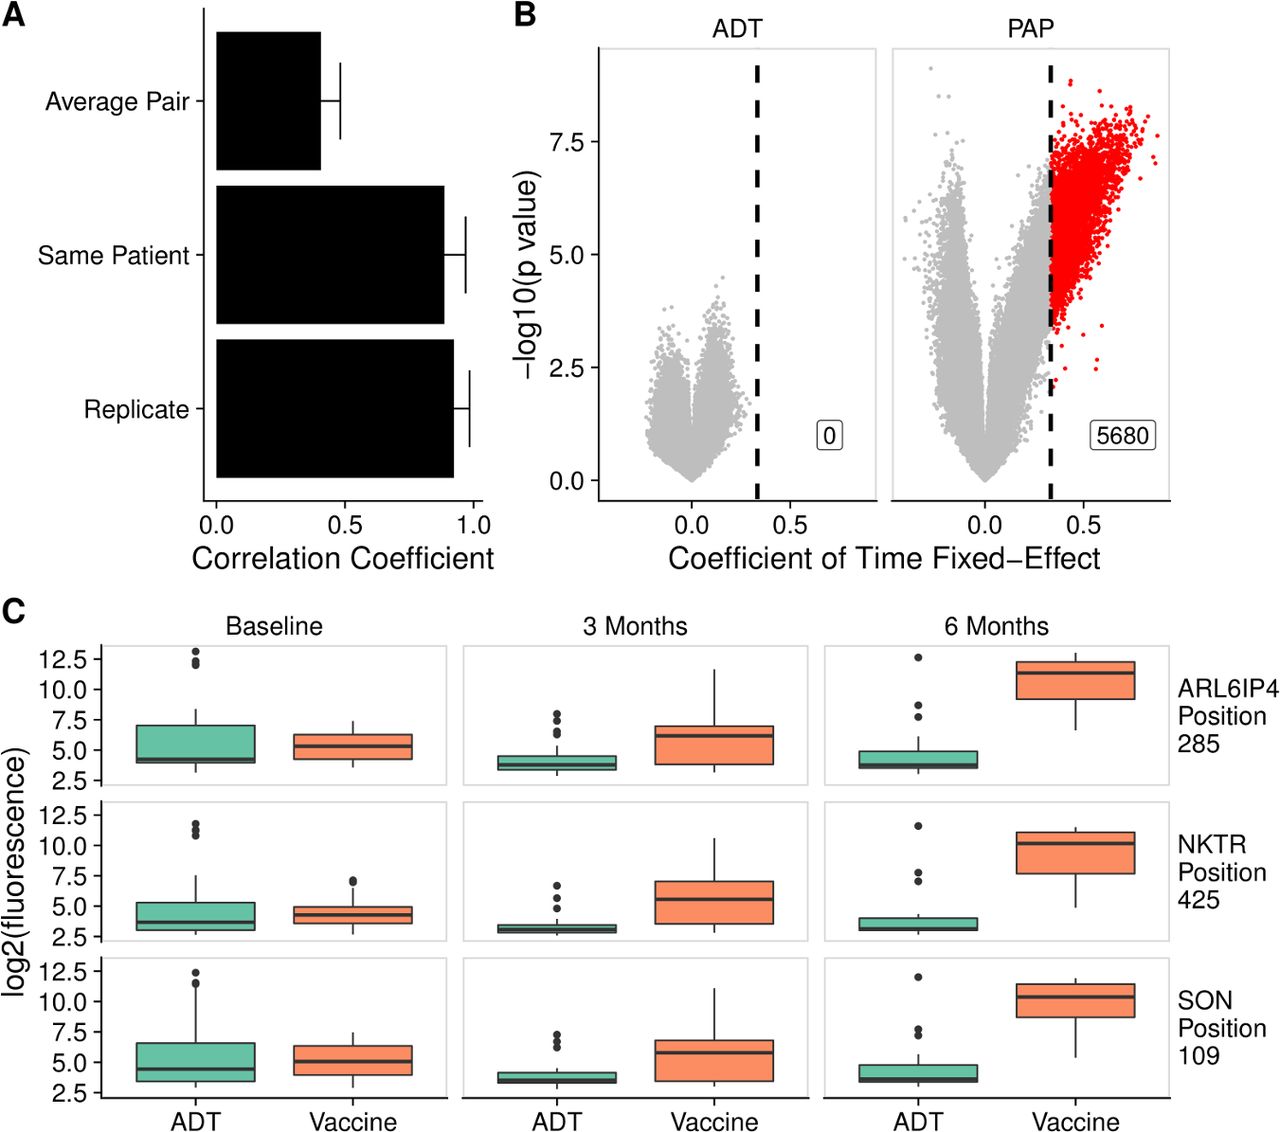
Based on our finding that individual patients tended to have relatively small variation in their antibody responses over time, we hypothesized that this could make the microarray particularly sensitive for detecting changes induced by treatment in a longitudinal analysis. To test the potential of this platform for studying treatment effects, we used the serial serum samples available from the 40 patients with nmCSPC who were treated with either ADT or an investigational DNA vaccine. Consistent with our observations in figure 1E, we found high correlation between samples from an individual patient over time (figure 6A).

Antitumor vaccination elicited increased antibody responses over time, unlike androgen deprivation therapy (ADT). (A) The mean correlation coefficient among all pairs of different individuals (average pair) compared with the average correlation coefficient among all technical replicates (replicate) and the average correlation among samples collected from the same patient at different time points (same patient). Error bars represent SD. (B) Volcano plots depicting peptides to which there was increased signal following treatment with ADT or vaccine by at least twofold every 3 months, corresponding to a coefficient of time fixed-effect of 0.3333 (vertical line), and met the 5% Benjamini-Hochberg (BH) false discovery rate (FDR) cut-off using both Kenward Roger (KR) and Satterthwaite F-tests. Significant peptides are colored red. (C) Example box plots displaying log2 fluorescence levels for three peptides at baseline, 3 months and 6 months, in patients treated with ADT or vaccine. PAP, prostatic acid phosphatase.
We next fit a linear mixed-effects model to determine if there were any peptides against which there was increased signal over time. In the vaccine-treated patients, we found 5680 significant peptides that had a coefficient of time fixed-effect of at least 0.3333, indicating a twofold increase in signal every 3 months (online supplemental table 10). We were unable to detect any peptides against which ADT-treated patients developed increasing antibody signal over time using this procedure (figure 6B). Examples of the fluorescence levels of 3 peptides over time in ADT-treated and vaccine-treated patients are shown in figure 6C.
PAP-targeted DNA vaccination causes similar increases in antibodies against proteins associated with nucleic acid binding and gene regulation in multiple patients
We visualized the changes in peptide recognition over time in vaccine-treated patients by plotting the residuals of the null model in the heatmap in figure 7A. This further demonstrated that vaccine-treated patients had robust increases in antibody responses to these 5680 peptides. To characterize these peptides, we performed GO analysis. We found that a significantly enriched set of these antibodies were specific to nucleic acid binding proteins. There were also more antibodies against proteins associated with RNA metabolism, ion binding and ribosomal or nucleolar cellular components than would be expected by chance (figure 7B).

Prostatic acid phosphatase (PAP)-targeted DNA vaccination causes similar increases in antibodies against proteins associated with nucleic acid binding and gene regulation in multiple patients. (A) Heatmap of the fluorescence residuals from the null model for each of the 5680 peptides that were significantly increased in vaccine-treated patients. Samples from vaccine-treated patients at each collection time point (baseline, 3 months and 6 months) are grouped together along the x-axis, while peptides are clustered along the y-axis. The order of the columns (patients) is consistent across the three timepoints for ease of comparison. (B) Waterfall plot of gene ontology (GO) analysis of proteins recognized more following vaccine.
Discussion
The purpose of this study was to perform a comprehensive survey of tumor-associated serum antibody responses in patients with prostate cancer and to determine whether antibody profiles changed with disease progression. Previous examinations of serum antibodies in patients with prostate cancer focused mainly on diagnostic applications; thus, a more complete picture of patient antibody repertoires has been lacking. We addressed this by designing the largest reported prostate cancer-specific peptide microarray, capable of measuring IgG responses to over 177,000 peptides. Our major findings were (1) the microarray data were highly reproducible, (2) the overall number of peptides recognized was not greater in patients with more advanced disease, (3) the composition of patient antibody repertoires changed with later stages of disease, (4) most antibody signatures were largely stable within individuals over time and (5) this approach was able to track changes elicited by therapy in individuals.
Here, we have shown that this novel prostate cancer-specific peptide microarray yields highly reproducible measurements of serum IgG levels with high correlation of technical replicates and negligible background fluorescence signal. The microarray’s measurements also exhibited generally strong concordance with existing literature on serum antibodies in patients with prostate cancer. A previous study using ELISA detected anti-PSA antibodies in 11% of patients with mCRPC.44 Similarly, the microarray detected PSA responses in 13.3% of patients with mCRPC. Looking at PAP, ELISA detected antibody responses in 5.5% of patients, while the microarray detected antibody responses in 8.2% of patients with prostate cancer. On the other hand, ELISA detected antibodies specific for the AR ligand-binding domain in 17.1% of patients, whereas the microarray detected antibody responses in 5.9% of patients.45
Based on reports that individual proteins like PSA and PAP are more recognized in patients than controls, we hypothesized that patients with more advanced disease would have antibodies against more proteins. Previous studies have focused on the use of antibody profiling as a diagnostic tool to discover proteins that are recognized more in patients with prostate cancer than controls.7 15 16 Because these studies focused only on antibodies that are enriched in patients with prostate cancer, they were unable to address this question of whether the overall number of antibody responses changes with clinical stage of disease. Our microarray approach also allowed us to examine the classes of proteins recognized by patients in each clinical stage.
Contrary to our expectations, we did not observe an increase in the number of peptides recognized with more advanced disease. While the overall number of antibody responses did not appear to increase, we found that the composition of proteins recognized changed. Interestingly, we discovered that the vast majority of predicted lncRNA ORF gene products were recognized by at least one subject, with a large proportion recognized exclusively in patients with cancer. This could be the result of unstable peptides being translated from lncRNAs at higher rates due to the dysregulation induced by prostate cancer. Alternatively, it is possible that some of these genes with predicted ORFs represented poorly annotated protein coding genes rather than true lncRNAs. We found significant changes in antibody responses against one of the lncRNAs, PCAT-14 (PRCAT104), in the transition to castration-resistant disease and non-metastatic to metastatic disease, but not in earlier stage transitions. PCAT-14-specific antibodies also increased following vaccination. Interestingly, previous work has shown that PCAT-14 encodes a peptide and that loss of PCAT-14 is associated with metastatic progression and poor outcomes.46–48 Further study of serum antibodies targeting this lncRNA is warranted.
We also found that the sets of proteins associated with patients with mCRPC and the transition from nmCSPC to nmCRPC were significantly enriched for ribosomal proteins and other non-membrane bound organelles. It is possible that the upregulation of the translational machinery required to support rapid cell division in cancer leads to a greater abundance in ribosomal proteins. This lends further credence to observations made by Wang et al that two of the five coding proteins they identified in their screen for prostate cancer-specific antibodies were ribosomal and the majority of the other proteins they identified came from untranslated regions.7 In fact, we identified many of the same proteins when looking at mCRPC-associated proteins, such as BRD2, RPL13a, RPL22 and LAMR1. We also identified proteins detected by Taylor et al, and Ummanni et al, such as ACPP, VCP and PRDX6.15 16 The increases in antibodies against proteins involved in gene regulation and RNA metabolism in patients with nmCRPC and mCRPC may be due to the large changes in transcription associated with the development of castration resistance.49
Despite the power of this approach, we were limited to observing antibody responses to 1611 proteins that are all highly expressed in prostate cancer and it is possible that there are humoral responses to other targets that may be expressed at lower levels that we did not capture. Our analysis was also limited by our relatively small sera sample size, with only 15 patients for most disease stages, including mCRPC. However, the fact that we were able to detect such large differences between disease stages with this sample size demonstrates the sensitivity of this approach. This sample size was sufficient to detect large changes in the antibody signatures in patients with castration-sensitive versus castration-resistant disease. These small sample sizes, however, limited any clinical interpretation or association of antibody signatures with long-term outcome, and these will be focuses of future study. We took a cross-sectional approach to identifying antibody profiles associated with each stage of disease rather than following individual patients across the lengthy natural history of prostate cancer, which also prevented us from observing changes in individual patients with different stages of disease. However, we were able to obtain longitudinal data from a subset of patients for a period of 6 months.
Our longitudinal analysis with sample collections at baseline, 3 months and 6 months revealed that it is possible to identify individual subjects at multiple time points based on their antibody signature. Others have demonstrated that healthy individuals have largely unchanged responses over time to a panel of self-antigens,50 51 although we are, to our knowledge, the first to observe this phenomenon with an array of this size and the first to study it in the setting of prostate cancer. Despite this individual signature, we did observe common recognized proteins among patients with the same clinical stage of disease. Due to the lack of large random fluctuations in antibody responses over time, this platform appears particularly suited to identifying changes in individuals over time induced by disease or treatment. This demonstrates the potential value of this platform for future more extensive studies specifically evaluating antigen spread, to determine whether the development of antibody responses is associated with clinical outcome, and contrasting the effects of different immunotherapies on patient antibody repertoires.
Most strikingly, we have shown that treatments can modulate a patient’s antibody repertoire, at least during a 6-month study period. We found that antigen-specific vaccination elicited greater increases in off-target antibody responses over time than did traditional targeted therapy, showing that this may be a method of quantifying antigen spread caused by treatment. Our data are consistent with previous findings examining antibody responses following treatment with Sipuleucel-T, but we were able to study a greater number of prostate cancer-associated peptides and compare the effects of immunotherapy with the effects of ADT.14 These specific proteins to which patients receiving the PAP vaccine developed increasing responses may be useful as biomarkers of response to therapy. Interestingly, we did not identify any proteins to which patients receiving ADT developed increasing responses, in contrast to findings in our previous work.18 It is possible that changes in antibody responses in ADT-treated patients were too low in magnitude to meet our selection criteria. These data suggest that ADT itself is not driving the majority of the dramatic differences in antibody profiles between patients with nmCSPC to nmCRPC. Rather, it may be a direct consequence of changes in the biology of the tumor and gene expression that occur during the development of castration resistance. Future studies will use this platform to identify antibody signature changes that are specific for various types of immunotherapies and quantifying the number and nature of antigens recognized following therapy. In particular, we are interested in studying in detail the associations between antibody responses and clinical outcomes, as we hypothesize that induction of antibodies to larger numbers of antigens, and potentially certain types of antigens, may lead to improved clinical outcomes such as prolonged progression-free survival and overall survival.
Acknowledgments
The authors would like to thank Ken Lo for array construction and analysis. The authors would also like to thank Dr Melissa Gamat-Huber, Dr Laura Johnson, Dr Chris Zahm, Ellen Wargowski and Anusha Muralidhar for their help in proof-reading.
References
Supplementary materials
Supplementary Data
This web only file has been produced by the BMJ Publishing Group from an electronic file supplied by the author(s) and has not been edited for content.
Footnotes
Contributors HP wrote the manuscript and performed data analysis; CAM, JZ and PSN provided data for the microarray construction; DGM designed the microarray and obtained serum samples; TLN and MAN performed statistical analysis. All authors contributed to the writing and approval of the final manuscript.
Funding This work was supported by the National Institutes of Health (R01 CA219154, TL1 TR002375, P30 CA014520 and P50 CA097186) and by the Department of Defense Prostate Cancer Research Program (W81XWH-18-1-0406).
Disclaimer The content is solely the responsibility of the authors and does not necessarily represent the official views of the National Institutes of Health.
Competing interests DGM has ownership interest, has received research support and serves as consultant to Madison Vaccines, which has licensed intellectual property related to this content.
Patient consent for publication Not required.
Ethics approval Study protocols that permitted collection and use of human blood samples were reviewed and approved the University of Wisconsin Human Subjects’ Review Board (IRB). All patients gave written informed consent for use of blood products for research.
Provenance and peer review Not commissioned; externally peer reviewed.
Data availability statement Data are available in a public, open access repository. Data are available on reasonable request. All data relevant to the study are included in the article or uploaded as supplementary information. Workflow details are supplied in an R markdown document and the rendered Statistical Supplement. These materials are also available at: https://github.com/wiscstatman/immunostat-prostate.
Supplemental material This content has been supplied by the author(s). It has not been vetted by BMJ Publishing Group Limited (BMJ) and may not have been peer-reviewed. Any opinions or recommendations discussed are solely those of the author(s) and are not endorsed by BMJ. BMJ disclaims all liability and responsibility arising from any reliance placed on the content. Where the content includes any translated material, BMJ does not warrant the accuracy and reliability of the translations (including but not limited to local regulations, clinical guidelines, terminology, drug names and drug dosages), and is not responsible for any error and/or omissions arising from translation and adaptation or otherwise.