Article Text

Abstract
Background Responses to immunotherapy vary between different cancer types and sites. Here, we aimed to investigate features of exhaustion and activation in tumor-infiltrating CD8 T cells at both the primary and metastatic sites in epithelial ovarian cancer.
Methods Tumor tissues and peripheral blood were obtained from 65 patients with ovarian cancer. From these samples, we isolated tumor-infiltrating lymphocytes (TILs) and peripheral blood mononuclear cells. These cells were used for immunophenotype using multicolor flow cytometry, gene expression profile using RNA sequencing and ex vivo functional restoration assays.
Results We found that CD39+ CD8 TILs were enriched with tumor-specific CD8 TILs, and that the activation status of these cells was determined by the differential programmed cell death protein 1 (PD-1) expression level. CD39+ CD8 TILs with high PD-1 expression (PD-1high) exhibited features of highly tumor-reactive and terminally exhausted phenotypes. Notably, PD-1high CD39+ CD8 TILs showed similar characteristics in terms of T-cell exhaustion and activation between the primary and metastatic sites. Among co-stimulatory receptors, 4-1BB was exclusively overexpressed in CD39+ CD8 TILs, especially on PD-1high cells, and 4-1BB-expressing cells displayed immunophenotypes indicating higher degrees of T-cell activation and proliferation, and less exhaustion, compared with cells not expressing 4-1BB. Importantly, 4-1BB agonistic antibodies further enhanced the anti-PD-1-mediated reinvigoration of exhausted CD8 TILs from both primary and metastatic sites.
Conclusion Severely exhausted PD-1high CD39+ CD8 TILs displayed a distinctly heterogeneous exhaustion and activation status determined by differential 4-1BB expression levels, providing rationale and evidence for immunotherapies targeting co-stimulatory receptor 4-1BB in ovarian cancers.
- adaptive immunity
- immunity
- CD8-positive T-lymphocytes
- lymphocytes
- tumor-infiltrating
This is an open access article distributed in accordance with the Creative Commons Attribution Non Commercial (CC BY-NC 4.0) license, which permits others to distribute, remix, adapt, build upon this work non-commercially, and license their derivative works on different terms, provided the original work is properly cited, appropriate credit is given, any changes made indicated, and the use is non-commercial. See http://creativecommons.org/licenses/by-nc/4.0/.
Statistics from Altmetric.com
Introduction
Ovarian cancer has a low cure rate, and the fifth highest mortality rate among cancers in women.1 Approximately 75% of the newly diagnosed patients are diagnosed with advanced-stage disease, partly explaining the high mortality rate of this cancer.2 Even with aggressive treatment combining chemotherapy and debulking surgery, the 5-year survival rate is <30% in advanced-stage disease.
In the urgent quest for new treatment strategies, immunotherapy has emerged as a promising new option3–5 since immune checkpoint inhibitors (ICIs) show remarkable success in several cancers.6–10 However, unlike other immune-reactive cancers, ovarian cancer has exhibited a response rate of 10%–20% to immunotherapy in various clinical trials using antiprogrammed cell death protein 1 (anti-PD-1), antiprogrammed death-ligand 1 and anticytotoxic T-lymphocyte-associated protein 4 (anti-CTLA-4) treatments.11–14 These poor results highlight the need for novel immunotherapeutic strategies to improve the therapeutic efficacy of ICIs. Among various therapeutic strategies including combining ICIs with targeted agents, locoregional therapy and other forms of immunotherapy, one promising therapeutic approach is using agonistic antibodies to target co-stimulatory receptors, such as 4-1BB, OX-40, TNFR2, HVEM and glucocorticoid-induced TNFR-related protein (GITR). Along with T-cell receptor (TCR) signaling, co-stimulatory signaling is critical for full T-cell activation and positively regulates T-cell differentiation, effector function and memory formation. Therefore, agonistic antibodies targeting co-stimulatory receptors may be useful for augmenting anticancer effector functions.
Another important concern in cancer immunotherapy is whether an immunomodulatory drug will have the same effects in both metastatic sites and the primary sites. While it may be expected that metastatic sites will have similar responses to the same immunomodulatory drug, the effects actually differ depending on the metastasis site.15–17 Thus, in patients undergoing immunotherapy, the prognosis may depend on where metastasis occurs.18–21 Since most patients receiving immunotherapy have metastatic sites, determining the immune cell characteristics in the metastatic sites is as important as knowing the immune cell characteristics in the primary site. However, while several studies have reported differences in cancer cells between metastatic and primary sites,22–25 few studies have identified the characteristics of CD8 T cells in metastatic sites compared with in the primary sites.
The diversity of tumor immune microenvironments and the different responses to immunotherapy between cancers26 necessitate the detailed characterization of tumor-infiltrating CD8 T cells in both primary and metastatic lesions. However, studies to date are insufficient, particularly for ovarian cancers. Thus, in the present study, we aimed to investigate the immunological characteristics of CD8 TILs in human ovarian cancers to identify distinctive activation and exhaustion statuses. We further examined the immunological characteristics of CD8 TILs in metastatic sites to evaluate how they differed from those in the primary sites. Finally, we investigated the expression of co-stimulatory receptors in CD8 TILs in the primary and metastatic sites to identify common effective targets for immunomodulatory drugs.
Materials and methods
Study design and patient samples
We prospectively enrolled patients who were newly diagnosed with pathologically confirmed ovarian cancer between February 2018 and February 2020 at Severance Hospital (Seoul, Korea). After exclusion of patients who underwent neoadjuvant chemotherapy, our analysis included 65 patients. From each patient, we collected whole blood samples and separately collected fresh tissue samples of the primary site (ovary) and metastatic sites when possible. Metastatic site tissues samples were collected from the bladder, transverse colon, spleen, sigmoid colon, diaphragm, cul-de-sac, peritoneum, pelvis and omentum. table 1 summarizes the clinical characteristics of the enrolled patients.
The clinical characteristics of the enrolled patients
From whole blood, we isolated peripheral blood mononuclear cells (PBMCs) by Ficoll-Paque density gradient centrifugation (GE Healthcare, Uppsala, Sweden). To obtain single-cell suspensions of tumor-infiltrating lymphocytes (TILs) from tumor tissues, fresh tumor tissues were extracted from primary sites or metastatic sites and were immediately cut into small pieces (2–4 mm) using dissection scissors. Next, ≤1 g of tumor tissue was transferred to a gentle MACS C-Tube (Milteny Biotec, Bergisch Gladbach, Germany) containing an enzyme mixture (200 µL enzyme H, 100 µL enzyme R and 25 µL enzyme A; Milteny Biotec, Bergisch Gladbach, Germany) premixed with 4.7 mL RPMI. These C-tubes were then placed on a gentle MACS Octo Dissociator (Milteny Biotec) to undergo mechanical and enzymatic digestion using a predefined program ‘37C_h_TDK_3’ for 61 min. After digestion, the cell suspensions were passed through 40 μm pore cell strainers, and then washed once. Next, the cells were resuspended in 10 mL media, and 20 µL of this suspension was stained with an equal volume of AOPI staining solution (Nexcelcom Bioscience, Lawrence, Massachusetts, USA). To determine the number and viability of the mononuclear cells, the stained cells were assessed using a Cellometer Auto 2000 (Nexcelcom). Finally, the cells were washed once and cryopreserved until further use.
Multimer staining and flow cytometry
We performed multimer staining to detect tumor-specific CD8 T cells and tumor-unrelated virus-specific CD8 T cells. To detect tumor-associated antigen (TAA)-specific CD8 T cells, we used two phycoerythrin-conjugated dextramers: one specific for the NY-ESO-1157–165 epitope27 28 (SLLMWITQV, HLA-A*02:01), and one for the MAGE-A3112–120 epitope29 30 (KVAELVHFL, HLA-A*02:01) (Immudex, Copenhagen, Denmark). To detect virus-specific CD8 T cells, we used two allophycocyanin-conjugated pentamers: one specific for the HCMVpp65495–504 epitope (NLVPMVATV, HLA-A*02:01) and one for the EBV LMP-2426–434 epitope (CLGGLLTMV, HLA-A*02:01) (Proimmune, Oxford, UK).
For multimer staining, 1–2×10⁶ cells were pretreated with 50 nmol/L of the protein kinase inhibitor dasatinib (Axon Medchem, Groningen, The Netherlands) for 30 min at 37°C to inhibit TCR internalization.31 32 Then these cells were stained with multimers for 20 min at 4°C, and washed twice with fluorescence-activated cell sorting (FACS) buffer (phosphate-buffered saline+5% fetal bovine serum+1% sodium azide). Next, the cells were stained using the LIVE/DEAD fixable dead cell stain kit (Invitrogen, Carlsbad, California, USA) for 5 min at 20°C. Cells that were not stained with multimers were first stained with the LIVE/DEAD fixable dead cell stain kit. Without washing, the LIVE/DEAD-stained cells were next stained with multiple fluorochrome-conjugated antibodies against surface markers for 20 min at 4°C, and then washed again with FACS buffer. For intracellular staining, the cells stained with LIVE/DEAD and with antibodies against surface makers were fixed and permeabilized using a forkhead box P3 staining buffer kit (eBioscience, San Diego, California, USA), and then further stained with antibodies against intracellular proteins. Flow cytometry was performed using either an LSR II instrument or an ARIA II cell sorter and FACSDiva software (BD Biosciences, San Jose, California, USA). Data were analyzed using FlowJo software (Treestar, San Carlos, California, USA).
Multimer-positive cells were clearly identified when compared with fluorescence minus one controls or irrelevant epitope (HCV NS31406-1415)-specific multimer-stained cells (online supplemental figure S1A,B). Next, we strictly gated multimer+ cells to remove signals caused by non-specific binding, and confirmed that the multimer+ cells were tumor-specific CD8 TILs by comparing tumor-reactive markers (PD-1high and 4-1BB) and the exhaustion status marker Tcf-1 between multimer+ and multimer– cells (online supplemental figure S1C). A multimer-stained sample was used for analysis only when ≥50 multimer+ cells were detected.
Supplemental material
Online supplemental tables S1,S2 present all the antibodies and FACS panels that were used in this study.
Supplemental material
Supplemental material
RNA sequencing
RNA sequencing (RNA-seq) was performed using sorted 4-1BBneg PD-1high CD39+, 4-1BBpos PD-1high CD39+ CD8 TILs and PD-1+CD39− CD8 TILs (reference population) (n=3). Cell sorting was performed in two steps: first with the magnetic-activated cell sorter (MACS, Miltenyi Biotec), and then with an ARIA II cell sorter. Total tumor-infiltrating cells were magnetically labeled using CD8 microbeads, and positively selected using the MACS cell sorter. Next, the sorted CD8 T cells were stained with antibodies against CD3, CD39, PD-1 and 4-1BB, and sorted based on surface marker expressions using an ARIA II cell sorter (online supplemental figure S2). Online supplemental table S3 presents the obtained cell counts for each population. Finally, the sorted cells were dissolved in TRIzol reagent (Invitrogen). For RNA extraction, chloroform was added and the samples were vigorously mixed by hand for 15 s and then incubated at room temperature (RT) for 2 min. Next, the incubated mixtures were centrifuged at 12 000 rpm for 15 min at 4°C. The aqueous phase was removed and mixed with 1 µL of 1:2 diluted glycogen (Roche 10901393001) and 1 µL isopropanol. These mixtures were incubated at RT for 10 min, to allow total RNA precipitation. Next, the samples were centrifuged at 12 000 rpm for 10 min at 4°C, washed with 75% ethanol, and then centrifuged again at 10 000 rpm for 5 min at 4°C. The resultant RNA pellets were dried for 10 min at RT, and then dissolved in RNase-free water. The purified RNA quality was measured using an Agilent 4200 tape station. Most samples showed RNA integrity number (RIN) values ranging from 3.6 to 9.1, with an average of 5.8.
Supplemental material
RNA-seq libraries were constructed using the Ovation RNA-Seq System V2 kit (NuGen 7102-32). Briefly, Ovation RNA-Seq System V2 targets RNA through a DNA-universal RNA chimeric primer, and implements first and second complementary DNA (cDNA) synthesis. Subsequently, the cDNA is amplified through single primer isothermal amplification, with repeated hybridization and degradation of the single universal primer. To assess non-specific amplification, one sample was diluted 1:10 000 as a control for each experiment. The cDNA libraries were constructed using the Illumina indexed adapter attachment, and converted using the MGI library conversion kit (MGI Tech 1000004155). The MGI libraries were sequenced using 100 bp paired-end mode on an MGI DNBSEQ-G400 sequencer.
The sequencing reads were aligned to the human reference genome using STAR (V.2.7.2),33 and normalized for effective library size. Differentially expressed genes (DEGs) were analyzed using DESeq2.34 In the DESeq2 algorithm, first, size factors are estimated using the median-of-ratios method. Next, to accurately estimate the dispersion parameter for within-group variability, gene-wise dispersion estimates are generated, and are then shrunk toward the values predicted by the curve of location parameters of the distribution, to obtain final dispersion values. For significance testing, DESeq2 applies a Walt test: the shrunken estimate of the logarithmic fold-change divided by its SE. Finally, the Walt test p values are adjusted for multiple testing using the procedure of Benjamini and Hochberg.35 We selected the top DEGs based on the highest p values. To identify enriched gene ontology (GO) terms, we performed GO enrichment analysis with defined DEGs, and used a visualization tool (Gorilla tools) at http://cbl-gorilla.cs.technion.ac.il. Gene sets related to the activation and the exhaustion signatures of CD8 T cells36–39 were used for gene set enrichment analysis (GSEA) and gene set variation analysis (GSVA).40 The GEO accession number for our RNA-seq data is GSE160705.
The Cancer Genome Atlas data analysis
For the analysis, we obtained gene expression profiles and clinical data of 309 patients with ovarian cancer in The Cancer Genome Atlas (TCGA) database from the GDC Data Portal (National Cancer Institute, Rockville, Maryland, USA). For survival analysis, we calculated the gene set enrichment score via GSVA using the 177 DEGs (with a p value of <0.05 and log2fold-change >1) from our RNA-seq data. The cut-off value was determined using the maximal χ2 method.
Ex vivo T-cell restoration assay
The restoration capacity of tumor-infiltrating CD8 T cells was evaluated with regard to two aspects: function and proliferation. To assess the restoration capacity of tumor-infiltrating CD8 T cells in terms of proliferation, cryopreserved tumor-infiltrating cells were rapidly thawed and labeled with CellTrace Violet (Invitrogen). Then those labeled cells were stimulated with 1 ng/mL anti-CD3 antibody (OKT-3; eBioscience), and with or without 5 µg/mL anti-PD-1 blocking antibody (EH12.2H7; BioLegend, San Diego, California, USA) and 10 µg/mL anti-4-1BB agonistic antibody (provided by ABL Bio, Seongnam, Korea). MOPC-21 (BioLegend) was used as an isotype control. After stimulation for 108 hours at 37°C with 5% CO2, the cells were harvested and stained with antibodies against LIVE/DEAD, CD3 and CD8. The mitotic index was calculated by dividing the total mitotic events by the number of precursor cells in each mitotic division. We then divided the mitotic index of the treatment group by that of the isotype-treated control group to determine the stimulation index (SI).
To evaluate the restoration capacity of tumor-infiltrating CD8 T cells in terms of function, we measured interferon-gamma (IFN-γ) and tumor necrosis factor-alpha (TNF-α) by intracellular staining after tumor-infiltrating cells were stimulated with anti-CD3 antibody and with or without anti-PD-1 antibody and anti-4-1BB antibody. The cryopreserved tumor-infiltrating cells were thawed and then stimulated with 5 µg/mL anti-PD-1 blocking antibody and 10 µg/mL anti-4-1BB agonistic antibody in the presence of 1 ng/mL anti-CD3 antibody. After 24 hours of incubation at 37°C incubator with 5% CO2, we added monensin and brefeldin A (BD Biosciences), and the cells were incubated for an additional 12 hours. Finally, the cells were harvested and intracellular cytokines were stained with surface markers.
Statistical analyses
Statistical analyses were performed using Prism software V.8.4.3 (GraphPad, La Jolla, California, USA). We applied the Mann-Whitney U test and Wilcoxon matched-pairs signed-rank test for unpaired and paired non-parametric comparisons, respectively. The non-parametric Spearman’s rank correlation test was used to assess correlations between two parameters. A p value of <0.05 was considered to indicate statistical significance.
Results
CD39 is predominantly expressed in tumor-specific CD8 TILs
We first analyzed the immune checkpoint receptor expression on CD8 TILs compared with peripheral blood CD8 T cells—examining PD-1, CTLA-4 and T cell immunoglobulin and mucin domain-containing protein 3 (Tim-3). The frequencies of PD-1+, CTLA-4+ and Tim-3+ cells were significantly higher among CD8 TILs compared with peripheral blood CD8 T cells (figure 1A). Among these immune checkpoint receptors, CD8 TILs exhibited predominantly expression of PD-1 in terms of the percentage of positive cells. Recent publications suggest that tumor-unrelated bystander CD8 T cells are abundant in tumor microenvironments.41 42 Thus, we further examined tumor-specific CD8 TILs using two HLA-A*0201-restricted multimers specific to NY-ESO-1157–165 and MAGE-A3112-120, and examined tumor-unrelated virus-specific CD8 T cells using multimers specific to HCMVpp65495–504 and EBV LMP-2426–434. Among the 26 patients having HLA-A*0201, we detected 17 TAA-specific CD8 T-cell populations in 10 patients (38.5%), and 16 virus-specific CD8 T-cell populations in 12 patients (46.2%) (online supplemental table S4).
Supplemental material

CD39 is predominantly expressed in tumor-specific CD8 tumor-infiltrating lymphocytes (TILs). (A) Programmed cell death protein 1 (PD-1), cytotoxic T-lymphocyte-associated protein 4 (CTLA-4) and Tim-3 expression on CD8 T cells, compared between peripheral blood mononuclear cells (PBMCs) and TILs. (B) Representative flow cytometry plots showing PD-1, CD39, CD103 and CD69 expression on tumor-specific multimer+ CD8 TILs and on tumor-unrelated multimer+ (virus-specific) CD8 TILs. Gray background contour plots represent the characteristics of total CD8 TILs, and red and blue dot plots represent the characteristics of tumor-specific CD8 TILs and virus-specific CD8 TILs, respectively. (C) Bar graph shows cumulative data regarding the percentages of PD-1, CD39, CD103 and CD69 expression among total CD8 TILs (gray bars), tumor-specific multimer+ CD8 TILs (red bars) and tumor-unrelated virus-specific multimer+ CD8 TILs (blue bar) from the primary tumor site (ovary). (D) We compared eight pairs of tumor-specific multimer+ CD8 TILs and tumor-unrelated virus-specific multimer+ CD8 TILs, which were detected in the same patients. (E) Percentage of CD39+ cells among CD8 TILs, according to cancer stage, tumor grade and tumor histology. Graphs show the mean and SD. **P<0.01; ***p<0.001; ****p<0.0001; ns, not significant.
Next, we examined the expressions of PD-1, CD39, CD103 and CD69 as known surrogate markers for tumor-specific CD8 T cells42–44 (figure 1B and C). In contrast to prior findings, ovarian cancers exhibited no significant difference in PD-1 or CD69 expression between tumor-specific CD8 TILs and tumor-unrelated virus-specific CD8 TILs (ie, CMV-specific or EBV-specific) (figure 1C). However, the percentages of CD39+ cells and CD103+ cells were significantly higher among tumor-specific multimer+ CD8 TILs compared with among virus-specific CD8 TILs (figure 1C). Notably, CD39 expression was barely detected in virus-specific CD8 TILs (figure 1C), which was further confirmed by paired analysis directly comparing the percentage of CD39+ cells between tumor-specific CD8 TILs and virus-specific CD8 TILs (figure 1D). These results suggested that, in ovarian cancers, CD39 is predominantly expressed on tumor-specific CD8 TILs, and may thus be useful as a surrogate marker to exclude tumor-unrelated virus-specific bystander CD8 T cells in immune analysis using tumor tissues. In addition, there was no significant difference in the frequency of CD39+ cells among CD8 TILs depending on the ovarian cancer stages, tumor grades or tumor histology (figure 1E).
PD-1high CD39+ CD8 TILs exhibit a phenotype of terminally exhausted but highly tumor-reactive T cells
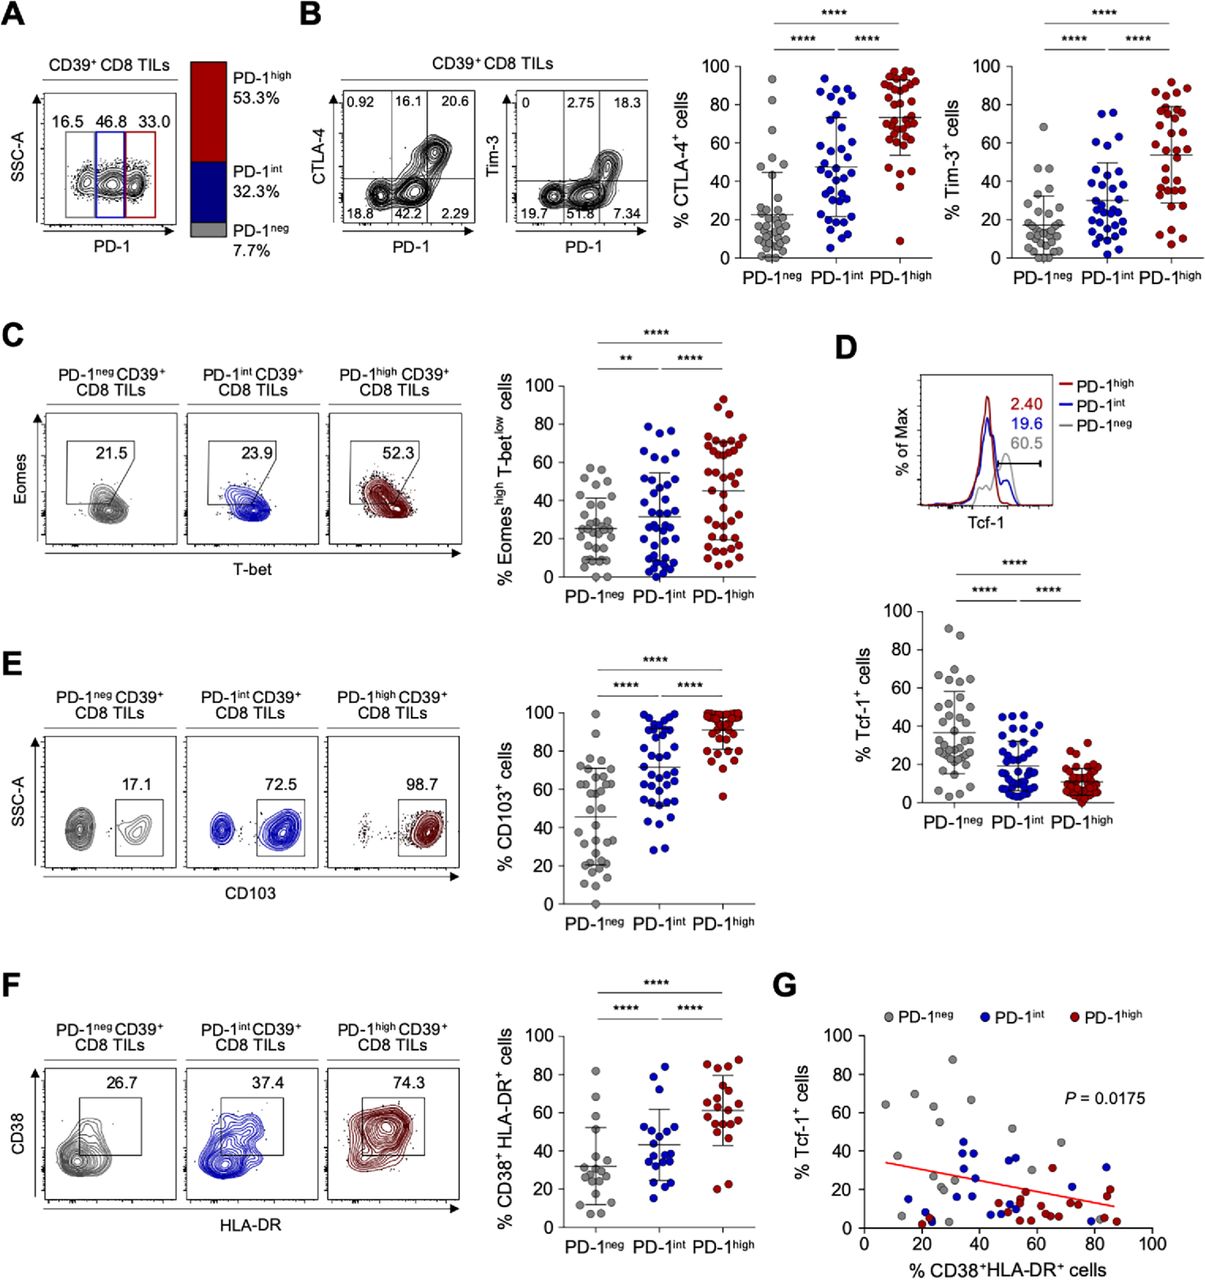
Based on PD-1 expression levels, we subdivided CD39+ CD8 TILs into three distinct populations: PD-1-negative (PD-1neg), PD-1-intermediate (PD-1int) and PD-1-high (PD-1high) subpopulations (figure 2A). The frequency of PD-1high cells among CD39+ CD8 TILs did not significantly differ according to ovarian cancer stages, tumor grades or tumor histology (online supplemental figure S3). We then examined differences in the characteristics of these CD39+ tumor-infiltrating CD8 T cell subpopulations distinguished by differential PD-1 expression in ovarian cancers. The frequencies of CTLA-4+ and Tim-3+ cells were significantly higher in PD-1high subpopulations than in PD-1int or PD-1neg subpopulations (figure 2B). We also examined the expression of transcription factors—such as T-bet, Eomes and Tcf-1, which contribute to the heterogeneous status of exhausted CD8 T cells.45–47 We found that PD-1high subpopulations exhibited the highest proportion of Eomes high expressing and T-bet low expressing (Eomeshigh T-betlow) cells, that is, a subset of terminally exhausted that is associated with poor reinvigoration on ICI treatment45 48 (figure 2C). On the other hand, the frequency of Tcf-1+ cells, which represent progenitor-like exhausted T cells associated with T-cell reinvigoration potential by ICIs,46 47 was lowest in the PD-1high subpopulation and highest in the PD-1neg subpopulation (figure 2D).

Detailed immunological characterisation of CD39+ CD8 tumor-infiltrating lymphocytes (TILs) from the ovary according to programmed cell death protein 1 (PD-1) expression level. (A) CD39+ CD8 TILs were divided into three subpopulations based on PD-1 expression level. The left image is a representative flow cytometry contour plot, with the gray box indicating the subpopulation without PD-1 expression (PD-1neg), the blue box intermediate PD-1 expression (PD-1int) and the red box high PD-1 expression (PD-1high). The bar on the right shows the average percentages of the PD-1neg, PD-1int and PD-1high subpopulations among all patients. (B) Percentages of cytotoxic T-lymphocyte-associated protein 4 (CTLA-4)+ and Tim-3+ cells among CD39+ CD8 TILs according to the differential expression of PD-1. Contour plots on the left are representative plots. (C–F) Frequencies of Eomeshigh T-betlow (C), Tcf-1+ (D), CD103+ (E) and CD38+ HLA-DR+ (F) cells among subpopulations according to differential expression of PD-1. Left panel shows representative flow cytometry plots for each. (G) Correlation between the frequencies of Tcf-1+ cells and CD38+ HLA-DR+ cells among CD39+ CD8 TILs from the ovary. Graphs show the mean and SD. **P<0.01; ****p<0.0001.
We next investigated parameters of tumor reactivity (ie, CD103) and T-cell activation (ie, CD38 and HLA-DR). The subpopulation of PD-1high CD39+ CD8 TILs exhibited the highest percentages of CD103+ cells representing tumor reactivity,43 and of CD38+ HLA-DR+ cells representing activation (figure 2E and F). Additionally, the frequency of CD38+ HLA-DR+ CD39+ CD8 TILs was inversely correlated with the frequency of Tcf-1+ CD39+ CD8 TILs (figure 2G). These findings suggested that PD-1high CD39+ CD8 TILs exhibit features of tumor-reactive but terminally exhausted T cells, indicating active antitumor engagement and resultant exhausted phenotypes.
4-1BB is predominantly expressed on PD-1high CD39+ CD8 TILs and features a distinctive T-cell activation status
The tumor-reactive but terminally exhausted features of PD-1high CD39+ CD8 TILs suggested the need for additional therapeutic strategies in combination with ICI. One promising approach involves targeting co-stimulatory receptors.49–51 However, little is known about the expression patterns of co-stimulatory receptors on CD8 TILs, or about the immunological implications of co-stimulatory receptor expression in ovarian cancers. Therefore, we next examined the expression levels of various members of the tumor necrosis factor receptor superfamily (TNFRSF) on CD39+ CD8 TILs from patients with ovarian cancer, including 4-1BB (TNFRSF9, CD137), CD30 (TNFRSF8), CD40 ligand (CD40L), GITR (TNFRSF18) and OX40 (TNFRSF4, CD134). Notably, compared with other TNFRSF members, 4-1BB was more prominently expressed on CD8+ TILs (figure 3A). Additionally, 4-1BB was rarely expressed on PD-1+CD39− CD8 TILs (online supplemental figure S4).
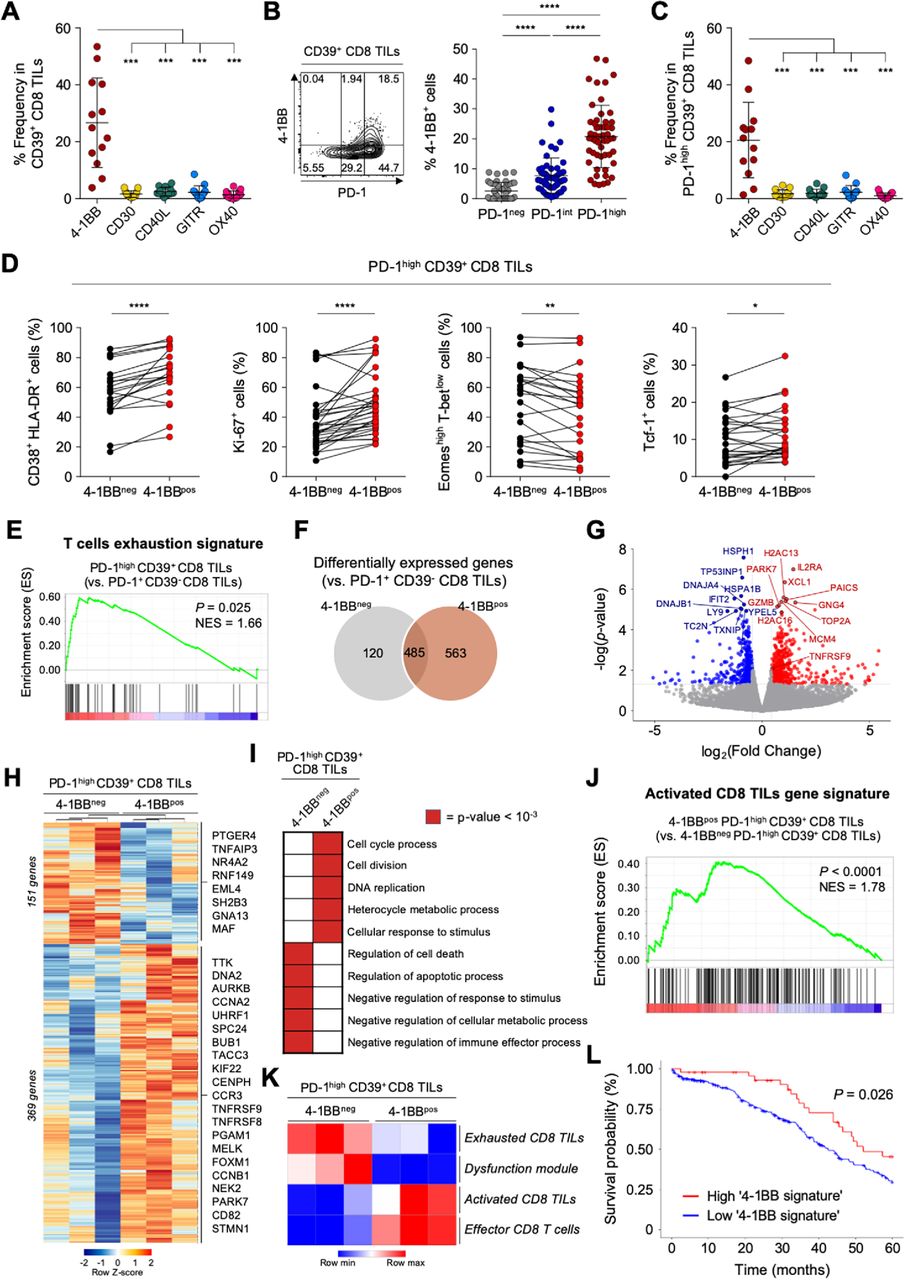
4-1BB is predominantly expressed on programmed cell death protein 1 (PD-1)high CD39+ CD8 tumor-infiltrating lymphocytes (TILs) and features a distinctive T-cell activation status. (A) Compared with other co-stimulatory receptors belonging to tumor necrosis factor (TNF) receptor superfamily, 4-1BB is exclusively expressed in CD39+ CD8 TILs from the ovary. (B) Percentages of 4-1BB+ cells in subpopulations according to PD-1 expression. Left panel shows a representative flow cytometry contour plot of 4-1BB expression according to PD-1 expression level. (C) Comparison of the expressions of various co-stimulatory receptors in PD-1high CD39+ CD8 TILs. (D) The frequencies of CD38+ HLA-DR+, Ki-67+, Eomeshigh T-betlow and Tcf-1+ cells in PD-1high CD39+ CD8 TILs, directly compared between 4-1BBneg cells and 4-1BBpos cells. (E–L) RNA expression levels PD-1high CD39+ CD8 TILs, compared between 4-1BBneg and 4-1BBpos cells. (E) Gene set enrichment analysis (GSEA) was performed to compare enrichment of the ‘T-cell exhaustion signature’ between PD-1highCD39+ CD8 TILs and PD-1+CD39− CD8 TILs. Normalized enrichment score (NES)=1.66, p<0.025. (F) Venn diagram shows differentially expressed genes between 4-1BBneg PD-1high CD39+ CD8 TILs and 4-1BBpos PD-1high CD39+ CD8 TILs compared with PD-1+ CD39− CD8 TILs. (G) Volcano plots for differentially expressed genes between 4-1BBpos PD-1high CD39+ CD8 TILs vs 4-1BBneg PD-1high CD39+ CD8 TILs. The top 20 genes and 4-1BB encoding gene, TNFRSF9, are annotated. (H) Heatmap shows differentially expressed genes between 4-1BBneg PD-1high CD39+ CD8 TILs and 4-1BBpos PD-1high CD39+ CD8 TILs. In 4-1BBpos PD-1high CD39+ CD8 TILs, 151 genes are downregulated and 369 genes are upregulated. Representative genes are noted. (I) The 10 significant gene ontology terms relatively enriched in each group. (J) GSEA revealed enrichment of the activated CD8 TIL gene signature in 4-1BBpos PD-1high CD39+ CD8 TILs compared with 4-1BBneg PD-1high CD39+ CD8 TILs (NES=1.78, p<0.0001). (K) Gene set variation analysis (GSVA) was performed in each group using gene signatures of ‘exhausted CD8 TILs’, ‘dysfunction module’, ‘activated CD8 TILs’ and ‘effector CD8 T cells’. (L) The probability of 5-year overall survival in patients with ovarian cancer from the The Cancer Genome Atlas database according to enrichment of the ‘4-1BB signature’ comprising 177 upregulated differentially expressed genes Graphs indicate the mean and SD. *P<0.05; **p<0.01; ***p<0.001; ****p<0.0001.
Comparing the 4-1BB expression levels according to differential PD-1 expression revealed that 4-1BB was predominantly expressed on PD-1high CD39+ CD8 TILs (figure 3B). Indeed, terminally exhausted (PD-1high CD39+) CD8 TILs exhibited the highest percentage of 4-1BBpos cells compared with the percentages of other TNFRSF-expressing cells (figure 3C).
To characterize the 4-1BBpos terminally exhausted CD8 TILs, we further examined markers of T-cell activation (CD38 and HLA-DR), proliferation (Ki-67) and exhaustion status (Tcf-1, Eomes and T-bet). Among PD-1high CD39+ CD8 TILs, compared with 4-1BBneg cells, the 4-1BBpos cells displayed immunophenotypes indicating higher degrees of T-cell activation and proliferation, and less exhaustion (figure 3D).
Next, to further investigate the distinct features of 4-1BBpos cells among highly exhausted PD-1high CD39+ CD8 TILs in ovarian cancers, we performed RNA-seq using 4-1BBpos and 4-1BBneg cells sorted from PD-1high CD39+ CD8 TILs. We also analyzed PD-1+CD39− CD8 TILs as a reference population (online supplemental figure S2). Compared with this reference population, the transcriptome from PD-1highCD39+ CD8 TILs was enriched for the genetic signature of T-cell exhaustion36 (figure 3E). Intriguingly, compared with PD-1+ CD39− CD8 TILs, examination of DEGs in PD-1high CD39+ CD8 TILs revealed that 4-1BBpos and 4-1BBneg cells shared 485 DEGs in common, while an additional 683 genes were upregulated or downregulated in only one subpopulation (120 genes in 4-1BBneg and 563 in 4-1BBpos) (figure 3F; online supplemental table S5). TCF7 was differentially expressed between PD-1high CD39+ and PD-1+ CD39− CD8 TILs (online supplemental figure S5A and online supplemental table S5). This is because the PD-1+ CD39− CD8 TILs consist of mostly PD-1int-expressing cells (78.9%, online supplemental figure S5B), and this finding is consistent with the flow cytometry results (figure 2D).
Supplemental material
Direct comparison of the 4-1BBpos and 4-1BBneg subpopulations among PD-1high CD39+ CD8 TILs yielded the identification of 520 differentially expressed genes, of which 369 genes were significantly upregulated and 151 genes were downregulated in 4-1BBpos cells compared with 4-1BBneg cells (figure 3G and H; online supplemental table S6). DEGs between 4-1BBpos and 4-1BBneg PD-1high CD39+ CD8 TILs were subjected to GO term analysis, revealing that 4-1BBpos cells showed enrichment of genes related to ‘cell cycle process’, ‘cell division’, ‘DNA replication’, ‘heterocycle metabolic process’ and ‘cellular response to stimulus’, whereas 4-1BBneg cells showed enrichment of genes related to ‘regulation of cell death’, ‘regulation of apoptotic process’, ‘negative regulation of response to stimulus’, ‘negative regulation of cellular metabolic process’ and ‘negative regulation of immune effector process’ (figure 3I; online supplemental table S7). GSEA confirmed that, compared with 4-1BBneg cells, 4-1BBpos cells exhibited significant enrichment of the ‘activated CD8 TILs gene signature’38 (figure 3J). Additionally, GSVA analysis with the activation and exhaustion signatures of CD8 T cells revealed that 4-1BBpos cells were highly enriched for gene signatures related to ‘activated CD8 TILs gene signature’38 and ‘effector CD8 T cells gene signature’,37 whereas 4-1BBneg cells were highly enriched for ‘exhausted CD8 TILs gene signature’38 and ‘dysfunction module’39 (figure 3K). The 177 DEGs that were upregulated in 4-1BBpos PD-1high CD39+ CD8 TILs compared with in the 4-1BBneg counterpart (p value of <0.05 and log2fold-change >1) were defined as the ‘4-1BB signature’, and tumors with high 4-1BB signature were significantly correlated with better survival outcome in patients with ovarian cancer in TCGA cohort (figure 3L).
Supplemental material
Supplemental material
Overall, our results suggested that the 4-1BBpos subpopulation displays features of distinctive T-cell activation status, and may retain higher proliferative and reinvigoration potential among highly exhausted tumor-specific CD8 TILs.
CD39+ CD8 TILs from metastatic sites exhibit severe T-cell exhaustion features similar to the primary site
Considering that most patients with ovarian cancer receiving immunotherapy have metastatic sites, it is important to understand the distinct characteristics of exhausted CD8 T cells from the metastatic site compared with the primary site. We obtained TILs from various metastatic sites—including the bladder, transverse colon, spleen, sigmoid colon, diaphragm, cul-de-sac, peritoneum, pelvis and omentum (online supplemental table S8 presents detailed information about the metastatic sites). We confirmed that CD39 is predominantly expressed on tumor-specific CD8 TILs also in metastatic site, wherease CD39 expression was barely detected in tumor-unrelated virus-specific CD8 TILs (figure 4A, online supplemental figure S6). To investigate the immunological characteristics of CD39+ CD8 TILs in the metastatic sites, we first compared the expressions of immune checkpoint receptors such as PD-1, CTLA-4 and Tim-3 in CD39+ CD8 TILs between primary sites and the metastatic sites, and found that the frequencies of PD-1+ and CTLA-4+ cells in CD39+ CD8 TILs were significantly lower in metastatic sites than in primary sites (figure 4B). However, there was no significant differences in the frequency of CD103+, Eomeshigh T-betlow cells and Tcf-1+ cells among CD39+ CD8 TILs (online supplemental figure S7).
Supplemental material
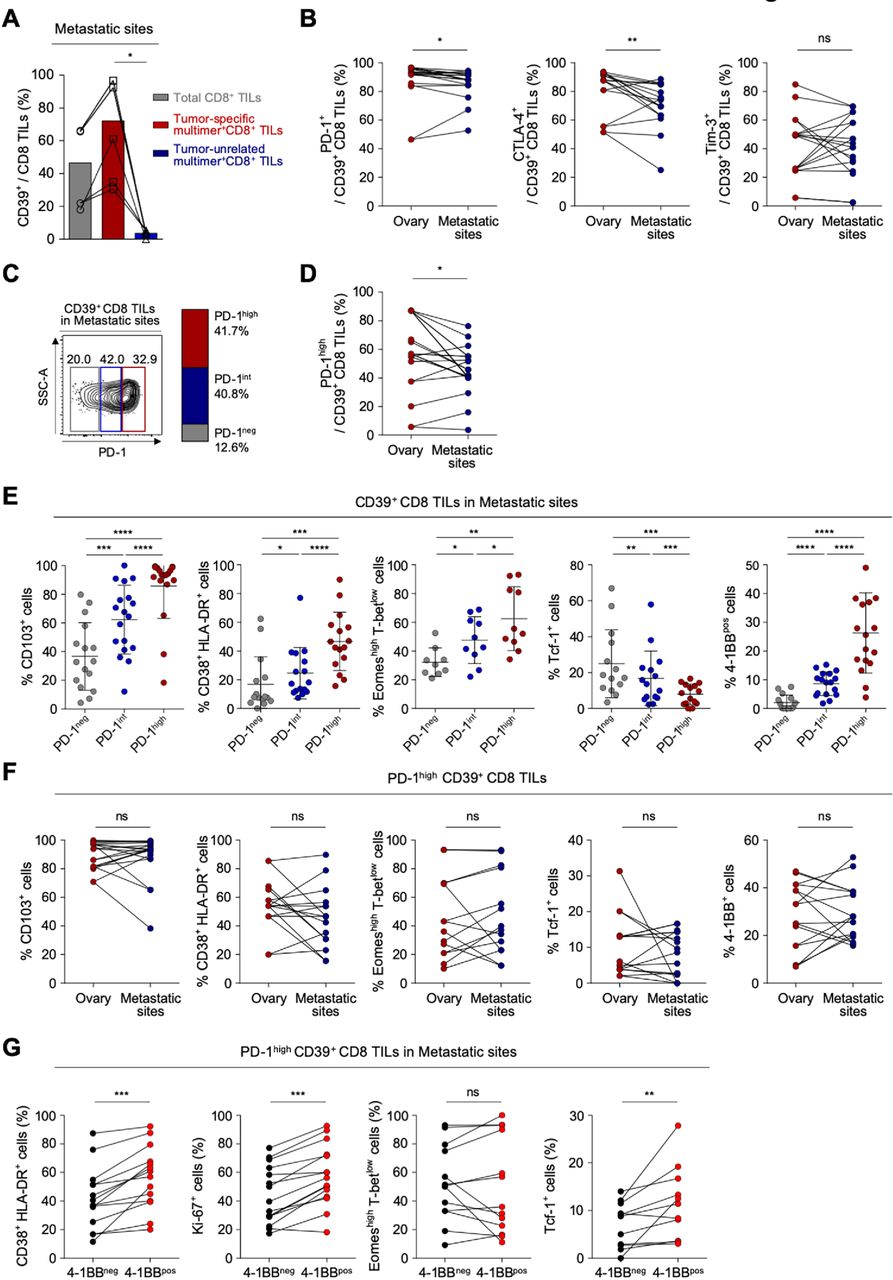
CD39+ CD8 tumor-infiltrating lymphocytes (TILs) from metastatic sites exhibit severe T-cell exhaustion features similar to the primary site. (A) Pairwise comparisons of CD39 expression among total CD8 TILs, tumor-specific multimer+ CD8 TILs and tumor-unrelated virus-specific multimer+ CD8 TILs from metastatic sites. (B) Programmed cell death protein 1 (PD-1), cytotoxic T-lymphocyte-associated protein 4 (CTLA-4) and Tim-3 expression on CD39+ CD8 TILs, compared between the ovary and metastatic sites. (C) CD39+ CD8 TILs from metastatic sites were divided into PD-1neg, PD-1int and PD-1high subpopulations according to differential expression of PD-1. On the left, a representative flow cytometry contour plot shows three subpopulations: gray box for PD-1neg, blue box for PD-1int and red box for PD-1high subpopulation. On the right, the bar shows the overall average percentages of each subpopulation among total patients. (D) Frequency of the PD-1high subpopulation compared between the ovary and metastatic sites. (E) Percentages of CD103+, CD38+ HLA-DR+, Eomeshigh T-betlow, Tcf-1+ and 4-1BB+ cells among CD39+ CD8 TILs, compared among subpopulations. (F) Percentages of CD103+, CD38+ HLA-DR+, Eomeshigh T-betlow, Tcf-1+ and 4-1BB+ cells among PD-1high CD39+ CD8 TILs from the ovary and from metastatic sites. (G) Percentages of CD38+ HLA-DR+, Ki-67+, Eomeshigh T-betlow and Tcf-1+ cells among PD-1high CD39+ CD8 TILs from metastatic sites, directly compared between 4-1BBneg cells and 4-1BBpos cells. Graphs indicate the mean and SD. *P<0.05; **p<0.01; ***p<0.001; ****p<0.0001; ns, not significant.
For the detailed characterization of CD39+ CD8 TILs from metastatic sites, CD39+ CD8 TILs were subdivided by PD-1 expression level (figure 4C). Compared with CD39+ CD8 TILs from primary sites, those from metastatic sites exhibited a slightly lower percentage of PD-1high cells (41.7% vs 54.7%), and slightly higher percentage of PD-1int cells (40.2% vs 30.4%) (figure 4D, online supplemental figure S8). The frequency of PD-1neg cells did not significantly differ between CD39+ CD8 TILs from primary versus metastatic sites. These results indicated that although CD39+ CD8 TILs from primary and metastatic sites showed similar frequencies of PD-1+ cells, the PD-1 expression level was slightly higher at primary versus metastatic sites. As found at primary sites, higher PD-1 expression was associated with higher frequencies of CD103+, CD38+ HLA-DR+, Eomeshigh T-betlow and 4-1BB+ cells, and with a lower frequency of Tcf-1+ cells (figure 4E).
We then compared features of T-cell exhaustion and activation between primary and metastatic sites. As shown in figure 4F, PD-1high CD39+ CD8 TILs from metastatic sites expressed similar levels of CD103, representing tumor reactivity; exhibited a similar frequency of CD38+ HLA-DR+ cells; similar frequencies of Eomeshigh T-betlow cells and Tcf-1+ cells and similar frequencies of 4-1BB+ cells (figure 4F). These findings suggest that PD-1high CD39+ CD8 TILs showed similar characteristics in terms of T-cell exhaustion and activation between the primary and metastatic sites. As found at primary sites, among PD-1high CD39+ CD8 TILs from metastatic sites, the 4-1BBpos cells displayed immunophenotypes indicating higher degrees of T-cell activation and proliferation, and less exhaustion, compared with 4-1BBneg cells (figure 4G).
4-1BB is highly enriched in PD-1high CD39+ CD103+ CD8 TILs
We further investigated CD8 TILs from the original and metastatic sites to determine which subpopulation was most enriched with 4-1BB+ cells. Combined t-distributed stochastic neighbor embedding (t-SNE) analysis of paired CD8 TILs from primary and metastatic sites (22 samples) revealed 16 different clusters, which were further grouped into 10 distinctive subpopulations based on differential expression of PD-1, CD39 and CD103 (figure 5A–B). Among these 10 distinct subpopulations, we found that the PD-1high CD39+ CD103+ subpopulation exhibited the highest proportion of 4-1BB+ cells (figure 5C), as well as the highest proportions of CTLA-4+ cells and Tim-3+ cells (figure 5D). We further confirmed that the highest proportion of 4-1BB+ cells was observed in PD-1high CD39+ CD103+ subpopulation from both primary sites and metastatic sites (figure 5E). Analysis of PBMCs revealed that most CD8 T cells were PD-1int CD39– CD103– or PD-1neg CD39– CD103– (online supplemental figure S9).
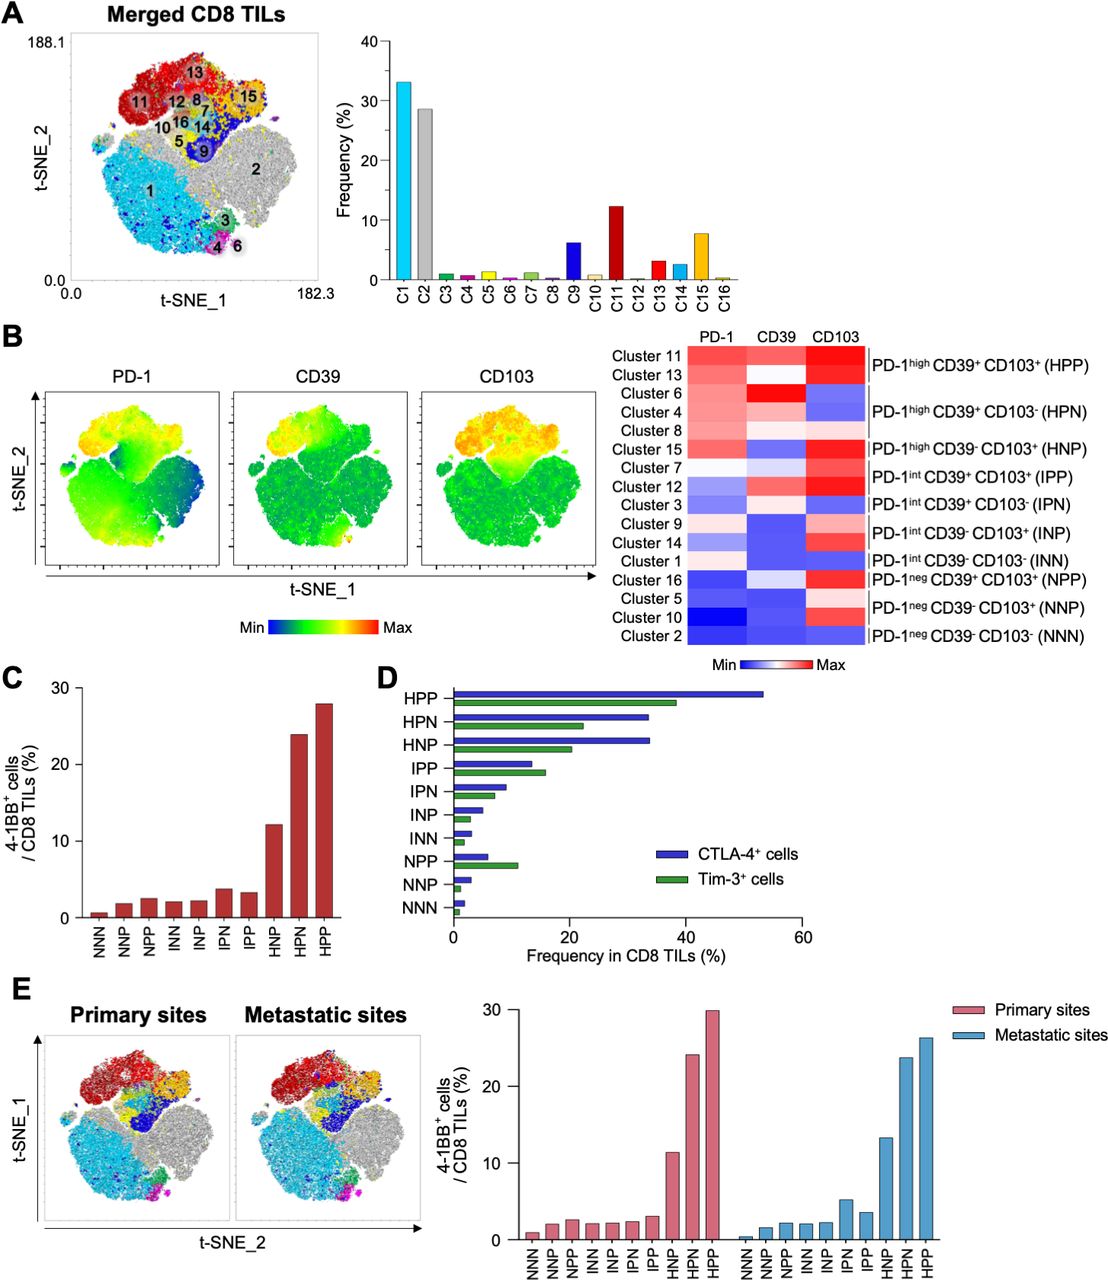
Combined t-SNE analysis of CD8 tumor-infiltrating lymphocytes (TILs) from primary and metastatic sites. (A) Combined t-SNE analysis was performed using 22 paired samples. Left panel, a t-SNE plot shows 16 different clusters. Right panel, the frequencies of each cluster. (B) Sixteen clusters were further grouped into 10 distinctive clusters based on the expression of programmed cell death protein 1 (PD-1), CD39 and CD103. Left panel, t-SNE plots show differential expression of PD-1, CD39 and CD103. Right panel, heatmap. (C) Percentages of 4-1BB+ cells in the 10 distinctive clusters. (D) Frequencies of cytotoxic T-lymphocyte-associated protein 4 (CTLA-4)+ (blue bars) and Tim-3+ (green bars) cells in the 10 distinctive clusters. (E) Left panel, t-SNE analysis performed separately for CD8 TILs from primary and metastatic sites. Right panel, percentages of 4-1BB+ cells in 10 distinctive clusters analyzed separately for primary sites (red bars) and metastatic sites (blue bars). NNN; PD-1neg CD39– CD103–, NNP; PD-1neg CD39– CD103+, NPP; PD-1neg CD39+ CD103+, INN; PD-1int CD39– CD103–, INP; PD-1int CD39– CD103+, IPN; PD-1int CD39+ CD103–, IPP; PD-1int CD39+ CD103+, HNP; PD-1high CD39– CD103+, HPN; PD-1high CD39+ CD103–, HPP; PD-1high CD39+ CD103+.
4-1BB co-stimulation further enhances anti-PD-1-mediated reinvigoration of exhausted CD8 TILs
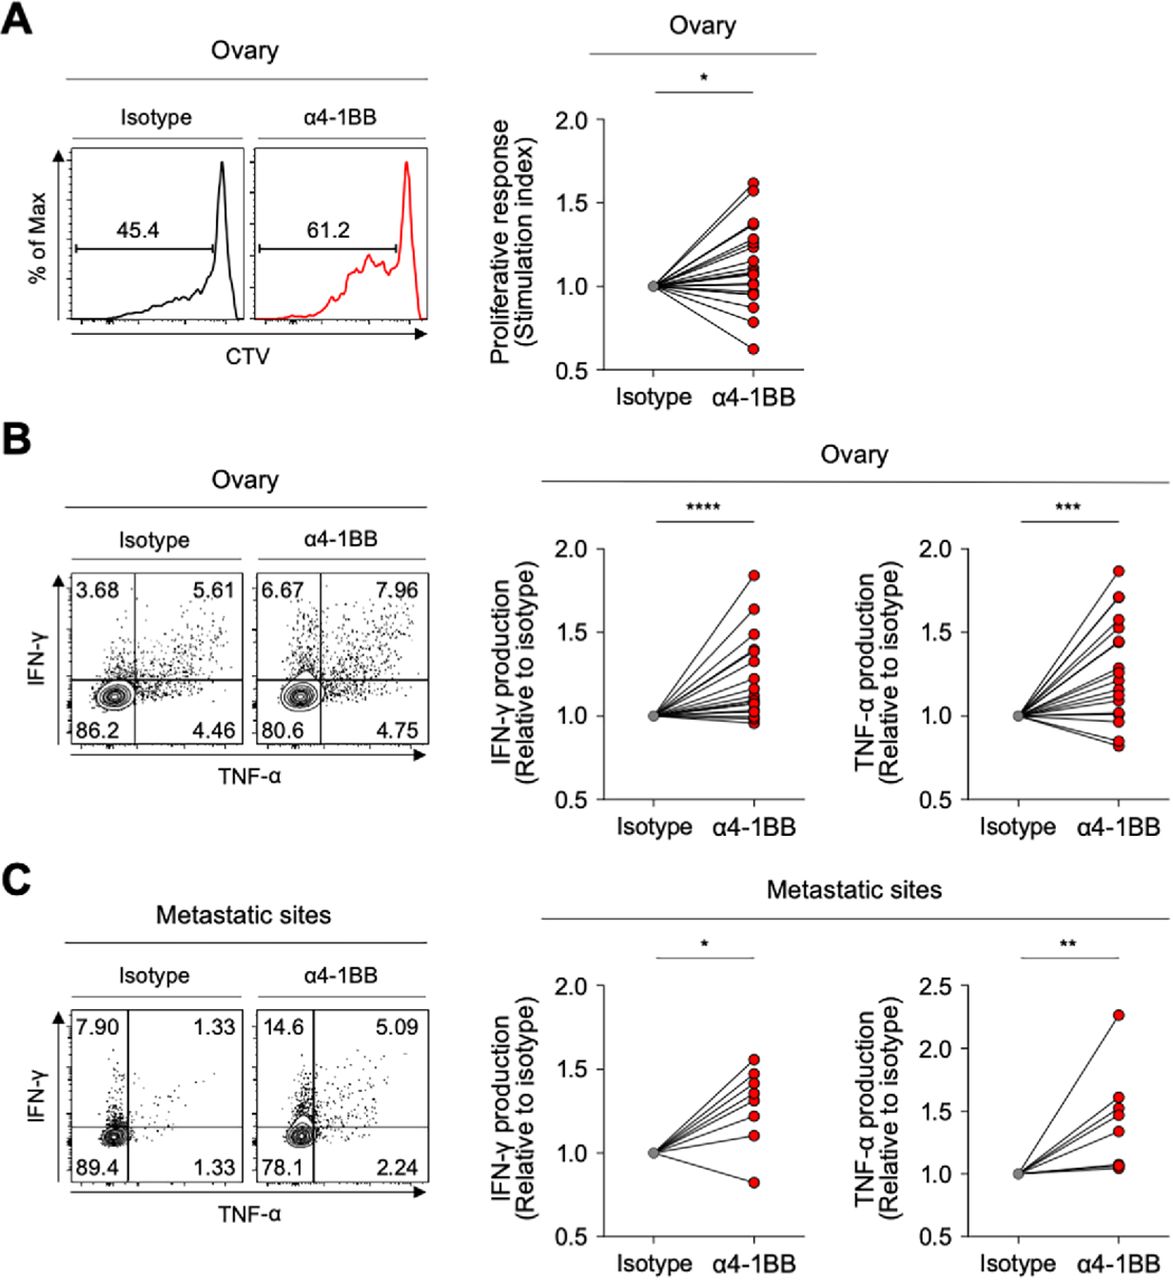
Although the PD-1high subpopulation of CD39+ CD8 TILs showed the features of terminally exhausted T cells, a significant portion expressed 4-1BB—suggesting that they may retain higher proliferative and reinvigoration potential. Therefore, we investigated whether anti-4-1BB agonistic antibodies could enhance the function of exhausted CD8 TILs in ovarian cancers. The ex vivo T-cell functional restoration assay revealed that 4-1BB co-stimulation with agonistic antibodies significantly enhanced CD8 TIL proliferation indicated by the SI (figure 6A), as CD8 TIL production of IFN-γ and TNF-α (figure 6B). Interestingly, anti-4-1BB treatment also significantly enhanced the function of CD8 TILs from metastatic sites (figure 6C), suggesting that anti-4-1BB treatment may be effective at both primary and metastatic sites.

4-1BB agonistic antibodies enhanced the function of exhausted CD8 tumor-infiltrating lymphocytes (TILs). (A) Efficacy of 4-1BB co-stimulation with anti-CD3 stimulation in terms of CD8 TIL proliferation. In the presence of anti-CD3 antibodies, we analyzed the frequency of CTVlow CD8 TILs (proliferated CD8 TILs) in the presence of isotype or anti-4-1BB agonistic antibodies. Representative flow cytometry plots are shown on the left, and data are presented as the stimulation index. (B–C) Effects of 4-1BB co-stimulation were also assessed in terms of cytokine production, representing functional capacity. Interferon (IFN)-γ and tumor necrosis factor (TNF)-α production in CD8 TILs was measured by intracellular staining. Representative flow cytometry plots are shown on the left, and data are presented as the relative ratio to the isotype-treated group, separately for cells from the ovary (B) and metastatic sites (C). *P<0.05; **p<0.01; ***p<0.001; ****p<0.0001.
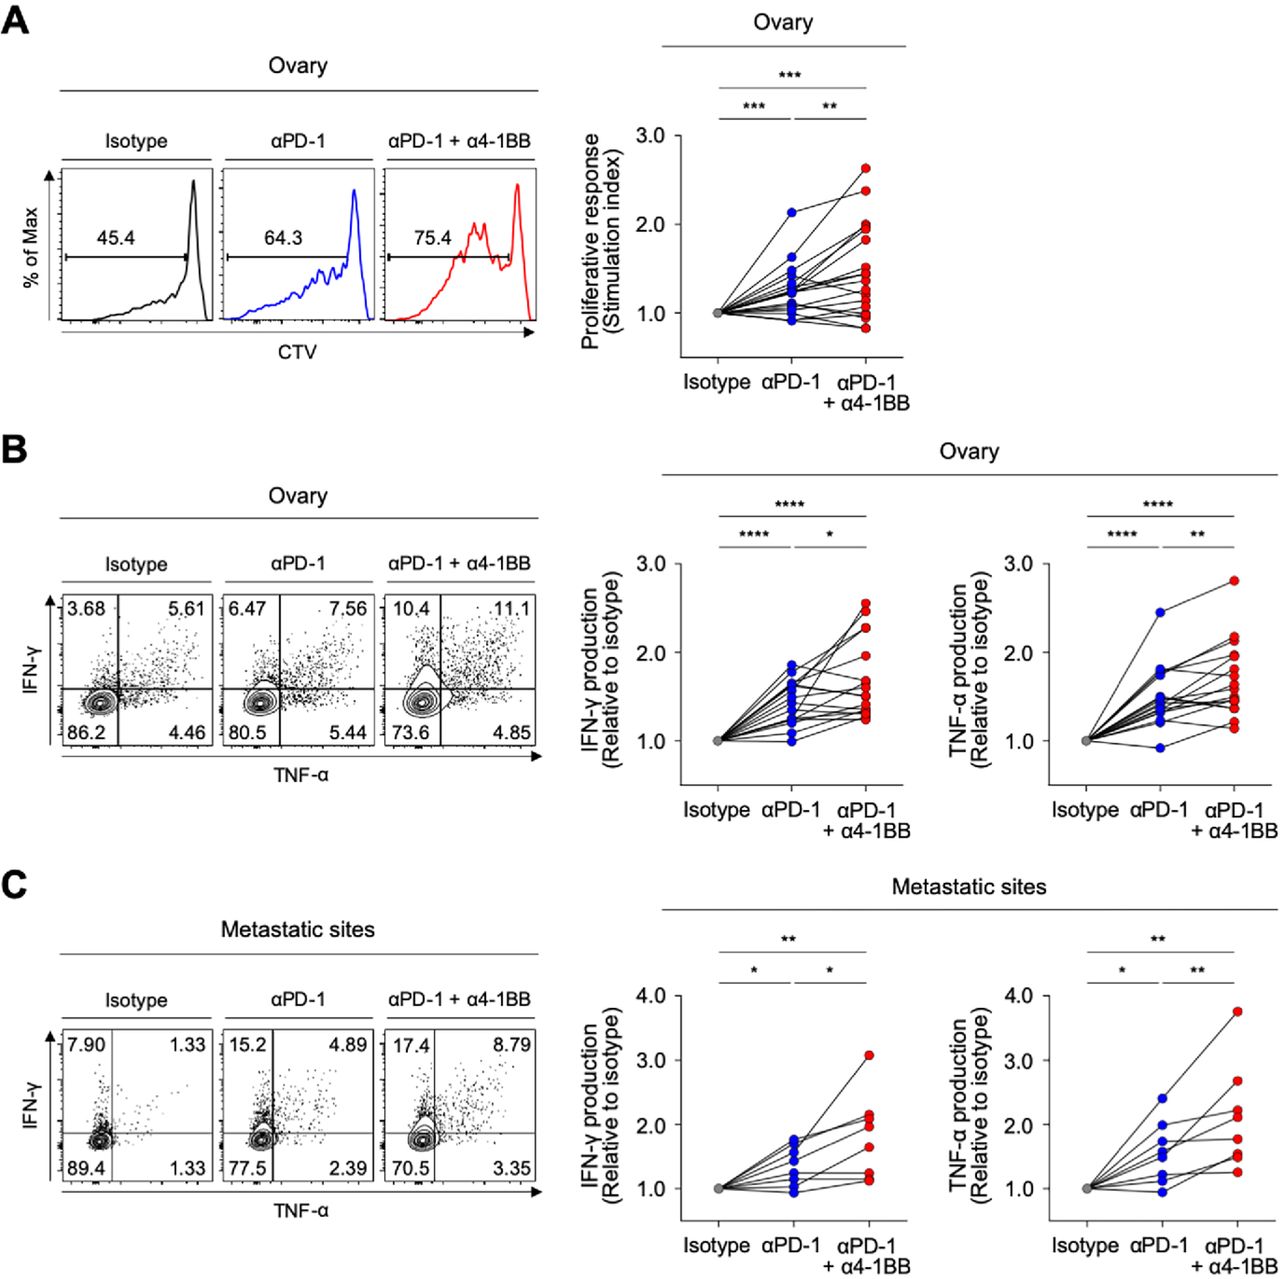
Recent clinical trials of anti-PD-1 therapy in patients with ovarian cancer suggest that the therapeutic efficacy must be improved.14 Therefore, we lastly examined whether 4-1BB co-stimulation with agonistic antibodies could further enhance anti-PD-1-mediated T-cell reinvigoration. Compared with single PD-1 blockade, the combination of PD-1 blockade plus 4-1BB co-stimulation with agonistic antibodies further enhanced the proliferative response of CD8 TILs (figure 7A), as well as the capacity of CD8 TILs to produce IFN-γ and TNF-α (figure 7B). Notably, 4-1BB co-stimulation further enhanced the anti-PD-1-mediated reinvigoration of exhausted CD8 TILs from both metastatic sites and primary sites (figure 7B and C).

4-1BB co-stimulation further enhances antiprogrammed cell death protein 1 (anti-PD-1)-mediated reinvigoration of exhausted CD8 tumor-infiltrating lymphocytes (TILs) from the ovary and metastatic sites. (A) In the presence of anti-CD3 antibodies, we analyzed the frequency of CTVlow CD8 TILs (proliferated CD8 TILs) in the presence of isotype or anti-PD-1 blocking antibodies, or a combination of anti-PD-1 blocking antibodies and anti-4-1BB agonistic antibodies. Representative flow cytometry plots are shown to the left, and data are presented as the stimulation index. (B–C) We evaluated changes of the functional capacities of CD8 TILs after stimulation with antibodies by intracellular staining of cytokines (interferon (IFN)-γ and tumor necrosis factor (TNF)-α). We compared three different treatment groups: isotype-treated, anti-PD-1 blocking antibodies-treated and combined treatment with anti-PD-1 blocking antibodies and anti-4-1BB agonistic antibodies. Representative flow cytometry plots are shown to the left, and data are presented as the relative ratio to the isotype-treated group, separately for the ovary (B) and metastatic sites (C). *P<0.05; **p<0.01; ***p<0.001; ****p<0.0001.
Discussion
Although therapeutic approaches using ICIs have had breakthrough success in the treatment of some cancers, they exhibit limited efficacy in other cancer types, and many patients do not respond to these therapies. Overcoming the limitations of ICIs will require a better understanding of T-cell exhaustion in the tumor microenvironment (TME).
In the present study, we found that CD39+ CD8 TILs were enriched with tumor-specific CD8 TILs, and we examined the characteristics of subpopulations of these cells according to PD-1 expression level. Our results showed that PD-1high CD39+ CD8 TILs were highly activated and terminally exhausted. Among various co-stimulatory receptors, 4-1BB was exclusively expressed in PD-1high CD39+ CD8 TILs, and these 4-1BB-expressing cells showed a distinctive status of activation and exhaustion. We additionally analyzed the characteristics of CD39+ CD8 TILs from metastatic sites in terms of T-cell exhaustion, and discovered that these cells were equally highly exhausted like CD39+ CD8 TILs from the primary site. Additionally, 4-1BB expression among PD-1high CD39+ CD8 TILs was similar between the metastatic and primary sites. Importantly, experiments with anti-4-1BB agonistic antibodies demonstrated the therapeutic potential of antibodies targeting 4-1BB for reinvigoration of exhausted CD8 TILs at both the primary and metastatic sites.
Advanced-stage ovarian cancer has a 5-year survival rate of <30%, and is the fifth leading cause of female cancer mortality.1 The response rate of ovarian cancer to anti-PD-1 immunotherapy has been <20%,11–14 and only limited studies have examined CD8 TILs, that is, the major target of current immunotherapy. Several studies have attempted to identify new targets for immunotherapy by examining the surface markers of CD8 TILs; however, the abundance of tumor-unrelated bystander CD8 TILs in tumor tissues41 42 makes it difficult to conduct an efficient study without first identifying tumor-specific CD8 TILs.
In the present study, we first searched for a surrogate marker to define tumor-specific CD8 TILs in patients with ovarian cancer, and we found that CD39+ CD8 TILs were highly enriched with tumor-specific CD8 TILs. Among CD39+ CD8 TILs, we found that PD-1high cells represented tumor-reactive cells that had lost Tcf-1 expression, indicating that this cell population would not be affected by anti-PD-1 blocking antibodies, and required additional treatment for restoration. TNFRSF members have been spotlighted as new targets for immunotherapy,49 52 53 and we found that 4-1BB was prominently expressed in the PD-1high CD39+ CD8 TIL subpopulation. Moreover, an ex vivo T-cell restoration assay revealed that 4-1BB co-stimulation with agonistic antibodies further enhanced anti-PD-1-mediated reinvigoration of exhausted CD8 TILs from patients with metastatic ovarian cancers. Overall, these findings highlight the importance of a detailed characterization of the heterogeneity within the tumor-specific exhausted tumor-infiltrating CD8 T-cell population in patients with ovarian cancer. Moreover, our results indicated that 4-1BB co-stimulation in conjunction with anti-PD-1 therapy may be a potent therapeutic option.
To our knowledge, this study is the first to analyze distinct characteristics of tumor-specific exhausted CD8 TILs. Several previous studies have shown genetically distinctive characteristics of cancer cells from metastatic sites compared with those from the primary tumor sites, as well as differences between these tumor immune microenvironments.23 26 54 However, no prior investigation has included a detailed comparison of the characteristics of tumor-specific CD8 TILs between the primary and metastatic sites. Some studies have focused on the differences in CD8 TILs between the primary and metastatic sites, but have only shown differences in the degree of CD8 infiltration, or in the CD8/CD3 ratio among infiltrating lymphocytes.55 56 Due to our insufficient knowledge regarding CD8 TILs at metastatic sites, current clinical or laboratory use of immunotherapy has been based on the assumption that the immunological characteristics of exhausted CD8 TILs would be similar between the metastatic and primary sites—and that if there was a difference, the CD8 TILs in metastatic sites would be less exhausted than those in the primary sites. Notably, our present results suggested that CD39+ CD8 TILs from the metastatic sites and primary sites of ovarian cancer exhibited similar exhaustion status, although the CD39+ CD8 TILs from metastatic sites were slightly less activated than those from the primary sites.
Our present dataset of CD8 T cells from peripheral blood, primary sites and metastatic sites in cases of metastatic ovarian cancers was the most complete reported to date. Therefore, we endeavored to define the phenotypic characteristics of tumor-reactive CD8 TILs at primary and metastatic sites by comparing previously reported surrogate markers that represent tumor-reactive T cells, including PD-1high,57 CD3943 and CD103.58 We found that at both the primary and metastatic sites, PD-1high CD39+ CD103+ CD8 TILs exhibited the highest proportions of 4-1BB+, CTLA-4+ and Tim-3+ cells (figure 5C), which have been regarded as tumor-reactive CD8 T cells across multiple cancer types.59–61 The PD-1high CD39+ CD103– subpopulation also exhibited a high proportion of 4-1BB+ cells; however, we found a low frequency of the PD-1high CD39+ CD103– subpopulation itself among total CD8 TILs. Our results provide a deeper understanding of tumor-reactive CD8 T cells in advanced cancers with metastatic lesions, particularly metastatic ovarian cancers.
Our present results demonstrated that 4-1BB co-stimulation promoted the functional enhancement of CD8 TILs from both the primary tumor sites and the metastatic sites of patients with ovarian cancer. We performed a T-cell restoration assay by using anti-PD-1 blocking antibodies and anti-4-1BB agonistic antibodies to stimulate single-cell suspensions from ovarian cancer tissues. This assay has the advantage of showing how the antibodies work in complex tumor microenvironments, and has the limitation of not revealing how individual cell populations respond to the antibodies. Previous studies have shown that in the tumor microenvironment, anti-4-1BB agonistic antibodies can enhance the NF-κB signaling pathway in dendritic cells62 or reprogram tumor-induced regulatory T cells into cytotoxic CD4+ T cells.63 Based on previous findings, we can infer that the presently demonstrated effects of 4-1BB agonistic antibodies in reinvigorating exhausted CD8 TILs were likely caused by direct stimulation of CD8 TILs and by the stimulation of other immune cells (eg, dendritic cells and regulatory T cells), which could result in the indirect reinvigoration of CD8 TILs.
Our present study is the first to delineate the characteristics of tumor-specific CD8 T cells from the primary tumor site and metastatic sites from patients with metastatic ovarian cancer. Additional research is needed to further investigate the distinct characteristics of other immune cells, such as CD4+ T cells and regulatory T cells, in the TME of metastatic sites in ovarian cancers. Our current results provide insights that may guide the design of immunotherapy involving 4-1BB co-stimulation for metastatic ovarian cancers. Although concerns have been raised regarding hepatotoxicity of the 4-1BB agonist urelumab, this problem can likely be overcome with urelumab dose adjustment64 or by using novel agents with tumor-specific properties.52 65–67
Conventional chemotherapy can modulate the composition and functionality of tumor-infiltrating immune cells either directly68 or indirectly by inducing the immunogenic cell death of tumor cells.69 Therefore, we excluded patients treated with neo-adjuvant chemotherapy, and evaluated the tumor-specific CD8 TILs of the primary and metastatic sites on diagnosis, given that the immune context at the time of diagnosis is sufficient to predict the prognosis and treatment outcomes.70–73 However, patients treated with neo-adjuvant chemotherapy are usually those exhibiting severe dissemination in an advanced stage. Therefore, one limitation of our study is that the exclusion of these patients may have led to an insufficient analysis of patients with advanced-stage disease or with potentially immunologically different microenvironments. We think that the enrollment of 26 patients with stage IV ovarian cancers in this study should enable delineation of the immunological characteristics of CD8 TILs in patients with advanced ovarian cancer. However, it will be important to conduct further comprehensive studies to examine the changes and distinct characteristics of immune cells between the primary and metastatic sites before and after the administration of neo-adjuvant chemotherapy.
In conclusion, the present results suggest that 4-1BB expression among severely exhausted PD-1high CD8 TILs identified a further activated and less exhausted subpopulation, which may represent a primary target for ICI-based immunotherapy. Additionally, targeting 4-1BB together with anti-PD-1 blocking antibodies could be a promising strategy for improving the poor responses to immunotherapy in metastatic ovarian cancer. Future clinical studies are warranted to evaluate the efficacy of 4-1BB agonists in patients with ovarian cancer.
Conclusion
Our study suggests that severely exhausted PD-1high CD39+ CD8 TILs showed similar characteristics in terms of T-cell exhaustion and activation between the primary and metastatic sites of ovarian cancers and PD-1high CD39+ CD8 TILs displayed a distinctly heterogeneous exhaustion and activation status determined by differential 4-1BB expression. Moreover, 4-1BB co-stimulation further enhanced the anti-PD1-mediated reinvigoration of CD8 TILs. This study provides insights for improving the poor responses to immunotherapy in metastatic ovarian cancer.
Acknowledgments
The authors would like to thank Sukyung Nam (KAIST) and Yuji Ko (KAIST) for RNA-seq library construction and sequencing.
References
Supplementary materials
Supplementary Data
This web only file has been produced by the BMJ Publishing Group from an electronic file supplied by the author(s) and has not been edited for content.
Footnotes
Contributors Conception and design: GL, JP, E-CS, JYL and S-HP. Financial support: JYL and S-HP. Provision of study materials or patients: GL, JP, MJ, E-SK, SWK, YJL, SK and JYL. Collection and assembly of data: GL, JP, MJ, E-SK, SWK, YJL, SJC, BC, SP, YSJ, IJ, SK, JYL and S-HPk. Data analysis and interpretation: GL, JP, JYL and S-HP. Manuscript writing; GL, JP, JYL and S-HP. All authors read and approved the final manuscript.
Funding This work was supported by the National Research Foundation of Korea (NRF) grant funded by the Korea government (MSIT) (NRF-2019R1A2C2005176 to S-HP) and by the Bio & Medical Technology Development Program of the National Research Foundation (NRF) funded by the Ministry of Science, ICT & Future Planning (2017M3A9E8029714 to JYL).
Competing interests None declared.
Patient consent for publication Not required.
Ethics approval This study was approved by the Institutional Review Board of the Yonsei University Medical Center (number 4-2018-0173), and all patients gave their written informed consent.
Provenance and peer review Not commissioned; externally peer reviewed.
Data availability statement Data are available on reasonable request. RNA sequencing data are uploaded on Gene Expression Omnibus (GEO) database. GEO accession number is GSE160705. All other data that support the findings of this study are available from the corresponding author S-HP on reasonable request.
Supplemental material This content has been supplied by the author(s). It has not been vetted by BMJ Publishing Group Limited (BMJ) and may not have been peer-reviewed. Any opinions or recommendations discussed are solely those of the author(s) and are not endorsed by BMJ. BMJ disclaims all liability and responsibility arising from any reliance placed on the content. Where the content includes any translated material, BMJ does not warrant the accuracy and reliability of the translations (including but not limited to local regulations, clinical guidelines, terminology, drug names and drug dosages), and is not responsible for any error and/or omissions arising from translation and adaptation or otherwise.