Article Text

Abstract
Background To evaluate the safety, tolerability, pharmacokinetics and pharmacodynamics of eftilagimod alpha (efti), a soluble lymphocyte activation gene-3 protein, in combination with the programmed cell death-1 (PD-1) antagonist pembrolizumab.
Methods The study was divided into two parts; parts A and B, where part A was the dose escalation part and part B was an extension part of the study. Patients with metastatic melanoma were treated with efti plus the standard dose of pembrolizumab. Blood samples were assayed to determine plasma pharmacokinetic parameters, detect efti antibody formation and determine long-lived CD8 T cell responses and associated pharmacodynamic parameters.
Results Twenty-four patients with melanoma received pembrolizumab and bi-weekly subcutaneous (s.c.) injections of efti at doses 1 mg, 6 mg or 30 mg/injection for up to 6 months (part A) or 30 mg/injection for up 12 months (part B). No dose-limiting toxicities were reported and the main adverse event for efti was injection site reactions. Sustained systemic exposure to the product was obtained in all patients following s.c. injections of 30 mg dose. Treatment induced an increase in activated CD8 and CD4 T cell counts, and in some of the soluble biomarkers, particularly interferon (IFN)-γ, a Th1 signature cytokine. An overall response rate (ORR) of 33% was observed in patients partly with pembrolizumab-refractory of part A and ORR of 50% was observed in patients with PD-1 naïve of part B.
Conclusions Efti was well tolerated in combination with pembrolizumab with encouraging antitumor activity. This warrants further clinical studies of this new combination therapy combining an antigen-presenting cell activator with an immune checkpoint inhibitor.
- immunotherapy
- active
- dendritic cells
- CD8-positive T-lymphocytes
- programmed cell death 1 receptor
This is an open access article distributed in accordance with the Creative Commons Attribution Non Commercial (CC BY-NC 4.0) license, which permits others to distribute, remix, adapt, build upon this work non-commercially, and license their derivative works on different terms, provided the original work is properly cited, appropriate credit is given, any changes made indicated, and the use is non-commercial. See http://creativecommons.org/licenses/by-nc/4.0/.
Statistics from Altmetric.com
Introduction
Antigen-presenting cell (APC) activators are a type of immunotherapy that leverages APC to drive an adaptive immune response. Combinatorial approaches that target multiple aspects of the cancer immunity cycle,1 including APC activation, are promising strategies for the treatment of cancer. Professional APCs express major histocompatibility complex (MHC) class II and CD40 molecules as surface receptors and can be activated through direct interactions with T cells expressing these receptors’ corresponding ligands, lymphocyte activation gene-3 (LAG-3) and CD40-L, respectively. A third class of receptors that can activate APCs are called toll-like receptors (TLRs) and bind foreign ligands that are structurally conserved molecules from microbes. Interest in the clinical use of TLR and CD40 agonistic antibodies in immuno-oncology wavered in the past decade,2 but recent clinical data are encouraging.3–5
The MHC class II agonist eftilagimod alpha (efti, IMP321 or LAG-3Ig) is a soluble LAG-3 protein that activates APC leading to CD8 T-cell activation.6–8 Efti binds to a subset of MHC class II molecules expressed in plasma membrane lipid rafts on immature human dendritic cells (DCs) and induces rapid morphological changes, including the formation of dendritic projections.6 7 It also markedly upregulates the expression of costimulatory molecules and the production of IL-12 and tumor necrosis factor (TNF)-α.6 7 In patients with cancer, efti has been shown to sustain the generation and expansion of tumor antigen (melan-A/melanoma antigen recognized by T cells 1 (MART-1) and survivin)-specific CD8+ T lymphocytes in peripheral blood mononuclear cells (PBMC), showing its ability to boost CD8+ T cell memory response ex vivo.9 Phenotype and cytokines/chemokines produced by APC of PBMC exposed ex vivo for 2 days to peptide and efti indicate that the LAG-3-mediated effect depends on a direct activation of circulating APCs.9
The addition of pembrolizumab as an immune checkpoint inhibitor (ICI) aims at enhancing activity by combining efti’s activating effects on immune cells with the release of immune inhibitory effects caused by interruption of the programmed death-1 (PD-1)/programmed death ligand-1 axis. The present TACTI-mel (“Two ACTive Immunotherapies in melanoma”) phase I trial is testing this combined push (systemic APC activation) and pull (ICI) approach in metastatic melanoma. This therapeutic approach is fundamentally different from the mainstream two-ICI approach (ie, anti-LAG-3+anti-PD-1 monoclonal antibody (mAbs)) as efti is an agonist acting on APC and anti-LAG-3 mAb is an antagonist acting on T cells, see figure 1.

Effect of efti versus an anti-LAG-3 antagonist antibody on the immune response. LAG-3, lymphocyte activation gene-3.
Materials and methods
Study design and treatments
This was a multicenter, open-label, dose escalation, phase I study in patients with unresectable or metastatic melanoma receiving efti in combination with anti-PD-1 therapy with pembrolizumab.
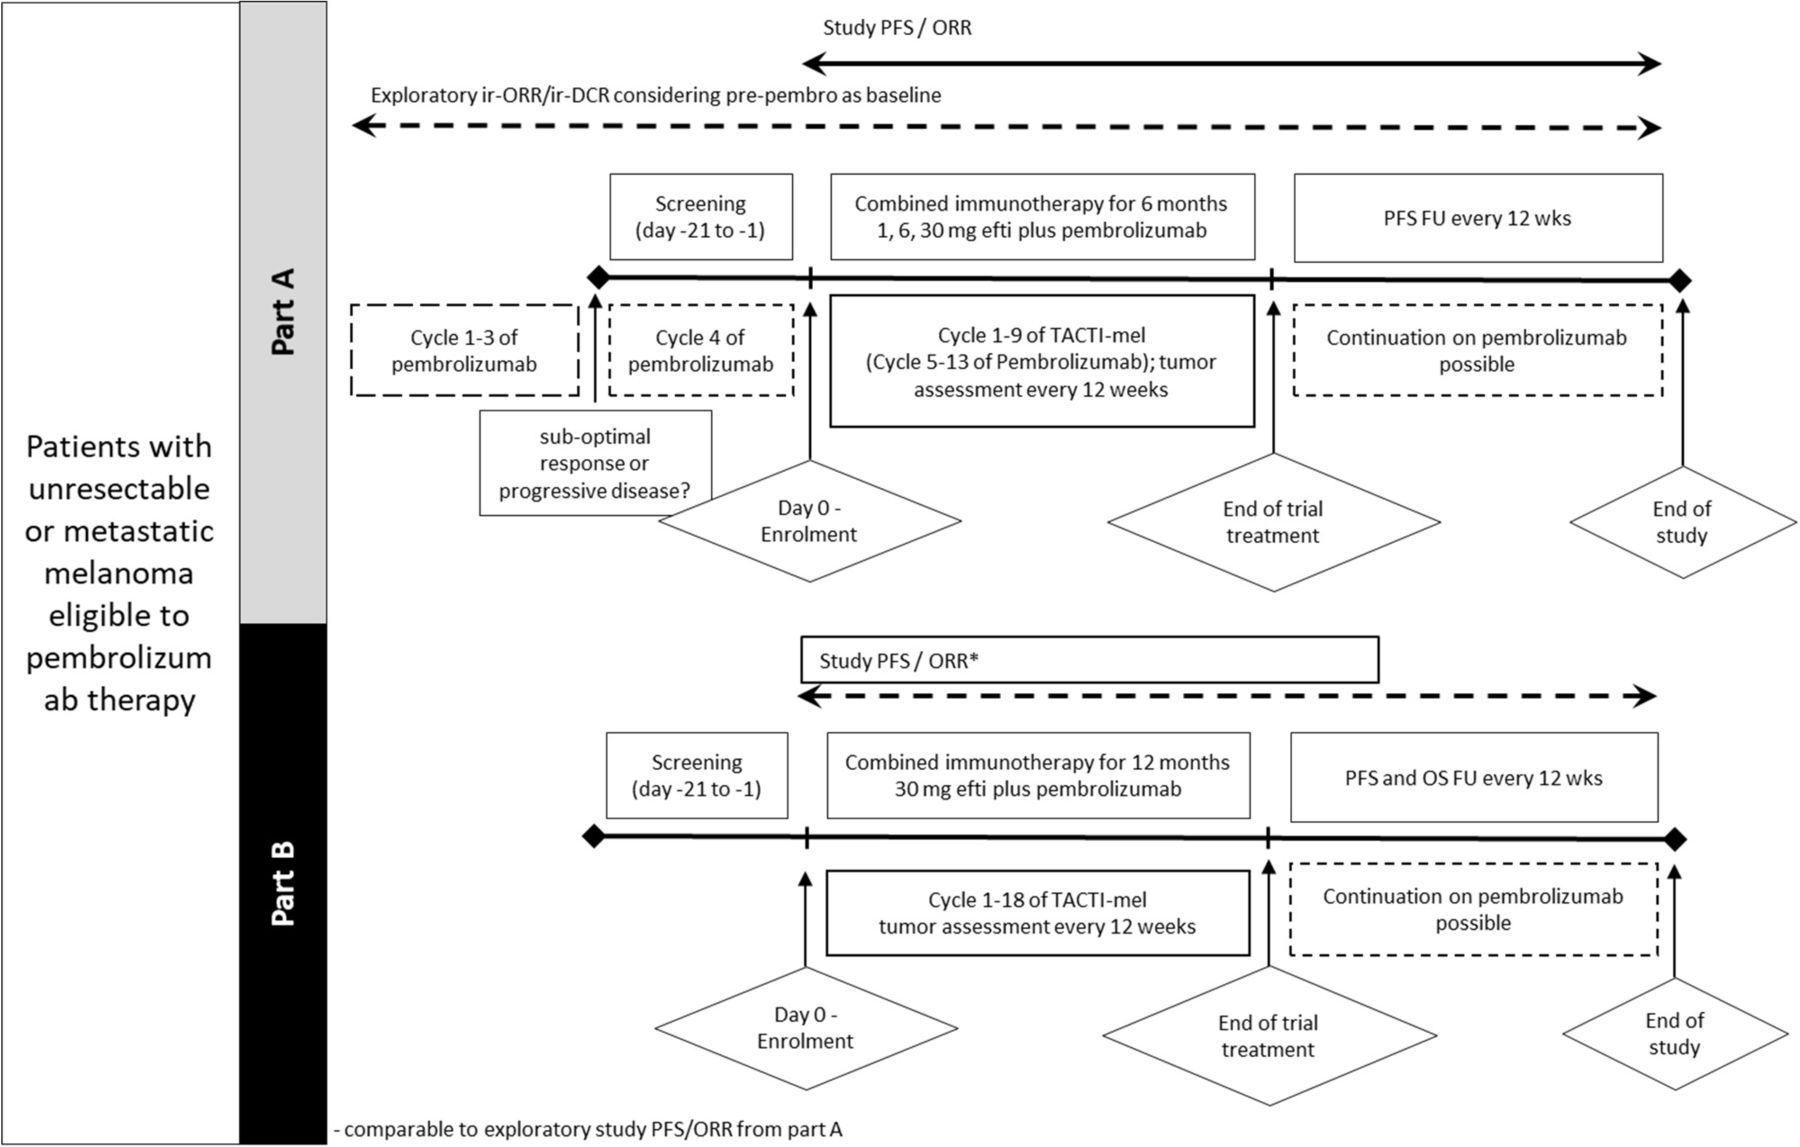
In part A, screening was done in parallel to cycle 4 of actively ongoing pembrolizumab therapy and treatment with efti was started with cycle 5 of pembrolizumab. Pembrolizumab was given at a dose of 2 mg/kg intravenous every 3 weeks; efti was given as subcutaneous (s.c.) injection of 1 mg (cohort 1), 6 mg (cohort 2) or 30 mg (cohort 3) every 2 weeks for approximately 6 months, starting with cycle 5 of pembrolizumab. The study design for part A is shown in figure 2.

Study design of parts A and B. Tumor assessment was done every 12 weeks in both parts. Pembrolizumab could be continued after combination therapy with efti was finished. Pembrolizumab was administered intravenous 2 mg/kg. efti was administered s.c. Part A (top): patients with irPD or suboptimal response (ie, irSD or PR) after 3 cycles of pembrolizumab were screened during cycle 4 of pembrolizumab therapy. Eligible patients received efti (1, 6, 30 mg) with cycle 5 of pembrolizumab for up to 6 months. Part B (bottom): patients received efti (30 mg) with cycle 1 of pembrolizumab for up to 12 months. ORR, overall response rate; PFS, progression-free survival; TACTI, Two ACTive Immunotherapies.
Three sequential dose escalation cohorts of six patients each were evaluated for dose-limiting toxicities (DLTs) according to Common Terminology Criteria for Adverse Events (CTCAE) V.4.03. The evaluation for DLTs was performed in the safety observation period (from the first study treatment until 24 hours after the third efti injection). Decisions for dose escalation and determination of the recommended dose for part B were based on all safety data collected during the safety observation period and made by the Data and Safety Monitoring Board.
In part B, patients received pembrolizumab (2 mg/kg intravenous every 3 weeks) in conjunction with efti s.c. at the recommended dose of 30 mg every 2 weeks for a maximum of 12 months, starting with cycle 1 of pembrolizumab treatment. Patients were also evaluated for DLTs according to CTCAE V.4.03.
Study assessments
The primary objective of the study was to evaluate the safety, tolerability and recommended phase two doseof efti when combined with anti-PD-1 treatment starting with cycle 5 (part A) or cycle 1 (part B) of pembrolizumab. The primary endpoint was safety as defined by the frequency, severity and duration of adverse events (AEs) including serious AEs (SAEs) and DLTs and other safety parameters.
Tumor response and progression were assessed using immune-related response criteria (irRC) and Response Evaluation Criteria in Solid Tumors (RECIST V.1.1) with imaging studies done every 12 weeks. Blood samples were collected for analysis of plasma concentrations of efti and cytokines/chemokines and for detection of serum anti-efti antibodies. EDTA-whole blood samples were collected for monitoring the T cell immune responses.
Pharmacokinetic analysis
Pharmacokinetic analysis was performed using a validated method on plasma samples collected up to 48 hours post the 1st and 13th efti dosing in the dose escalation part. Efti concentration was assessed using an LAG-3-specific ELISA using a pair of mouse monoclonal anti-human LAG-3 antibodies, 11E3 and biotin-conjugated 17B4 as capture and detection reagent, respectively. The lower limit of quantification was determined at 105 pg/mL. Pharmacokinetic parameters were derived using noncompartmental analysis with Phoenix WinNonlin V.7.0 software (Certara).
Cytokines/chemokines assessment
Panels of 9 cytokines and 10 chemokines were assessed in plasma samples collected prior and 1, 2, 4, 8, 24 and 48 hours post the 1st and the 13th efti administration in part A patients. In outline, the analytical method consists of a validated multiplexed electrochemiluminescence immunosorbent assay (ECLIA) using commercial kits (human proinflammatory panel 1 and chemokines panel 1 V—plex MesoScale Discovery kits). Manufacturer instructions were followed with minor modifications and lower limits of quantification were determined at 6.1, 1.6, 5.3, 0.8, 0.7, 0.7, 0.5, 2.9, 7.5, 1.3, 7.5, 34.2, 3.5, 6.4, 9.8, 2.4, 3.7, 27.6, 8.2 pg/mL for interferon (IFN)-γ, IL-1β, IL-2, IL-4, IL-6, IL-8, IL-10, IL-12p70, IL-13, TNF-α, eotaxin, eotaxin-3, Thymus and activation-regulated chemokine (TARC), Interferon gamma-induced protein 10 (IP-10), Macrophage inflammatory protein (MIP)-1α, MIP-1β, Monocyte chemoattractant protein (MCP)-1, Macrophage-derived chemokine (MDC) and MCP-4, respectively.
Detection of anti-efti antibodies
Serum samples were planned pretreatment and at end of treatment visit for all patients. Additionally, patients participating to the part B of the study were sampled after about 1, 2, 3, 6 and 9 months at cycles 2, 3, 5, 9, 13 always predose. A fully validated three tiers conventional bridging ECLIA method with a screening assay (tier 1), a confirmatory assay (tier 2) and titration assay (tier 3) were used. Briefly, anti-efti antibodies were captured and detected in a sandwich formed by biotinylated and ruthenylated efti. Such complexes are then captured by a streptavidin-coated plate and processed for ECL signal detection. An affinity purified rabbit anti-LAG-3 polyclonal antibody was used as positive control. The sensitivity was determined at 78 ng/mL in a pooled serum matrix and confirmed at 250 ng/mL in 20 individual serum. The free drug tolerance was found to be approximately 500 ng/mL of free drug for 250 ng/mL of positive control. Thus, given the low level of circulating drug (<20 ng/mL), drug tolerance was acceptable for the intended purpose.
Pharmacodynamics
EDTA-whole blood samples were collected at cycle 1, cycle 5, cycle 9 and cycle 13 (in part B only) prior to treatment (therefore 2 weeks after the previous dosing) and EOT. Direct blood staining with BD Multitest CD8-FITC (clone SK1)/CD38-PE (clone HB7)/CD3-PerCP (clone SK7)/HLA-DR-APC (clone L343) was performed to enumerate ex vivo the absolute counts of activated T CD3+CD8+ or CD3+CD8- cells coexpressing HLA-DR and CD38 in BD Trucount tube with a lyse/no wash procedure, avoiding any bias induced by centrifugation steps. Cells were acquired on BD FACSCanto II flow cytometer. The paired nonparametric Wilcoxon-signed rank test was used to compare the immunomonitoring results obtained at the different time points to the pre-treatment baseline using JMP V.12 software.
In vitro antigenic T-cell response assessment
PBMCs from healthy donors (0.2×10⁶ cells/well in round-bottom 96-well plate, at 1×10⁶/mL in complete RPMI+10% fetal calf serum) incubated with a pool of peptides covering the sequence of cytomegalovirus (CMV) pp65 in triplicate (PepTivator CMV pp65 form Miltenyi Biotec), with or without efti and/or an antagonist anti-PD-1 antibody (clone EH12.1, BD Biosciences) as indicated in figure 2 legend in complete RPMI. After 2 days, cells and/or supernatant were collected and cytokines/chemokines were assessed by Cytometric Bead Array flex set (BD Biosciences) to measure concentrations of cytokines in the supernatant. In other series of experiments, PBMCs were stimulated as above and cells were collected to be stained with a mix of the following conjugated antibodies to determine expression of activation markers. Anti-CD14-APC (clone MφP9), Anti-CD4-PerCPCy5.5 (clone L200), anti-CD8-PE (clone RPA-T8), anti-CD25-PECy7 (clone M-251), anti-CD69-APCCy7 (clone FN50) were purchased from BD Biosciences. Antibody staining was performed at 4°C during 30 min in phosphate buffered saline (PBS), bovine serum albumine (BSA) 0.5%, azide 0.1%. Data were collected on a FACS Canto A and CD14−CD8+ and CD14−CD4+ gated populations were analyzed on DIVA software (BD Biosciences). Comparisons of combined cell treatment to treatment with single agents were analyzed by Student’s t-test.
Statistical analysis
Safety: Analyses of safety parameters were performed using descriptive statistics.
Efficacy: Assessments of tumor response were based on investigator assessment according to Guidelines for the Evaluation of Immune Therapy Activity in Solid Tumors: irRC/RECIST V.1.1. Analyses of tumor response endpoints were performed based on unconfirmed responses (main analysis) and additionally also on confirmed responses, for both RECIST V.1.1 and irRC. In parts A and B, response was assessed using as baseline the start of pembrolizumab and efti combination therapy. Additional exploratory analyses were performed for part A, using the start of pembrolizumab treatment as baseline. For this exploratory immune related Best Overall Respons (irBOR), the sum of target lesions prior to pembrolizumab therapy initiation was used as a reference for each patient.
Efficacy analyses and exploratory endpoints were generally performed using descriptive statistics. Progression-free survival (PFS) was analyzed using Kaplan-Meier methods.
Results
In vitro proof-of-concept for combined therapy (anti-PD-1+efti)
The combination of efti as an APC-activator with an ICI to boost the immune response was evaluated in vitro by monitoring the antigenic T-cell response of human PBMC stimulated with an antigenic peptides pool in the presence of efti and anti-PD-1 antibody. Cellular response was monitored by assessing the concentration of IFN-γ, TNF-α and RANTES in cell supernatants or the expression of activation markers (CD69, CD25) on CD8 T cell surface (figure 3). High concentration (1000 ng/mL) of anti-PD-1 antibody was also used as additional control. The immune response induced by the combination of efti and anti-PD1 antibody was more pronounced as fold increase than the sum of the effects obtained after incubation with a single agent. The response to combined treatment was also greater than the one observed with PD-1 blocker at 30-fold higher concentration. The effect of efti addition in an anti-PD-1 antibody dose–response experiment led to a similar observation (figure 3C).
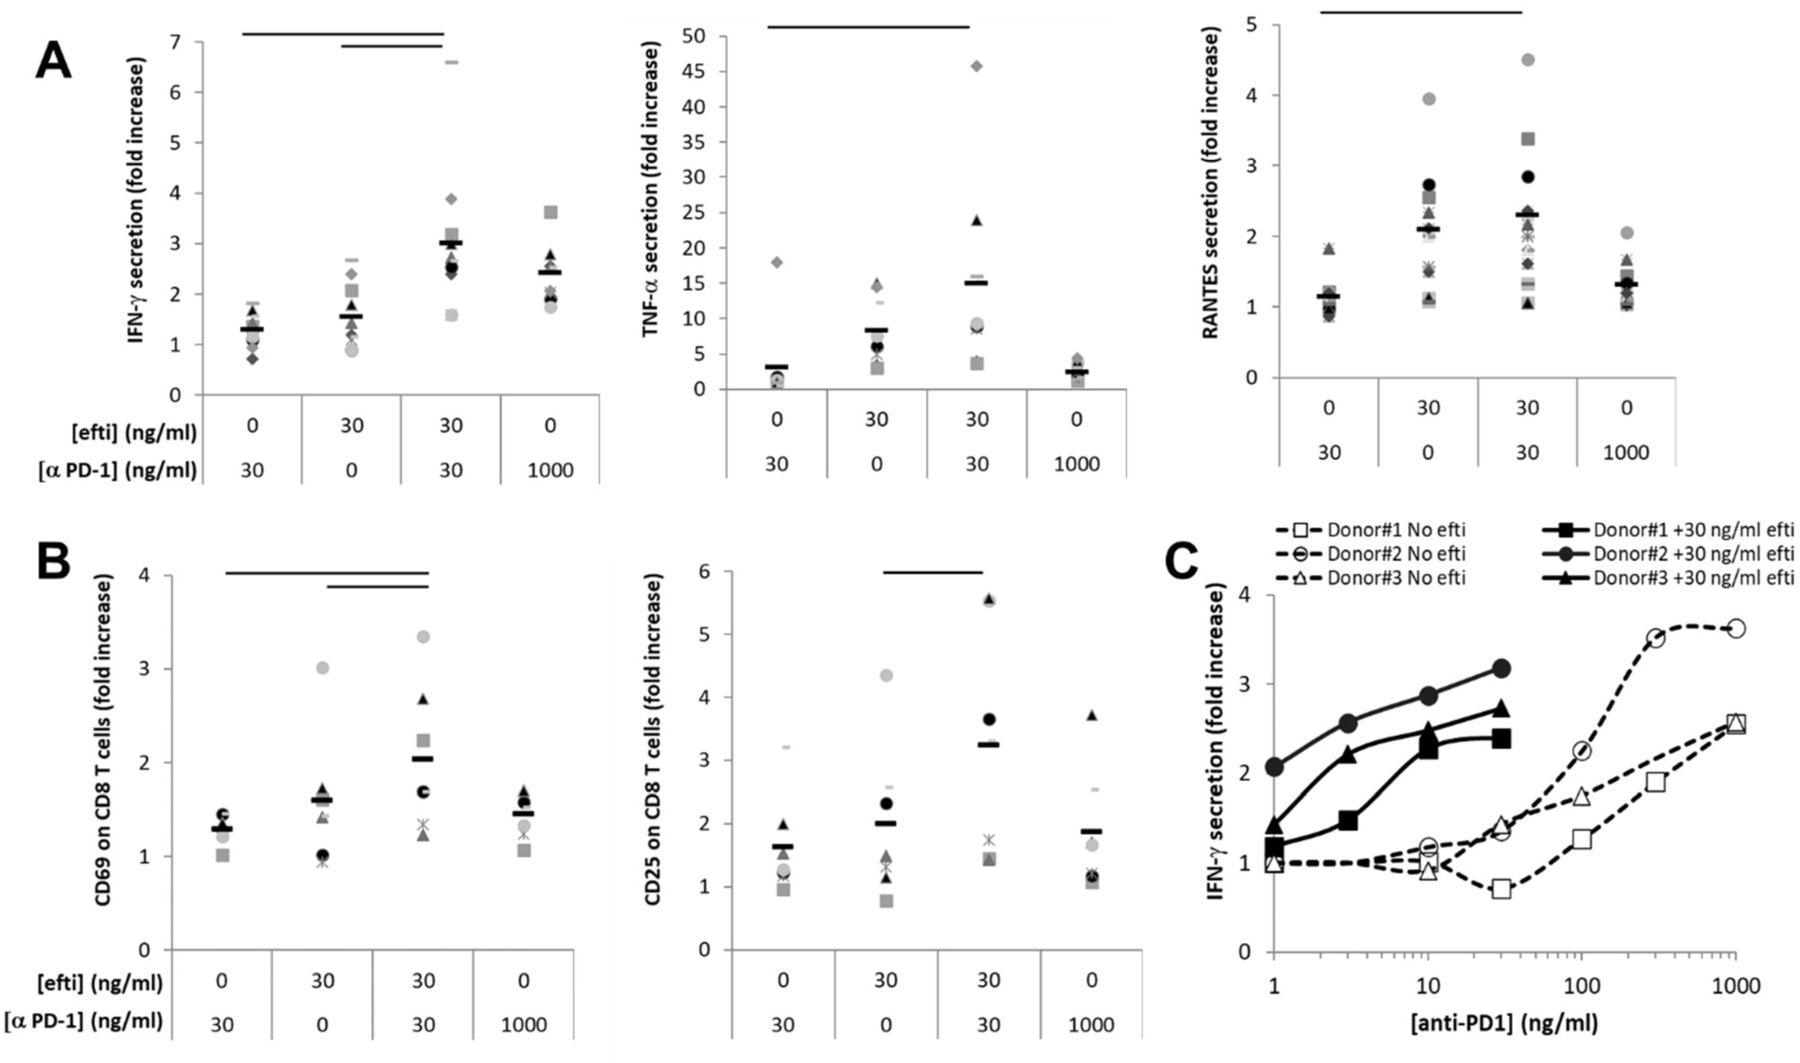
Effect of efti plus anti-PD-1 combination on antigen-induced human T cell response. CMV-stimulated PBMCs from healthy donors were incubated in the presence of 0 or 30 ng/mL efti and in the presence of 0, 30 or 1000 ng/mL anti PD-1 antagonist antibody as indicated. Two days post-stimulation, supernatants were collected and concentration of IFN-γ, TNF-α and RANTES was measured (A). The expression of activation markers, CD69 and CD25 at the surface of CD8+ T cells was analyzed by flow cytometry (B). The results are shown in fold increase of levels of soluble biomarkers or the % of CD8 T cells expressing the indicated marker in the indicated condition to the value obtained in the absence of efti and anti-PD-1 antibody. Bars represent average of 10 donors for soluble analytes and seven donors for activation markers. Significant difference (p<0.05) between combined condition to either efti or anti-PD-1 Ab alone is displayed by a bar on the top of each graph. Panel (C) shows the IFN-γ concentration in cell supernatants of an anti-PD-1 dose–response experiment, either alone (opened markers, dashed lines) or combined with 30 ng/mL efti (close markers, plain lines), carried out with PBMC from three donors. The results are shown in fold increase of IFN-γ levels as a function of anti-PD-1 antibody concentration. CMV,cytomegalovirus; IFN, interferon; PBM, peripheralblood mononuclear; PD-1, programmed death-1.
Patients
The study was divided into two parts; parts A and B, where part A was the dose escalation part and part B was a dose confirmation part of the study. Patients were to stay on treatment until confirmed disease progression, unacceptable toxicity, completion of the study or discontinuation for any other reason whichever occurred first. The study was conducted at seven sites across Australia. Main inclusion criteria were histologically confirmed unresectable stage III or stage IV melanoma; Eastern Cooperative Oncology (ECOG) 0–1; measurable disease according to RECIST 1.1 and adequate laboratory values. Main exclusion criteria were prior PD-1/programmed death ligand-1 (PD-L1) therapy (for part A, patients were on pembrolizumab therapy at the time of screening), known cerebral or leptomeningeal metastases (stable previously treated brain metastases allowed) or continuous corticotherapy (>10 mg/day prednisone equivalent) within 4 weeks prior to study start.
Part A
Eighteen patients were included in part A of the study. All patients had stage IV melanoma. Disease stage at baseline was M1c in 14 patients (77.8%), M1b in 3 patients (16.7%) and M1a in 1 patient (5.6%). In 38.9% of patients, lactate deshydrogenase (LDH) was elevated at study entry. Of 27.8% had received prior anticancer medications, that is, three patients had received dabrafenib and trametinib and two patients had received ipilimumab. All patients of part A were receiving pembrolizumab at the time of screening. ECOG PS at screening was 0 in 14 patients (77.8%) and 1 in 4 patients (22.2%). Almost all patients (94.4%) were men; all patients were Caucasian. Median age was 66.7 years. Patients were required to have asymptomatic immune-related progressive disease (ie, slowly progressive disease, not requiring urgent intervention and stable performance status) or suboptimal response (ie, immune-related stable disease (irSD) or partial response (irPR)) after three cycles (≈9 weeks) of pembrolizumab.
Part B
Part B was a six-patient toxicity lead-in cohort. All patients had stage IV melanoma. Stage of disease was M1c in four patients (66.7%) and M1b in two patients (33.3%). In 80% of patients, LDH was elevated at study entry. ECOG PS at screening was 0 and 1 in three patients (50.0%) each. Almost all (five patients, 83.3%) were men; all patients were Caucasian. Median age was 65.0 years. Most patients (83.3%) had undergone prior anticancer surgery; one (16.7%) had received prior anticancer radiation; none had received prior systemic anticancer medication.
Safety
Part A
The planned number of 13 efti doses was given in six patients (33%). Main reason for discontinuation was progression (n=7; 39 %). The median number of efti injections was 8 in the 1 mg and 6 mg cohorts and 12 in the 30 mg cohorts. Median treatment duration with efti was 98 days in the 1 mg and 6 mg cohorts and 161 days in the 30 mg cohort. No DLTs were reported. None of the AEs led to discontinuation of efti or pembrolizumab. SAEs were reported in six patients (33%); none as being drug related. The most frequent AEs regardless of relationship are listed in table 1. Nine patients (50.0%) reported AEs (possibly) related to efti. AEs reported in more than single patients were fatigue (11.1%) and rash (11.1%). Thirteen patients (72.2%) reported AEs (possibly) related to pembrolizumab. AEs reported in more than single patients were fatigue (27.8%), nausea (16.7%), diarrhea (11.1%,), pruritus (11.1%), arthralgia (11.1%), colitis (11.1%) and rash (11.1%).
Most frequent (≥4 or more patients in part A and/or >3 pts in part B) treatment-related adverse events
Part B
Of six patients, three patients (50%) received all 27 doses of efti according to the protocol. Two patients discontinued due to progressive disease and one due to an AE. The median number of injections in part B was 24. Median treatment duration with efti in part B was 322 days. DLTs were not reported. One SAE of anaphylactic reaction (grade 3) was judged as efti related; this patient discontinued efti because of the event. The most frequent AEs regardless of relationship are listed in table 1. Five patients (83.3%) reported AEs (possibly) related to efti. AEs reported in more than single patients were injection site erythema (66%), injection site swelling (50%) and injection site pain (33%). Five patients (83.3%) reported AEs that were (possibly) pembrolizumab related. AEs reported in more than single patients were rash (50%); and fatigue, arthralgia and pruritus (each 33%).
Pharmacokinetic analysis
A dose-proportional maximal exposure was observed across all dose levels. The results of the pharmacokinetics analysis for the three dose groups are shown in figure 4. After administration of efti 30 mg, all patients reached a circulating plasma concentration of efti/soluble LAG-3 (sLAG-3)>1 ng/mL, while only half of the patients receiving efti 6 mg and none from the efti 1 mg cohort reached this threshold. Mean Cmax increased with dose (for both cycles): 0.26 ng/mL (n=6, 35% CV) for efti 1 mg, 1.95 ng/mL (n=6, 88% CV) for efti 6 mg and 3,52 ng/mL (n=6, 71% CV) for efti 30 mg, in cycle 1. These values are similar to the ones reported previously with efti monotherapy.10 In cycle 9, values of 0.24 ng/mL (n=2, 1% CV) for efti 1 mg, 0.78 ng/mL (n=2, 0.4% CV) for efti 6 mg and 3.43 ng/mL (n=3, 85% CV) for efti 30 mg were reported.

PK profiles. PK profiles from patients receiving 1 mg (left panel), 6 mg (middle panel) or 30 mg (right panel) are shown. Soluble LAG-3 was measured by ELISA in the plasma at different time points following the first (plain lines) or the 13th (dashed lines) s.c. injection. LAG-3, lymphocyte activation gene.
At first administration, median Tmax was about 14 hours for efti 1 mg and 6 mg and 24 hours for efti 30 mg. In cycle 9, median Tmax decreased with dose: 24.0 hours, 12.6 hours and 4.0 hours for efti 1 mg, 6 mg and 30 mg, respectively. Mean area under the curve (AUC)0-t was 9195 hour·pg/mL (n=6, 58% CV) for efti 1 mg, 65 674 hour·pg/mL (n=6, 103% CV) for efti 6 mg and 110 753 hour·pg/mL (n=6, 69% CV) for efti 30 mg, in cycle 1; and 6883 hour·pg/mL (n=2, 61% CV) for efti 1 mg, 16 213 hour·pg/mL (n=2, 115% CV) for efti 6 mg, and 92 036 hour·pg/mL (n=3, 94% CV) for efti 30 mg, in cycle 9.
Safety cytokines/chemokines and anti-efti antibodies
Study treatment-related clinically relevant increases of plasma levels of at least two cytokines among TNF-α, IFN-γ, IL-1β, IL-2, IL-4 and IL-8 by >50 times over baseline were considered as DLT. No safety-related increase in circulating levels cytokines was noted for any patient. A moderate increase in IL-6 (mean fold change 1.5, 1.7 and 1.6 at 4, 8 and 24 hours, respectively, after the first dosing at cycle 1, and 1.8, 1.8 and 1.4 at 4, 8 and 24 hours, respectively, after the last dosing at cycle 9) was observed.
In part A, the percentage of anti-drug antibodies (ADA)-positive patients increased with the efti dose. In part B, all patients treated for at least 2 months were ADA-positive. Relatively high titres were observed in two patients of six (up to 666), while other patients had low titer (<32). No obvious relationship could be observed between immunogenicity and pharmacodynamics parameters. ADA occurrence and intensity did not negatively impact the clinical response read-outs.
Pharmacodynamics
Immunomonitoring was done on whole blood samples 2 weeks after efti injection in order to detect the minimal residual effect of efti just before the next efti injection. Therefore, any change induced by efti would indicate a long-term sustained immunostimulation (more than 10 days after efti disappearance in the blood) and for the T-cell compartment a sustained effect on the memory T-cell subset.
In part B, which is the study design to be used for future phase II trials, we found a sustained increase in activated (CD38+ HLA-DR+) CD4 T cells (1.3, 1.5 and 1.2-median fold or 1.4, 1.6 and 1.2-mean fold change at day 1 of cycle 5, day 1 of cycle 9 and day 1 of cycle 13, respectively) or CD8 T cells (2.1, 2.0 and 1.8-median fold or 2.5, 2.0, 1.5-mean fold change) counts compared with the baseline (predose at cycle 1) (figure 5). All part B patients increased their circulating activated cytotoxic T cells by at least two-fold after 3 months of treatment and by at least 1.5-fold after 6 months, while in part A, only 4 patients out of 11 tested showed an increase by more than 1.5-fold at cycle 5 or cycle 9. Among these 4, 3 received 30 mg doses (online supplemental figure 1). An increase in NK cell counts was also observed in part B patients with 1.7-median fold or 1.6-mean fold at day 1 of cycle 5 and 1.4-median fold or 1.5-mean fold at day 1 of cycle 9 (online supplemental figure 1).
Supplemental material
Supplemental material

Increase of circulating activated cytotoxic and helper T cells. Absolute counts of circulating CD3+ CD8+ (left panel) and CD3+ CD8- (in practice CD4+ cells, right panel) T cells coexpressing activation markers HLA-DR and CD38 were counted in whole blood samples in part B, prior to dosing at cycle 1 (baseline), at cycles 5, 9 and 13 by flow cytometry. Results are presented as fold change from baseline at each time point. Significant changes assessed by paired nonparametric Wilcoxon signed rank test are displayed (*p<0.05, **p<0.01).
In part A patients, the circulating concentrations of IFN-γ, a Th1 biomarker, were slightly increased at cycle 9 prior to the last dosing, namely, 2 weeks after the previous efti administration, by a mean of 1.3. IFN-γ concentration continued to increase up to a mean fold change of 2 at 8 hour after the last dosing of the study drug compared with the baseline. Chemokine (C-X-C motif) ligand (CXCL-10), another Th1 biomarker, only increased 1.3-fold, 8–48 hours following the last injection.
Efficacy
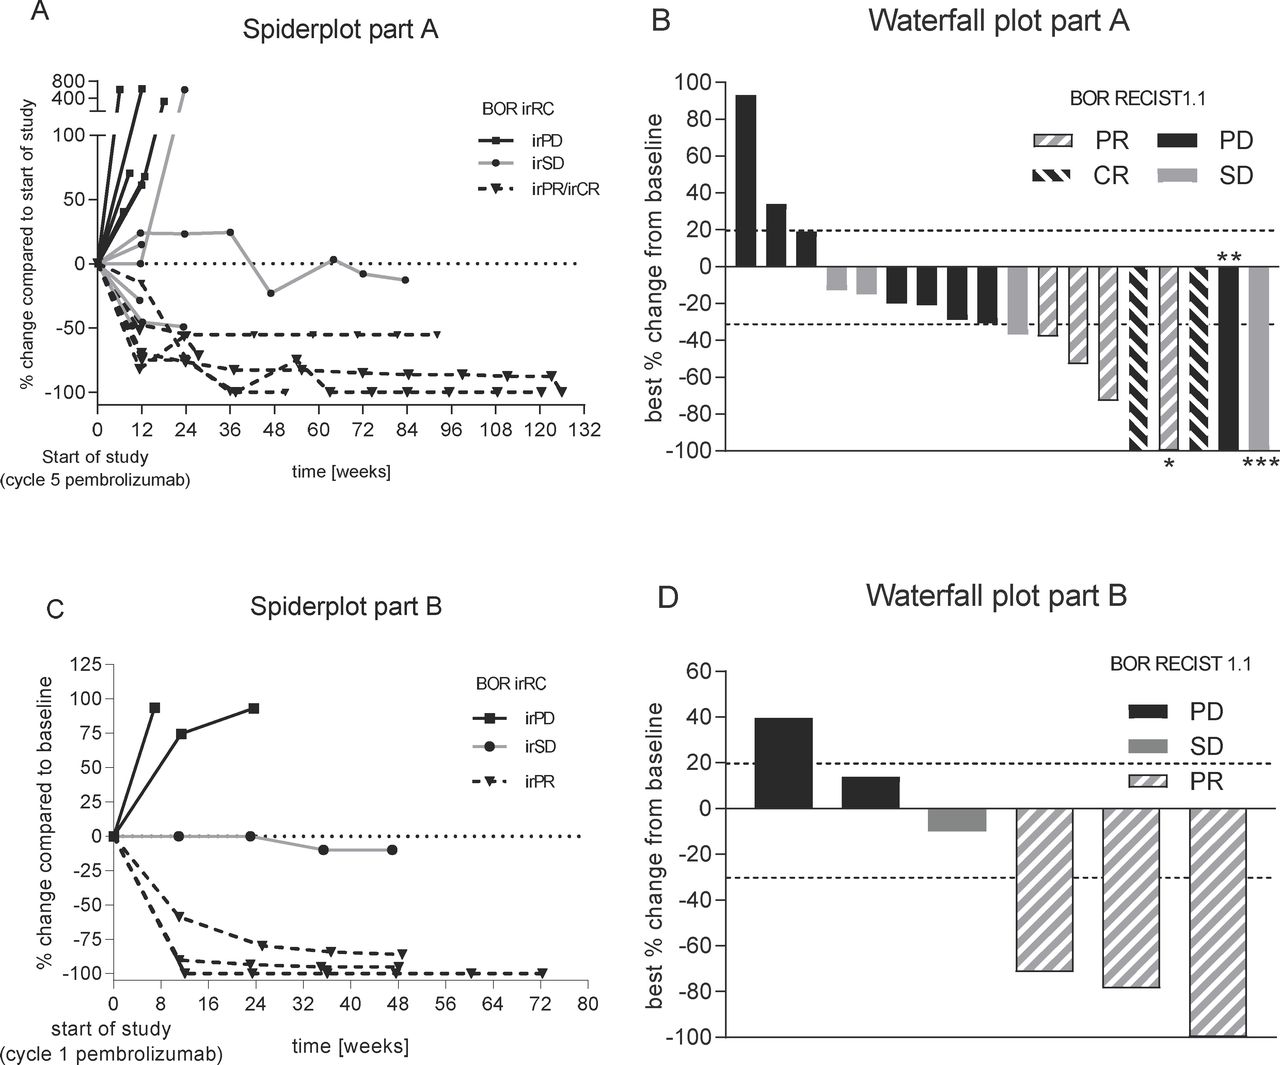
In part A, based on the start of efti and pembrolizumab combination therapy (see figure 3 study PFS/overall response rate (ORR)), six patients (33%) achieved ORR (RECIST1.1; unconfirmed) including two patients (11.1%) with a CR. Both CRs and five responses in total were confirmed. Disease control rate (DCR) was 55.6%. Median PFS according to RECIST V.1.1 was reported with 142 days (4.7 months). The probability of being event-free according to RECIST V.1.1 at 12 months was 35.7%. The depth of responses is shown in the waterfall plot in figure 6B. The development over time is displayed in the spider plot in figure 6A. Results based on irRC were comparable to those based on RECIST 1.1 with an irORR of 33 %, including one patient with irCR and five patients with irPR. The irDCR was 66%. Median PFS based on irRC was 165 days (5.4 months). The 12 months PFS rate was 40%. In part A, three of six patients progressing on pembrolizumab monotherapy benefited from the combination treatment reporting irCR (n=1), irPR (n=1) and irSD (n=1) as best response under study. Both patients with a response completed the study treatment. Of the six patients responding to the combination therapy, two were progressing, two had a stabilization of disease and two showed a partial response after 3 cycles of pembrolizumab, respectively.

Best overall response. Spider plot (left; A+C) as per irRC and waterfall plot (right, B+D) as per RECIST 1.1 for part A (top) and part B (bottom). Best overall response (BOR) as per RECIST1.1/irRC is displayed using the following code: black represents PD/irPD, gray SD/irSD, hashed gray Pr/irPR while hashed black CR/irCR, respectively. *Nontarget lesions (NTL) still present; **target lesions (TL) and NTLs disappeared, but new lesions (NL) were present at staging; ***time of CR of TLs; NLs appeared; staging before was SD (BOR is SD). irPD,immune-related progressive disease; irPR, immune-related partial response; irSD, immune-related stable disease.
In part B, ORR (RECIST V.1.1) was 50% (all confirmed) with a DCR of 83% (see figure 6D). All responses were ongoing at study end at 12+ months. Thus, median PFS and median duration of response could not be calculated. The probability of being event-free at 12 months was 67%. Results according to irRC were comparable with irORR (confirmed) was achieved by three patients (50%). irDCR was 67%. Median PFS (irRC) was not reached; the probability of being event free at 12 months was estimated as 67% as shown in the spider plot in figure 6C.
Efficacy—parts A+B
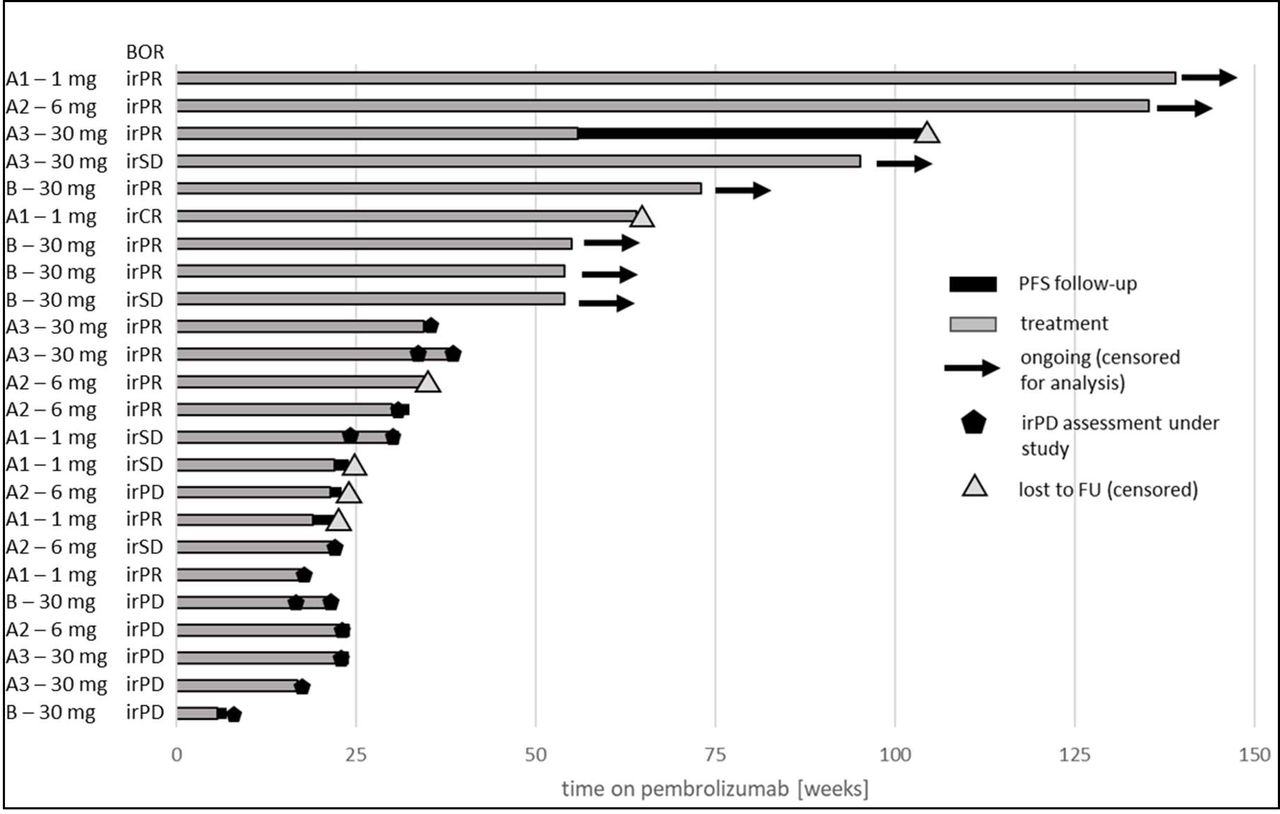
Exploratory analyses were performed for pooled data from parts A and B (exploratory irORR/irDCR); baseline for all patients was the start of pembrolizumab therapy, in part A and part B (see figure 2). The best overall response per irRC for each patient of parts A and B including the duration of pembrolizumab treatment is shown in the swimmer plot in figure 7. The reported irORR was 54% and irDCR was 75%.

Swimmer plot with best overall response according to irRC for all patients of parts A and B. Each patient is displayed from the start of pembrolizumab therapy. All four groups are shown with A1=part A, 1 mg efti; A2=part A, 6 mg efti, A3=part A, 30 mg efti and B=part B, 30 mg efti. BOR,best overall response; irPD, immune-related progressive disease; irPR, immune-relatedpartial response; irSD, immune-relatedstable disease; PFS, progression-free survival.
Discussion
The activation of potent CD8 T-cells with high effector activity is one of the goals of an effective immunotherapy. The data presented in this report showed a long-term expansion of an activated CD8 T cell subset in patients treated with efti and anti-PD-1 combined therapy. Such finding is in line with other pharmacodynamic observations obtained in other efti clinical studies.10–13 When efti was used as a monotherapy, it was shown to increase the long-lived effector-memory CD8 T cell pool.10 CD8 T cells with memory potential are superior to terminally differentiated effector cells in mediating successful tumor clearance14 as the latter display impaired proliferation and survival in vivo, and only mediate short-term anti-tumor effects. Thus, to monitor only sustained memory T cells that have enhanced proliferative potential and survival and the potential to provide more robust and enduring protection against tumors, we assess CD8 T cell immunological endpoints 14 days after injection of efti, that is, just before the next efti injection and long after efti has disappeared from the blood stream. We observed sustained increases in activated CD4 or CD8 T counts that are detected at 3 or 6 months in patients injected with 30 mg efti. These increases are different from what to expect from pembrolizumab monotherapy where activated CD8 T cell counts are increased only early on, at 2 or 4 weeks after start of treatment.15 Failed T cell priming often needs repair through APC activation16 before successful sensitization to PD-1/PD-L1 blockade and MHC II agonism with efti plays a critical role in generating T cell immunity by activating DCs6–8
As efti or any other MHC class II agonist has not been tested yet in combination with an anti-PD-1 therapy, patients started efti injections in part A of the study at cycle 5 of pembrolizumab in order not to expose the subset of patients with pembrolizumab-induced immune-related AEs in the first 3 months of exposure to a second immunostimulant. Then, as no new safety signals were seen in part A, part B patients were treated with the combination from day 1 on. No new safety signals or DLTs emerged from the study data reported in part A or part B. Low numbers of patients reported injection-site reactions, which typically reappeared on multiple administrations, and this is consistent with the proposed mechanism of action (ie, APC activation of s.c DCs or Langerhans cells in the dermis) and the known safety profile of efti. There was no indication that efti induces immune-related AEs or increases the severity of pembrolizumab-related immune-related AEs.
When analyzing pooled data from parts A and B with the baseline at start of pembrolizumab therapy, the irORR was 54%. In large historical studies with treatment naïve KEYNOTE-006 patients, a 36% ORR, median PFS of 4.1 months and 47% progression free at 6 months were reported with pembrolizumab monotherapy. In patients pretreated with ipilimumab (KEYNOTE-002), a 21% ORR, median PFS of 2.9 months and 34% progression free at 6 months were reported with pembrolizumab monotherapy.17 In the first phase I trial (Keynote-001), 173 melanoma patients pretreated with ipilimumab or BRAF/MEK inhibitor received pembrolizumab at 2 mg/kg or 10 mg/kg and the ORR was 24% in the extension part of the trial.18
Given the late stage population and pre-exposure with pembrolizumab prior to trial start in part A, the data reported here are encouraging. A phase II trial study testing this combination therapy in first and second-line non-small cell lung cancer and in second-line head and neck squamous cell cancer is ongoing (NCT03625323). In this umbrella phase II trial, patients are not selected for PD-L1 expression levels at the tumor site before enrolment. Thus, “hot” (>50% PD-L1 expression) “tepid” (1% to 49% PD-L1) or “cold” (<1% PD-L1) tumor patients are being enrolled (ie, a PD-L1 all-comer trial).
Combination therapies are currently being evaluated clinically with the goal of enhancing overall antitumor activity, in order to provide better treatment for patients with large tumor burdens. The vast majority of trials is testing a double ICI combination (eg, an anti-CTLA-4, anti-LAG-3 or anti-TIGIT with an anti-PD-1), preferably in “hot” tumor patients, as blocking two inhibitory receptors on T cells might be better than just blocking one receptor. Our approach, combining an APC activator with an ICI, is different as efti, as an MHC class II agonist, activates T cells through an indirect and physiological mechanism, that is, efti-activated APCs give the “license to kill”19 to CD8 memory T cells. This may result in more “tepid” or “cold” tumor patients responding to the combination therapy. The addition of efti to pembrolizumab induces long-term tumor responses and long-term increase in circulating activated CD8 and CD4 T cell counts at the 30 mg dose. Importantly, this immunostimulatory effect was obtained without clinically significant toxicity of this first-in-class immunopotentiator targeting MHC class II+ APCs
Acknowledgments
The authors would like to thank the patients who participated in this trial, and their families, as well as the investigators, study coordinators, study teams, and nurses.
References
Supplementary materials
Supplementary Data
This web only file has been produced by the BMJ Publishing Group from an electronic file supplied by the author(s) and has not been edited for content.
Footnotes
Contributors Concept and design: VA, CM, CB, FT. Provision of study materials or patients: all authors. Collection and assembly of data: all authors. Data analysis and interpretation: CM, CB, FT. Manuscript writing and critical evaluation: CM, CB, FT. Final approval of manuscript: all authors. Accountable for all aspects of the work: all authors.
Funding This clinical study was funded by Immutep Pty (previously Prima BioMed Pty). The study protocol was developed by Immutep Limited in collaboration with the study investigators. Immutep Limited was also involved in data collection, analysis and interpretation of results.
Competing interests CM, CB and FT are employees of Immutep and own shares of the company.
Patient consent for publication Not required.
Ethics approval This study was conducted according to the ethical principles of the Declaration of Helsinki, Good Clinical Practice guidelines, the principles of informed consent and the requirements of the public registration of clinical trials. Written informed consent was obtained from each patient prior to screening. The protocol was approved by the institutional ethics committee and was monitored by a safety monitoring committee.
Provenance and peer review Not commissioned; externally peer reviewed.
Data availability statement All data relevant to the study are included in the article or uploaded as supplementary information. Data are available on reasonable request. Qualified researchers may request access to study documents (including the clinical study report, study protocol with any amendments, blank case report form, statistical analysis plan) that support the methods and findings reported in this manuscript.
Supplemental material This content has been supplied by the author(s). It has not been vetted by BMJ Publishing Group Limited (BMJ) and may not have been peer-reviewed. Any opinions or recommendations discussed are solely those of the author(s) and are not endorsed by BMJ. BMJ disclaims all liability and responsibility arising from any reliance placed on the content. Where the content includes any translated material, BMJ does not warrant the accuracy and reliability of the translations (including but not limited to local regulations, clinical guidelines, terminology, drug names and drug dosages), and is not responsible for any error and/or omissions arising from translation and adaptation or otherwise.