Article Text

Abstract
Background We have previously reported that the upregulation of galectin-9 (Gal-9) on CD4+ and CD8+ T cells in HIV patients was associated with impaired T cell effector functions. Gal-9 is a ligand for T cell immunoglobulin and mucin domain-3, and its expression on T cells in cancer has not been investigated. Therefore, we aimed to investigate the expression level and effects of Gal-9 on T cell functions in patients with virus-associated solid tumors (VASTs).
Methods 40 patients with VASTs through a non-randomized and biomarker-driven phase II LATENT trial were investigated. Peripheral blood mononuclear cells and tumor biopsies were obtained and subjected to immunophenotyping. In this trial, the effects of oral valproate and avelumab (anti-PD-L1) was investigated in regards to the expression of Gal-9 on T cells.
Results We report the upregulation of Gal-9 expression by peripheral and tumor-infiltrating CD4+ and CD8+ T lymphocytes in patients with VASTs. Our results indicate that Gal-9 expression is associated with dysfunctional T cell effector functions in the periphery and tumor microenvironment (TME). Coexpression of Gal-9 with PD-1 or T cell immunoglobulin and ITIM domain (TIGIT) exhibited a synergistic inhibitory effect and enhanced an exhausted T cell phenotype. Besides, responding patients to treatment had lower Gal-9 mRNA expression in the TME. Translocation of Gal-9 from the cytosol to the cell membrane of T cells following stimulation suggests persistent T cell receptor (TCR) stimulation as a potential contributing factor in Gal-9 upregulation in patients with VASTs. Moreover, partial colocalization of Gal-9 with CD3 on T cells likely impacts the initiation of signal transduction via TCR as shown by the upregulation of ZAP70 in Gal-9+ T cells. Also, we found an expansion of Gal-9+ but not TIGIT+ NK cells in patients with VASTs; however, dichotomous to TIGIT+ NK cells, Gal-9+ NK cells exhibited impaired cytotoxic molecules but higher Interferon gamma (IFN-γ) expression.
Conclusion Our data indicate that higher Gal-9-expressing CD8+ T cells were associated with poor prognosis following immunotherapy with anti-Programmed death-ligand 1 (PD-L1) (avelumab) in our patients’ cohort. Therefore, for the very first time to our knowledge, we report Gal-9 as a novel marker of T cell exhaustion and the potential target of immunotherapy in patients with VASTs.
- tumor microenvironment
- T-lymphocytes
- therapies
- investigational
- receptors
- immunologic
- killer cells
- natural
This is an open access article distributed in accordance with the Creative Commons Attribution Non Commercial (CC BY-NC 4.0) license, which permits others to distribute, remix, adapt, build upon this work non-commercially, and license their derivative works on different terms, provided the original work is properly cited, appropriate credit is given, any changes made indicated, and the use is non-commercial. See http://creativecommons.org/licenses/by-nc/4.0/.
Statistics from Altmetric.com
Introduction
Cytotoxic T lymphocytes (CTLs) play an important role in eliminating virus-infected and tumor cells. Nevertheless, during chronic viral infections and cancer, the program of CD8+ T cell differentiation is markedly altered due to persistent antigen stimulation and/or inflammation. This scenario is often associated with poor Cytotoxic T lymphocyte (CTL) effector function, a state of functional impairment generally termed exhaustion.1 Exhausted CD8+ T cells lose robust effector properties but display sustained upregulation of several coinhibitory receptors such as programmed cell death (PD)-1, cytotoxic T lymphocyte-associated protein 4 (CTLA-4), T cell immunoglobulin and ITIM domain (TIGIT), T cell immunoglobulin and mucin domain-3 (TIM-3), lymphocyte activation gene-3 (LAG-3) and V-domain immunoglobulin suppressor of T cell activation (VISTA).1 2 The altered expression and activity of key transcription factors, as well as metabolic derangements in exhausted CD8+ T cells, correspond with the inability of patients to mount effective immune responses against tumors or chronic viral infections.3
As exhausted CD8+ T cells are a heterogeneous cell population, the functional nature of exhausted T cells may vary according to the nature of eliciting antigens.1 Likewise, robust and functional CD4+ T cells can play an important role in combating viral infections and cancer. For example, loss of CD4+ T cells is associated with HIV disease progression to AIDS.4 The chronic viral infection is a causative factor for the development of multiple cancers, including squamous cell cancers of the head and neck (HNSCC), gynecological cancers, and cancers of the penis and anal canal.5 In the context of cancer, CD4+ T cells can also eliminate tumor cells through cytolytic mechanisms or by modulating the tumor microenvironment (TME).6 Successful bystander destruction of tumor cells requires crosstalk of CD4+ and CD8+ T cells during the effector phase and during the induction phase of cancer rejection.7 Besides, CD4+ T cells enhance the quantity and quality of CTLs responses and improve their clonal expansion and differentiation into effector and memory CTLs.8 The overexpression of coinhibitory receptors is centrally associated with the impairment of both CD4+ and CD8+ T cells. Current cancer immunotherapy strategies, which target these immune checkpoints, leading to the restoration of CD4+ T cell function, are hence beneficial.9 CD4+ T cells possess a wide range of biologic properties by helping innate immune cells, CTLs and B cells.10 Even though dysfunctional CD4+ T cells share some transcriptional modules with dysfunctional CD8+ T cells, they use different gene expression programs that distinguish them phenotypically and functionally.11
The persistent upregulation of coinhibitory receptors impacts T cell functions and natural killer (NK) cells.1 12 Upregulation of PD-1 on NK cells is associated with impaired degranulation capacity and IFN-γ production and overexpression of TIGIT impairs cytolytic activity and IFN-γ expression in NK cells.12 In agreement, the TIGIT blockade restores NK cell degranulation and cytokine production.13 Unlike TIGIT and PD-1, the role of galectin-9 (Gal-9) in NK cell function is not well defined. Gal-9 is a member of the Galectin family of β-galactoside-binding proteins.14 Gal-9 is reported to serve as a binding partner for TIM-3 and universally expressed in a wide range of immune and non-immune cells in mice and humans and present on the membrane, cytoplasm, and nucleus of a variety of cells.14 The physiological abundance of Gal-9 in different host cells suggests an important but sophisticated role for this lectin, whose biological functions are exerted by multiple receptors with distinct and sometimes opposing effects such as TIM-3, the cell surface protein disulfide isomerase, IgE, 4-1BB (CD137), CD40, Dectin-1, and CD44.14–17 Gal-9 has been reported to be an exhaustion ligand for TIM-3, by suppressing antigen-specific CTL effector functions.16 For example, Gal-9 interaction with the TIM-3 receptor on Th1 cells induces T cell apoptosis and regulates CD8+ T cell responses.18 However, the Gal-9:TIM-3 interactions have not been out of controversy as Gal-9 may regulate T cell functions independent of TIM-3.19 Similarly, exogenous Gal-9 prevents the differentiation and function of Th17 cells but promotes the induction of regulatory T cells (Tregs) in TIM-3 independent manner.16 Furthermore, Tregs express Gal-9,20 and Gal-9 via interaction with CD44 promotes Foxp3 expression to enforce induced Treg (iTreg) differentiation and maintenance.21 Gal-9 directly interacts with 4-1BB, which facilitates 4-1BB aggregation, signaling and functionality of T cells, NK cells and dendritic cells (DCs).22 Most recent evidence indicates that intracellular Gal-9 acts as a positive T cell activator following TCR stimulation.23 Recently, we reported significant upregulation of Gal-9 on NK cells in HIV-infected individuals. We revealed that Gal-9 expressing NK cells had impaired cytotoxic effector molecules (GzmB, perforin, and granulysin) but enhanced IFN-γ expression.24 Dichotomous to Gal-9+ NK cells, TIGIT+ NK cells expressed significantly higher cytotoxic molecules but lower IFN-γ in HIV-infected individuals.24 Moreover, we found upregulation of Gal-9 on both CD4+ and CD8+ T cells in HIV-infected individuals; in particular, Gal-9 was simultaneously expressed with PD-1, and the presence of Gal-9 was associated with terminally exhausted T cells in patients with HIV.25 Although the role of Gal-9 in cancer biology or its expression on a variety of tumor cells is well documented,26 there is no evidence about its role on immune effector cells in solid tumors arising due to chronic viral infection. Most notably, a sharp rise in the proportion of human papillomavirus (HPV)-associated HNSCC has been recently noted, and Gal-1 and Gal-3 are associated with tumor migration, invasion, and proliferation in HNSCC.27 The apoptotic effect of recombinant Gal-9 on leukemia T cell lines, myeloma, melanoma, and various other solid tumors has been widely reported.28 Moreover, Gal-9 is increasingly recognized as a prognostic malignancy marker, and loss of its expression on tumor cells is associated with resistance to apoptosis, which increases tumor aggressiveness.26 Nevertheless, several studies have reported inconclusive or opposing observations, indicating the expression of Gal-9 trends toward a poor clinical outcome in various cancers.29 A recent study demonstrated that dectin-1 is highly expressed on macrophages in pancreatic ductal adenocarcinoma (PAD) and can ligate Gal-9 resulting in tolerogenic macrophage programming and suppression of CD4+ and CD8+ T cells.15 As such, disruption of Gal-9:Dectin-1 restores adaptive immunity against tumor.15 However, the expression of Gal-9 on T cells in this study and other malignancies has never been investigated before.
The immune evasion characterized by the upregulation of PD-L1/PD-L2 is reported to be related to the recurrence and metastasis of HNSCC.30 However, regardless of PD-L1 expression level, nivolumab prolongs survival in comparison with standard therapy.30 One step forward will be better understanding the expression pattern of different coinhibitory receptors and their corresponding ligands in T cells in the peripheral blood and TME of virus-associated solid tumors (VASTs).
Here, we report high Gal-9 expression on both CD4+ and CD8+ T cells in the peripheral blood and tumor-infiltrating T cells (TILs) of patients with VASTs. Gal-9+ T cells display an impaired phenotype, and its coexpression with PD-1 and TIGIT provides a synergistic impaired effector function. Besides, we observed a dichotomy for the Gal-9+ versus TIGIT+ NK cells in the peripheral blood of these patients. Our results indicate that the upregulation of Gal-9 on T cells is associated with poor prognosis in patients with VAST receiving anti-PD-L1 therapy.
Material and methods
Study population
Our cohort consisted of 40 patients, from which we received blood (40 patients) and biopsies (six patients). This is a non-randomized and biomarker-driven phase II LATENT trial investigating the effects of oral valproate and avelumab (anti-PD-L1) in patients with VASTs. All patients had virus-associated cancers (most were head and neck, HPV related and a few Epstein-Barr virus (EBV)-related nasopharyngeal carcinoma), but there were also patients with non-head and neck cancer (ie, HPV-related gynecological cancer, anal canal and penile cancers; online supplemental figure 1A for tumor types). Cancer free, HIV, HCV, and HBV seronegative ‘healthy controls’ (HCs) were used for this study.
Supplemental material
Blood was obtained at the baseline/day 0 (prior to the initiation of treatment), 2 weeks postvalproate (cycle 1), 2 weeks postavelumab (cycle 2) and different cycles (2 weeks apart).
Cell isolation from the peripheral blood
Peripheral blood mononuclear cells (PBMCs) were isolated from fresh blood of either HCs or patients with VAST using Ficoll-Paque gradients and cultured in RPMI 1640 (Sigma) supplemented with 10% fetal bovine serum (Sigma) and 1% penicillin/streptomycin (Sigma). For intracellular cytokine staining (ICS), fresh PBMCs or TILs were stimulated with anti-CD3/CD28 in the presence of Golgi blocker for 5-6 hours before flow cytometry staining and analysis as we have reported elsewhere.31
Biopsies and TIL isolation
Fine-needle biopsy samples were collected from tumor sites before commencement of treatment (screening) and after 3 months of a-PD-L1 (avelumab) treatment. On collection, biopsies were stored in RNA later and cryopreserved at −80°C until use. Fresh fine needle biopsies obtained from the patients with VAST were immediately processed for the cell isolation and analysis.
Flow cytometry
Fluorophore antibodies specific to human cell antigens and cytokines were purchased from BD Biosciences, Thermo Fisher Scientific and Biolegend. The following antibodies were used in our study: anti-CD3 (SK7), anti-CD4 (RPA-T4), anti-CD8 (RPA-T8), anti-PD-1 (MIH4), anti-TIGIT (MBSA43), anti-Gal-9 (9M1-3), anti-CD11b (ICRF44), anti-CD11c (3.9), anti-CD14 (61D3), anti-CD56 (B159), CD16 (3G8), anti-Perforin (δG9), anti-Granzyme B (GB11), anti-interleukine-2 (IL-2) (MQ1-17H12), anti-tumor necrosis factor-alpha (TNF-α) (MAB11), and IFN-γ (4S.B3). Purified No Azide/Low endotoxin (NA/LE) mouse antihuman CD3 (UCHT1), antihuman CD28 (CD28.2), Protein Transport Inhibitor (Containing Brefeldin A) were purchased from the BD Bioscience. To assess cell viability, we used the LIVE/DEAD Kit (Life Technologies). Surface staining and intracytoplasmic cytokine staining (ICS) were performed as we described previously.16 32 After fixation with paraformaldehyde (PFA 4%), stained cells were acquired on a Fortessa-X20 or LSR Fortessa-SORP (BD Bioscience) and analyzed using FlowJo software (V.10).
ELISA assay
The concentration of soluble Gal-9 in the plasma was detected using by ELISA kit (R&D) as we have reported elsewhere.17
Image cytometry
PBMCs were surface stained and fixed with PFA for ImageStream analysis. We collected ≥3000 images for each condition using Amnis ImageStream Mark II (EMD Millipore). Analysis was performed by choosing a high aspect ratio, choosing only in focus images and calculating maximum pixel intensity of the fluorochrome dye according to our previous report.25 32
Gene expression analysis
RNA isolation and cDNA synthesis were conducted according to our published data.33
One hundred nanograms to 200 ng reverse transcription reactions for cDNA synthesis were carried out using the Quantitect RT Kit (Qiagen) according to the protocol for subsequent quantification of mRNAs. Quantitect Primer Assays (Qiagen) for the following genes were carried out: PDCD1, TBX21, GSK3, EOMES, GAL9 and BATF. Each sample was run in duplicate on the CFX96 Touch Real-Time PCR Detection System (BioRad). Beta-2 microglobulin was used as a reference gene, and the expression of the targeted genes was calculated by the 2-ΔΔCt method.
Statistical analysis
P values displayed in cumulative flow cytometry plots were determined by the non-parametric Mann-Whitney test. When more than two groups were compared, one-way analysis of variance followed by Tukey’s test was used to compare the results. Prism software V.8 was used for statistical analysis. Results are presented as mean±SEM with p values <0.05 being considered as statistically significant.
Results
Differential expression and downregulation of Gal-9 expressed by peripheral blood CD4+ and CD8+ T cells of patients with VAST in response to valproate treatment and immunotherapy
Interestingly, we observed significant upregulation of surface Gal-9 on both CD4+ and CD8+ T cells from the peripheral blood of patients with cancer at baseline, before the onset of immunotherapy compared with HCs (figure 1A–D). The levels of Gal-9 expressed by peripheral blood CD4+ and CD8+ T cells varied between and within patients with different tumors and ranged from 0.5% to 90% (online supplemental figure 1B). Furthermore, we observed both upregulation and downregulation of Gal-9 expression in response to valproate treatment for 4 weeks and anti-PD-L1 for 2 weeks, irrespective of the tumor type (nasopharynx, cervix or tonsil; online supplemental figure 1B). These results show that a population of Gal-9+ CD4+ and CD8+ T cells in the peripheral blood of patients with VAST are refractory to valproate and anti-PD-L1 treatment. Interestingly, our preliminary data in patients with melanoma did not support a substantial expression of Gal-9 on T cells in a non-viral associated cancer (online supplemental figure 1C). However, as shown in the representative plots and cumulative data occasionally we observed upregulation of Gal-9 on peripheral T cells. Thus, further studies on larger cohorts are required to determine the expression of Gal-9 on T cells in the periphery and TILs of other solid tumors.
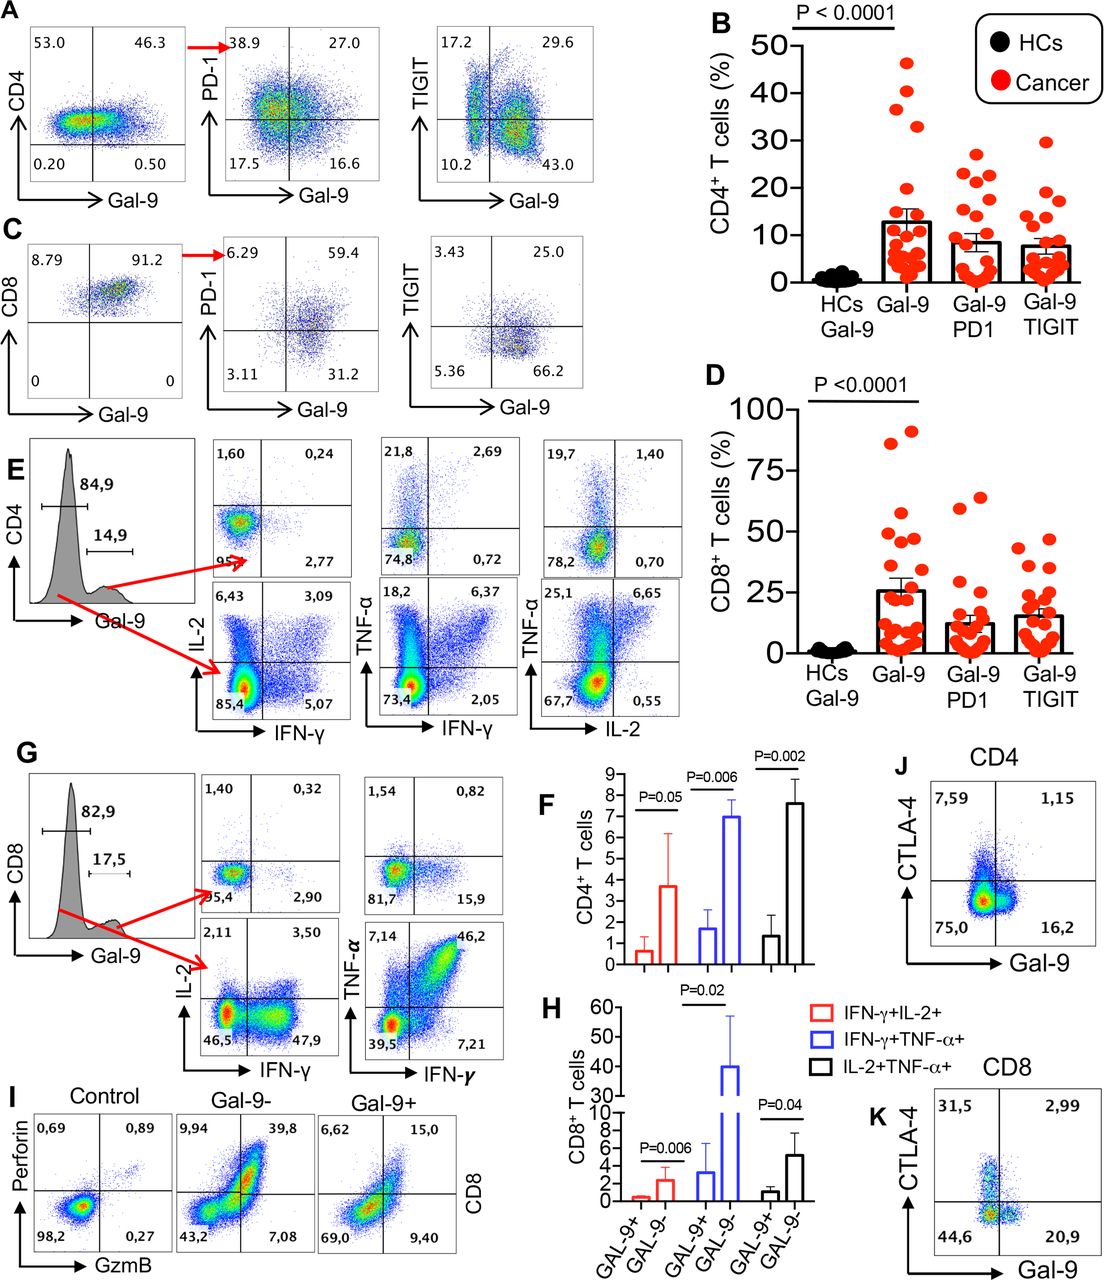
Overexpression of Gal-9 on T cells of patients with virus-associated solid tumors is associated with impaired effector function. (A and B) Representative flow cytometry plots and cumulative data of surface expression of Gal-9 and coexpression of Gal-9 with PD-1 or TIGIT on CD4+ T cells. (C and D) Representative flow cytometry plots and cumulative data of surface expression of Gal-9 and coexpression of Gal-9 with PD-1 or TIGIT on CD8+ T cells. (E and F) Representative flow cytometry plots and cumulative data showing IL-2, TNF-α and IFN-γ production by Gal-9- versus Gal-9+ CD4+ T cells. (G and H) Representative flow cytometry plots and cumulative data showing IL-2, TNF-α and IFN-γ production by Gal-9− versus Gal-9+ CD8+ T cells after 6-hour stimulation with anti-CD3/CD28 in vitro. (I) Representative flow cytometry plots showing perforin and GzmB expression in CD8+ Gal-9− versus CD8+ Gal-9+ T cells. (J and K) Representative plots showing coexpression of Gal-9 with CTLA-4 on CD4+ and CD8+ T cells in a patient with cancer. Each dot represents a patient and mean±SEM ANOVA with Tukey multiple comparisons, p value as indicated for each plot. ANOVA, analysis of variance; CTLA-4, cytotoxic T lymphocyte-associated protein 4; Gal-9, galectin-9; HCs, healthy controls; PD-1, programmed cell death 1; TIGIT, T cell immunoglobulin and ITIM domain.
Overexpression of Gal-9 on CD4+ and CD8+ T cells in patients with VASTs is associated with an impaired phenotype
In agreement with our observations in HIV infection,25 we found that the overexpression of Gal-9 was associated with impaired effector T cell functions such as cytokine secretion in both CD4+ and CD8+ T cells (eg, IL-2, IFN-γ and TNF-α) (figure 1E–H) and GzmB and perforin production capabilities (figure 1I). Gal-9 expressing CD4+ T cells appeared to maintain the ability to produce TNF-α while they lose IL-2 and IFN-γ production capacity in some patients (figure 1E, F and online supplemental figure 2A). However, expression of Gal-9 was associated with the loss of IL-2, IFN-γ and TNF-α production ability in CD8+ T cells (figure 1G,H). Of note, the major defect of GAL-9+ T cells was in coproduction of two cytokines.
The inverse correlation between Gal-9 expression and T cell effector function was mainly in CD8+ T cells from patients with VAST with different tumors at different treatment cycles. For instance, CD8+ T cells from a patient with a tumor in the larynx expressed approximately 60% Gal-9 and lower frequencies of IFN-γ, TNF-α and Granzyme B after 15 months of a-PD-L1 treatment (online supplemental figure 2A). However, low expression of Gal-9 by CD8+ T cells seen after a-PD-L1 treatment in a patient with a cervical tumor and another with a nasopharyngeal tumor, corresponded with increased expression of IFN-γ, TNF-α, granzyme B and perforin (online supplemental figure 2A). We also evaluated the expression of Gal-9 with the coinhibitory receptors, PD-1 and TIGIT (figure 1A–D). We observed differential coexpression of PD-1 and Gal-9, and TIGIT and Gal-9 by CD4+ and CD8+ T cells from a patient with VAST at different stages of treatment (up to cycle 43; approximately 2 years, online supplemental figure 2B–D). Although Gal-9 was highly coexpressed with PD-1 on T cells (figure 1A), this was not the case for CTLA-4 and a small portion of T cells coexpressed Gal-9 and CTLA-4 (figure 1J,K). We also measured the expression of VISTA and TIM-3 on T cells; however, the expression of TIM-3 was very low (<5 %), and we did not observe any VISTA expression on T cells in patients with VAST. Furthermore, we observed the coexpression of LAG-3 and Gal-9 on T cells in some patients (mainly those with cervix or nasopharynx cancers) as shown in online supplemental figure 2E–H. Although the coexpression of Gal-9 and LAG-3 was low, in most patients, it went up after the initiation of valproate treatment but declined post anti-PDL-1 treatment (online supplemental figure 2E–H).
The upregulation of Gal-9 on TILs and peripheral T cells correlates with impaired cytokine production
We further investigated the expression of Gal-9 on TILs obtained from biopsies collected from the patient cohort. Expression of Gal-9 and its coexpression with PD-1 and TIGIT was evident on CD4+ cells (figure 2A,B). We also observed that Gal-9+ CD4+ T cells had impaired cytokine production ability compared with their Gal-9− counterparts (figure 2C,D). Although expression of PD-1 was associated with a significant reduction in IL-2, IFN-γ and TNF-α production by CD4+ T cells, coexpression of Gal-9 with PD-1 rendered CD4+ T cells to a more dysfunctional phenotype (figure 2C,D). Similar observations were made for tumor-infiltrating CD8+ T cells with significant levels of Gal-9 coexpressed with either PD-1 or TIGIT (figure 2E,F). Moreover, we found that Gal-9+ tumor-infiltrating CD8+ T cells exhibited significantly lower cytokine (IL-2, IFN-γ and TNF-α) producing capabilities and the coexpression of Gal-9 with PD-1 potentiated impaired cytokine production (figure 2G,H). As shown for TILs, we also found that the coexpression of Gal-9 with TIGIT resulted in a synergistic inhibitory effect on cytokine production by CD4+ and CD8+ T cells in the peripheral blood (online supplemental figure 3A,B). Similar observations were made when Gal-9 was coexpressed with PD-1 on both CD4+ and CD8+ T cells in the peripheral blood of patients with VAST (online supplemental figure 3C,D).

The upregulation of Gal-9 on TILs impair their cytokine production capabilities. (A and B) Representative flow cytometry plots and cumulative data of surface expression/coexpression of Gal-9 with TIGIT and PD-1 on CD4+ TILs at baseline. (C and D) Representative flow cytometry plots and cumulative data showing TNF-α, IFN-γ and IL-2 production by CD4+PD-1−Gal-9−, CD4+PD-1+Gal-9− and CD4+PD-1+Gal-9+ T cells after 6-hour stimulation with anti-CD3/CD28 in vitro. (E and F) Representative flow cytometry plots and cumulative data of surface expression/coexpression of Gal-9 with TIGIT and PD-1 on CD8+ TILs. (G and H) Representative flow cytometry plots and cumulative data showing TNF-α, IFN-γ and IL-2 production by CD8+PD-1−Gal-9−, CD8+PD-1+Gal-9− and CD8+PD-1+Gal-9+ T cells after 6-hour stimulation with anti-CD3/CD28 in vitro. Each dot represents a patient and mean±SEM, p value as indicated for each plot. Gal-9, galectin-9; PD-1, programmed cell death 1; TIGIT, TILs, tumor-infiltrating T cells.
The expression of Gal-9 by CD8+ T cells in the periphery is indicative of poor prognosis following immunotherapy
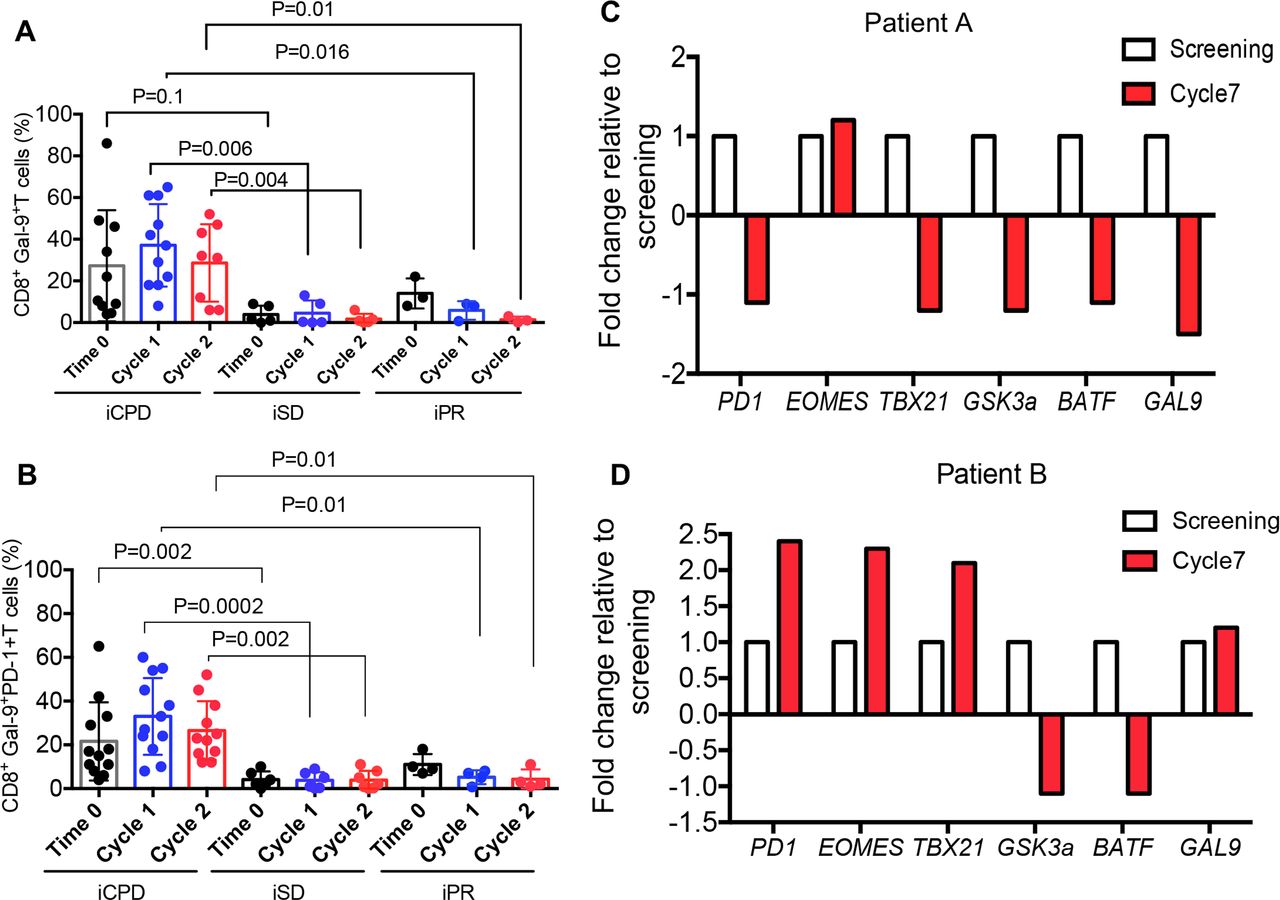
We used the standardized and validated guidelines according to the Response Evaluation Criteria in Solid Tumours34 to ensure a consistent framework for evaluating the clinical outcome of immunotherapy. Based on these criteria, we classified our patients into immune complete response, immune partial response (iPR), immune confirmed progressive disease and immune stable disease (iSD) categories. The Gal-9 expression on the peripheral blood T cells was measured at baseline, 2 weeks and 4 weeks after the initiation of avelumab treatment, and the clinical outcome was assessed 3–6 months later. Interestingly, we found patients with progressive disease had higher levels of Gal-9+CD8+ T cells in their peripheral blood compared with iSD and iPR groups (figure 3A). Similar results were observed for CD8+ T cells coexpressing Gal-9 and PD-1 (figure 3B). However, we did not observe a similar correlation with the frequency of Gal-9+CD4+ T cells in these patients (online supplemental figure 4A). Also, we observed downregulation of Gal-9 along with PD-1, TBX21, GSK3a and BATF mRNA levels in biopsy tissues of a partial responder patient (figure 3C) compared with a patient with progressive disease (patient B) (figure 3D). Gal-9 and PD-1 mRNA levels in biopsy corresponded with their expression in T cells in the partial responder, while biopsy PD-1 and Gal-9 mRNA levels did not correspond with surface expression in the patient with progressive disease (online supplemental file 4B,C).

The expression of Gal-9 on CD8+ T cells in the periphery is indicative of poor prognosis. (A) Cumulative data showing the percentages of Gal-9 +CD8+T cells in the PBMCs of patients at the baseline (time 0), cycles 1 and 2, evaluated 12 weeks later as immune confirmed progressive disease (iCPD), immune stable disease (iSD) and immune partial response (iPR). (B) Data showing changes in mRNA expression levels for PD1, EOMES, TBX21, GSK3a, BATF and GAL-9 genes in biopsy sample from an iPR patient at screening time compared with the cycle 7 (3.5 months) post-treatment. (C) Data showing changes in mRNA expression levels for PD1, EOMES, TBX21, GSK3a, BATF and GAL-9 genes in biopsy sample from an iCPD patient at screening time compared with the cycle 7 (3.5 months) post-treatment. Data are representative of two samples. Each dot represents a patient and mean±SEM, p value as indicated for each data set. PBMCs, peripheral blood mononuclear cells.
Twelve-week disease response assessment following treatment with oral valproate and anti-PD-L1 immunotherapy showed a dramatic response to the therapy in an HPV-associated carcinoma of the penis (figure 4A–D). Interestingly, this patient had elevated expression level of Gal-9 on CD8+ T cells at the baseline but throughout the study started to decline. In contrast, another patient had lower Gal-9+CD8+ T cells at the baseline but started to increase after the initiation of treatment (figure 3E), which was associated with progressive disease with respect to enlargement of apical lung metastasis and hepatic metastasis (figure 4F–I).
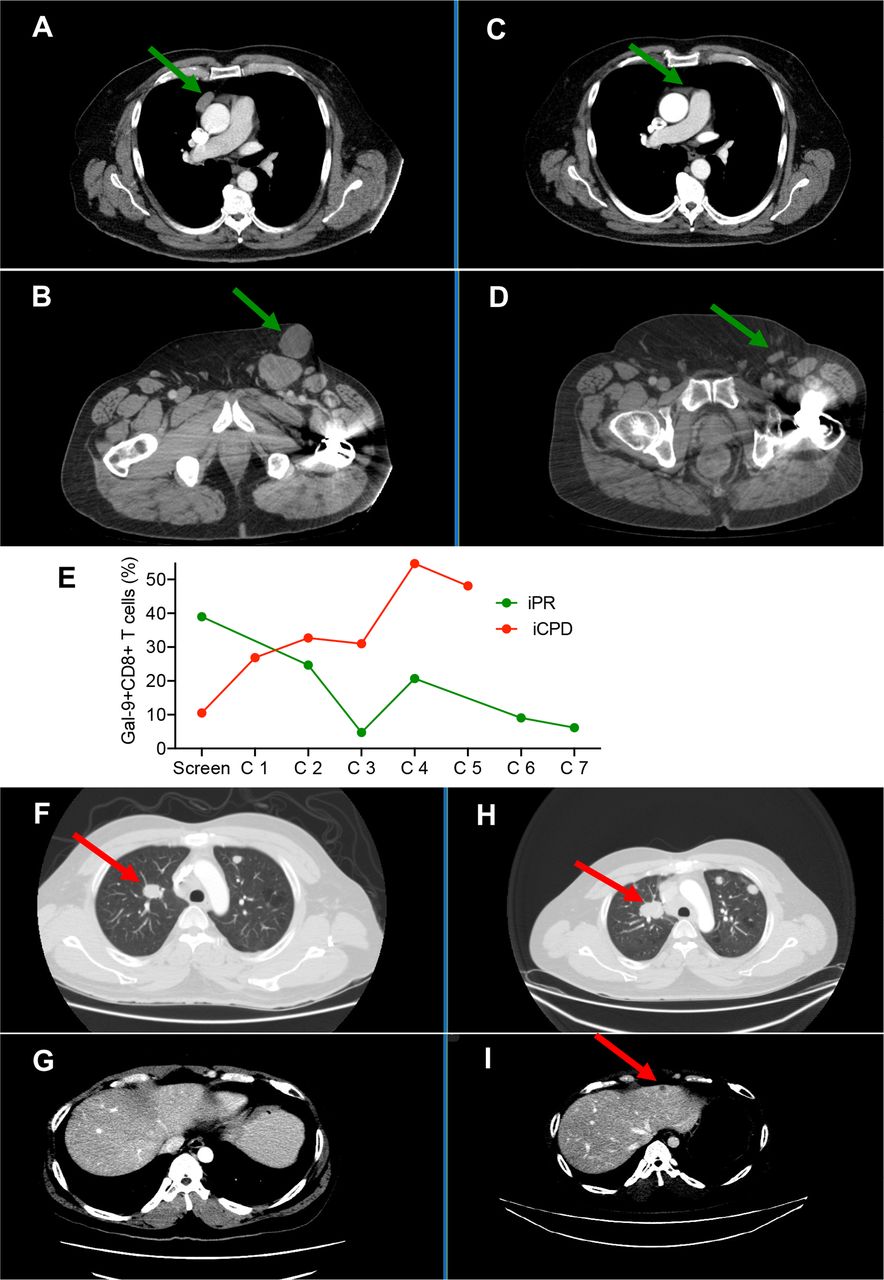
CT scan depicts a 12-week disease response assessment following treatment with oral valproate and anti-PD-L1 immunotherapy. A and B panels showing baseline tumor assessment in a 69-year-old man with HPV-related carcinoma of the penis. C and D panels indicating a dramatic response to therapy is observed with respect to a pericardial soft tissue mass (C) and bulky inguinal lymphadenopathy (D). E panel showing % of Gal-9+ CD8+ T cells in a partial responder versus a patient with confirmed progressive disease. F and G panels showing baseline tumor assessment in a 39-year-old man with EBV-related nasopharyngeal carcinoma. (H and I) Progressive disease is noted with respect to the enlargement of apical lung metastasis (H) and the development of hepatic metastatic disease (I). Gal-9, galectin-9; HPV, human papillomavirus.
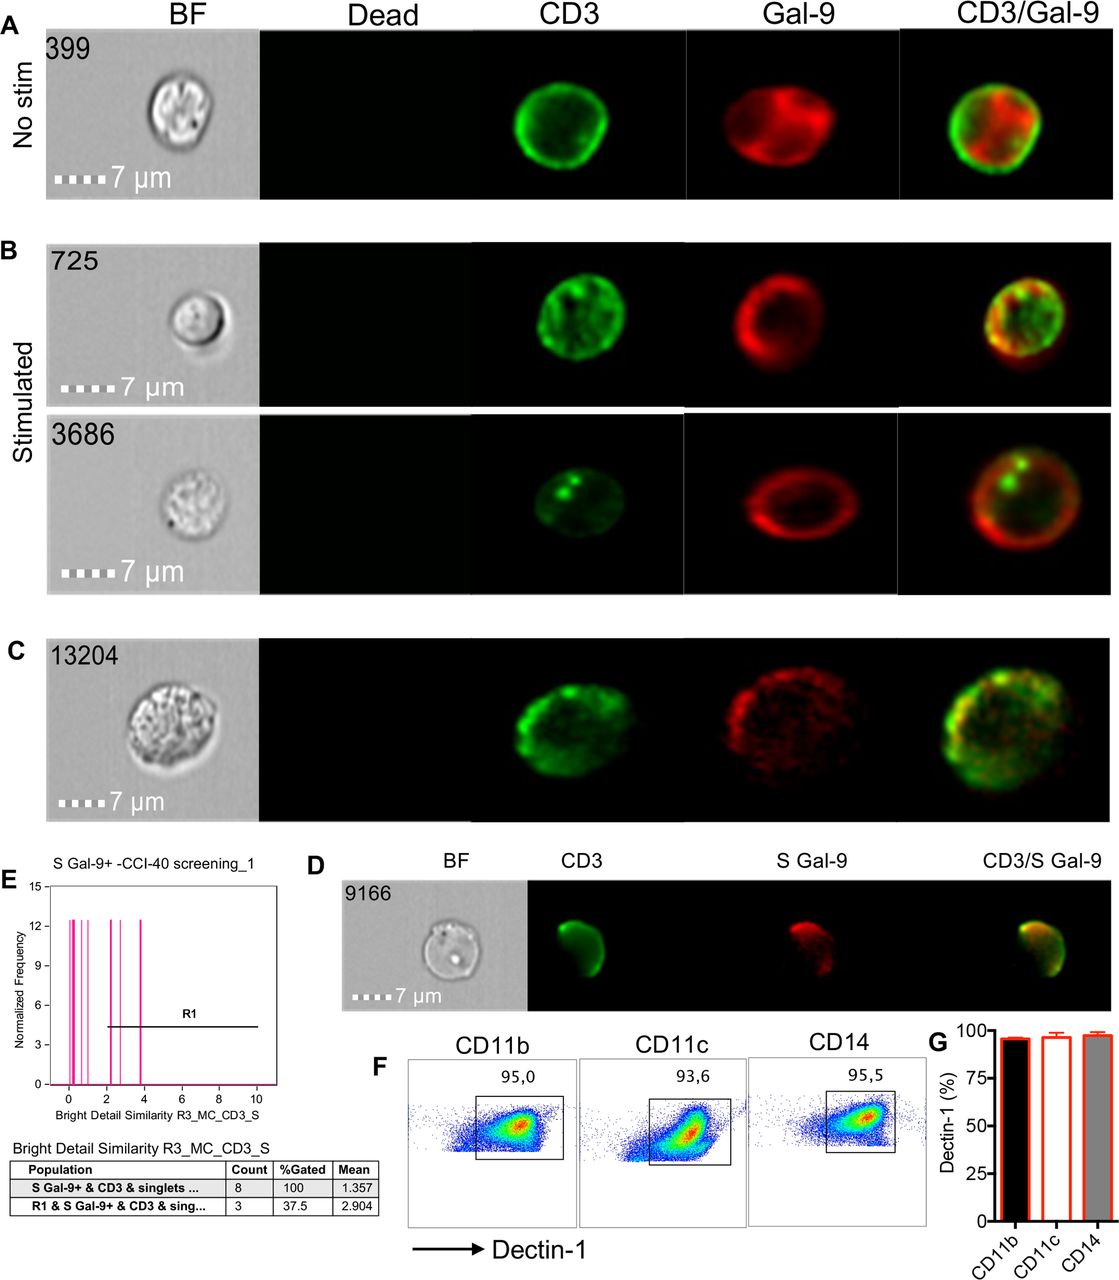
Intracellular Gal-9 is recruited to the surface following T cell activation
Although Gal-9 is abundant in the cytosol and nucleus, resting T cells express very low levels of surface Gal-9.14 To determine whether chronic stimulation in the context of cancer results in the recruitment of Gal-9 to the surface of T cells, we compared Gal-9 expression in resting versus activated T cells with anti-CD3/CD28 or PMA/ionomycin in vitro. We observed that Gal-9 was expressed dispersedly in the cytosol of unstimulated cells (figure 5A) but on stimulation was recruited to the surface of T cells (figure 5B). These observations were recapitulated in T cells obtained from the peripheral blood of our patient cohort (figure 5C). In particular, partial colocalization of Gal-9 with CD3 was observed (figure 5D,E), which is consistent with a recent article showing recruitment of Gal-9 to immune synapses in activated T cells.23 We also found that the expression of Gal-9 by stimulated T cells corresponded with high expression of the kinases, Lck and ZAP70 (online supplemental figure 4D). Subsequently, this translated to lower cytokine expression (TNF-α and IFN-γ) in both CD4+ and CD8+ T cells (online supplemental figure 4E). Further analysis by image stream, revealed the colocalization of Gal-9 with ZAP70 at the cell surface of stimulated patient’s T cells, in contrast to unstimulated cells and Gal-9 negative T cells (online supplemental figure 5A,B). However, unlike ZAP70, Gal-9 did not colocalize with Lck (online supplemental figure 5C,D). These observations suggest that endogenously expressed Gal-9 following T cell activation may get translocated into the cell surface and can modulate T cell functions by interacting with downstream signaling mediators. In addition to T cell-bound Gal-9 expression, we observed significantly elevated levels of soluble Gal-9 in the plasma of patients with VAST compared with HCs at the screening time (online supplemental figure 5E). However, we did not find any association between plasma Gal-9 levels with the treatment outcome. In some patients, treatment reduced Gal-9 levels but in others increased. Based on these observations, we cannot conclude any specific changes in soluble Gal-9 levels post-treatment with valproate and/or avelumab in our cohort.

Translocation of Gal-9 from the cytosol to the membrane following T cells activation. (A) Image stream plots of intracellular Gal-9 localization in cytosol in unstimulated (no stim) T cells. (B) Image stream plots of Gal-9 localization on the cell membrane following stimulation of T cells with anti-CD3/CD28 overnight. (C) Representative image stream of Gal-9 expression on CD3 T cells from a cancer patient without stimulation in vitro. (D) Plot showing colocalization of CD3 and surface (S) Gal-9 on T cells of a patient with cancer. (E) Cumulative data showing % colocalization of Gal-9 and CD3. (F) Representative plots and (G) cumulative data showing the expression of Dectin-1 on CD11b+, CD11c+ and CD14+ cells in a patient with VAST. Gal-9, galectin-9; VAST, virus-associated solid tumor.
Elevated levels of Dectin-1 on antigen-presenting cells (APCs) of patients with VAST
Since the interaction of Gal-9:Dectin-1 is reported to be associated with T cell suppression,15 we decided to measure the expression levels of Dectin-1 on APCs in patients with VAST. We found that Dectin-1 was highly expressed on CD14+, CD11b+ and CD11+ cells in patients with VAST (figure 5F,G) and similarly in HCs (online supplemental figure 5F). Although APCs in HCs do express similar levels of Dectin-1, T cells in HCs have negligible expression of Gal-9. These observations suggest that the interaction of Gal-9+ T cells with APCs may serve as a potential immunosuppression mechanism in patients with VAST, which merits further investigations.
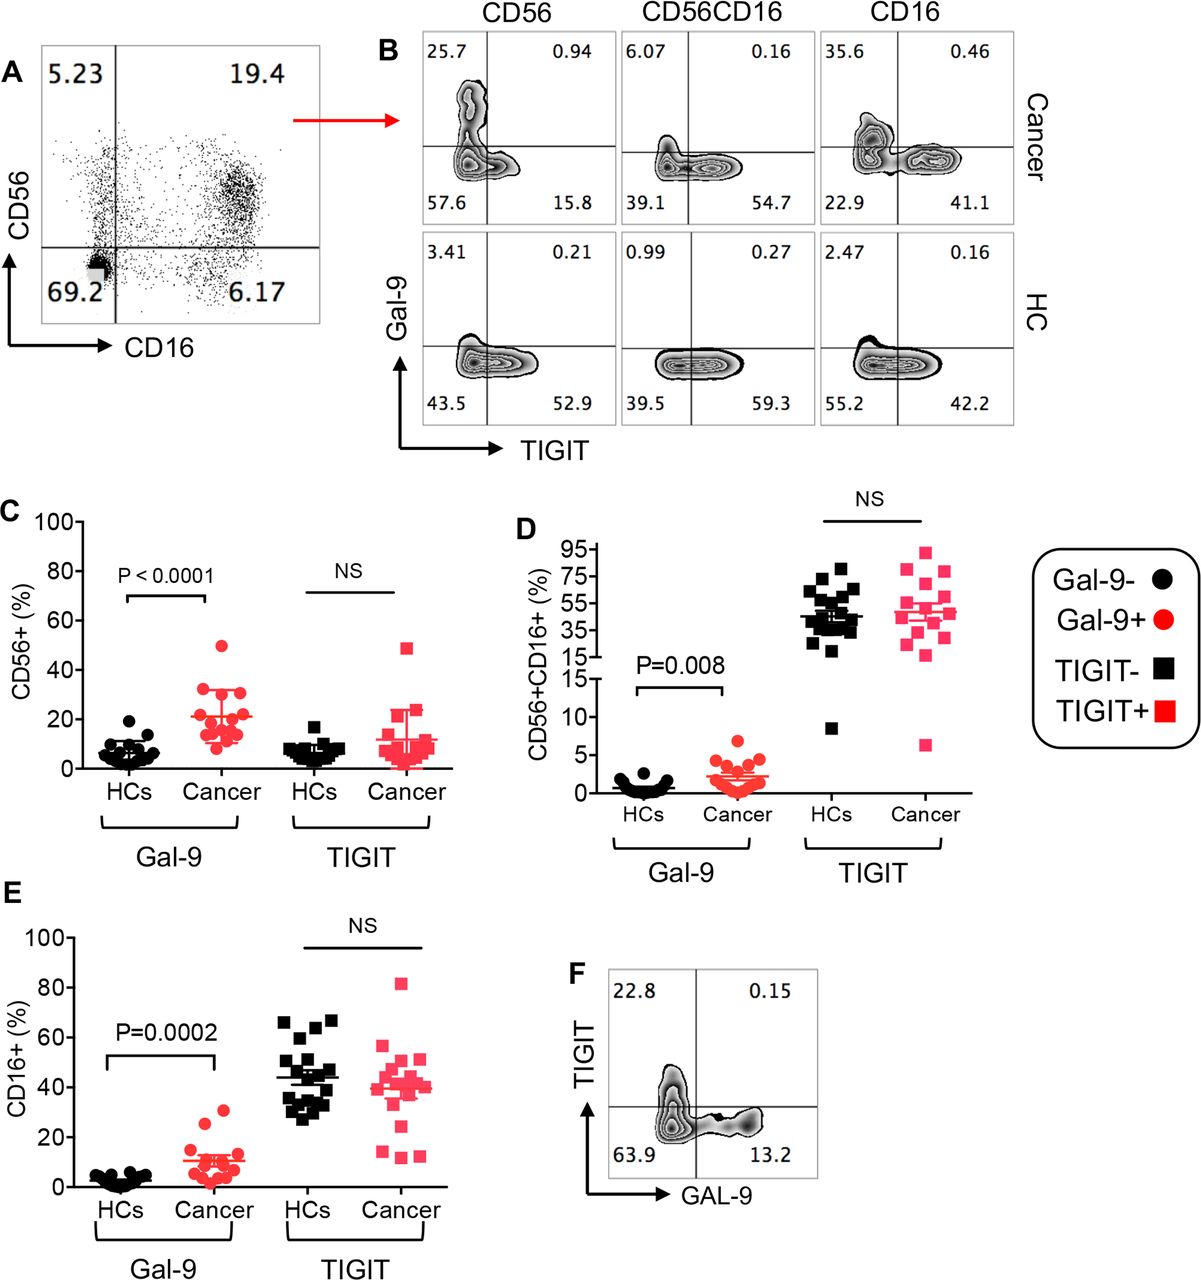
Upregulation of Gal-9 but not TIGIT on NK cells in patients with VASTs
We have recently reported that Gal-9 was expressed on the surface of NK cells in HIV-infected individuals compared with HCs.24 To investigate whether this was the case in our cohort, we examined the expression of Gal-9 on CD56+CD16−, CD16+CD56+ and CD16+CD56− NK subpopulations (figure 6A) at the baseline and prior to the initiation of treatment. We observed significant upregulation of Gal-9 on all three NK cell subpopulations in our patient cohort compared with HCs (figure 6B–E). In contrast, the percentages of TIGIT expressing NK cell subpopulations in patients with cancer were similar to HCs (figure 6B–E). Finally, we did not find significant coexpression of Gal-9+ and TIGIT+ on NK cells, indicating that these are distinct NK cell subpopulations (figure 6F). These results indicate the differential effects of virus-associated solid tumors on the expression of Gal-9 and TIGIT by NK cells.

Frequency of NK cell subpopulations and expression levels of Gal-9 and TIGIT on NK cells. (A) Representative plot of NK cell subpopulations (CD56+, CD56+CD16+ and CD16+) in PBMCs of a patient with cancer. (B) Representative plots showing expression of Gal-9 and TIGIT on different NK cell subpopulations in a patient with cancer versus a healthy control (HC). (C) Cumulative data showing percentages of CD56+ NK cells expressing either Gal-9 or TIGIT in patients with cancer versus HCs. (D) Cumulative data showing percentages of CD56+CD16+ NK cells expressing either Gal-9 or TIGIT in patients with cancer versus HCs. (E) Cumulative data showing percentages of CD16+ NK cells expressing either Gal-9 or TIGIT in patients with cancer versus HCs. (F) Representative plot showing coexpression of TIGIT and Gal-9 on NK cells. Each dot represents a patient and mean±SEM, p value as indicated for each data set or not significant (NS). Gal-9, galectin-9; TIGIT, T cell immunoglobulin and ITIM domain.
Gal-9 expressing NK cells dichotomous to TIGIT exhibit impaired cytotoxic molecules but increased IFN-γ expression
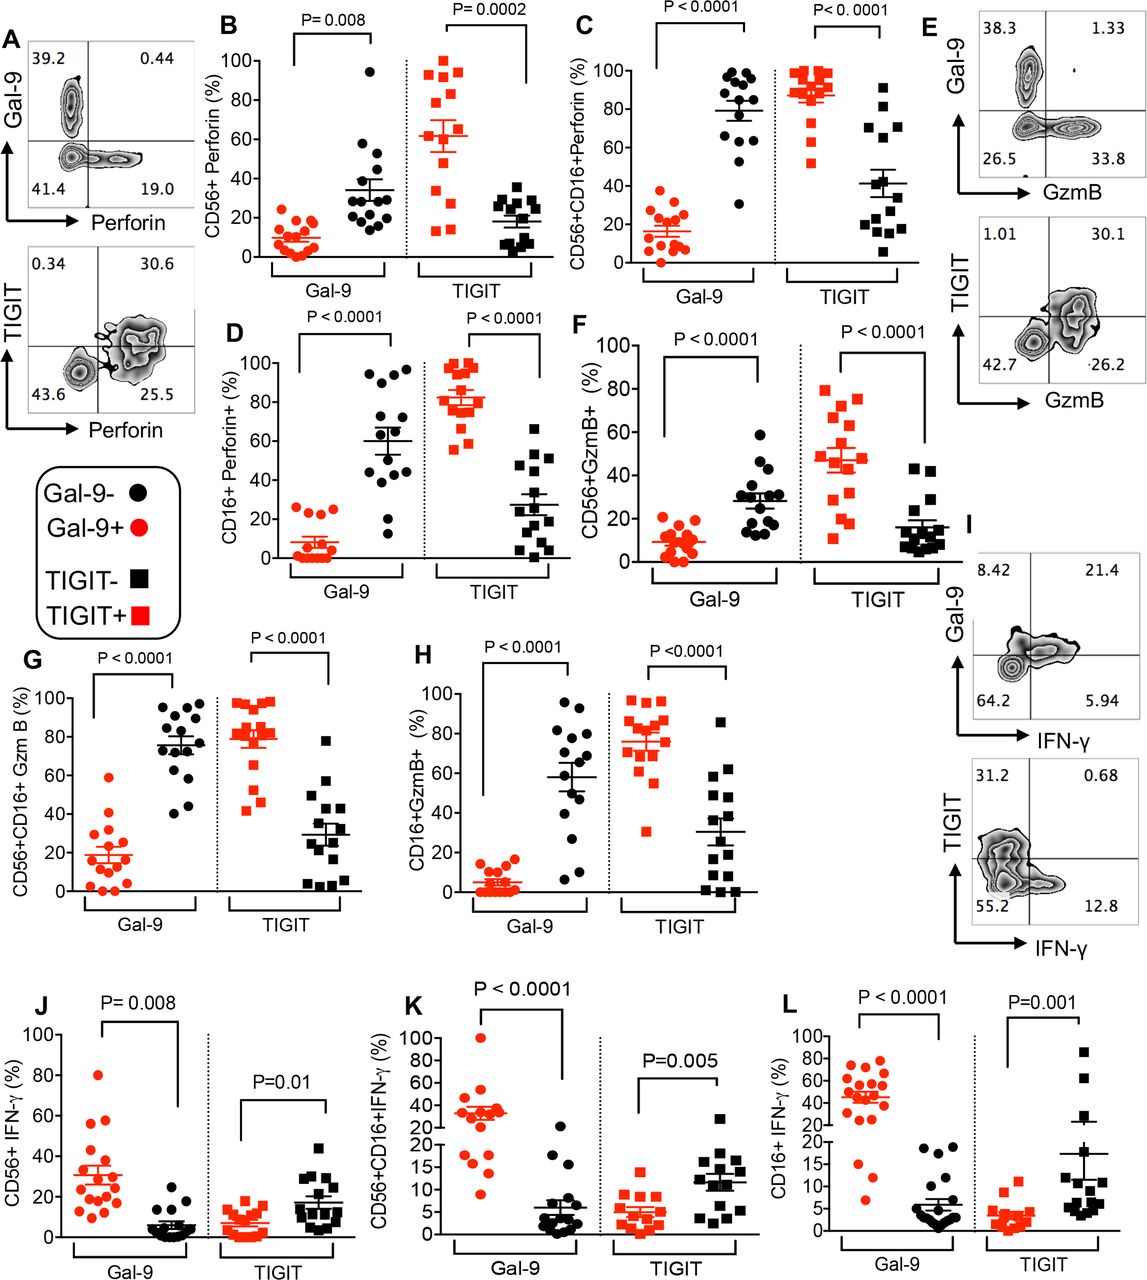
We found that Gal-9 expression was associated with impaired perforin and GzmB expression in different NK cell subpopulations (CD56+, CD56+CD16+ and CD16+) (figure 7A–D) and (figure 7E–H), respectively. In contrast, the expression of TIGIT by NK cells was associated with significantly higher levels of perforin and GzmB expression (figure 7A–D and figure 7E–H, respectively). However, Gal-9+ NK cells expressed higher levels of IFN-γ compared with their TIGIT+ counterparts (figure 7I–L). Our results suggest a dichotomy in the effector functions of Gal-9 and TIGIT-expressing NK cells in these patients.
Gal-9 expressing NK cells dichotomous to TIGIT exhibit impaired cytotoxic molecules but increased IFN-γ expression. (A) Representative flow cytometry plot showing expression of perforin in Gal-9+ versus TIGIT+ CD56+ NK cells. (B–D) Cumulative data showing % perforin expression in Gal-9+ versus Gal-9− and TIGIT+ versus TIGIT− CD56+ NK cells (B), CD56+ CD16+ NK cells (C) and CD16+ NK cells (D) in our cancer cohort patients. (E) Representative flow cytometry plot showing expression of GzmB in Gal-9+ versus TIGIT+ CD56+ NK cells. (F–H) Cumulative data showing % GzmB expression in Gal-9+ versus Gal-9− and TIGIT+ versus TIGIT− CD56+ NK cells (F), CD56+ CD16+ NK cells (G) and CD16+ NK cells (H) in our cancer cohort patients. (E) Representative flow cytometry plot showing expression of GzmB in Gal-9+ versus TIGIT+ CD56+ NK cells. (F–H) Cumulative data showing % GzmB expression in Gal-9+ versus Gal-9− and TIGIT+ versus TIGIT− CD56+ NK cells (F), CD56+ CD16+ NK cells (G) and CD16+ NK cells (H) in our cancer cohort patients. (I) Representative flow cytometry plot showing expression of IFN-γ in Gal-9+ versus TIGIT+ CD56+ NK cells. (J–L) Cumulative data showing % IFN-γ expression in Gal-9+ versus Gal-9− and TIGIT+ versus TIGIT− CD56+ NK cells (J), CD56+ CD16+ NK cells (K) and CD16+ NK cells (L) in our cancer cohort patients. Each dot represents a patient and mean±SEM, p value as indicated for each data set. Gal-9, galectin-9; TIGIT, T cell immunoglobulin and ITIM domain.
Immunotherapy did not change Gal-9 expression on NK cells in patients with VASTs
We decided to determine whether immunotherapy modulates Gal-9 and TIGIT expression on NK cells. However, we did not find a significant difference in the pattern of Gal-9 expression on different NK cell subpopulations even up to seven cycles of treatment (online supplemental figure 6A–C). Although there was no substantial change in the expression of TIGIT by CD56+ NK cells throughout the seven treatment cycles (online supplemental figure 6D), there was a significant increase in the expression of TIGIT by the CD56+CD16+ subpopulation of NK cells at cycle two compared with pretreatment, which significantly dropped at cycle 4 (online supplemental figure 6E) but remained constant afterwards. Besides, the expression pattern of TIGIT by the CD16+ subpopulation of NK cells remained unchanged except for a significant increase at cycle seven compared with cycle 4 (online supplemental figure 6F).
The dichotomy phenotype of Gal-9 and TIGIT expressing NK cells persisted throughout the treatment with anti-PD-L1 therapy in patients with VASTs
We further investigated the functionality of Gal-9+ and TIGIT+ NK cells following treatment with anti-PD-L1 antibody. As shown in online supplemental figure 6G,H, Gal-9+CD16+ NK cells exhibited impaired GzmB expression, which was dichotomous to TIGIT+CD16+ NK cells. In addition, we observed that Gal-9+CD56+ NK cells expressed high levels of IFN-γ compared with TIGIT+CD56+ NK cells (online supplemental figure 6I,J). The same pattern was noted for CD16+CD56+ and CD16+ NK cell subpopulation. We also observed a dichotomy for perforin expression by Gla-9+ and TIGIT+ NK cells compared with their negative counterparts (online supplemental figure 7A–D).
Discussion
Here, we report that both CD4+ and CD8+ T cells from the peripheral blood and TILs of patients with VASTs express elevated levels of surface Gal-9. More importantly, the expression of Gal-9 was associated with impaired T cells phenotype in both the peripheral and TILs. We also found significant elevation of soluble Gal-9 in the plasma of patients with VAST. The secreted Gal-9 has been associated with NK and T cells impairments in acute myeloid leukemia cells.35 The simultaneous coexpression of different coinhibitory receptors on CD8+ T cells correlates with the level of CD8+ T cell exhaustion.1 In particular, coexpression of PD-1 and TIM-3 defines highly dysfunctional T cells.36 In agreement with this, we found that Gal-9+ PD-1+ TILs have lower cytokine production ability compared with TILs expressing only PD-1. In parallel with previous reports,1 37 we saw a dramatic reduction in the production of cytokines by TILs expressing PD-1, but the coexpression of Gal-9 with PD-1 provides a synergistic inhibitory effect. We observed coexpression of Gal-9 with either PD-1 or TIGIT expressing T cells dictated a more impaired T cell phenotype in the peripheral blood as well. Although coexpression of Gal-9 with other inhibitory receptors (eg, PD-1 and TIGIT) provides a synergistic inhibitory signal, Gal-9+ T cells appear to be more heterogeneous in patients with VAST compared with patients with HIV.25 For instance, PD-1+ T cells often coexpress Gal-9 in HIV-infected individuals, but this was not the case for T cells in patients with VAST either in the periphery or TILs. Gal-9+ T cells appear to be terminally exhausted in patients with HIV as demonstrated with the lack of effector functions,25 but Gal-9+ T cells in patients with VAST still retained some effector functions (eg, TNF-α secretion). We have already shown that the blockade of the Gal-9 pathway cannot enhance T cell responses ex vivo,25 which suggests an intrinsic defect rather than cell–cell interaction explains their impaired phenotype. This agrees with a previous study showing that the effects of Gal-9:TIM-3 on NK cells cannot be revived in the presence of anti-TIM-3 blocking antibody.38 Despite the fact that often Gal-9+ was coexpressed with PD-1, blockade of the PD-1 pathway alone or in combination with the Gal-9 pathway could not reverse their exhausted phenotype.25 This suggests that the upregulation of Gal-9 on T cells is associated with a more terminally differentiated subset of exhausted T cells,24 25 which cannot be ‘reinvigorated’ by antibody blockade.39
It should be noted, although CD8+ T cells exhaustion is associated with cancer progression, it is unclear whether the upregulation of Gal-9 on T cells leads to disease progression or whether this is a protective host mechanism to prevent collateral damage due to hyperimmune activation in the context of cancer. Gal-9 appears to have a regulatory role and mice lacking Gal-9 generate more robust antiviral T cell response and control viral infection more efficiently than controls.14 Additionally, exogenous Gal-9 via the upregulation of FOXP3 and conversion of naïve T cells into Tregs mediates immunoregulation.21 The identification of Gal-9 expressing T cells in VASTs as a novel mechanism of T cell exhaustion constitutes an important prerequisite for designing studies aimed at dissociating the relative contributions of Gal-9 in T cell dysfunction versus other roles such as immune regulation. Our observations provide a novel underlying mechanism for the well-established concept of defects in TILs in patients with HNSCC.40 Although we were unable to further characterize Gal-9+ T cells in patients with VAST, we have already shown that these cells mostly represent effector T cells (TEFF) phenotype (CD45RA+CD45RO-CD62L-CD27-) in HIV-infected individuals25 and exhibit higher expression of t-bet, which is associated with terminal differentiation of TEFF during the late phase of immune response.41 Terminally differentiated TEFF degranulate rapidly in response to stimulation and produce a high amount of TNF-α and IFN-γ.42 Similarly, Gal-9+ CD8+ T cells from patients with HIV express more CD107a ex vivo and have higher TNF-α and IFN-γ genes.25 There is a possibility that Gal-9 expressing T cells are already highly activated in vivo and unable to become more activated in vitro. Therefore, chronic antigenic stimulation in the course of cancer derives the formation of exhausted T cells from terminally differentiated TEFF.43 Our findings suggest that Gal-9+ T cells may represent a subset of terminally exhausted TEFF cells as the result of chronic antigenic stimulation.25 Moreover, a recent study has reported that Gal-9 on myeloid cells ligates Dectin-1 in the PDA resulting in tolerogenic macrophage programming and immune suppression.15 Although in this study the interaction of Gal-9 with Dectin-1 was not investigated, we found that Dectin-1 was highly expressed on APCs of patients with VAST. This suggests that Gal-9+ T cells via interaction with Dectin-1 in the periphery or TME may modulate the function of APCs (eg, DCs and macrophages). Such a mechanism provides another potential role for Gal-9 in adaptive immune suppression, which merits further investigations.
An important question that remained to be addressed is why Gal-9 gets upregulated on a subset of T cells in patients with VAST? Our observations indicate the translocation of Gal-9 from the cytosol to the surface of T cells following stimulation in vitro. We believe persistent TCR stimulation is a potential factor for Gal-9 upregulation on T cells either in the periphery or TILs. This is in line with a recent study showing Gal-9 recruitment to the immune synapses following TCR stimulation.23 Colocalization of Gal-9 with CD3 in patients with VAST reinforces this possibility. The association of Gal-9 overexpression on T cells with poor prognosis in patients with VAST indicates an important role for this inhibitory ligand in immunotherapy. This emphasizes the heterogeneity of cellular and molecular components of TILs in patients with VAST.44 45 In particular, the association of lower Gal-9 expression on T cells with a good treatment outcome suggests a potentially detrimental role for this lectin in patients on immunotherapy.
Moreover, we noted the upregulation of Gal-9 on NK cells in patients with VAST. Although the frequency of NK cells remained unchanged despite the immunotherapy regimen, Gal-9+ NK cells exhibited an impaired phenotype in terms of cytotoxic ability. This may provide another evidence for the immunodeficient tumors in VAST. Although the role of TIGIT on NK cells in patients with VAST is not well studied, it has been reported that the upregulation of TIGIT on NK cells in patients with colon cancer represents an exhausted phenotype13 and via interaction with its ligands (PVR and PVRL2) inhibits NK cell cytotoxicity.46 In contrast to these studies, we did not observe upregulation of TIGIT on NK cells in VASTs compared with NK cells from cancer-free individuals. Strikingly, TIGIT+ NK cells in patients with VAST appear to have a greater cytotoxicity ability as determined by the expression of GzmB and perforin. Similar observations have been made for TIGIT+ NK cells in HIV-infected individuals.24 As such, TIGIT+ NK cells expressed significantly higher GzmB and perforin but lower IFN-γ dichotomous to Gal-9+ NK cells in patients with VAST.
Our data demonstrate that Gal-9-expressing T and NK cells are associated with the functional exhaustion of T and NK cells in the periphery and TILs of patients with VAST. More importantly, the higher frequency of Gal-9-expressing CD8+ T cells in the periphery of patients was associated with a poor prognosis and tumor progression. Additionally, the coexpression of Gal-9 with PD-1 and/or TIGIT on T cells in the periphery or TILs reinforced lack of effector functions and enhanced exhaustion. Given that higher Gal-9-expressing CD8+ T cells was associated with poor prognosis even in the presence of avelumab raises the possibility that anti-PD-1/PD-L1 might not reverse the dysfunctionality of Gal-9+ T cells in tumor settings. Similar speculation might be the case of anti-CTLA-4 antibody treatment since Gal-9 was not coexpressed with CTLA-4 in patients with VAST.
It will be intriguing in future studies to explore strategies to prevent Gal-9 upregulation on T cells as an additive or a synergistic effect to immune checkpoint blockers. More importantly, further studies are required to determine the role of Gal-9 in T cell function and immunotherapy outcome in different types of cancer. Melanoma and non-small cell lung cancer with high somatic mutation rate and subsequently greater neoantigen generation, to stimulate antitumor immunity, have better response and durable clinical outcomes with immune checkpoint blockades (ICBs).47 Among solid tumors, these cancers represent the highest levels of tumor immune infiltrates as the quantity and quality of TILs are associated with prognosis.48 VASTs have received interest for ICBs, but resistance is not uncommon, and therefore understanding the immunological response of these patients to ICBs is crucial for enabling clinicians in selecting patients that may benefit from immunotherapy.
Acknowledgments
The authors would like to thank the University of Alberta Faculty of Medicine and Dentistry’s Flow Cytometry Facility, which has received financial support from the faculty of Medicine and Dentistry and the Canadian Foundation for Innovation awards to contributing investigators. We would also like to thank patients with cancer and healthy individuals for their invaluable contribution in this study.
References
Supplementary materials
Supplementary Data
This web only file has been produced by the BMJ Publishing Group from an electronic file supplied by the author(s) and has not been edited for content.
Footnotes
Contributors IO performed most of the cancer-related studies, analyzed the data and wrote part of the manuscript. LX performed some of the cancer-related studies. MM performed NK cell-related studies. PP provided support. JWW designed the cancer study phase II trial and recruited the patients. SE conceived the original research idea, designed and supervised all of the research, assisted in data analysis and wrote the manuscript. All authors read the article and provided comments.
Funding This work was supported by the Canadian Institutes of Health Research (CIHR), a CIHR New Investigator Salary Award (360929) and a CIHR Foundation Scheme Grant (353953) (all to SE). In addition, Alberta Cancer Foundation supported the phase II cancer study (to JWW and SE).
Competing interests None declared.
Patient consent for publication Not required.
Ethics approval This study was approved by the Health Research Ethics Board of Alberta (HREBA # CC-17–0374). Also, the research ethics boards at the University of Alberta approved blood collection from healthy controls and melanoma patients with protocol # Pro00063463, and written informed consent was obtained from the study participants.
Provenance and peer review Not commissioned; externally peer reviewed.
Data availability statement All data relevant to the study are included in the article or uploaded as supplementary information. All data are included.
Supplemental material This content has been supplied by the author(s). It has not been vetted by BMJ Publishing Group Limited (BMJ) and may not have been peer-reviewed. Any opinions or recommendations discussed are solely those of the author(s) and are not endorsed by BMJ. BMJ disclaims all liability and responsibility arising from any reliance placed on the content. Where the content includes any translated material, BMJ does not warrant the accuracy and reliability of the translations (including but not limited to local regulations, clinical guidelines, terminology, drug names and drug dosages), and is not responsible for any error and/or omissions arising from translation and adaptation or otherwise.