Article Text

Abstract
Background Antitumor immunity is highly heterogeneous between individuals; however, underlying mechanisms remain elusive, despite their potential to improve personalized cancer immunotherapy. Head and neck squamous cell carcinomas (HNSCCs) vary significantly in immune infiltration and therapeutic responses between patients, demanding a mouse model with appropriate heterogeneity to investigate mechanistic differences.
Methods We developed a unique HNSCC mouse model to investigate underlying mechanisms of heterogeneous antitumor immunity. This model system may provide a better control for tumor-intrinsic and host-genetic variables, thereby uncovering the contribution of the adaptive immunity to tumor eradication. We employed single-cell T-cell receptor (TCR) sequencing coupled with single-cell RNA sequencing to identify the difference in TCR repertoire of CD8 tumor-infiltrating lymphocytes (TILs) and the unique activation states linked with different TCR clonotypes.
Results We discovered that genetically identical wild-type recipient mice responded heterogeneously to the same squamous cell carcinoma tumors orthotopically transplanted into the buccal mucosa. While tumors initially grew in 100% of recipients and most developed aggressive tumors, ~25% of recipients reproducibly eradicated tumors without intervention. Heterogeneous antitumor responses were dependent on CD8 T cells. Consistently, CD8 TILs in regressing tumors were significantly increased and more activated. Single-cell TCR-sequencing revealed that CD8 TILs from both growing and regressing tumors displayed evidence of clonal expansion compared with splenic controls. However, top TCR clonotypes and TCR specificity groups appear to be mutually exclusive between regressing and growing TILs. Furthermore, many TCRα/TCRβ sequences only occur in one recipient. By coupling single-cell transcriptomic analysis with unique TCR clonotypes, we found that top TCR clonotypes clustered in distinct activation states in regressing versus growing TILs. Intriguingly, the few TCR clonotypes shared between regressors and progressors differed greatly in their activation states, suggesting a more dominant influence from tumor microenvironment than TCR itself on T cell activation status.
Conclusions We reveal that intrinsic differences in the TCR repertoire of TILs and their different transcriptional trajectories may underlie the heterogeneous antitumor immune responses in different hosts. We suggest that antitumor immune responses are highly individualized and different hosts employ different TCR specificities against the same tumors, which may have important implications for developing personalized cancer immunotherapy.
- head and neck neoplasms
- immune evation
- immunologic techniques
- receptors
- antigen
- lymphocytes
- tumor-infiltrating
This is an open access article distributed in accordance with the Creative Commons Attribution Non Commercial (CC BY-NC 4.0) license, which permits others to distribute, remix, adapt, build upon this work non-commercially, and license their derivative works on different terms, provided the original work is properly cited, appropriate credit is given, any changes made indicated, and the use is non-commercial. See http://creativecommons.org/licenses/by-nc/4.0/.
Statistics from Altmetric.com
- head and neck neoplasms
- immune evation
- immunologic techniques
- receptors
- antigen
- lymphocytes
- tumor-infiltrating
Introduction
Antitumor immune responses can be highly heterogeneous—some hosts can eradicate their tumors, whereas others succumb to tumor progression. However, the mechanisms underlying the heterogeneity of antitumor immunity remain elusive. A better understanding of such mechanisms may profoundly impact the development of more effective personalized cancer immunotherapy. Prior studies have suggested potential mechanisms dictating heterogeneous antitumor immune responses, which include tumor-intrinsic heterogeneity (eg, different oncogenic drivers, different differentiation stage of cancers) and environmental factors (eg, host microbiome).1–3 However, it remains poorly understood whether intrinsic differences in the T cell receptor (TCR) repertoire of individuals can influence the outcome of antitumor immunity by affecting the frequency and/or variety of tumor reactive CD8 tumor-infiltrating lymphocytes (TILs).
Head and neck cancer is the sixth most common cancer type, manifesting primarily (90% of cases) as squamous cell carcinoma (HNSCC).4 5 Human HNSCC samples exhibit a wide range of mutational burden and infiltration of T cells and other immune cells.6–9 Immune checkpoint inhibitors (ICIs), such as antibodies against programmed death-1 (PD-1), have been approved for HNSCCs but efficacy varies considerably in different patients and the response rate remains relatively low.10–17 Variable responses to therapies may be partially attributed to the heterogeneous antitumor immune responses in patients with HNSCC, evidenced by a highly variable level of T cell infiltration before treatment.18 19 However, it is very difficult to model such heterogeneity in human patients due to many uncontrollable variables including completely different genetic backgrounds, distinct immune systems and vastly different tumors. Thus, a well-controlled mouse model with appropriate heterogeneity is needed to investigate mechanistic differences in antitumor immune responses in different individuals.
The commonly used syngeneic mouse tumor models, for example, B16 melanoma,20 21 MC38 colon cancer, 4T1 breast cancer22 or LY2 or B4B8 squamous cell carcinomas (SCCs),23–25 grow aggressively in recipient mice on tumor inoculation, thereby failing to demonstrate heterogeneous antitumor immune responses. In addition, prior model systems tend to focus on tumor-intrinsic mechanisms that were associated with heterogeneous antitumor responses.1 26 However, with confounding variables investigated at once (eg, different oncogenic mutations), many aspects of the tumor and tumor microenvironment (TME) may vary; it becomes difficult to dissect contributions of the immune system. Hence, we need a model system that could largely minimize the effects of tumor-intrinsic factors, potentially allowing us to identify the fundamental principles shared between human and mouse that govern the heterogeneous antitumor immune responses in different individuals. However, such a model system has not been available until now.
CD8 T cells have been extensively studied in the context of antitumor immune responses due to their tumor killing capacity and strong correlation with patient survival and ICI response.27–29 Single cell analysis of CD8 TILs in patients with cancer has been extensively reviewed.30–32 However, the significant differences between patients and their tumors have made it difficult to determine common fundamental principles that govern antitumor immune responses. In mouse tumor models, many studies examined tumor antigen-specific CD8 T cell responses by focusing on immunodominant antigens such as AH1 or PMEL33 34 and employing the corresponding transgenic T cells such as 1D4 and Pmel-1.35 36 Alternatively, to study tumor-specific CD8 T cell responses, a known antigen such as ovalbumin (OVA) was introduced into tumors and the corresponding antigen-specific OT-I T cells were transferred into recipients.37 However, such studies cannot address how the same T cell clone behaves in a different TME or how the variety of different T cell clones eventually shapes the outcome of antitumor immunity. Under physiological situations, antitumor immune responses are mediated by polyclonal T cells that may recognize different tumor antigens with various affinities. However, it remains poorly defined how polyclonal CD8 T cell-mediated antitumor immune responses occur at a single-cell resolution in a well-controlled model system.
TCRs are generated via V(D)J recombination,38 39 a somatic DNA recombination process occurring in a random and stochastic manner in different individuals. TCRs of most conventional T cells are composed of an alpha (α) chain and a beta (β) chain (encoded by TRA and TRB, respectively), linked by disulfide bonds. T cells can be grouped into different ‘clonotypes,’ which have unique TCRα and TCRβ chains with distinct V(D)J gene segments and complementarity-determining region 3 (CDR3) that encompasses the highly divergent junction of V(D)J recombination and determines TCR specificity. It has been difficult to study the formation and diversity of the human TCR repertoire due to limited access to human thymus samples and non-feasibility to manipulate variables in vivo. Others have generated humanized mouse models by implanting immunodeficient mice with human hematopoietic stem cells (HSCs) and human thymus from the same or different donors.40 Despite animals having identical HSCs, thymi, genetic background and environment, the formation of human TCR repertoires is largely stochastic and TCR repertoires can be totally divergent.40 In short, this means that each individual, including identical twins, has an almost completely different TCR repertoire. However, it remains poorly understood how stochastic generation of the TCR repertoire and selection in the TME can together shape the outcome of antitumor immunity.
In the current study, we employed a unique mouse SCC model that behaved differently when transplanted into recipient mice with identical genetic background. While tumors initially grew in 100% of recipients and most developed aggressive tumors, about 25% of recipients reproducibly eradicated tumors without intervention. Heterogeneous antitumor responses were dependent on CD8 T cells. We performed single-cell TCR sequencing and single-cell RNA sequencing using CD8 TILs from both growing and regressing tumors. By coupling deep transcriptome analysis with unique TCR clonotypes, our study delineated the dynamic relationship of different CD8 TIL clones and the various activation states of CD8 TILs. Our data reveal that intrinsic differences in the TCR repertoire usage of TILs and their different transcriptional trajectories may underlie the heterogeneous antitumor immune responses in different hosts.
Methods
Mouse work and tumor injection
Tumor cells were injected into C57BL6/J (wild-type (WT) B6), BALB/cJ or B6.129S2-Cd8atm1Mak/J (CD8−/−) (Stock no. 002665) mice that were bred in our mouse facility or obtained from Jackson Laboratories. Both male and female WT B6 and CD8−/− mice (4–7 weeks) were used for A223 tumor injection orthotopically into the buccal mucosa unless otherwise indicated. All mice were maintained under specific pathogen-free conditions in the vivarium facility of University of Colorado AMC.
A223 tumors were described previously.41 LY2 and B4B8 tumors were obtained from Dr Carter Van Waes (National Institutes of Health/National Institute on Deafness and Other Communication Disorders, MD). Tumors (A223, LY2, B4B8) were cultured in complete Dulbecco’s Modified Eagle Medium (DMEM) media (10% fetal bovine serum (FBS), 20 mM HEPES, 1× antibiotic-antimycotic) until 90% confluent. Cells were washed with phosphate-buffered saline (PBS), trypsinized (0.05% for A223 or 0.25% for LY2 and B4B8) (Fisher Scientific) and washed sequentially with complete or plain DMEM media (no FBS). Cells were counted, resuspended in plain DMEM and mixed in equal volume with Matrigel Basement Membrane Matrix (Corning) before tumor injection. For injections, 100 µL of cells in media/Matrigel were injected subcutaneously into both flanks of each mouse or into one cheek per mouse. For re-challenge experiments, regressors (defined as mice that had rejected the first challenge of A223 tumors) were injected with A223 tumors (250 000) in the opposite cheek at least 14 days after complete rejection of the first challenge. For subcloning experiments, A223 parental tumor cells were plated in 96-well plates at a limiting dilution (~50 cells/plate). The presence of a single cell and the subsequent formation of single colonies were visually inspected under microscope. Subclones were obtained from wells with single colonies only, subsequently expanded and injected into naïve wild-type (WT) B6 mice (250 000 cells/cheek). For passage experiments, two regressing and two growing A223 tumors were removed from mice, minced with razor blades and dissociated with 50 µg/mL Liberase DL (Sigma-Aldrich) in DMEM media for 30 min at 37°C. Cells were washed with complete media and plated on 10 cm plates. Cells were washed and passaged over 1 week to obtain enough tumor cells for reinjection. Passaged cells were injected into naïve WT B6 mice (250 000 cells/cheek). Tumors were measured by calipers, and tumor volume was calculated as (length×width2)/2.
Multispectral imaging of human HNSCC samples
Formalin-fixed paraffin-embedded (FFPE) tumor samples from patients with HNSCC were stained using Opal 7-Color Automation IHC Kit-50 Slide according to manufacturer’s instructions (Akoya Biosciences). Briefly, antigen retrieval was performed using AR6 buffer in a microwave at 100% power for 1 min and 10% power for 15 min. Slide staining was performed in three cycles: (1) first cycle, antihuman CD20 primary antibody (1:400) and Opal 540 (1:50); (2) second cycle, antihuman CD8 primary antibody (1:100) and Opal 650 (1:50); (3) third cycle, antihuman pan-cytokeratin primary (1:500) and Opal 690 (1:50). Slides were stained with DAPI for 5 min, washed and mounted and scanned using the Vectra 3 system and Phenochart software. Acquired MSI images were unmixed and analyzed by inForm 2.0 software. Detailed antibody information is included in online supplemental table 8.
Supplemental material
Neoantigen prediction
DNA or RNA samples of A223 tumors were submitted to Beijing Institute of Genomics for whole-exome sequencing (WES) or the University of Colorado Anschutz Genomics Core for bulk RNA sequencing using Illumina platform. FASTQ files were processed by Accura Science, who performed quality control using FastQC, read alignment to the mouse reference genome using BWA, variant-calling using GATK (V.3.5), bam alignment processing using Picard Tools, putative variant identification using GATK HaplotypeCaller and variant annotation using SnpEff (V.4.1). We continued the analysis by filtering variants for those that caused missense mutations, and making a list of 8, 9 or 10 amino acid (a.a.) sequences spanning each mutated a.a. in every possible position (positions 1–10). The list of peptides was submitted to NetMHC V.4.042 43 for binding prediction to H2-Kb or H2-Db (strong binders have %rank <0.5, and weak binders have %rank <2). Peptides that bound major histocompatibility complex (MHC) class I were then submitted to the Immune Epitope Database44 for prediction of immunogenicity, and scores >0 were considered to have putatively high immunogenicity.
Flow cytometry
Tumors were removed and processed for flow cytometry at 14–21 days post injection. Flow cytometry antibodies were included in online supplemental table 8. Tumors were weighed, minced using razor blades and dissociated using liberase in RPMI (Corning) as described above. Digested tumors were mashed through 70 µm filters, washed with 1×PBS (2% FBS) and lysed with red blood cell lysing buffer (Sigma-Aldrich) to prepare single cell suspension. Spleens were collected from tumor-bearing mice and single cell suspensions were prepared. Single-cell suspensions were used for immediate staining with flow cytometry antibodies, or for ex vivo stimulation followed by flow staining. For ex vivo stimulation, the single-cell suspension of tumors and TILs together was plated in a 12-well plate (2–5×10⁶ cells/sample/well) and stimulated with 25 ng/mL phorbol 12-myristate 13-acetate (Sigma-Aldrich), 485 ng/mL ionomycin (Sigma-Aldrich) and 5 µg/mL brefeldin A (Biolegend) in complete DMEM media for 4 hours at 37°C. Stimulated cells were harvested, washed and stained as follows. Flow cytometry staining proceeded with viability staining (Live/Dead Aqua) followed by surface staining, fixation/permeabilization and intracellular or intranuclear staining. For surface staining, cells were incubated with surface antibodies (anti-CD8, CD45, CD4, LAG-3, PD-1, CD3, CD69, CD122, Ly6A, Ly6C and/or TCRβ). For intracellular staining of interferon (IFN)-γ and tumor necrosis factor (TNF)-α, cells were fixed and permeabilized with the BD Fixation/Permeabilization kit. For intranuclear staining of T-bet, Nur77, Ki67 and EOMES, cells were fixed and permeabilized with the BD Mouse FoxP3 Buffer Set. Cells were analyzed using a BD LSRFortessa X-20 cytometer and data were analyzed by FlowJo software.
Single-cell RNA sequencing
Tumors from three regressor and three progressor mice were processed as above to generate single-cell suspensions. Cells were washed, stained with antibodies against CD8, CD4, CD45, TCRβ, CD3, Live/Dead Green or just Live/Dead Green, and sorted using the FACSAria Fusion flow sorter (regressors and progressors #1–2) or the Sony MA900 (regressor and progressor #3). All sequenced samples including regressor TIL, progressor TIL and splenic CD8 T cells were described in online supplemental table 1 including the staining and sorting strategies (eg, sorted for Live, CD45+, TCRβ+/CD3+, CD8+CD4− cells to isolate CD8 T cells), 10× Genomics chemistry including 3’ expression, 5’ expression and TCR VDJ sequencing, the number of cells sequenced and the abbreviations for each sample. Sorted samples were submitted to the University of Colorado at Anschutz Genomics and Microarray Core for single cell capture and library preparation. Cells were loaded into a 10× Genomics Single-cell chip A for 5’VDJ captures and Chip B for the 3’ captures. Single-cell gene expression libraries were prepared using Chromium Single Cell 5’ Library & Gel Bead Kit (#1000014) or Chromium Single Cell 3’ Library & Gel Bead Kit (#1000092) according to the manufacturer’s instructions; 5' libraries were split in half, one for sequencing and another half was enriched for TCR sequencing using the Chromium Single Cell V(D)J Enrichment Kit (Mouse T Cell). Samples were sequenced on the Illumina NovaSeq 6000 platform for an estimated read depth of 100 000 reads per cell (3' samples), 50 000 reads per cell (T cell 5' expression) or 5000 reads per cell (TCR VDJ). After sequencing, reads were mapped to the mm10 genome using the 10× Genomics CellRanger (V.2.0.2, V.3.0.2 and V.3.1.0) count pipeline and the VDJ sequencing reads were mapped to the GRCm38 reference dataset using CellRanger VDJ (V.3.0.1, V.3.0.2, V.3.1.0).
Single-cell VDJ analysis
Five TIL samples (RT1, RT2, RT3, GT2, GT3) and three spleens (RS2, RS3, GS3) were sequenced for TCR VDJ region (online supplemental table 1). VDJ analysis was conducted on the filtered_contig_annotations output file from the 10× Genomics CellRanger VDJ pipeline. In R, cells were filtered for those with only full length, productive, high-confidence V and J segments. Cells were then filtered for those containing only one TCRβ chain, and only one or two TCRα chains (to allow for the lack of allelic exclusion in the TCRα locus). Cells with the same DNA sequences for both TCRα and TCRβ were considered to be the same clone, while cells with the same peptide sequence for the CDR3 of both TCRα and TCRβ were considered to be the same clonotype. Clonotypes were quantified to calculate the per cent in each sample (% of a given clonotype=# cells with that clonotype/# total cells in the sample), and clonotypes above 1% in any of the five TIL samples were used for analysis of ‘top clonotypes’ in further analyses.
Single-cell transcriptome analysis
Initial analysis was performed on Regr1-TIL and Grow1-TIL samples using Seurat V.245 to identify CD8 T cells in these samples. Cells with <200 genes detected or >5% mitochondrial RNA content were removed from further analysis. After filtering, Regr1-TIL and Grow1-TIL samples were processed using the functions NormalizeData, FindVariableGenes and ScaleData. The two samples were combined by running canonical correlation analysis using RunCCA and then AlignSubspace. The cells from both samples were then plotted using RunTSNE using the aligned CCA dimensions 1:21 and clustered using FindClusters. CD8 T cell clusters were identified based on the cluster’s overall expression of Cd3e, Cd8, Cd3d, Gzmb and the lack of Cd4 and Foxp3. A list of cell identification barcodes for all cells in the CD8 T cell clusters were extracted for further analysis.
All further analysis of the gene expression was performed using Seurat V.3.45 The nine samples (Regr1-TIL, Grow1-TIL, Regr2-TIL, Grow2-TIL, Regr3-TIL, Grow3-TIL, Regr2-Spln, Regr3-Spln, Grow3-Spln) (online supplemental table 1) were each filtered to remove low-quality cells (<500 genes or >5% mitochondrial RNA). Presumed doublets were removed by excluding outliers in the scatter plot between the number of genes per cell (nFeature) and the number of total molecules per cell (nCount). VDJ information for each cell (CDR3α and CDR3β sequences; see above) was added as metadata for each cell, and gene expression was normalized using the NormalizeData function. The nine samples were combined and batch-corrected using Seurat’s functions FindIntegrationAnchors and IntegrateData. Cells were scored for S and G2/M cell cycle stages using the CellCycleScoring function. The data were converted to z-scores using ScaleData, regressing against the mitochondrial RNA content, S score and G2M score. Finally, dimensionality reduction was performed by first running principal component analysis, and then running UMAP analysis on the first 30 principal components. Integrated data were input into Monocle 3-beta46–48 to evaluate a differentiation trajectory between cells, and UMAP coordinates from Monocle analysis are displayed in the figures. For differential gene expression between progressor and regressor top clonotypes, Seurat’s FindConservedMarkers function was employed, controlling for cohort (cohort 1=regressor 1 and progressor 1; cohort 2=regressor 2 and progressor 2; cohort 3=regressor 3 and progressor 3). Using this function, differential gene expression was calculated for cells in one cohort at a time, and then results were consolidated by taking the most conservative p value and average ln(fold change). Fold changes were calculated as eln(fold change) if ln(fold change)>0, and −1/eln(fold change) if ln(fold change)<0.
GLIPH TCR analysis
Analysis of TCR specificity groups was conducted using the GLIPH algorithm49 that was published using a human reference database. Thus, a mouse reference database was constructed from the list of unique CDR3β sequences in all 8 of our TCR samples (TILs and spleen) combined with supplementary data from a prior study,50 totaling 116 541 unique mouse CDR3 sequences (the default human reference database consists of 162 165 unique sequences). CDR3 sequences from each of our five TIL TCR samples were input into GLIPH using the constructed mouse reference database. After GLIPH clustered the sequences into convergence groups, the abundance (% of a CDR3β sequence in each sample) was applied to each member of the groups, then groups were ranked by the sum of the abundance of each CDR3β sequence in the group. The clone network output from GLIPH was used to create network plots, where all members of each group were included in one plot. Each node represents a TCRβ CDR3 sequence in the group, and each line represents a global (thick line) or local (thin line) similarity to another CDR3 sequence. Node size for each plot was calculated as 100×((% in RT1)+(% in RT2)+(% in RT3)+(% in GT2)+(% in GT3)). Node color (‘relative ratio’) was calculated as ((% in GT2)+(% in GT3))/((% in RT1)+(% in RT2)+(% in RT3)+(% in GT2)+(% in GT3)), where red nodes are sequences only in progressor samples and blue nodes are sequences only in regressor samples. Values in both regressors and progressors were graded from red (1.0) to purple to blue (0.0) according to the ratio. Network plots were constructed using the networkD3 package.
Results
Heterogeneous immune infiltration in patients with HNSCC
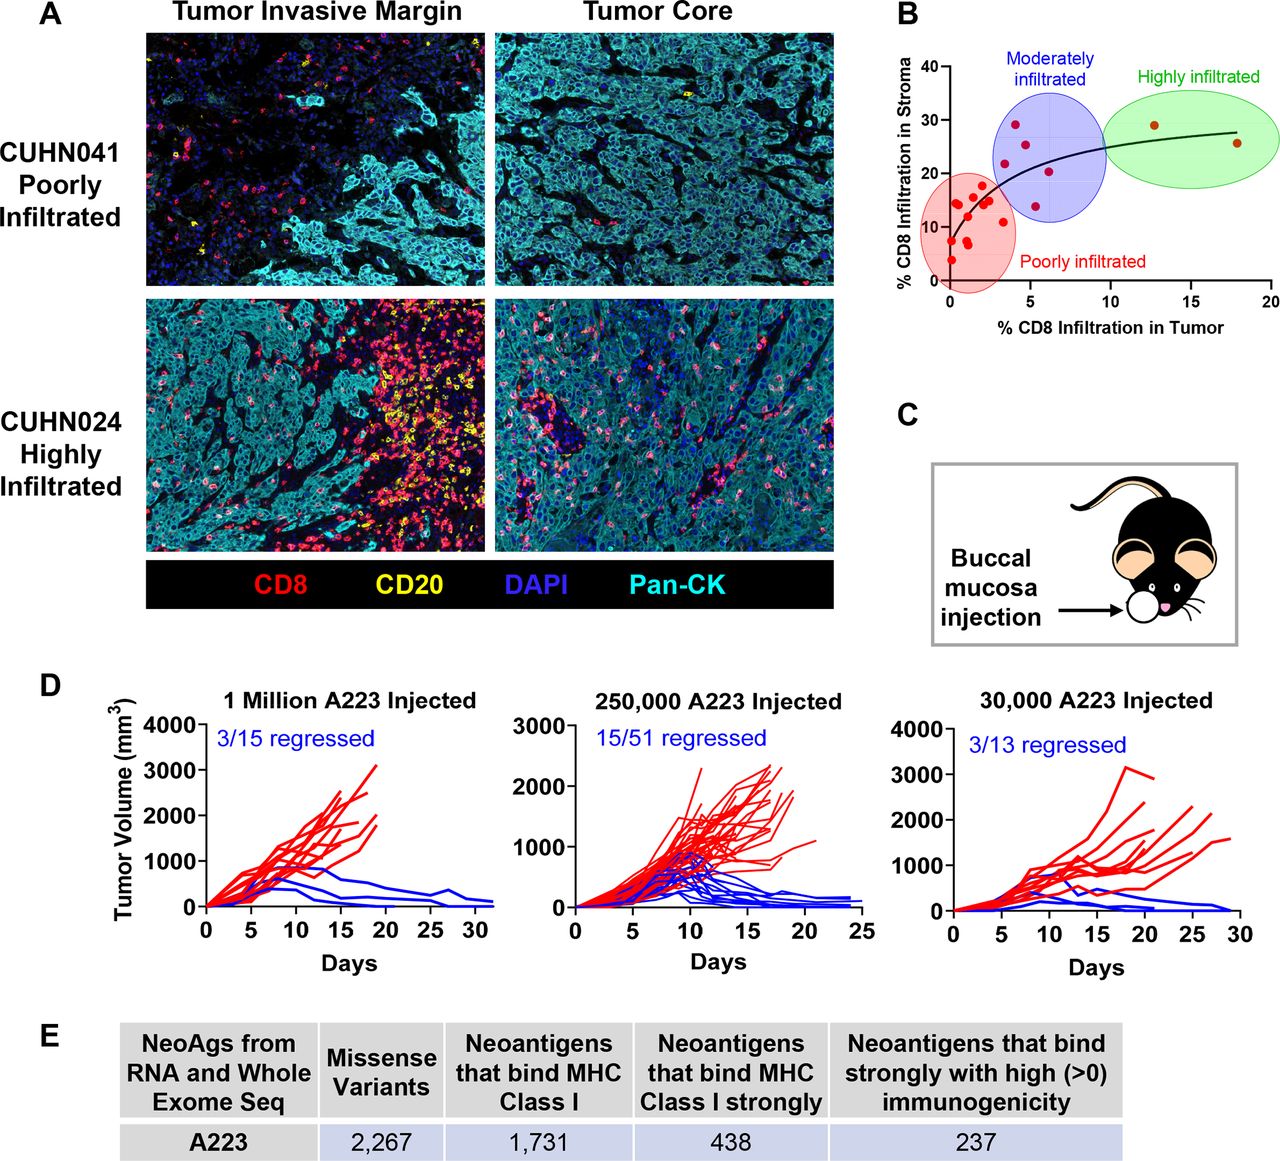
To investigate the immune profile of HNSCCs, we employed the multispectral imaging (MSI) approach to stain FFPE slides of patient samples with HNSCC with DAPI and antibodies for CD8, CD20 and pan-cytokeratin. Most of these samples were characterized and published previously with diagnosis, tumor staging and RNA-sequencing and mutation data available.51 We found that HNSCC tumors were strikingly diverse in immune infiltration in both the tumor invasive margin and tumor core, ranging from poorly infiltrated (figure 1A top, CUHN041, online supplemental figure 1A) to highly infiltrated (figure 1A bottom, CUHN024, online supplemental figure 1B). We profiled 18 samples and stratified them by the per cent of CD8 infiltration into tumor and stroma compartments. Consistently, we found that CD8 T cell infiltration was highly heterogeneous in these HNSCC samples (figure 1B).

Heterogeneous immune responses in head and neck cancer. (A) Fomalin-fixed paraffin-embedded (FFPE) tumor sections from patients with head and neck cancer were stained with antibodies to CD8 (T cells), CD20 (B cells), pan-cytokeratin (tumor cells) and DAPI, followed by Opal fluorophores for multispectral immunofluorescence. Images were taken with Vectra3 microscope (20×) and fluorophores were unmixed using InForm software (Akoya Biosciences). Representative unmixed images of tumor invasive margin and tumor core from patient CUHN041 (poorly infiltrated) and CUHN024 (highly infiltrated) are shown. (B) Eighteen tumor samples from patients with HNSCC were stained as described above and grouped into ‘poorly infiltrated’, ‘moderately infiltrated’ or ‘highly infiltrated’ based on CD8 T cell infiltration into stroma and tumor compartments. (C, D) A223 squamous cell carcinomas (SCCs) were eliminated in ~20%–25% of recipients regardless of the number of tumor cells injected. (C) Tumors were orthotopically transplanted in the buccal (cheek) cavity of wild-type (WT) B6 mice at 4–7 weeks of age. (D) Left panel: 1 million cells injected, 3 out of 15 recipients rejected (2 independent experiments). Middle panel: 250 000 cells injected, 15 out of 51 recipients rejected (6 independent experiments). Right panel: 30 000 cells injected, 3 out of 13 recipients rejected (2 independent experiments). (E) A223 SCCs potentially harbor neoantigens. Whole-exome sequencing and RNA sequencing were performed on A223 SCCs to evaluate neoantigen load. Sequencing reads were mapped to the mouse reference genome (C57BL/6J) and variants were filtered for those that produced missense peptides. Peptides spanning each mutation were input into NetMHC4.0 for major histocompatibility complex (MHC) class I binding prediction (weak or strong) and those that bound were input into Immune Epitope Database (IEDB) for prediction of immunogenicity.
A model system for studying tumor heterogeneity and mechanistic differences in antitumor responses
To elucidate the underlying mechanisms of heterogeneous antitumor responses, we employed a KrasG12DSmad4−/− SCC cell line that was previously characterized,41 52 53 termed A223. A223 tumors were orthotopically transplanted into genetically identical WT C57BL/6 (B6) recipient mice. While tumors initially grew in 100% of recipients and continued to grow aggressively in most recipients, 20%–30% of recipients eradicated tumors without intervention, regardless of the cell number of tumors injected or the location of injection (figure 1C–D, online supplemental figure 1C-F). These data suggest that tumor eradication did not appear to be attributed to different levels of tumor burden. Additionally, tumor eradication did not correlate with age or sex of the recipients (data not shown). This phenomenon of spontaneous tumor eradication appeared unique to the A223 SCCs, since other SCC lines that have been used to study HNC, including LY224 and B4B8,25 grew out in all recipients and were not spontaneously eliminated (online supplemental figure 1G-H). Thus, we conclude that genetically identical WT B6 mice responded heterogeneously to the same A223 tumors.
Next, we investigated whether A223 tumors could be potentially immunogenic by harboring neoantigens. A223 tumors were sequenced using WES to detect non-synonymous mutations in exomes and bulk RNA-sequencing to confirm the expression of these mutations. Two thousand two hundred sixty-seven missense variants were identified in both WES and RNA-sequencing datasets that could potentially serve as neoantigens, and from those, 1731 peptides were predicted to bind MHC class I, 438 were predicted to bind strongly and 237 were predicted to have ‘high immunogenicity’ (figure 1E). Thus, A223 tumors contain ample possibility for presenting neoantigens; however, it remained intriguing that tumors were not eliminated in all recipients.
Spontaneous tumor eradication depends on CD8 T cells
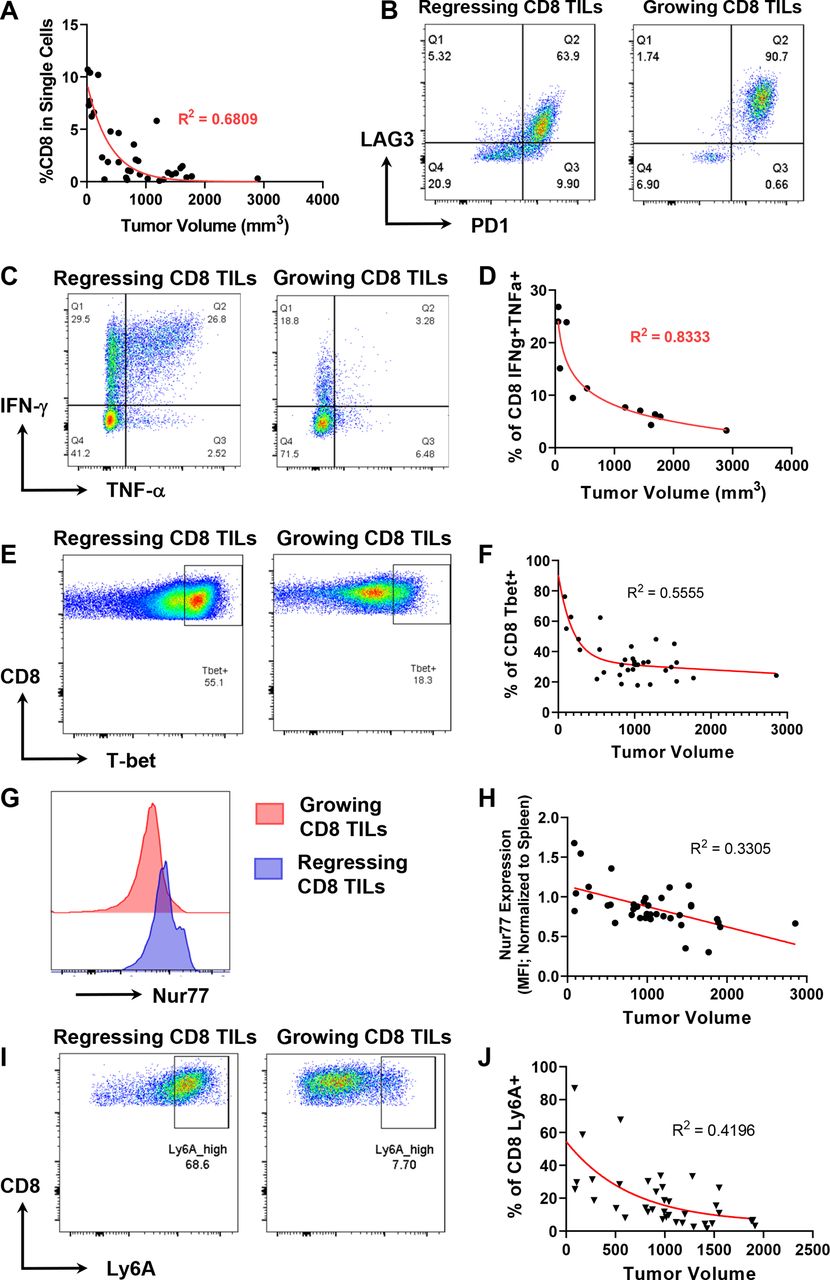
To determine the mechanisms underlying the heterogeneous antitumor responses against A223 SCCs, we performed flow cytometry analysis on the TILs of growing versus regressing tumors of varying sizes. While tumor volume inversely correlated with the per cent of CD45+ and CD4+ cells in tumors (online supplemental figure 2A,B), it correlated more strongly with CD8+ cell infiltration (figure 2A). In addition, CD8+ T cells expressed a lower level of PD-1 and LAG-3 in regressing tumors compared with growing tumors (figure 2B), suggesting that the T cells in regressing tumors were less exhausted. We next examined the effector functions of CD8 TILs by stimulating them ex vivo for 4 hours and found that CD8 TILs in regressing tumors expressed more IFN-γ and TNF-α than those in growing tumors (figure 2C). While the per cent of CD8+IFN-γ+ or CD8+TNF-α+ population inversely correlated to tumor volume (online supplemental figure 2C,D), the per cent of double producers, that is, CD8 TILs producing both IFN-γ and TNF-α, inversely correlated best with tumor volume (figure 2D). We also performed flow cytometry experiments to examine CD8 T cell markers of activation and memory. In particular, we found that regressor CD8 TILs expressed more T-bet, Nur77, Ly6A, Ly6C, CD122, CD69 and CD244 than progressor CD8 TILs; moreover, the expression of these genes inversely correlated with tumor volume (figure 2E–J, online supplemental figure 2E-L). We also examined other markers including NKG2D, Ki67, Eomes, CD44, CD62L, KLRG1 and CD49d, whose expression level did not exhibit obvious correlation with tumor volume or with either regressor or progressor CD8 TILs.

Tumor regression correlates to CD8 T cell-mediated antitumor immune response. A223 tumors were implanted into wild-type (WT) B6 mice and tumor volume was measured (mm3). Tumors were digested to single cell suspension and analyzed by flow cytometry. (A) Tumor volume inversely correlated with the percentage of CD8 tumor-infiltrating lymphocytes (TILs) within the single-cell gate (R2=0.6809) (n=34, across eight independent experiments). (B) CD8 TILs in growing tumors (right) express more programmed death-1 (PD-1) and LAG-3 than those in regressing tumors (left). Data are representative of eight independent experiments. (C) The percentage of CD8 TILs expressing interferon (IFN)-γ or both IFN-γ and tumor necrosis factor (TNF)-α is higher in regressing tumors (left) than growing tumors (right). TILs were stimulated ex vivo with phorbol 12-myristate 13-acetate (PMA) and ionomycin in the presence of brefeldin A (BFA). (D) The percentage of CD8 TILs expressing both IFN-γ and TNF-α inversely correlated best with tumor volume (mm3) (R2=0.8333) (n=12, across two independent experiments). (E) A higher percentage of CD8 TILs expressing T-bet in regressing tumors (left) than growing tumors (right). (F) The percentage of CD8 TILs expressing T-bet inversely correlated with tumor volume (R2=0.5555) (n=39, two independent experiments). (G) A higher level of Nur77 expression on CD8 TILs in regressing tumors (blue) than growing tumors (red). (H) Normalized Nur77 expression inversely correlated with tumor volume (R2=0.3305). Nur77 expression was normalized by dividing the geometric mean fluorescence intensity (MFI) of Nur77 expression on CD8 TILs with Nur77 MFI on splenic CD8 controls. (I) A higher percentage of CD8 TILs expressing Ly6A in regressing tumors (left) than growing tumors (right). (J) The percentage of CD8 TILs expressing Ly6A inversely correlated with tumor volume (R2=0.4196) (n=37, two independent experiments).
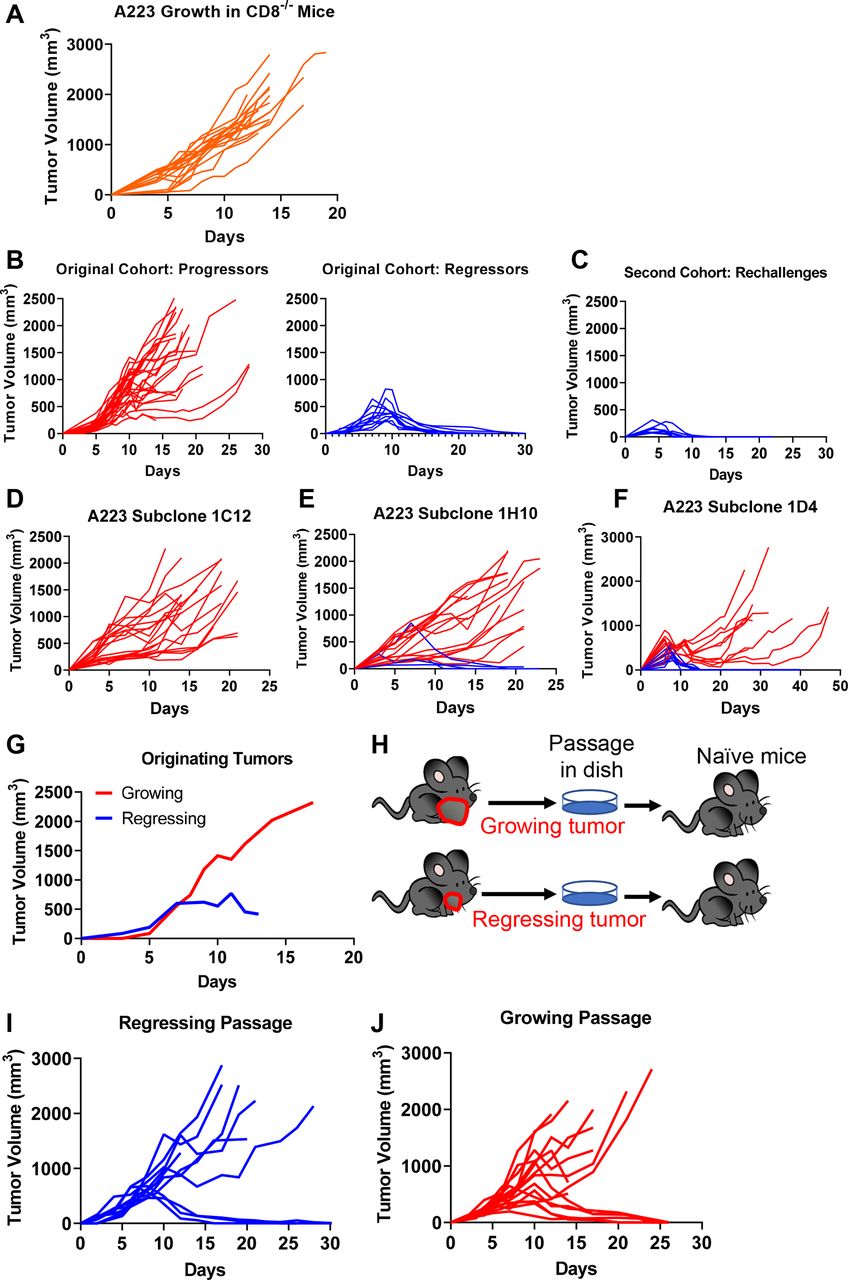
Overall, these data show that CD8 T cell activation may play a critical role in mediating tumor eradication. To further test this notion, we injected A223 tumors into CD8−/− mice and found that these mice were incapable of eradicating tumors (figure 3A), demonstrating that CD8 T cells were essential for tumor eradication. To further test whether tumor eradication is mediated by adaptive immunity, we evaluated whether mice that eradicated A223 tumors develop immunological memory against A223 tumors. In the original cohort (n=40 WT B6 mice), 11 eradicated their tumors (regressors) while 29 did not (progressors) (figure 3B), leading to ~25% long-term survival (online supplemental figure 2M). In the second cohort, 9 of the 11 regressors were re-challenged with A223 tumors, and all of them rapidly eradicated tumors with faster kinetics than during the first exposure (figure 3C). Consistently, 100% of re-challenged mice survived (online supplemental figure 2N). As parallel controls, we injected 11 age-matched naïve WT B6 mice that encountered tumors for the first time and showed a lower level of survival than re-challenged mice (online supplemental figure 2N-O). We conclude that regressors developed an immunological memory response that quickly eradicated a second tumor challenge.

Tumor-extrinsic and tumor-intrinsic factors influencing heterogeneous growth pattern of A223. (A) CD8 T cells were required for tumor eradiation. A223 squamous cell carcinomas (SCCs) were orthotopically transplanted into the cheek of CD8α−/− recipient mice (n=19, across four independent experiments). (B–C) Regressors developed antitumor memory responses. Wild-type (WT) B6 mice were injected with A223 tumors (n=40, three independent experiments). (B) Left panel: 29 out of 40 mice were progressors (tumor growing out). Right panel: 11 out of 40 mice were regressors (tumor eliminated). Regressors were re-challenged with A223 and rejected tumors rapidly (n=9) (C). (D–F) A223 was subcloned into single colonies. Subclones were each tested by injection into WT B6 recipients. Growth from three independent subclones are shown—1C12 (n=19; two independent experiments) (D), 1H10 (n=19, two independent experiments) (E) and 1D4 (n=20, two independent experiments) (F). (G–J) Passaged A223 tumors still exhibited heterogeneous growth pattern regardless of the originator tumors. (G) Original tumor growth of each passage. A total of 250 000 A223 cells were injected into WT B6 mice. (H) Experimental scheme for passaging tumors. Two regressing and two growing tumors were removed from original mice, passaged in vitro and 250 000 cells were injected into the cheek of naïve WT B6 mice. (I) Tumor growth in WT B6 naïve mice that received a regressing passage (250 000 cells injected). Three out of 10 mice rejected tumors (two independent cohorts). (J) Tumor growth in naïve mice that received a growing passage (250 000 cells injected). Six out of 15 mice rejected tumors (two independent cohorts).
The effect of tumor-intrinsic factors on tumor eradication
We next aimed to test whether the heterogeneous antitumor responses are also attributed to tumor-intrinsic factors. We subcloned A223 tumors to test if progression versus regression was due to variability between subclones in the parental cell line. We found that subclones elicited variable responses—subclone 1C12 grew out consistently in all recipients (figure 3D), whereas subclone 1H10 exhibited a similar regression rate as the parental line (20%, figure 3E) and subclone 1D4 showed an even higher regression rate (50%, figure 3F). The variety in response suggests a potential role of tumor-intrinsic mechanisms, for example, subclones may lose or acquire different neoantigens. Nevertheless, the heterogeneous antitumor responses in a single subclone still suggest that there are tumor-extrinsic mechanisms involved in tumor eradication.
Next, we addressed whether tumors differentiated in vivo into aggressive or weak subtypes and maintained their states. We harvested growing and regressing tumors in vivo (figure 3G), passaged them in vitro for a short duration and re-injected these tumors into naïve mice (figure 3H). We found that naïve mice similarly eradicated secondary tumors, regardless of the originating tumor states. Thirty per cent of mice that received the ‘regressing passage’ eradicated tumors (figure 3I), indicating that these tumor cells still were able to grow out in naïve mice. Notably, 40% of mice that received the ‘growing passage’ also eradicated tumors (figure 3J), suggesting that the aggressive phenotypes were not maintained in secondary recipients. Thus, we conclude that tumor eradication is highly dependent on host-intrinsic differences, despite possible variations in the tumor cells.
Top TCR clonotypes appear to be mutually exclusive in regressing versus growing CD8 TILs
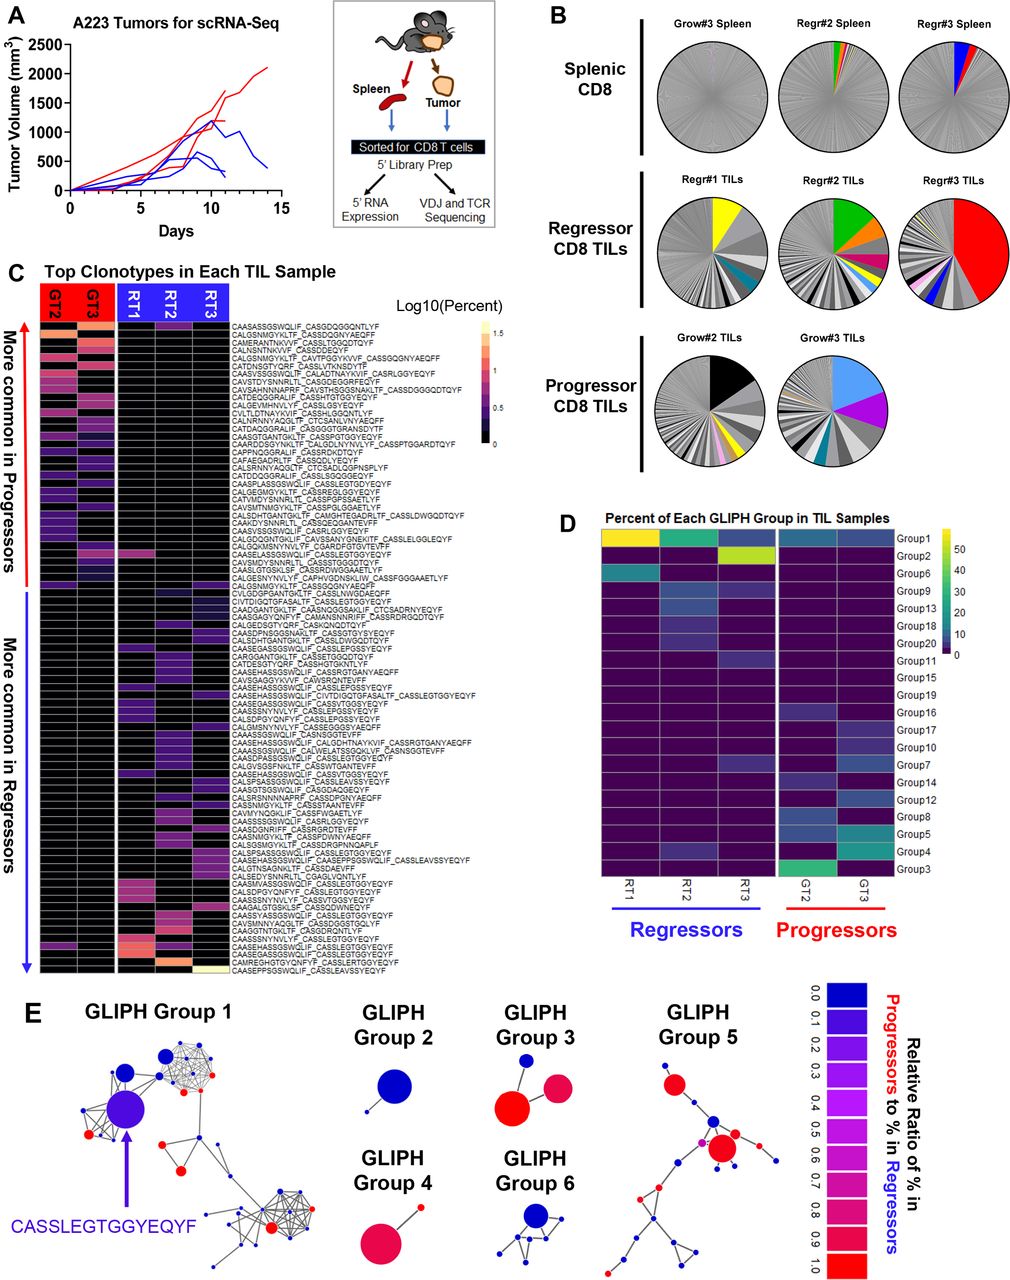
Given that CD8 T cells were required for tumor eradication, we hypothesized that the differences in the TCR repertoire of CD8 TILs contribute to the heterogeneous antitumor immune responses in genetically identical B6 mice, due to the fact that B6 mice harbor a stochastically generated TCR repertoire via random V(D)J recombination. To determine whether and how the CD8 T cells differ between progressors and regressors, we sequenced CD8 T cells from six mice (progressors 1–3 and regressors 1–3; figure 4A, left) using coupled single-cell RNA-sequencing and single-cell TCR V(D)J sequencing so that we could link the unique TCR clonotypes with matched transcriptome analysis for individual T cells (figure 4A, right). We performed single-cell TCR sequencing for CD8 TILs isolated from regressor 1–3 and progressor 2–3 and splenic CD8 T cells isolated from regressor 2–3 and progressor 3 (see details in online supplemental table 1, including cell number sequenced per sample). All five CD8 TIL samples demonstrated clonal expansion regardless of regressor or progressor state, whereas splenic CD8 T cells showed little clonal expansion (figure 4B). The top 10 TCR clonotypes (including VDJ usage and CDR3 sequences of TCRα and TCRβ) and their abundance in each sample are shown in online supplemental table 2. Intriguingly, there were few TCR clonotypes shared between samples, indicated by colored pie slices (figure 4B). While most shared TCR clonotypes were only found in up to two samples in high abundance, one TCR clonotype was present in four out of five TIL samples, denoted as ‘Shared Clonotype 1’ and indicated by yellow color in the pie charts (figure 4B and online supplemental table 3). Of note, splenic CD8 T cell samples contained some of the top TCR clonotypes identified in TIL samples of the two regressors at a relatively high abundance (figure 4B, top, Regr#2 Spleen and Regr#3 Spleen); however, the splenic CD8 T cell sample of the progressor did not (figure 4B, top, Grow#3 Spleen). Taken together, the clonal expansion of CD8 TILs observed in both regressors and progressors suggests that tumor antigen recognition likely occurred in all recipients, led to activation of CD8 TILs, of which some may be tumor-reactive.

Top T-cell receptor (TCR) clonotypes and TCR specificity groups appear to be mutually exclusive between regressing and progressing tumor-infiltrating lymphocytes (TILs). (A) Left panel: tumor growth pattern of regressors (blue) and progressors (red) (n=3 for each group). A total of 250 000 A223 tumor cells were injected into wild-type (WT) B6 mice (n=6). Right panel: experimental scheme. Tumors were removed and CD8 T cells were isolated by sorting and subjected for single-cell 5’ RNA sequencing and TCR sequencing. (B) TCR clonotype distribution in eight sequenced samples including three splenic CD8, three regressor CD8 TIL and two progressor CD8 TIL samples. In each sample, cells containing the same TCR (one ‘clonotype’) are shown as a single pie slice representing the per cent of these cells in the entire sample. Clonotypes shared between samples are colored, where the yellow denotes the most shared clonotype (‘Shared Clonotype 1’). (C) Cells were grouped into clonotypes based on the paired amino acid (a.a.) sequences of their CDR3α and CDR3β regions. Top clonotypes are shown in a heatmap sorted by average abundance in progressors versus average abundance in regressors. (D) Heatmap of top 20 GLIPH groups identified in five TIL samples based on TCRβ CDR3 sequences. Groups are ordered based on their average per cent in regressor samples (RT1, RT2, RT3) versus average per cent in progressor samples (GT2, GT3). Only group 1 is present in all five TIL samples, whereas most groups occurred only in one sample. (E) Network plots of GLIPH groups 1–6. Each node represents a TCRβ CDR3 sequence, and each line represents a global (thick line) or local (thin line) similarity to another CDR3 sequence. Node sizes represent overall abundance in samples and nodes are colored based on the relative ratio between their per cent in growing samples (red) versus their per cent in regressing samples (blue). Relative ratio is calculated as (% in progressors)/(% in progressors+% in regressors). The shared clonotype’s node in group 1 is colored blue-purple and labeled with its CDR3 a.a. sequence.
Despite the few shared clonotypes between samples, the top TCR clonotypes (abundance >1% of a given sample) appeared mutually exclusive between regressor and progressor TIL samples (figure 4C). A vast majority of these top TCR clonotypes were only identified in one mouse, and <5% of these clonotypes were present in more than one mouse (online supplemental figure 3A). We performed a Fisher’s exact test (p<0.0001) to determine whether clonotypes observed in progressors are also observed in regressors at a similar frequency, and vice versa. Our results showed that progressor TCR clonotypes were much more frequently observed in progressors than in regressors, and vice versa, thereby further supporting our observations and confirming the mutual exclusivity of progressor versus regressor clonotypes (online supplemental figure 3G). Consistently, when TCRα or TCRβ CDR3 sequences were analyzed separately, the top TCRα and TCRβ CDR3 sequences also appeared mutually exclusive between regressing versus growing TILs, with only a few exceptions (online supplemental figure 3B,C). These data collectively suggest a highly individualized antitumor immune response.
Although tumor-bearing mice did not frequently share specific TCR clonotypes in the TIL samples, we noted that the most abundant CDR3α and CDR3β sequences in regressor TILs shared similarities in a.a. sequence (online supplemental figure 3D,E), converging on a consensus that is identical to the ‘Shared Clonotype 1’ (online supplemental table 3). These data suggest that CDR3 sequences similar to that of ‘Shared Clonotype 1’ may be useful for recognizing A223 tumor antigens. To better explain why regressor CD8 TILs controlled tumor growth more effectively, we hypothesized that regressor TILs might have more TCR clonotypes shared in certain strong, antitumor specificity groups. To test our hypothesis, we employed the GLIPH algorithm49 to determine if the TCR clonotypes of the TIL samples were sharing specificities (for antigen binding), despite not having identical CDR3 sequences. GLIPH analysis identified the top 10 groups of TCRβ CDR3 sequences based on overall abundance (online supplemental table 4). However, none of the 10 groups suggested a common specificity to either regressors or progressors, because most of them were largely mutually exclusive in individual mice (figure 4D–E, online supplemental figure 3F, online supplemental table 4). These data are consistent with the notion that a highly individualized antitumor immune response develops in different regressors or progressors. One exception was the specificity ‘group 1’ that contained CDR3β sequences from all 5 TIL samples and was clustered by the GLIPH algorithm to include the CDR3β of the ‘Shared Clonotype 1’ and 38 other sequences (figure 4D–E, online supplemental table 4). Group 1 appeared slightly more prevalent in regressor samples; however, the difference was not significant. Thus, the potential of tumor antigen recognition might be strongest with clonotypes in group 1; however, the presence of these likely tumor-reactive clonotypes alone is not sufficient to elicit tumor eradication.
To obtain a higher-level overview of whether TCR determinants are associated with tumor regression versus progression, we assessed germline Vα-Jα or Vβ-Jβ gene segment usage by individual mice that might provide a broader view of how TCR repertoires vary between individual mice and in regressors versus progressors. For each of the eight samples sequenced for TCR including TIL and splenic samples, we included a heatmap for the usage of Vα-Jα gene segments (online supplemental figure 4A,B) or Vβ-Jβ gene segments (online supplemental figure 5). Notably, regressor TIL samples indeed exhibited a preferential usage of certain gene segments, such as TRBV16 and TRBJ2-7, which also occurred in regressor splenic samples but not in any progressor samples (online supplemental figure 5). In addition, splenic samples appeared to display a more even distribution of different V or J gene segments, whereas TIL samples clearly showed a preferential usage of certain V or J gene segments, consistent with the expansion of different TCR clonotypes.
Lastly, to provide more context regarding whether the observed degree of clonal expansion is meaningful, we examined clonal expansion in a non-tumor bearing ‘healthy’ WT B6 mouse to reveal the expected degree of TCR repertoire restriction. We downloaded and similarly analyzed the ‘splenocytes from C57BL/6 mice, 10k cells (v2)’ public dataset from 10× Genomics, which contains VDJ-sequenced T cells from a WT B6 mouse. We presented the heatmaps of Vα-Jα and Vβ-Jβ usage and pie chart for clonal expansion, and found no clonal expansion in this sample (online supplemental figure 6).
CD8 TILs from both regressors and progressors were activated
The 3’ RNA-sequencing was performed on CD8 TILs of regressor #1 and progressor #1, and the 5’ RNA-sequencing was performed on CD8 TILs of regressors #2–3, progressors #2–3 and splenic CD8 T cells of regressors #2–3 and progressor #3 (see details in online supplemental table 1). RNA expression data from all nine samples (41 099 total cells) were analyzed using Seurat V.3 and Monocle 3-beta, and samples were plotted into one UMAP, shown either superimposed or separately for regressor, progressor or spleen (figure 5A). Cells were grouped by unsupervised clustering (figure 5B), and different clusters were defined based on the expression of representative genes (figure 5C–D, online supplemental figure 7A-C). The full lists of differentially expressed genes for each cluster were also included (online supplemental files 1-9). While spleen cells predominated in naïve clusters (N1–N3) of the UMAP, both regressor and progressor CD8 TILs mainly occupied each of the activation clusters (figure 5A–B), showing that regressor and progressor TILs managed to reach different activation states. Consistently, regressor and progressor TILs upregulated nearly all of the same genes when compared with naïve T cells, although to different extents (online supplemental table 5).

Both regressor and progressor tumor-infiltrating lymphocytes (TILs) cluster into the same activation states. (A) Transcriptional data of >41 000 cells from nine samples (Grow1-TIL, Regr1-TIL, Grow2-TIL, Regr2-TIL, Regr2-Spln, Grow3-TIL, Regr3-TIL, Grow3-Spln, Regr2-Spln) were integrated using Seurat’s integration algorithm, and clustered using UMAP (see online supplemental table 1 for additional information on the nine samples). Cells are colored by sample type: regressor TILs (blue), progressor TILs (red) or splenic CD8 (gray). The same UMAP plot was shown as a plot containing three types of samples or three separate plots containing only one sample type. (B) Cells from nine samples are clustered together by UMAP as described in (A) and 13 functional clusters are colored based on gene expression. (C) Cluster abbreviations are shown to be referenced in other plots. (D) Cells from nine samples are clustered by UMAP as in (A). Cells are colored based on normalized expression for nine representative gene markers (gray=little to no expression; red=high expression). (E) Cells from nine samples are clustered by UMAP as in (A) and were analyzed using Monocle 3 Beta to plot a pseudo-time trajectory onto the UMAP, demonstrating a differentiation trajectory between naïve cells and highest activated (A6) cells. (F) Heatmap of the per cent of each sample residing in each cluster of the UMAP. Samples and cluster names of the heatmap were ordered by unsupervised clustering. (G) Representative genes upregulated in growing or regressing activated TILs (residing in one of the six activated clusters: A1–A6) versus naïve T cells (residing in N1–N3). Grow-Act, activated clusters in growing samples; Naïve, naïve clusters in all samples; Regr-Act, activated clusters in regressing samples. Groups were compared using one-way analysis of variance (ANOVA) (****p<0.0001).
Monocle analysis of the nine samples revealed a differentiation trajectory between naïve cell clusters (N1–N3) and activated cell clusters (A1–A5), ending in the highest activated cluster (A6) and the dividing cell clusters (D1–D3) (figure 5E). Cluster A6 was of particular interest, as the cells in this cluster expressed highest levels of Il2, Ifng, Nr4a1, Nr4a2, Ccl4 and Cd69, while expressing modest amounts of Sell and Ccr7 (figure 5D, online supplemental figure 7A), suggesting that cells in the A6 cluster were the most activated and memory-like. We examined the per cent of each sample in individual clusters and found that the progressor TIL samples appeared to be slightly less prevalent in A1 (initial activation cluster), A3 (IFN-stimulated cluster) and A6 clusters, while more prevalent in D1–D3 (figure 5F). Of note, when compared with naïve T cells, some genes were more upregulated in progressor TILs such as Gzmf and S100a4, whereas others were more upregulated in regressor TILs such as Ly6a, Ly6c2, Ccl4 and Ccl5 (figure 5G, online supplemental figure 8A, online supplemental table 5). We also separated cells by cohort since only one progressor and one regressor were sequenced in each sequencing cohort and found that these genes were still differentially expressed between progressor and regressor TILs within each cohort (online supplemental figure 8A). We conclude that both regressor and progressor TILs were activated, although progressor TILs appeared to be less activated than regressor TILs.
Top TCR clonotypes of TILs differentially occupy activation clusters in regressors versus progressors
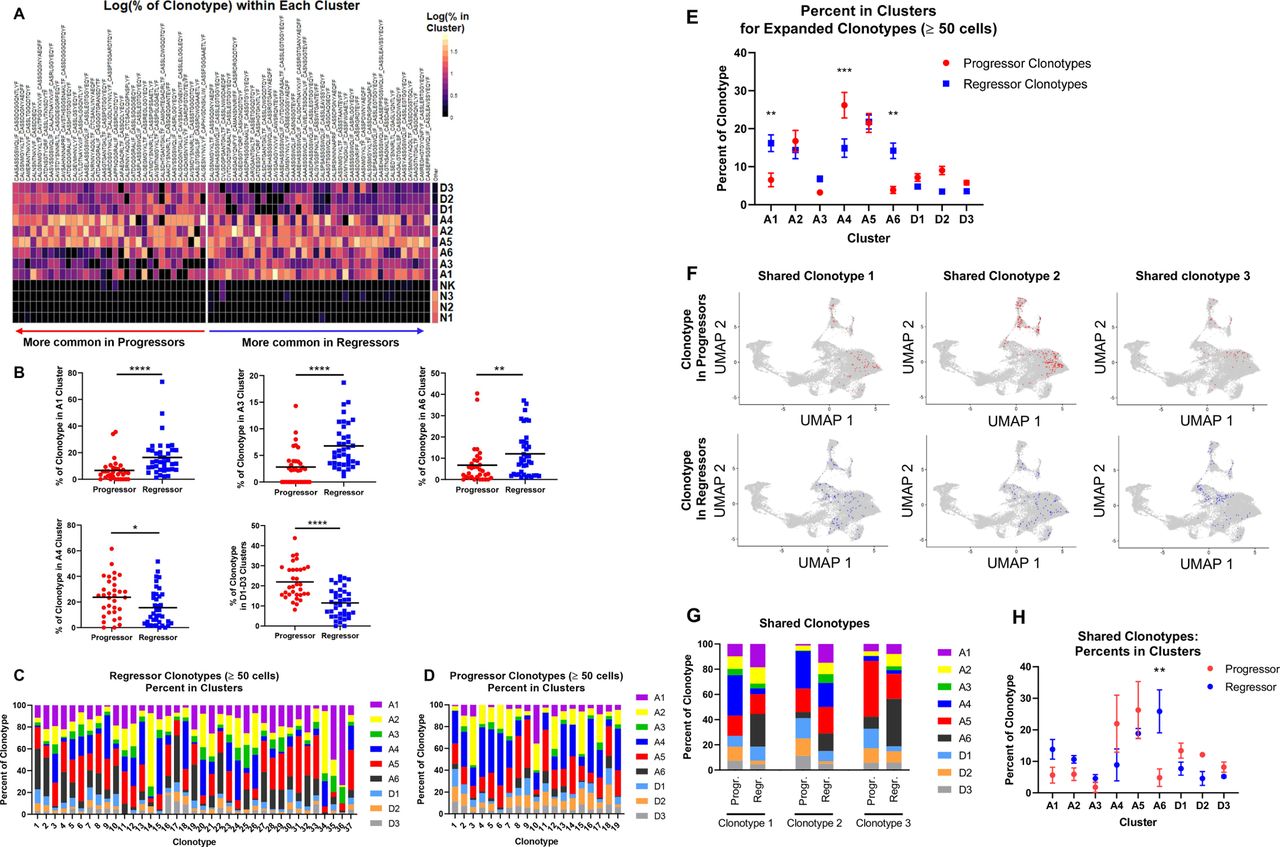
Since progressor and regressor TILs as a whole were only modestly different in gene expression, we hypothesized that the TILs that had clonally expanded to at least 1% of each sample (top TIL TCR clonotypes) would be differentially activated between progressors and regressors. T cells were grouped into clonotypes based on identical TCRα and TCRβ CDR3 a.a. sequences, then clonotypes were sorted based on abundance in progressors versus abundance in regressors as described in figure 4C. We compared the top TIL TCR clonotypes to ‘other’ (defined as clonotypes that were <1% of a splenic sample) for the per cent of cells in each clonotype found in each cluster. Regressor top clonotypes were significantly more prevalent in clusters A1, A3 and A6; in contrast, progressor ones were significantly more prevalent in clusters A4 and D1–D3 (figure 6A–B). To account for individual mouse differences, we also analyzed cluster distribution by comparing TCR clonotypes within each cohort. Differences were evaluated using two-way analysis of variance for progression group (progressor vs regressor) and for cohort. While variations by progression group were statistically significant as indicated on the right of each plot (online supplemental figure 8B), the differences in each cluster appeared to vary slightly by cohort (online supplemental figure 8B). To further corroborate our findings, we examined all regressor and progressor clonotypes that contained at least 50 cells for their distribution in different clusters (figure 6C–D). Consistently, a significantly higher per cent of regressor clonotypes were in clusters A1 and A6, while progressor clonotypes were significantly higher in cluster A4 (figure 6E).

Top T-cell receptor (TCR) clonotypes of progressor tumor-infiltrating lymphocyte (TIL) versus regressor TIL occupy different activation clusters. (A) Expanded clonotypes (>1% of a TIL sample) are shown as log10 of the per cent of the clonotype existing in each cluster of the UMAP. (B) Clusters that are differentially occupied by progressing and regressing clonotypes from (A) are quantified with dot plots with a black line indicating the mean. Progressor and regressor groups were compared using t-tests with Mann-Whitney U test correction for non-parametric data. *P<0.05; **p<0.01; ***p<0.001; ****p<0.0001. (C and D) All TCR clonotypes from Regr2 and Regr3 (C) or from Grow2 and Grow3 (D) with at least 50 cells are shown as bars, broken down into different colors representing the per cent of the clonotype in each cluster of the UMAP. (E) A graph summary of per cent in clusters for clonotypes in (C) and (D). Progressor group (red), regressor group (blue). Error bars indicate the SEM. Significance was calculated using two-way analysis of variance (ANOVA) with Sidak’s multiple comparison test (**p<0.01, ***p<0.001). (F) UMAP of CD8 T cells with shared TCR clonotypes. Three representative TCR clonotypes are shown. Cells with a given TCR clonotype are shown in red color for progressing TILs or blue for regressing TILs, over cells with all other TCR clonotypes from all samples (gray). (G) The per cent of each of the three shared clonotypes in each of the clusters (A1–D3). (H) A summary graph showing the per cent of the three shared clonotypes occupying each of the clusters (A1–D3). Clonotypes in regressor samples occupy A6 cluster more than their matched counterparts in progressor samples. Significance was calculated with two-way ANOVA with Sidak’s multiple comparisons test. **P<0.01.
Next, we asked whether the same TCR clonotype would behave differently in regressors versus progressors. We identified three TCR clonotypes that were shared between regressor and progressor TIL samples and that contained at least 50 cells in a given sample (online supplemental table 3), thereby allowing us to make matched comparisons. UMAP plots clearly showed that the three shared TCR clonotypes occupied different clusters in regressors versus progressors (figure 6F). For instance, the ‘Shared Clonotype 3’ predominated in cluster A5 in the progressor TIL sample but in cluster A6 in the regressor TIL sample (figure 6F). We then calculated the per cent of each of three shared clonotypes in all clusters and found that the same TCR clonotype distributed quite differently in regressor versus progressor TIL samples (figure 6G). Statistical analysis of the pooled data from three shared clonotypes showed that, T cells, despite having the same TCR clonotypes, tended to enrich more in cluster A1 and significantly more in cluster A6 when found in regressors than in progressors (figure 6H). Taken together, we conclude that the expanded T cells in progressors are deficient at initiating activation, evidenced by less prevalence in cluster A1, and at reaching the highest activation state, cluster A6.
Top TCR clonotypes of TILs exhibited differentially activated genes in progressors versus regressors
To further reveal the differences between progressor and regressor CD8 TILs, we performed two different differential gene expression comparisons: (I) progressor top clonotypes (>1% of a progressor TIL sample) versus ‘other’ clonotypes (<1% of a splenic sample), and (II) regressor top clonotypes (>1% of a regressor TIL sample) versus ‘other’ clonotypes. The heatmap illustrated the differential scaled gene expression of each top TCR clonotype of TIL samples versus ‘other’ clonotypes, which clearly demonstrated clusters of differentially expressed genes in progressors versus regressors (figure 7A). The most differentially expressed genes with their averaged fold changes and the most conservative p values calculated from each cohort were listed in online supplemental table 6 for comparison I and II. The fold changes of some representative genes were shown for comparison I and II, respectively (figure 7B–C). Progressor top clonotypes expressed much more Gzmf, a mouse-specific granzyme, than regressor ones (figure 7B, online supplemental figure 8C, online supplemental table 6). Progressor top clonotypes also expressed higher levels of genes involved in immunosuppressive processes such as Tsc22d3 that was shown to facilitate the generation of peripherally induced Tregs.54 Conversely, regressor top clonotypes expressed higher levels of type I IFN responsive genes (Isg15, Ifi209, Ifi213) and Irf7, a transcription factor regulating the activation of type I IFN genes (figure 7C, online supplemental table 6), consistent with their increased prevalence in the IFN-stimulated cluster (A3). Additionally, regressor top clonotypes expressed higher levels of genes involved in memory T cell function or development, including, Cxcr6, Ly6a55 and Ly6c2,56 consistent with our flow cytometry data (figure 2I–J, online supplemental figure 2F,K,L). Regressor top clonotypes also expressed higher levels of genes related to cytotoxic or effector functions of activated T cells, including Ccl4, Gzmb, Icos and Ccl5 (figure 7C, online supplemental table 6).

Top T-cell receptor (TCR) clonotypes of progressor tumor-infiltrating lymphocyte (TIL) versus regressor TIL show differentially activated genes. All cells with a given clonotype above 1% of a progressor or regressor TIL sample were evaluated against all cells with clonotypes <1% of spleen samples (‘other’) using Seurat’s FindMarkers function. (A) Gene expression is shown by heatmap where values are the average of scaled expression for all cells of each clonotype. Genes were filtered for those differentially expressed in regressor and progressor clonotypes (≥0.4 difference between progressor fold change and regressor fold change). (B and C) Fold changes were calculated as the difference in expression between progressor top clonotypes and other clonotypes (‘progressor fold change’) or between regressor top clonotypes and other clonotypes (‘regressor fold change’) (≥0.6 difference between progressor fold change and regressor fold change). See online supplemental table 6 and online supplemental file 10 for full list of genes with fold changes and p values. Genes more upregulated in progressor clonotypes (B) or in regressor clonotypes (C). (D and E) Violin plots of select differentially expressed genes between regressor or progressor top TCR clonotypes and other clonotypes. The normalized gene expression for all cells in each category is shown. Black dots indicate the mean of each group. Genes more highly expressed in progressor top clonotypes (D) or in regressor top clonotypes (E). Groups were compared using one-way analysis of variance (ANOVA) (**p<0.01, ****p<0.0001). (F) HNSCC TCGA PanCancer RNA sequencing data were used to score patients for the expression of 30 genes found to be upregulated in regressor top clonotypes (right). Scores for the 30-Gene-Signature were calculated as the sum of normalized expression (patient expression/dataset median) for each of the 30 genes, and then patients were grouped into high-expression (having a score >the median score) or low-expression (having a score <the median score). Patients with high expression of the 30-Gene-Signature have significantly better survival (p=0.00052).
Violin plots of normalized expression of representative genes in all cells consistently showed differing expression between progressor versus regressor top clonotypes (figure 7D–E). We also separated cells by cohort and found that these genes were still differentially expressed between progressor and regressor top clonotypes (online supplemental figure 8C,D). To directly compare progressor top clonotypes versus regressor top clonotypes, we performed two additional differential gene expression comparisons: (III) regressor top clonotypes versus progressor top clonotypes, and (IV) progressor top clonotypes versus regressor top clonotypes. The data from these two comparisons including averaged fold changes and the most conservative p values calculated from each cohort were listed in online supplemental table 7) for comparison III and IV. Taken together, progressor top clonotypes, while expressing many of the same genes as their regressor counterparts, appear to be limited in activation status and induced into frequent division. In contrast, regressor top clonotypes appear to receive additional stimulation from type I IFNs, achieve better activation, acquire stronger cytotoxic ability, and reach more memory-like states.
To explore the implications of our findings in human patients with HNSCC, we used the HNSCC patient RNA-sequencing and survival data from the TCGA Pan-Cancer Atlas (cBioPortal) to test if the genes more upregulated in regressor top clonotypes are indicative of better survival. We used Cox univariate regression analysis and found that 30 of the genes that were more upregulated in regressor top clonotypes did significantly (p<0.05) correlate with patient survival (data not shown). We then scored each patient for the expression of 30 genes and grouped patients into high-expression versus low-expression categories. Our analysis showed that patients with high expression of the 30-Gene-Signature had significantly better survival (p=0.00052) compared with patients with low expression (figure 7F). We suggest that the genes more upregulated in regressor TILs in our dataset may serve as prognostic markers for successful antitumor immune responses.
Discussion
We employed a unique mouse model of HNSCC to investigate the underlying mechanisms of heterogeneous antitumor immune responses. A major advantage of our model system is that A223 tumors can be transplanted into immunocompetent genetically identical recipients, yet the tumors can be spontaneously eradicated in a subset of recipients. Hence, this system may provide a better control for tumor-intrinsic and host-genetic variables, thereby uncovering the contribution of the adaptive immunity to tumor eradication. Our key findings include: (1) spontaneous tumor eradication required CD8 T cells and tumor volume was inversely correlated with CD8 T cell poly-functionality; (2) regressors developed an immunological memory response against A223 tumors; (3) commonly used TCR clonotypes appeared to be mutually exclusive in regressor versus progressor TILs; (4) TILs in regressors and progressors shared very little similarity in TCRβ specificity groups, despite their potential for recognising the same tumors; (5) unexpectedly, TILs from both progressors and regressors underwent clonal expansion and were activated with only modest differences in gene expression when analyzed as a whole; (6) regressor TILs with top TCR clonotypes clustered more prevalently in A1, A3 and A6, whereas progressor counterparts did not. These observations were also supported by differential gene expression analysis of top TCR clonotypes in regressor versus progressor TILs. Thus, the A223 tumors may serve as a useful model system to better understand fundamental principles governing highly individualized antitumor immune responses in a setting of polyclonal T cell activation.
Prior studies have uncovered insight into tumor antigen-specific T cell immune responses by using model antigens expressed in tumors and transgenic T cells recognizing such model antigens,33–36 many of which are immunodominant.57–59 However, tumor immunogenicity varies widely between different patients,60 and tumors may express immunodominant antigens and less immunogenic antigens. Thus, to better understand the nature of T cell-mediated antitumor immune responses, it would be important if such responses can be evaluated in a polyclonal naturally occurring setting with tumors that express multiple antigens with variable immunogenicity. In this regard, TILs in five different recipients transplanted with A223 tumors shared very little antigen specificity, as evidenced by the clonal expansion of many clones that were not detectable in other recipients (figure 4C) and the exclusive GLIPH specificity groups that were only present in one recipient (figure 4D). Based on the lack of TCR clonotypic or specificity overlap between recipients, we infer that each mouse employs an individualized T cell repertoire to mount immune responses against the same A223 tumors. Given that A223 tumors potentially harbor abundant neoAgs that are recognizable by the immune system, why did not all the recipients eradicate tumors? First, tumor antigens may be poorly immunogenic so that they could induce clonally expanded TILs in all recipients but fail to elicit tumor eradication. Second, the presence of a single tumor-reactive TCR clonotype may not be sufficient to induce tumor eradication. We predict that a combination of multiple clonotypes may be needed. Third, we speculate that different recipients harbor intrinsic differences in their TCR repertoire that may influence the chance of a successful antitumor immune response.61 For instance, such differences in TCR repertoire may affect the frequency of neoAg-reactive clones or the optimal composition of such clones that tips the balance between tumor eradication and outgrowth. We suggest that the A223 model might be immensely useful for studying heterogeneity, due to its unique and inherent ability to elicit heterogeneous antitumor immune responses (eg, spontaneous tumor eradication vs outgrowth), and its potential to harbor multiple poorly-immunogenic neoAgs.
TILs in human cancers were examined by single-cell RNA-sequencing to show that certain T cell clusters indicate better patient outcome or that effective treatments caused T cells to reside in almost completely different clusters compared with the control-treated T cells.31 62 63 Additionally, clonal expansion may indicate a successful immune response against tumors.64 Given our finding that T cell activation inversely correlated with tumor volume to a high degree, we anticipated that regressor versus progressor TILs would reside in different clusters, and that progressor TILs would not achieve the same level of clonal expansion as their regressor counterparts. Unexpectedly, we found that T cells in growing tumors demonstrated polyclonal expansion, and that T cells in growing tumors reached each of the different activation states identified on the UMAP. Nevertheless, we did find that the frequency of TILs reaching specific activation states, particularly the highest-activated state (A6), differed significantly between regressors and progressors. Therefore, we suggest that one’s ability to eradicate a tumor is not dependent on whether T cells get activated in the TME, but rather the proportion of T cells that achieve optimal states of activation. Intriguingly, A223 tumors partially responded to anti-PD-1 treatment (data not shown), suggesting that tumors can be controlled by reactivating some of these activated but likely exhausted CD8 TILs in growing tumors. An important field that requires further study is to identify factors causing activated T cells to reach optimal levels of activation versus sub-optimal activation (eg, exhaustion).
A fundamental unaddressed question is to what extent the TCR or its clonality contributes to T cell activation. Many studies used single-cell RNA-sequencing and examined the distribution of T cell clones among the different activation states in a tSNE or UMAP plot. While some have shown that single clones are largely relegated to either one or two clusters of the plot,62 65–67 few have shown that clones are quite spread out between the different clusters.68 One limitation of these prior studies is that the overall number of cells sequenced per sample, and thus the number of cells per clone, have been limited, often ranging from 8 to 50 cells per clone. However, our studies expand on this question due to our analysis of 56 clones each containing between 50 and 2200 cells, where we found that most of these expanded clones contain cells residing in each of the UMAP’s activated clusters. Thus, a T cell’s TCR may not dictate the activation states that it can achieve. Indeed, when we analyzed the same TCR clonotype shared between a regressor versus a progressor, the distribution of cells showed that ‘shared clonotypes’ in regressors were significantly more abundant in the highest activated cluster (A6), suggesting that the TCR alone was not sufficient to drive optimal activation since the cells with the same TCR clonotype failed to reach cluster A6 in progressors. We postulate that, instead of TCR affinity alone driving differentiation into various activation states, the TME and inflammatory signals cooperate with TCR-based signaling to shape T cell differentiation into different states. Accordingly, our data suggest that regressor TILs are more prevalent in an IFN-stimulated state (A3), with many genes upregulated related to IFN signaling. Therefore, IFN signaling may provide additional co-stimulation to T cells to help drive them into optimal activation states as suggested by prior work.69–72 Of note, we further postulate that regressors may mount a successful antitumor immune response if they have CD8 TILs enriched in clusters A1 and A6 (initial activation and highest activation); or if they have CD8 TILs enriched in cluster A3 (IFN-stimulated). This notion is in line with our overall conclusion that antitumor immune responses appear to be highly heterogeneous in different hosts.
Acknowledgments
The authors would like to thank Nicholas Rotello Kuri and Yonatan Kramer for technical help, and George Devon Trahan for bioinformatic advice. Single-cell sequencing work was performed by the Genomics and Microarray Core at the University of Colorado. MSI slides scanning was performed by the Human Immune Monitoring Shared Resource (HIMSR) at the University of Colorado.
References
Supplementary materials
Supplementary Data
This web only file has been produced by the BMJ Publishing Group from an electronic file supplied by the author(s) and has not been edited for content.
Footnotes
Contributors Conceptualization and supervision: JHW. Study investigation and collected data: RAW, XW, ALK, BCW, SMYC and VP. Computational data analysis and statistical analysis: RAW, AGN and DG. Conceived and designed the analysis: RAW, ZC, X-JW and JHW. Provided patient samples: AJ. Wrote the paper: RAW and JHW.
Funding This work was supported by University of Colorado School of Medicine and Cancer Center startup funds to JHW, and a THI pilot grant to JHW, X-JW and AJ, NIH R01-DE027329 and R01-DE028420 to JHW and X-JW, and a fund from American Cancer Society (ACS IRG #16-184-56) to ZC. XW was supported by an AAI Careers in Immunology Fellowship. RAW is supported by a NIH F31 fellowship (F31DE027854). SMYC was supported by NIH T32-AI007405 and is supported by NCI T32-CA174648. AGN and DG are partially supported by NCI P30CA046934. University of Colorado Genomics and Microarray Core and HIMSR are partially supported by P30CA046934.
Competing interests None declared.
Patient consent for publication Not required.
Ethics approval Animal work was approved by the Institutional Animal Care and Use Committee of University of Colorado Anschutz Medical Campus (Aurora, Colorado, USA). Studies involving human subjects were approved by the Colorado Multiple Institutional Review Board (COMIRB-08-0552 and 16-2436). Informed written consent was obtained from all patients whose tissues were used for this study.
Provenance and peer review Not commissioned; externally peer reviewed.
Data availability statement Data are available in a public, open access repository (NCBI database). Data are available on reasonable request.
Supplemental material This content has been supplied by the author(s). It has not been vetted by BMJ Publishing Group Limited (BMJ) and may not have been peer-reviewed. Any opinions or recommendations discussed are solely those of the author(s) and are not endorsed by BMJ. BMJ disclaims all liability and responsibility arising from any reliance placed on the content. Where the content includes any translated material, BMJ does not warrant the accuracy and reliability of the translations (including but not limited to local regulations, clinical guidelines, terminology, drug names and drug dosages), and is not responsible for any error and/or omissions arising from translation and adaptation or otherwise.