Article Text

Abstract
Background Dysregulated receptor tyrosine kinases, such as the mesenchymal-epidermal transition factor (MET), have pivotal role in gliomas. MET and its interaction with the tumor microenvironment have been previously implicated in secondary gliomas. However, the contribution of MET gene to tumor cells’ ability to escape immunosurveillance checkpoints in primary gliomas, especially in glioblastoma (GBM), which is a WHO grade 4 glioma with the worst overall survival, is still poorly understood.
Methods We investigated the relationship between MET expression and glioma microenvironment by using multiomics data and aimed to understand the potential implications of MET in clinical practice through survival analysis. RNA expression data from a total of 1243 primary glioma samples (WHO grades 2–4) were assembled, incorporating The Cancer Genome Atlas, Chinese Glioma Genome Atlas, and GSE16011 data sets.
Results Pearson’s correlation test from the three data sets indicated that MET showed a robust correlation with programmed death-ligand 1 (PD-L1) and STAT pathways. Western blot analysis revealed that in GBM cell lines (N33 and LN229), PD-L1 and phosphorylated STAT4 were upregulated by MET activation treatment with hepatocyte growth factor and were downregulated on MET suppression by PLB-1001. Tumor tissue microarray analysis indicated a positive correlation between MET and PD-L1 and macrophage-associated markers. Chromatin immunoprecipitation-PCR assay showed enrichment of STAT4 in the PD-L1 DNA. Transwell co-culture and chemotaxis assays revealed that knockdown of MET in GBM cells inhibited macrophage chemotaxis. Moreover, we performed CIBERSORTx and single-cell RNA sequencing data analysis which revealed an elevated number of macrophages in glioma samples with MET overexpression. Kaplan-Meier survival analysis indicated that activation of the MET/STAT4/PD-L1 pathway and upregulation of macrophages were associated with shorter survival time in patients with primary GBM.
Conclusions These data indicated that the MET-STAT4-PD-L1 axis and tumor-associated macrophages might enforce glioma immune evasion and were associated with poor prognosis in GBM samples, suggesting potential clinical strategies for targeted therapy combined with immunotherapy in patients with primary GBM.
- biomarkers
- tumor
- brain neoplasms
- gene expression profiling
- immunity
Data availability statement
Data are available in a public, open access repository. Data are available upon reasonable request.
This is an open access article distributed in accordance with the Creative Commons Attribution Non Commercial (CC BY-NC 4.0) license, which permits others to distribute, remix, adapt, build upon this work non-commercially, and license their derivative works on different terms, provided the original work is properly cited, appropriate credit is given, any changes made indicated, and the use is non-commercial. See http://creativecommons.org/licenses/by-nc/4.0/.
Statistics from Altmetric.com
Introduction
Gliomas account for the highest proportion of adult malignant brain tumors and are divided into WHO grades 2–4 based on their distinct pathology and clinical outcomes.1 WHO grade 4 gliomas are often referred to as glioblastomas (GBMs). GBMs are categorized into primary glioblastomas (pGBMs) and secondary glioblastomas (sGBMs) according to the course of development and occurrence.2 pGBMs generally occur in elderly patients and have the highest malignancy, while sGBMs gradually evolve from early lower grade gliomas (LGGs)3 within 5–10 years. Despite standard treatments for GBMs, including maximum safety resection combined with radiotherapy and chemotherapy, the median patient survival is approximately 14.6 months.4 Immunotherapy offers a novel option for cancer treatment based on improved understanding of the interactions between cancer and immunology.5 The programmed death-ligand 1 (PD-L1) and programmed cell death protein 1 (PD1) axis is among the promising immune checkpoints that effectively help the cancer cells in eluding the immune system.6 In gliomas, PD-L1 has been reported to regulate T cell and macrophage-related immunity and predict worse survival.7 However, moderate response to PD1/PD-L1 inhibitor therapies has been observed in most clinical trials for glioma, especially in patients with GBM.
Mesenchymal-epidermal transition factor (MET), as one of the receptor tyrosine kinases, acts as a definite driver of cancer and plays a key role in weakening inflammation and inducing an immunosuppressive microenvironment.8 MET exon 14 skipping (METex14) and PTPRZ1–MET fusion are observed to induce tumor-associated macrophage (TAM) recruitment and promote tumor progression in sGBMs.9 In lung cancer, MET activation promotes expression of immune checkpoint PD-L1 mediated by AKT (Protein kinase B, PKB),10 implicating a potential relationship between MET and tumor immunity. However, the immunotherapeutic effect on tumor initiation and progression through the MET pathway has not been explored in pGBMs.
In this study, we investigated the correlation between MET and representative immune checkpoints, especially PD-L1, in primary gliomas with WHO grades 2–4, including GBM. Through this study, we aimed to demonstrate the relationship between MET and the immune microenvironment to further provide potential choices of targeted therapy combined with immunotherapy for patients with pGBM.
Materials and methods
RNA expression and clinical data collection
In The Cancer Genome Atlas (TCGA) data set (https://cancergenome.nih.gov/), RNA sequencing data of 702 primary gliomas, ranging from WHO grades 2 to 4, were obtained as an independent training set. RNA expression microarray data of 265 primary gliomas from the Chinese Glioma Genome Atlas (CGGA) database (http://www.cgga.org.cn) and 276 primary gliomas from the GSE16011 database (http://www.ncbi.nlm.nih.gov/geo/query/acc.cgi?acc=GSE16011) were obtained as independent validation sets, respectively. Clinical and molecular characteristics of these patients were available and are described in online supplemental table S1. Written informed consent was obtained for all patients.
Supplemental material
Detection of IDH1/2 mutations in gliomas
IDH1/2 mutations are the most common biomarkers in gliomas. In the CGGA data set, IDH1/2 mutations were commonly detected by pyrosequencing technique,11 and IDH1/2 mutation data downloaded online from TCGA were mainly obtained by whole exon sequencing or pyrosequencing.12
Cell culture
The IDH-wildtype GBM cell line, N33, was extracted from fresh glioma of a female patient shortly after surgery in Beijing Tiantan Hospital.13 Patient-derived N33 cell lines have been authenticated after stable passage. The short tandem repeat analysis indicated that N33 was not cross-contaminated with other human cell lines and did not have a 100% match with any cell line in the ATCC (American Type Culture Collection) or DSMZ (German Collection of Microorganisms and Cell Cultures) database. The human GBM cell line LN229 and the human monocytic cell line THP-1 were obtained from the Chinese Academy of Sciences. The glioma cells were cultured in DMEM medium (Dulbecco’s modified Eagle’s medium, Gibco) and THP-1 cells were cultured in Roswell Park Memorial Institute (RPMI) 1640 Medium, supplemented with 10% fetal bovine serum (FBS, Gibco) and 1% penicillin/streptomycin (Gibco, Thermo Scientific, New York, USA) in a humidified 5% CO2 atmosphere at 37°C.
Western blot analysis
Before western blot analysis, N33 and LN229 cell lines were treated with hepatocyte growth factor (HGF) (200 ng/mL), or HGF/PLB-1001 (Bozitinib, 100 µM) combined, for 24 hours. Then whole-cell lysates from the cells were prepared on ice in radioimmunoprecipitation buffer, supplemented with 1% PMSF (phenylmethylsulfonyl fluoride) for 30 min. The protein concentrations were determined by Coomassie Brilliant Blue using a microplate spectrophotometer (Infinite M200 PRO, Tecan). Forty micrograms of total protein from cell lysates were loaded on a 10% SDS-PAGE (sodium dodecyl sulfate-polyacrylamide gel electrophoresis) gel and then transferred to PVDF (polyvinylidene fluoride) membranes (Merck Millipore). Primary antibody was diluted with 1X TBST (Tris-buffered saline with Tween-20) with 5% non-fat dry milk. The membranes were incubated overnight with primary antibody at 4°C and then with horseradish peroxidase-conjugated secondary antibodies (Pierce, USA) at room temperature for 1 hour. Primary antibodies included Met (#8198, 1:1000; Cell Signaling Technology), phosphorylated-Met (#3077, 1:1000; Cell Signaling Technology), PD-L1 (ab213524, 1:1000; Abcam), phoshorylated-Stat4 (#5267, 1:1000; Cell Signaling Technology), phoshorylated-Stat3 (#9145, 1:2000; Cell Signaling Technology), phoshorylated-Stat6 (#56554, 1:1000; Cell Signaling Technology), Stat4 (ab68156, 1:1000; Abcam), Stat3 (ab119352, 1:5000; Abcam), Stat6 (ab32520, 1:1000; Abcam), and glyceraldehyde 3-phosphate dehydrogenase (GAPDH) (60004–1-Ig, 1:5000, Proteintech). Protein signals were visualized using the ECL Western Blotting Detection System (Bio-Rad). Relative protein levels were quantified using GAPDH as the loading control. All antibodies used in the experiment are summarized in online supplemental table S2.
Chromatin immunoprecipitation
Chromatin immunoprecipitation (ChIP) was performed using the Pierce Magnetic ChIP Kit (26157, Thermo) according to the manufacturer’s instructions. Glioma cells (1×10⁷/mL) were fixed with 1% formaldehyde for 10 min, then neutralized with glycine for 5 min, and washed with cold PBS (phosphate buffered saline), scraped, and stored on ice. To obtain 300–1000 bp of DNA fragments, we resuspended the cells in the ChIP lysis buffer and sonicated 10 times (10 s/20 s on/off cycle) with a microtip probe sonicator (Branson, SLPE, USA). The lysate was immunoprecipitated overnight with antibody-coupled magnetic beads at 4°C. Antibodies included Stat4 (#2653, 1:50; Cell Signaling Technology) and normal rabbit IgG as a negative control. A magnetic rack was used to collect immune precipitates, and the beads were washed and bound chromatin was eluted in the ChIP elution buffer. The chromatin products were treated with proteinase K (65°C, 1.5 hours) and purified using a DNA clean-up column in the ChIP Kit. Finally, input and IgG and STAT4 (signal transducer and activator of transcription 4) immunoprecipitated DNA were analyzed by quantitative real-time PCR (qRT-PCR).
The specific primers used for PCR were as follows: forward-5′AACTCCTGAGTCACCTCCAT3′; reverse-5′TCCTGTGGGGAAGCTATGTT3′.
Tissue microarray and immunohistochemical staining
Formalin-fixed, paraffin-embedded glioma specimens were used to make primary glioma tissue microarray, which included 39 LGGs with IDH mutation and 42 GBMs with IDH-wildtype. Tissue microarray was cut (5 µm section), deparaffinized, and rehydrated before antigen repair in buffer specified by the manufacturer. After blocking endogenous peroxidase activity with ethanol containing 3% hydrogen peroxidase, we incubated sections in primary antibody overnight at 4°C, followed with secondary antibodies (anti-mouse or anti-rabbit). In this study, our stained sections were scored by three experienced pathologists. According to the intensity and extent of positive cells expression, quantitative interpretation was made in an immunohistochemistry experiment. The staining intensity was 0–3 points: 0 (negative), 1 (weak), 2 (moderate), and 3 (strong). The extent of staining reflected the percentage of positive cells: 0 (<5%), 1 (6%–25%), 2 (26%–50%), 3 (51%–75%), and 4 (>75%). Staining index was defined as the product of staining intensity and staining extent. For each primary antibody, we did preliminary experiment. We selected two times, equal to, or half of the recommended dilution concentration for the experiment, and the best results of positive expression were used for the formal experiment.
Gene set enrichment analysis and gene ontology analysis
Transcriptome data matrix was uploaded to a gene set enrichment analysis (GSEA) software (http://software.broadinstitute.org/gsea/index.jsp) for GSEA14 and patients were divided into two groups based on MET median expression. Differently expressed genes (fold change >2 and FDR (false discovery rate)-adjusted p-value of Student’s t-test <0.05) between the two groups were filtered and upregulated genes in the METhigh group were chosen for gene ontology (GO) analysis in DAVID (https://david.ncifcrf.gov/).
CIBERSORTx
We used CIBERSORTx (https://cibersortx.stanford.edu) to quantify the relative levels of different immune cell types in complex gene expression mixtures. We analyzed all samples from the three data sets with original CIBERSORTx gene signature file LM22, which covered 22 immune cell subtypes. The total fraction of macrophages was calculated as the sum of M0, M1 and M2 macrophages. Student’s t-test was used to compare the fraction of 22 immune cells between MET high and low expression groups. High-resolution analysis module allowed us to purify multiple transcriptomes for each cell type from a cohort of related tissue samples, and we further chose to purify macrophage and three subtypes and labeled patients with MET high and low expressions in tSNT (t-Distributed Stochastic Neighbor Embedding) plots.
Lentivirus infection and THP-1 monocytic cells polarization
Glioma cells were infected with the MET shRNA lentiviral vector (target sequence: TCAACTTCTTTGTAGGCAATA; Genechem, Shanghai, China) or a negative control (target sequence: TTCTCCGAACGTGTCA) for 36–48 hours and selected by ampicillin. The expression of the fluorescent reporter gene (enhanced green fluorescent protein) in stably transfected cell lines was observed under a fluorescence microscope (online supplemental figure S10A). MET proteins from the infected glioma cells were verified by western blotting.
We selected the human monocytic leukemia cell line THP-1 (Chinese Academy of Sciences, China), which showed similar characteristics to human macrophages after differentiation.15 16 Then we adopted a differentiation and functional polarization protocol that was shown to be effective for THP-1 cells.17 THP-1 cells were stimulated with 320 nM phorbol 12-myristate 13-acetate (Sigma, St Louis, Missouri, USA) at 37°C for 6 hours. Then differentiated THP-1 cells were treated with either LPS (Lipopolysaccharide, 100 ng/mL) for 72 hours or IL-4 (Interleukin-4, 20 ng/mL) and IL-13 (Interleukin-13, 20 ng/mL) for 72 hours to obtain M1-like and M2-like phenotypes, respectively. Later, we extracted RNA from M1 and M2 polarized macrophage-like populations for qRT-PCR analysis to identify the two phenotypes (online supplemental figure S10B). Representative RNAs expressed in M1-like and M2-like macrophages and their corresponding primers are summarized in online supplemental table S3.
Transwell co-culture and chemotaxis assay
M2-like macrophages (2.5×10⁵) were cultured without serum in the upper chamber of the Transwell plate (size 5 µm, Corning, New York, USA) and glioma cells (2.5×10⁵) were cultured with 10% FBS in the bottom chamber at 37°C for 24 hours. After fixing with 4% formalin, M2-like macrophages were stained with 0.1% crystal violet and three fields were randomly selected for counting.
Single-cell RNA sequencing data analysis
Single-cell RNA sequencing data were downloaded from GSE131928 on the GEO (Gene Expression Omnibus) website. We profiled 16,201 single cells from 9 IDH-wildtype GBM samples by 10X single-cell RNA sequencing.18 Gene-barcode matrices were analyzed with the R package ‘Seurat’ and went through a standard preprocessing workflow. To reduce the gene expression matrix to its most important features, we used principal component analysis (PCA) to decrease the dimensionality of the data set. To visualize data in two-dimensional space, we passed the PCA-reduced data into UMAP (uniform manifold approximation and projection), a non-linear dimensional reduction method. We defined METhigh/low expression as the average MET expression of tumor cells in one sample more/less than that of all tumor cells. Based on these criteria, three GBM samples (MGH105, MGH124, MGH126) were classified into the METhigh group and six (MGH102, MGH114, MGH115, MGH118, MGH125, MGH143) into the METlow group.
InferCNV
InferCNV (https://github.com/broadinstitute/inferCNV) uses tumor single-cell RNA sequencing expression to visualize chromosomal copy number variation in cells, such as gains or deletions of entire chromosomes or large segments of chromosomes. This is achieved by exploring the intensity of gene expression at different locations in the tumor genome compared with a set of reference ‘normal’ cells. It generates a heatmap to illustrate the relative intensity of each chromosome.
Statistical analysis and graphics
Our statistical analysis and graphics were mainly performed in a software environment, R V.4.0.0 (http://www.r-project.org). Several R packages (circlize, corrgram, ggpubr, Hmisc, survminer and Seurat) were performed for graphics. Survival analysis was performed with the Kaplan-Meier method using two-sided log-rank test. P<0.05 was considered statistically significant. All experiments were repeated three times.
Results
MET expression is positively associated with expression of PD-L1 and STAT pathways
To study the whole transcriptomic RNA expression profiles of primary gliomas, we investigated the correlation between MET expression and other genes from the three data sets. Circos plots of all three data sets showed that MET expression was positively related to checkpoint genes in gliomas of all grades from patients with LGG and GBM (figure 1A and online supplemental figure S1). Among all immune checkpoint genes, MET was most closely related to PD-L1 (r=0.44, p<2.2e-16) and PD1 (r=0.26, p=2.4e-12) (figure 1B and online supplemental figure S2). The PD-L1/PD1 axis is considered a well-known target for cancer immunotherapy, which plays a vital role in the immune escape mechanism during carcinogenesis.19 Meanwhile, as MET expression increased, PD-L1 and PD1 expressions increased simultaneously (figure 1C and online supplemental figure S3).

Correlation between MET and immune checkpoints in RNA expression level in primary gliomas. (A) MET expression is positively associated with expression of PD-L1 in TCGA and CGGA data sets. (B) The scatter diagrams show the coexpression patterns of MET and PD-L1/PD1/TIM-3. (C) With the increase of MET expression, the expression of PD-L1 increased gradually. (D) MET/PD-L1 expression positively correlated with STAT pathway in the TCGA data set. Corrgrams are derived according to Pearson’s r value between MET/PD-L1 and three pathways (STAT, AKT, and MAPK). In both the lower shade charts and the upper pie charts, positive correlations are displayed in red and negative correlations in green. Color intensity and the size of the circle are proportional to the correlation coefficients. CGGA, Chinese Glioma Genome Atlas; GBM, glioblastoma; LGG, lower grade glioma; MET, mesenchymal-epidermal transition factor; PD1, programmed cell death protein 1; PD-L1, programmed death-ligand 1; TCGA, The Cancer Genome Atlas; STAT, signal transducer and activator of transcription; AKT, protein kinase B; MAPK, mitogen-activated protein kinase.
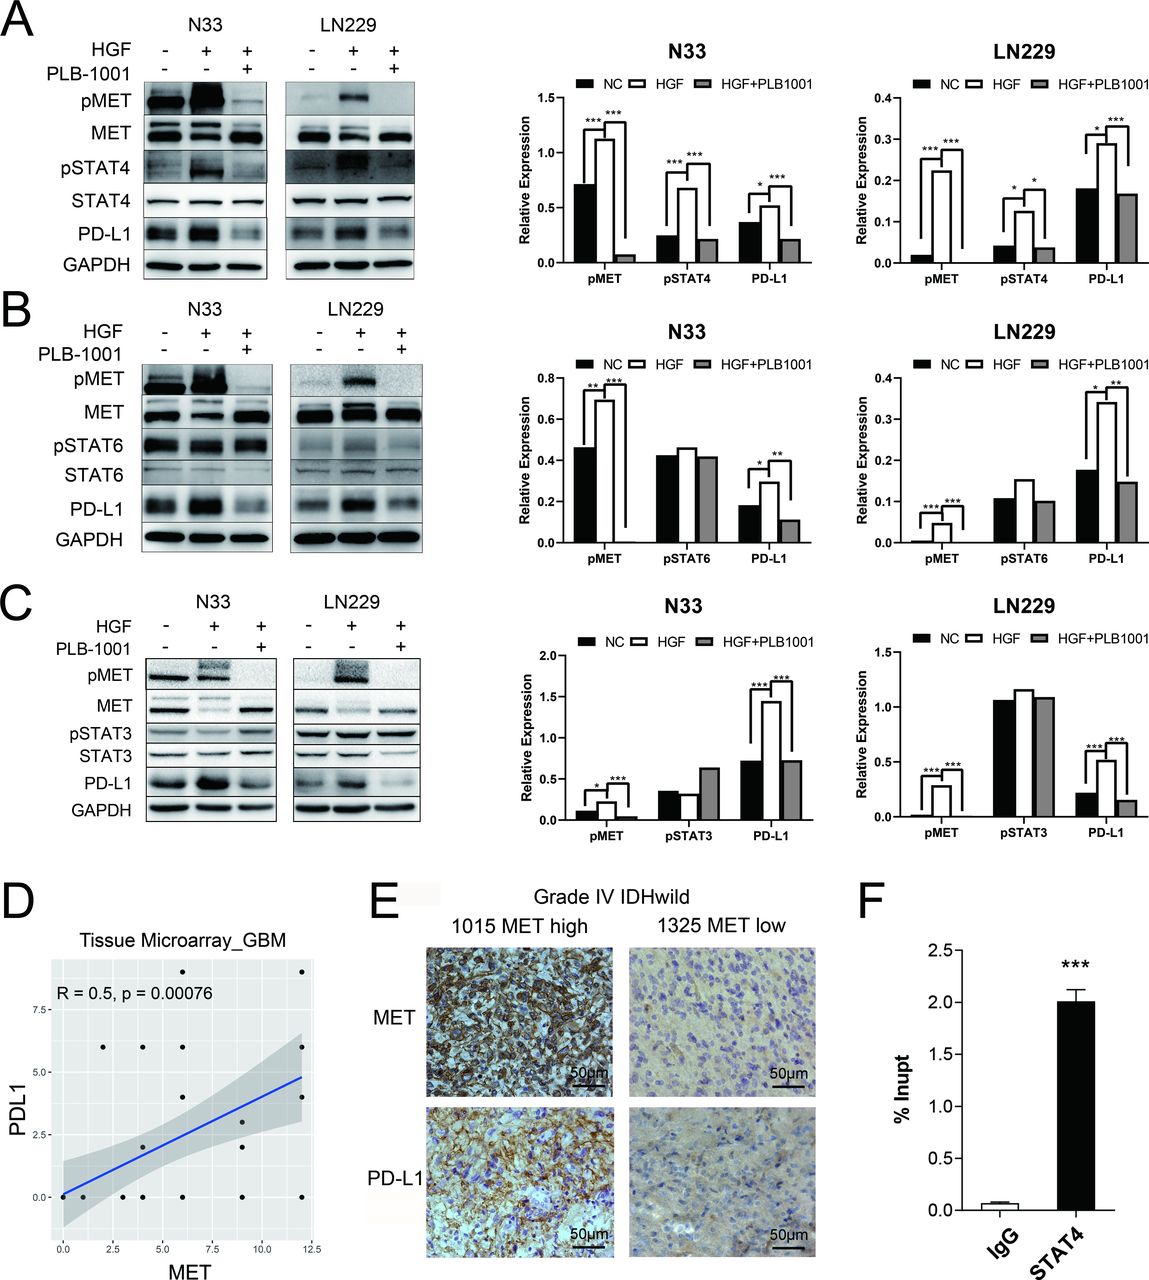
MET triggered an increase in PD-L1 protein expression through STAT4 pathway. (A–C) Western blot of the indicated proteins in N33 and LN229 cell lines on treatment with HGF (200 ng/mL), and HGF/PLB-1001 (100 µM) combined, for 24 hours. GAPDH, protein-loading controls. Quantitative results of western blot analysis and relative expression difference are shown on the right panel. Fisher’s exact test, *p<0.05, **p<0.01, ***p<0.001. (D) In the IHC analysis of the tissue microarray, the scatter plot shows the correlation between the expression of MET and PD-L1 proteins in GBM. (E) Photographs of IHC staining of two representative WHO 4 (IDH-wildtype) primary glioma. Positive cells are stained brown. Magnification, 400×. (F) The statistical result of chromatin immunoprecipitation assay confirming the binding of STAT4 to the PD-L1 DNA. Student’s t-test, ***p<0.001. GAPDH, glyceraldehyde 3-phosphate dehydrogenase; GBM, glioblastoma; HGF, hepatocyte growth factor; IHC, immunohistochemistry; MET, mesenchymal-epidermal transition factor; PD-L1, programmed death-ligand 1; pMET, phosphorylated MET; pSTAT4, phosphorylated STAT, signal transducer and activator of transcription; PLB-1001, Bozitinib; NC, negative control.

Kaplan-Meier survival analysis of MET, STAT4, and PD-L1 in primary GBM of TCGA (A) and CGGA (B) data sets. Survival analysis was performed using Kaplan-Meier curve method in conjunction with two-sided log-rank test. CGGA, Chinese Glioma Genome Atlas; GBM, glioblastoma; MET, mesenchymal-epidermal transition factor; OS, overall survival; PD-L1, programmed death-ligand 1; TCGA, The Cancer Genome Atlas.
We then investigated which downstream signaling pathway was most associated with MET in gliomas. We performed Pearson’s correlation and found that STAT pathways (especially STAT4 and STAT6) were positively correlated with MET expression significantly in all grades of glioma, LGG and GBM (p<0.05; figure 1D). Meanwhile, a significant correlation was observed between the PD-L1 and STAT pathways. Consistent with the TCGA data set, the correlation was also robust in the other two data sets (online supplemental figure S4).

MET was closely related to glioma immunity, especially macrophage immunity. (A) GSEA results show that GO terms related to immunity are enriched in the METhigh group. (B) Volcano plot shows differently expressed genes between METhigh and METlow groups. Red dots: significantly upregulated genes in the METhigh group; blue dots: downregulated genes in the METhigh group. (C) Bubble plot shows upregulated biological process in the METhigh group. (D and E) Macrophage abundance was determined with digital cytometry in CIBERSORTx. The total fraction of macrophages and subtypes (M0, M1, M2) in the METhigh and METlow groups of TCGA and CGGA data set. (F and G) Visualizations of the resulting GEPs with tSNE plots which show macrophage and M2 macrophage expression difference between the METhigh and METlow groups of TCGA and CGGA data sets. CGGA, Chinese Glioma Genome Atlas; GEPs, gene expression profiles; GO, gene ontology; GSEA, gene set enrichment analysis; MET, mesenchymal-epidermal transition factor; TCGA, The Cancer Genome Atlas; tSNE, t-distributed stochastic neighbor embedding; DEG, differently expressed genes; FDR, false discovery rate.
MET-dependent regulation of PD-L1 expression is mediated by STAT4 pathway
In N33 and LN229 cell lines treated with HGF, phosphorylated MET was stimulated, accompanied by upregulation of phosphorylated STAT4 (pSTAT4) and PD-L1, as confirmed by western blotting (figure 2A–C). However, the levels of pSTAT3 and pSTAT6 were not affected by MET activation. Conversely, treatment with PLB-1001, a highly selective ATP-competitive small molecule MET inhibitor, significantly inhibited the expression of PD-L1 and pSTAT4, but not pSTAT3 and pSTAT6.
Next, we used primary glioma tissue microarrays for immunohistochemical (IHC) analysis. Using tissue microarray of 42 GBMs with IDH-wildtype, Pearson’s correlation analysis showed that the MET protein expression was positively correlated with PD-L1 protein expression (r=0.5, p=0.00076; figure 2D). We observed more glioma cells with stronger staining of PD-L1 in a MET-overexpressing patient with GBM (sample identification: CGGA_1015) compared with a MET-downregulated patient (sample identification: CGGA_1325) (figure 2E). However, the tissue microarray consisting of 39 LGGs with IDH mutations demonstrated no correlation between MET protein expression and PD-L1 protein expression (r=0.01, p=0.95; online supplemental figure S5A). These results indicate that MET-dependent regulation of PD-L1 expression is mainly observed in patients with GBM.

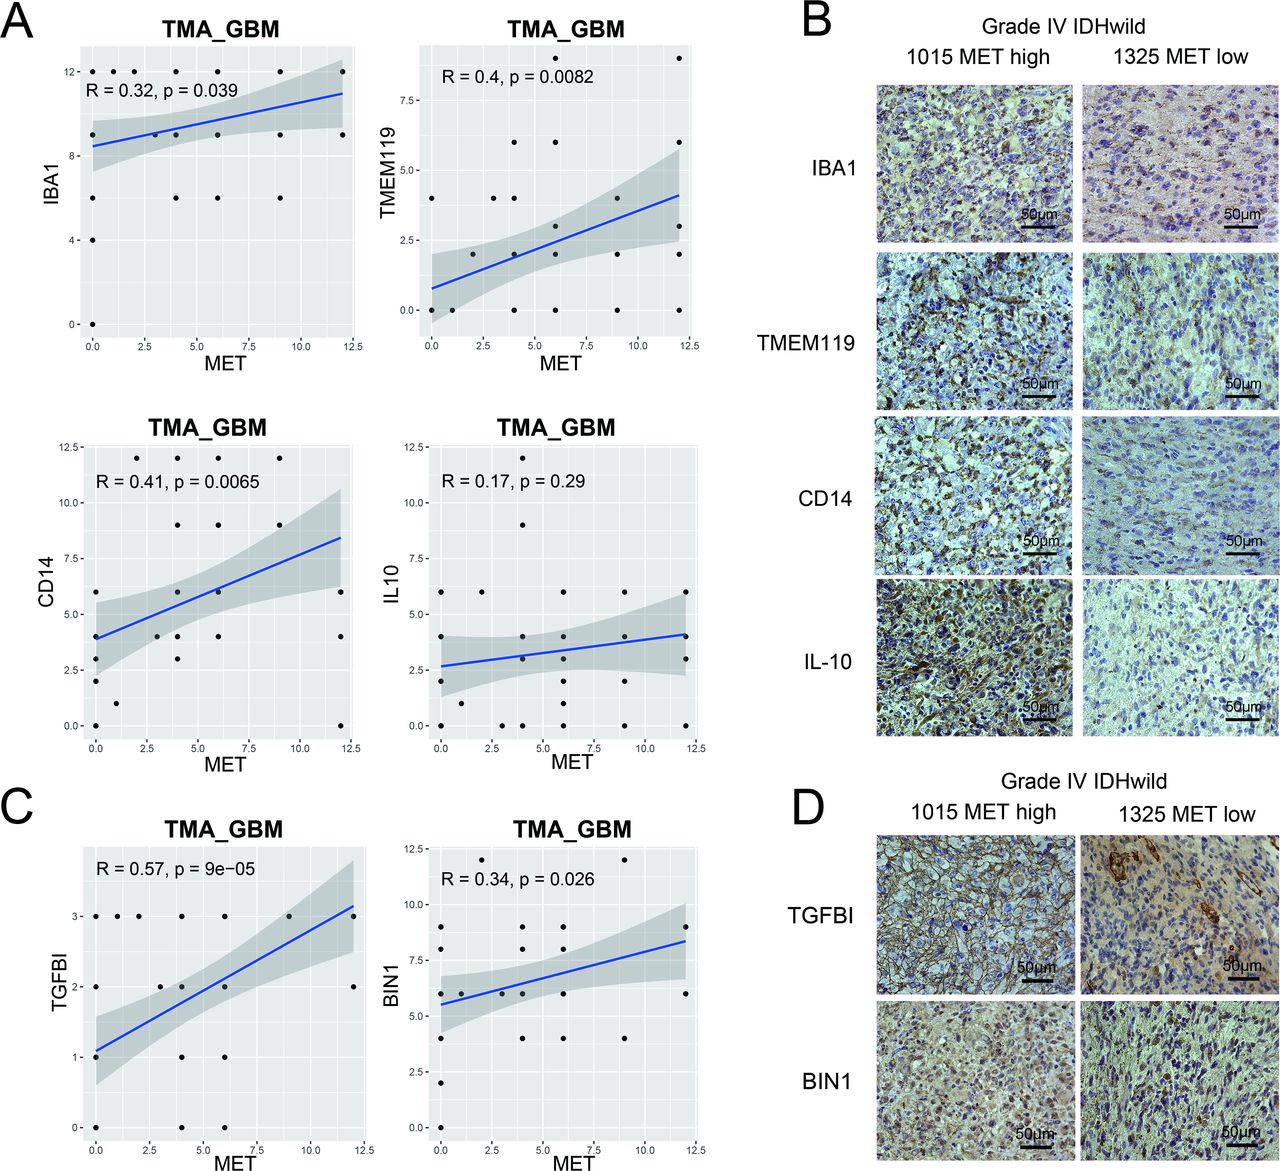
Tissue microarray of primary GBM verified the association between MET and macrophage-associated markers. (A) Macrophage-associated markers (IBA1 and TMEM119) and M2-like polarization markers (CD14 and IL-10). (C) Blood derived-like marker (TGFBI) and resident-like marker (BIN1). (B and D) Photographs of immunohistochemical staining of two representative primary IDH-wildtype GBM. Positive cells are stained brown. Magnification, 400×. GBM, glioblastoma; IL, interleukin; MET, mesenchymal-epidermal transition factor; TMA, tissue microarray.
To further investigate whether STAT4 was mechanistically involved in MET-induced upregulation of PD-L1 expression, we first screened the hTFtarget database20 and found that PD-L1 was a target gene of STAT4 by ChIP-seq assay. Then, we performed ChIP-PCR assay in N33 cells. The binding between PD-L1 DNA and STAT4 was found significantly stronger than that of IgG in N33 (p<0.001; figure 2F), suggesting the transcriptional regulation of PD-L1 expression by STAT4.
MET/STAT4/PD-L1 overexpression is associated with poor prognosis
We then analyzed the prognostic value of the MET/STAT4/PD-L1 pathway in patients with primary glioma. We divided the patients into two groups based on the cut-off value (median RNA-seq expression of MET, STAT4, or PD-L1). First, we investigated the MET expression level of all patients (primary diagnosis of WHO grade 2/3/4 glioma and patients during follow-up) in relation to overall survival and found that patients with high MET expression had a significantly shorter overall survival time than patients with low MET expression (online supplemental figure S6B). Concurrently, we observed that patients with high expression of STAT4 and PD-L1 demonstrated a shorter overall survival time than those with downregulation of STAT4 and PD-L1. We also analyzed the prognostic value in LGG and GBM and found a more significant prognostic value in patients with GBM (figure 3 and online supplemental figure S6A,C). These results revealed that overexpression of the MET/STAT4/PD-L1 pathway was associated with poor prognosis in patients with primary glioma, especially in patients with GBM.
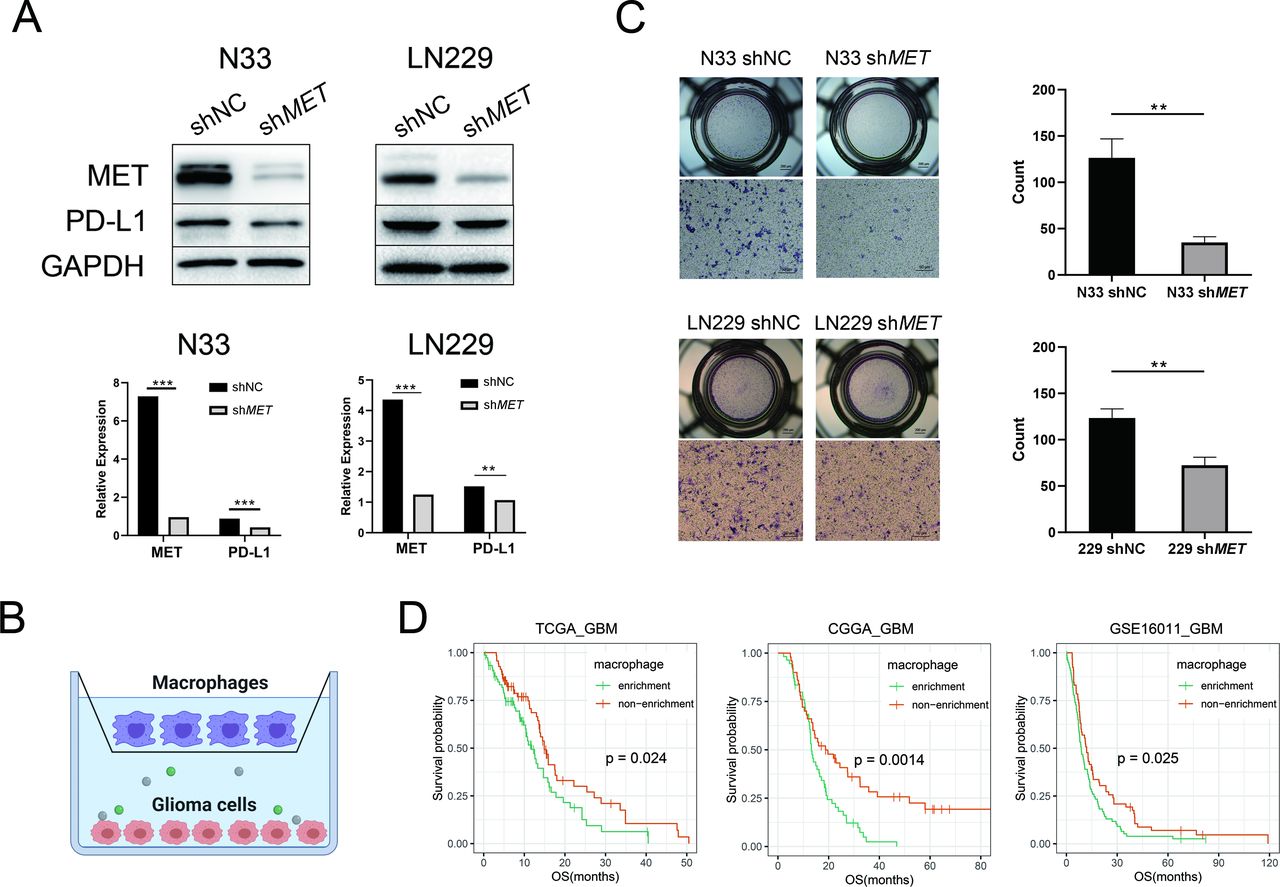
MET recruited macrophages and decreased survival in primary GBM. (A) Western blotting of MET and PD-L1 protein in N33 or LN229 cells infected with the MET shRNA lentiviral vector or a negative control. Quantitative results of western blot analysis and relative expression difference are shown below. Fisher’s exact test, *p<0.05, **p<0.01, ***p<0.001. (B) A schematic diagram of the co-culture of macrophages and glioma cells in the Transwell system. Created with BioRender. (C) Transwell assays reveal that the knockdown of MET inhibits the chemotaxis of M2-like macrophages by GBM cells (N33 and LN229). Student’s t-test, **p < 0.01. (D) Patients with GBM with macrophage enrichment lived significantly shorter than other patients in all data sets. CGGA, Chinese Glioma Genome Atlas; GAPDH, glyceraldehyde 3-phosphate dehydrogenase; GBM, glioblastoma; MET, mesenchymal-epidermal transition factor; PD-L1, programmed death-ligand 1; OS, overall survival; TCGA, The Cancer Genome Atlas; sh, short hairpin; NC, negative control.
MET overexpression is associated with immunity pathways
To further evaluate MET-related biological processes, we divided patients with primary glioma from the CGGA data set into METhigh and METlow groups based on the median MET expression as the cut-off value and performed GSEA between the two groups. Interestingly, the GSEA results showed that immunity pathways were enriched in the METhigh group, including ‘activation of innate immune response’, ‘leukocyte homeostasis’, ‘myeloid leukocyte activation’, ‘myeloid leukocyte differentiation’, etc (figure 4A and online supplemental figure S7). Enrichment of the STAT cascade was observed in the METhigh group. Meanwhile, we compared the expression difference and calculated the fold change with FPKM (fragments per kilobase of transcript per million mapped reads) values between the two groups. The volcano plot showed significantly differentiated genes (fold change >2 and FDR of Student’s t-test <0.05; figure 4B). A total of 584 upregulated genes in the METhigh group were selected for GO enrichment analysis using the DAVID tool. We detected enrichment in the biological processes of inflammatory response (FDR=4.59E-21, Benjamini=6.35E-21), immune response (FDR=3.94E-15, Benjamini=1.82E-15), chemotaxis (FDR=1.75E-12, Benjamini=4.87E-13), and leukocyte migration (FDR=9.70E-09, Benjamini=1.92E-09) in the METhigh group (figure 4C).
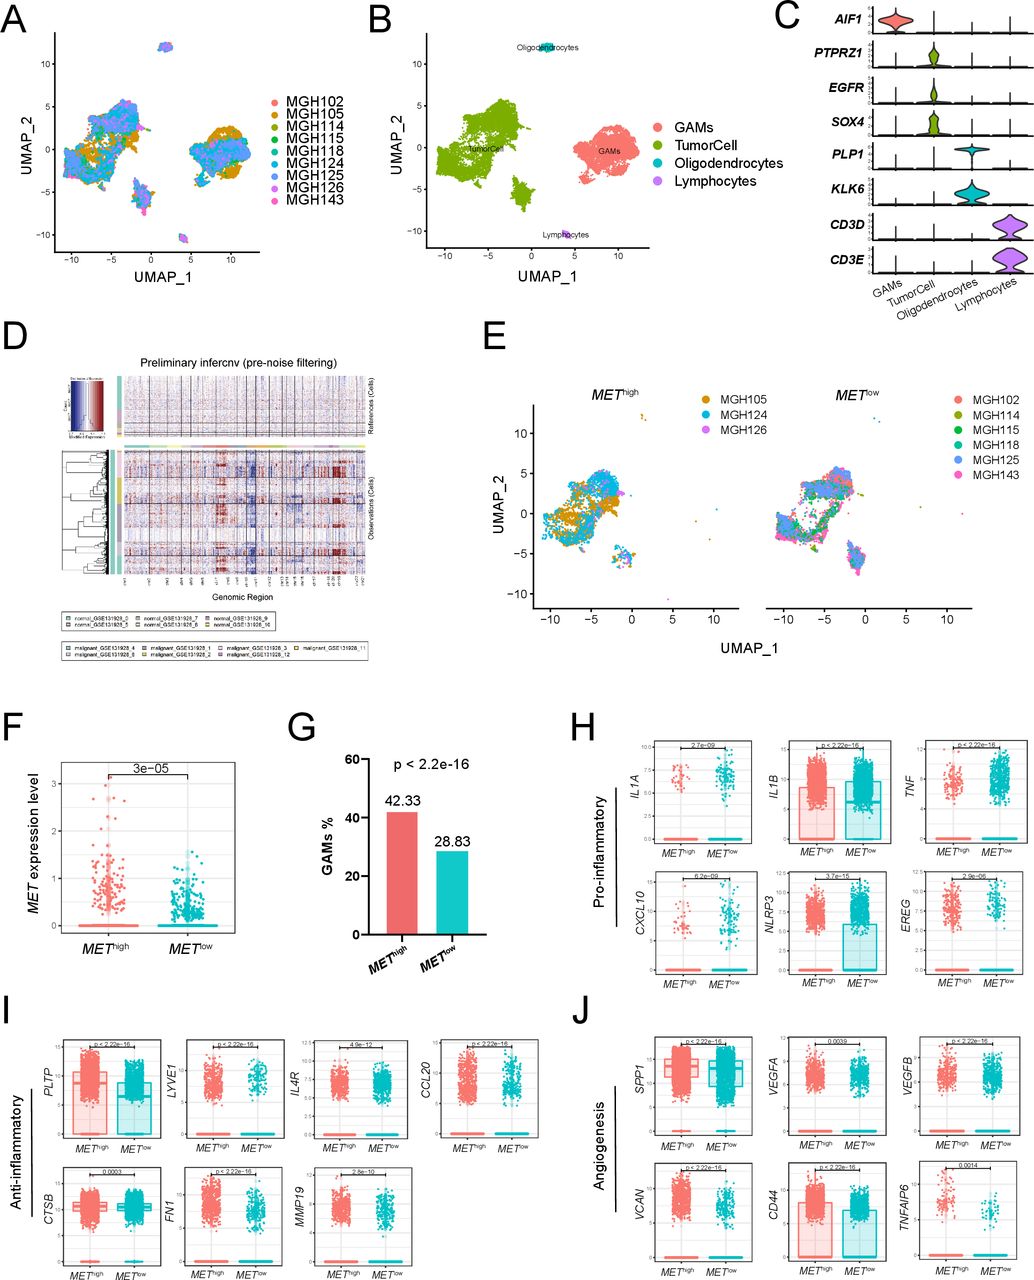
Single-cell transcriptome analysis of primary IDH-wildtype GBM. Two-dimensional UMAP shows dimensional reduction of data from single cells. (A) Nine samples are integrated and cells from each sample are differently colored. (B) Cells from nine samples are clustered into four groups including GAMs. (C) The violin plots show the expression of marker genes for the four groups of cells. (D) Nine samples are integrated for InferCNV analysis. The upper part of the heatmap shows the normal cells and the lower part shows the malignant cells. The red and blue colors refer to gains or deletions of chromosomes, respectively. (E) The UMAP plot shows tumor cells from the METhigh and METlow groups. (F) The boxplot shows the level of MET expression in tumor cells from the METhigh and METlow groups. (G) Proportion of GAMs in the METhigh group (42.33%) and the METlow group (28.83%). Expression of proinflammatory mediators (H), anti-inflammatory mediators (I), and angiogenesis-associated genes (J) in GAMs from the METhigh and METlow groups. GAMs, glioma-associated microglia, monocytes and macrophages; GBM, glioblastoma; MET, mesenchymal-epidermal transition factor; UMAP, uniform manifold approximation and projection.
MET overexpression is associated with macrophage enrichment
To evaluate the impact of MET expression on immune cells in primary gliomas, we imputed 702 RNA expression data from the TCGA data set by using CIBERSORTx (https://cibersortx.stanford.edu/) high-resolution analysis module and observed a significant increase in the macrophage fraction in the METhigh group (figure 4D). Consistent results were obtained on calculating the proportion of macrophages in the CGGA and GSE16011 databases (figure 4E and online supplemental figure S8A). In contrast, we did not find a significant difference in T cells between the METhigh and METlow groups (online supplemental figure S9). To digitally ‘purify’ cell type-specific gene expression profiles (GEPs) from bulk RNA-seq profiles, we applied the LM22 signature matrix to visualize macrophage GEPs. We identified different patterns of gene expression in macrophages and alternatively activated (M2) macrophages in METhigh and METlow patients (figure 4F,G and online supplemental figure S8B). Identification of two groups of patients with specific biomarkers (macrophage-associated markers: AIF1; M2-like marker: CD14) showed high expression of AIF1 or CD14 biomarkers in the METhigh group (online supplemental figure S8C,D).
We validated the findings by histological staining of macrophage-associated markers (IBA1, TMEM119)21 and M2-like polarization markers (CD14, IL-10)22 with primary glioma tissue microarrays. In GBM samples, Pearson’s correlation analysis showed that MET protein expression levels were significantly positively correlated with IBA1 (r=0.32, p=0.039), TMEM119 (r=0.4, p=0.0082), and CD14 (r=0.41, p=0.0065) protein expression levels (figure 5A). More cells with stronger staining of IBA1, TMEM119, CD14, and IL-10 were found in a METhigh patient with GBM compared with a METlow patient (figure 5B). However, in the LGG tissue microarray, Pearson’s correlation analysis showed a positive correlation between MET protein expression level and macrophage-associated markers, but not M2-like polarization marker expression levels (online supplemental figure S5B,C). Furthermore, it was observed that MET protein expression levels were significantly positively correlated with both blood derived-like marker (TGFBI) and resident-like marker (BIN1)23 in GBM (figure 5C,D) but not in LGG (online supplemental figure S5D). These results revealed that MET overexpression was associated with macrophage enrichment in GBM.
MET-chemotactic macrophage validation and patients’ overall survival
To verify the chemotaxis effect of MET on macrophages, we first knocked down MET in N33 and LN229 cells (figure 6A). Western blotting showed that MET protein expression levels significantly decreased in the shMET (short hairpin RNA targeting MET) group compared with that in the control group. Meanwhile, PD-L1 protein was significantly downregulated in the shMET group. Later, shMET cell lines were co-cultured with M2-like macrophages (functionally polarized from human monocytic leukemia THP-1 cells) in a Transwell system (figure 6B). We observed that the number of migrated M2-like macrophages in the upper chamber markedly decreased on knockdown of MET in both cell lines (p<0.01; figure 6C), which indicated that MET expression in glioma cells could promote chemotaxis of macrophages. To understand the effect of macrophages on patient prognosis, we further divided the patients into two groups based on the median macrophage fraction as cut-off. Patients with macrophage enrichment had significantly worse survival than those with macrophage deficiency, especially in patients with GBM (figure 6D and online supplemental figure S10C).
Single-cell transcriptome analysis of pGBM
To deeply analyze gene expression in tumor entities and their microenvironment in single-cell resolution, we downloaded single-cell RNA sequencing data of nine IDH-wildtype GBM samples from GSE131928.18 After integrating cells from nine samples (figure 7A), we divided all cells into four groups, including glioma-associated microglia, monocytes and macrophages (GAMs), tumor cells, oligodendrocytes, and lymphocytes (figure 7B). The expression of marker genes for the four groups of cells is shown in figure 7C. InferCNV analysis showed significant copy number variation in the ‘malignant’ cell groups compared with the reference ‘normal’ cell groups (figure 7D). Then, based on the comparison of the average MET expression between all tumor cells and tumor cells in each sample, we classified three samples into the METhigh group and six samples into the METlow group (figure 7E). The expression of MET in the tumor cells of the METhigh group was significantly higher than that of the METlow group (p=3e-05; figure 7F). Next, we further evaluated the differences in GAMs between the two groups of patients. We found that the proportion of GAMs in the METhigh group was significantly higher than that in the METlow group (p<2.2e-16; figure 7G). Moreover, compared with the METlow group, the GAMs in the METhigh group showed significantly higher expression of anti-inflammatory mediators (PLTP, LYVE1, IL4R, CCL20, CTSB, FN1, MMP19, p<0.05; figure 7I) and angiogenesis-associated genes (SPP1, VEGFA, VEGFB, VCAN, CD44, TNFAIP6, p<0.05; figure 7J), but lower expression of proinflammatory mediators (IL1A, IL1B, TNF, CXCL10, NLRP3, EREG, p<0.05; figure 7H). These results suggested that GAMs in the METhigh group were associated with an inflammatory suppressive state and angiogenesis in GBM.
Discussion
MET alterations, including mutation, amplification, and fusion, have been reported as key genomic and transcriptomic events in many types of cancer. Interestingly, MET alterations and overexpression induce different types of cancers in various functional ways. MET constitutive phosphorylation was identified to occur independently of the MET ligand HGF mediated by MET amplification, mutation, or overexpression, and by MET interaction with other cell surface molecules in breast cancer.24 FISH (fluorescence in situ hybridization), quantitative PCR, and IHC analyses demonstrated that not all patients with gastric cancer had high MET RNA and protein expression.25 Therefore, MET alterations indicate drug resistance and induce tumor relapse. Functional studies on colorectal cancer have shown that amplification of the MET receptor drives resistance to anti-EGFR (epidermal growth factor receptor) therapies.26 However, the dysregulated MET gene was present in the circulating tumor DNA before recurrence, indicating an innate resistance of these patients to EGFR inhibitors. In contrast, aberrant MET activation has emerged as a critical event for acquired resistance in EGFR-mutated lung adenocarcinomas27 and triple-negative breast cancers28 refractory to EGFR-tyrosine kinase inhibitors. Thus, the combination of MET and EGFR inhibitors implied potential clinical practice in patients with EGFR mutation and/or amplification.29 Further analysis delineated that MET activation causes resistance to gefitinib, which is an EGFR inhibitor, by driving ERBB3 (HER3)-dependent activation of the PI3K (Phosphoinositide 3-kinase)/AKT pathway,30 followed by overexpression and/or autocrine action of HGF.
PD1 is an immune checkpoint receptor that is overexpressed on activated T cells for the induction of immune evasion.31 Tumor cells frequently upregulate the ligand for PD1 and PD-L1, promoting their escape from the immune system.32 Fortunately, treatment with PD-L1 or PD1 antibodies that block the interaction between the ligand and the receptor has demonstrated notable clinical efficacy in patients with a variety of cancers, including colorectal cancer, melanoma, Hodgkin’s lymphoma, and non-small-cell lung cancer.33 Although it is well established that PD-L1 blockade activates T cells and TAMs, little is known about the role of this pathway in tumor entities. Menguy et al34 reported that PD-L1 and PD-L2 are differentially expressed by tumor cells or macrophages in primary cutaneous diffuse large B cell lymphoma. Intriguingly, PD-L1 expression in pleural effusion tumor cells was associated with PD-L1 overexpression in macrophages and immune cells. PD-L1 expression in immune cells was associated with patient prognosis,35 with one explanation being that PD-L1 induced by IFN-γ (Interferon-γ) from TAMs via the JAK (Janus kinase)/STAT3 and PI3K/AKT pathways might be facilitating lung cancer progression.19 Vidotto et al revealed upregulation of the IFN mediators STAT1 and/or STAT3 in tumors with DDR (DNA damage response and repair) mutations, such as those in ATM, ERCC1, RB1, BRCA2, POLE, and TP53, reflective of IFN pathway activation.36 MET signaling was shown to drive the migration of macrophages and inhibit intracranial autoimmunity.37 38 Nevertheless, few studies have focused on the association between MET and PD-L1 in gliomas. Our findings revealed the role of the MET-STAT4-PD-L1 axis in enforcing glioma immune evasion and tumor malignancy, indicating poor overall survival time of patients with glioma induced by suppression of the tumor microenvironment.
MET mutation and amplification have been identified as late genomic and/or transcriptomic events in gliomas and have not been focused on specifically in previous glioma research. A recurrent fusion rearrangement involving the PTPRZ1 and MET genes (ZM fusion) has been identified that occurs in 15% of sGBMs.39 Aberrant MET signaling, due to genomic abnormalities of MET, is also involved in many cancers, including glioma with ZM fusion.40 Hu and colleagues9 characterized METex14 expression with ZM fusion in 14% of patients with sGBM, resulting in hyperactivation of MET signaling and recruitment of TAMs promoting tumor malignancy, and was associated with poor patient survival. Furthermore, they described a MET-specific inhibitor, PLB-1001, against glioma cells harboring METex14 and PTPRZ1–MET in vitro and in vivo. In this study, we found that TAM recruitment is induced by MET dysregulation in a different mechanism in pGBM. It is likely that MET activates STAT4 phosphorylation followed by TAM recruitment in pGBM, whereas MET overexpression directly activates TAMs through STAT3 phosphorylation in sGBM.
The therapeutic strategy of MET and PD1/PD-L1 inhibitor combination has been recommended for MET-amplified gastric41 and liver tumors42 because MET inhibition revokes immunity of PD1/PD-L1 by activating the JAK/STAT pathway followed by interferon-γ receptor neutralization. However, few clinical trials of MET and PD-L1 combination therapy have been conducted in patients with glioma owing to inadequate bench evidence. We demonstrated MET overexpression followed by STAT4 activation subsequently induced upregulation of PD-L1, indicating an underlying treatment option using MET and PD-L1 combination inhibitors for patients with pGBM with MET overexpression. In addition to the expression of PD-L1, tumor-infiltrating T lymphocytes are also potential predictors of cancer immunotherapy response.43 However, CIBERSORTx results showed that there was no significant difference in T cells between the METhigh and METlow groups. Therefore, the regulation of MET in tumor-infiltrating T lymphocytes requires further study.
Macrophage polarization has become a key field in immunology and the study of disease pathogenesis.44 Over the past few years, there have been various definitions of macrophage polarization, and the use of inconsistent markers to describe macrophage polarization has impeded research.45 Murray et al46 suggested an approach using combinations of markers to determine the polarization status and origin of macrophages. In this study, we have roughly evaluated some M1-like polarization, M2-like polarization, blood derived-like, and resident-like markers in tissue microarray. In vitro culture of macrophages, a group of markers, was used to identify induced phenotypes (M1-like or M2-like). However, the method used in this study to distinguish the subtypes of macrophages was limited, and there is still significant scope to expand on marker assignment, such as transcription factors and cell surface markers.
Antibodies that block the interaction between PD-L1 and PD1 have demonstrated efficacy in many tumors,47 but are less effective in gliomas. Currently, phase III clinical trials of PD1/PD-L1 monoclonal antibody for GBM have failed, including recurrent GBM48 (nivolumab vs bevacizumab; CheckMate-143), newly diagnosed MGMT (O6-methylguanine-DNA methyltransferase)-unmethylated GBM49 (nivolumab+radiotherapy vs temozolomide+radiotherapy; CheckMate-498), and newly diagnosed MGMT-methylated GBM50 (nivolumab+temozolomide+radiotherapy vs temozolomide+radiotherapy; CheckMate-548). Our study showed that activation of the MET pathway induced upregulation of PD-L1, indicating a potential treatment option using a combination of MET and PD-L1 inhibitors. Our study provides new insights that might improve PD-L1 treatment response in gliomas by concurrently targeting the MET/STAT4 pathway. However, our study is preliminary and requires further verification, including animal models and clinical trials.
Conclusion
In summary, our study reveals that the MET-STAT4-PD-L1 axis and TAMs may enforce glioma immune evasion and are associated with poor prognosis in pGBM. Our findings suggest that the combination of targeted and immune treatment is a promising option for modulating tumor and immune cell responses in pGBM.
Data availability statement
Data are available in a public, open access repository. Data are available upon reasonable request.
Ethics statements
Patient consent for publication
Ethics approval
The study was approved by the Beijing Tiantan Hospital Capital Medical University Institutional Review Board (IRB KY2013-017-01).
Acknowledgments
We appreciate the generosity of the TCGA network for sharing the huge amount of data.
References
Supplementary materials
Supplementary Data
This web only file has been produced by the BMJ Publishing Group from an electronic file supplied by the author(s) and has not been edited for content.
Footnotes
Q-WW, L-HS, YZ and ZW contributed equally.
Contributors All authors contributed to writing the manuscript. Z-SB, Q-WW, and TJ directed and supervised the study. Q-WW, L-HS, YZ, and ZW performed most of the experiments. ZZ, Z-LW, K-YW, GL, and Y-JZ collected and aggregated the data. H-JW directed the ChIP-PCR assay and JB-X performed this assay. S-WL directed the construction of stably transfected cell lines and C-YR performed this experiment. W-PM stimulated and polarized human monocytic leukemia THP-1 cells.
Funding This study was funded by the Beijing Natural Science Foundation (JQ20030); National Natural Science Foundation of China (81972337, 81902528, 81903078, 82002647); the National Key Research and Development Plan (2019YFE0109400); Beijing Science and Technology Plan (Z141100000214009); Beijing Municipal Administration of Hospitals Clinical Medicine Development of Special Funding Support (ZYLX201708); Beijing Municipal Administration of Hospitals’ Mission Plan (SML20180501); Key Program of Administration of Traditional Chinese Medicine, Zhejiang Province (no. 2018ZZ015); and Provincial Key R&D Program, Science and Technology Department of Zhejiang Province (grant no. 2017C03018).
Competing interests None declared.
Provenance and peer review Not commissioned; externally peer reviewed.
Supplemental material This content has been supplied by the author(s). It has not been vetted by BMJ Publishing Group Limited (BMJ) and may not have been peer-reviewed. Any opinions or recommendations discussed are solely those of the author(s) and are not endorsed by BMJ. BMJ disclaims all liability and responsibility arising from any reliance placed on the content. Where the content includes any translated material, BMJ does not warrant the accuracy and reliability of the translations (including but not limited to local regulations, clinical guidelines, terminology, drug names and drug dosages), and is not responsible for any error and/or omissions arising from translation and adaptation or otherwise.