Article Text

Abstract
Background Immune checkpoint blockade (ICB) using anti-CTLA-4 and anti-PD-1/PD-L1 has revolutionized the treatment of advanced cancer. However, ICB is effective for only a small fraction of patients, and biomarkers such as expression of PD-L1 in tumor or serum levels of CXCL11 have suboptimal sensitivity and specificity. Exposure–response (E-R) relationships have been observed with other therapeutic monoclonal antibodies. There are many factors influencing E-R relationships, yet several studies have shown that trough levels of anti-PD-1/PD-L1 correlated with clinical outcomes. However, the potential utility of anti-CTLA-4 levels as a biomarker remains unknown.
Methods Serum was obtained at trough levels at weeks 7 and 12 (after doses 2 and 4) from patients with advanced melanoma who received ipilimumab alone (3 mg/kg every 3 weeks for four treatments) via an expanded access program (NCT00495066). We have successfully established a proteomics assay to measure the concentration of ipilimumab in serum using an liquid chromatography with tandem mass spectrometry-based nanosurface and molecular-orientation limited proteolysis (nSMOL) approach. Serum samples from 38 patients were assessed for trough levels of ipilimumab by the nSMOL assay.
Results We found that trough levels of ipilimumab were higher in patients who developed immune-related adverse events but did not differ based on the presence or absence of disease progression. We found that patients with higher trough levels of ipilimumab had better overall survival when grouped based on ipilimumab trough levels. Trough levels of ipilimumab were inversely associated with pretreatment serum levels of CXCL11, a predictive biomarker we previously identified, and soluble CD25 (sCD25), a prognostic biomarker for advanced melanoma, as well as C reactive protein (CRP) and interleukin (IL)-6 levels at week 7.
Conclusions Our results suggest that trough levels of ipilimumab may be a useful biomarker for the long-term survival of patients with advanced melanoma treated with ipilimumab. The association of ipilimumab trough levels with pretreatment serum levels of CXCL11 and sCD25 is suggestive of a baseline-driven E-R relationship, and the association of ipilimumab trough levels with on-treatment levels of CRP and IL-6 is suggestive of response-driven E-R relationship. Our findings highlight the potential utility of trough levels of ipilimumab as a biomarker.
Trial registration number NCT00495066.
- biomarkers
- tumor
- immunotherapy
- melanoma
- translational medical research
- CTLA-4 antigen
Data availability statement
Data are available upon reasonable request. All data relevant to the study are included in the article or uploaded as supplementary information.
This is an open access article distributed in accordance with the Creative Commons Attribution Non Commercial (CC BY-NC 4.0) license, which permits others to distribute, remix, adapt, build upon this work non-commercially, and license their derivative works on different terms, provided the original work is properly cited, appropriate credit is given, any changes made indicated, and the use is non-commercial. See http://creativecommons.org/licenses/by-nc/4.0/.
Statistics from Altmetric.com
Background
The success of immune checkpoint blockade (ICB), such as anti-CTLA-4 or anti-PD-1/PD-L1 monoclonal antibodies (mAbs), has transformed the treatment of advanced cancer. ICB can induce durable clinical responses lasting years.1 2 However, ICB benefits only a subset of patients and is associated with potentially severe immune-related adverse events (irAEs). Understanding resistance mechanisms to ICB may help improve treatment and identify biomarkers that will aid in the selection of patients most likely to benefit from ICB.
A great deal of effort has been dedicated to understanding the pharmacodynamics of ICB to elucidate the mechanisms of primary resistance.1 Such efforts highlighted the importance of factors including the tumor microenvironment (TME) and pre-existing immunity. For anti-CTLA-4, higher absolute lymphocyte counts in peripheral blood,3 increased Inducible T-cell costimulator (ICOS, CD278) expression in CD4 T cells on treatment,4 higher tumor mutational burden,5 and an increased post-treatment interferon gamma (IFN-γ) signature in tumor were associated with longer overall survival (OS).6 We also identified that pretreatment serum levels of CXCL11 and soluble MHC class I polypeptide–related chain A (sMICA) negatively correlated with worse outcomes in patients with advanced melanoma receiving ipilimumab.7 For anti-PD-1, higher intratumoral CD8 T-cell density,8 higher PD-L1 expression in the tumor,9 microsatellite instability high tumor,10 baseline IFN-γ-related gene signatures,11 and higher proliferation of peripheral CD8 T cells in conjunction with lower tumor burden correlated with longer OS.12 Together, these studies elucidated that ICB revitalized pre-existing immunity against cancer as a main mode of action.
In contrast, the pharmacokinetics (PK) of ICB are rarely assessed after regulatory approval even though proper distribution of ICB is likely a prerequisite to the effective action of these agents. PK studies are a main part of the early-phase clinical trials to ensure objective determination of the safe and effective dosing schedule. However, as safety is the highest priority in clinical development, the approved dosing may not be optimally effective. Moreover, early-phase clinical trials typically involve relatively small cohorts and may not fully capture PK variability across a diverse population. In fact, population PK studies leveraging data from multiple clinical trials often find dose-dependent efficacy, the exposure–response (E-R) relationship, for mAbs.13 The list of such drugs includes immuno-oncology targets such as mAbs against CD20, HER2, epidermal growth factor receptor (EGFR), and vascular endothelial growth factor (VEGF). Typically, patients with a higher degree of clearance and/or lower trough levels of therapeutic mAbs often experienced worse clinical response to the mAb. Currently, it is controversial whether dosing should be adjusted using therapeutic drug monitoring (TDM). It is important to consider the possibilities of baseline-driven E-R (eg, elevated serum protein catabolism due to cachexia) and response-driven E-R (eg, the time-varying clearance) in addition to exposure-driven E-R.13 Alternatively, one may use the E-R relationship as a biomarker as this relationship has been reported for ICB. For anti-PD-1/PD-L1, the presence of an E-R relationship has been documented for nivolumab,14–16 pembrolizumab,17 18 durvalumab,19 and avelumab,20 although some reports found only a minor degree of E-R relationship for nivolumab.21 22 The trough levels of nivolumab were associated with clinical responses and outcomes in another study.14 The E-R relationship was also reported for ipilimumab.23 However, the majority of PK data are from subjects receiving a dose of 10 mg/kg, although the approved dose for advanced disease is 3 mg/kg. Thus, it is not clear whether trough levels of ipilimumab can be used as a biomarker for clinical outcomes at the approved 3 mg/kg dose.
The use of ELISA for assessing PK is well established; however, its performance depends on the ability of antidrug antibody to capture therapeutic mAbs and often suffers from detection sensitivity at the lower range necessary for accurate assessment of trough antibody levels. ELISAs are also time-consuming and not cost-effective for conducting quality assurance/quality control (QA/QC) to monitor the performance of the assay. On the other hand, a liquid chromatography with tandem mass spectrometry-based nanosurface and molecular-orientation limited proteolysis (nSMOL) approach enabled direct measurement of therapeutic mAbs using the same assay format.24 In the nSMOL assay, IgGs are immobilized in resin pores (100 nm) via the fragment crystallizable (Fc) region. As a result, the antigen-binding fragment (Fab) is oriented to reaction solution. Proteolysis is performed using immobilized trypsin on the surface of ferrite glycidyl methacrylate (FG) nanoparticles (200 nm). The diameter difference enables limited proteolysis of the Fab region that contains the antibody specificity while minimizing the complexity of digested materials. The signature peptides of the mAb are quantified using triple quadrupole liquid chromatography with tandem mass spectrometry (LC-MS/MS) multiple reaction monitoring (MRM) analysis. We have shown the successful introduction of nSMOL assay for detection of a number of therapeutic mAbs.24–26 In the current study, we have optimized the nSMOL assay for detecting ipilimumab and have examined if trough levels of ipilimumab in serum can be a potential biomarker of clinical outcome for patients with advanced melanoma after treatment with ipilimumab.
Methods
Patients and clinical trial
Serum was obtained after doses 2 and 4 from patients with advanced melanoma who received ipilimumab alone (3 mg/kg every 3 weeks for four treatments) via an expanded access program. Demographic information is provided in online supplemental table S1. irAEs were evaluated using the Common Terminology Criteria for Adverse Events V.3.0.
Supplemental material
nSMOL and liquid chromatography-mass spectrometry (LC-MS)
For the identification of candidate signature peptides of ipilimumab, the tryptic peptides of ipilimumab were screened using a high-resolution quadrupole time-of-flight LC-MS/MS (LCMS-9030; Shimadzu, Japan)-based assay, and fragment ions were assigned using an in-house Mascot proteome server V.2.7.0).24
For detection of ipilimumab concentration in clinical samples, serum samples were pretreated with Fab-specific trypsin proteolysis using nSMOL antibody BA kit (Shimadzu online supplemental figure S1). Sample preparation was performed according to the manufacture’s protocol with a few modifications. A 5 µL aliquot of each serum was diluted 10-fold in phosphate buffered saline (PBS, pH 7.4) containing 0.1% octyl β-D-1-thioglucopyranoside (OTG) to avoid non-specific binding to the resin and plastic materials. The IgG fraction from the serum sample was collected by 12.5 µL of PBS-substituted AF-rProtein A resin (50% slurry) in 95 µL of PBS containing OTG with gentle vortexing at 25°C for 5 min. For acidified reduction acceleration nSMOL, the resin was treated with 75 µL of 250 mM tris(2-carboxyethyl)phosphine–HCl solution at room temperature for 30 min with gentle vortexing. Protein A resin was harvested onto an Ultrafree filter and first washed twice with 300 µL of PBS containing OTG to remove other serum proteins except for IgGs, and then with 300 µL of PBS to remove detergents. Each washing substitution was directly performed by centrifugation (10,000×g for 1 min) on Ultrafree filter devices. After these washing steps, rProtein A resin was substituted with 80 µL of the nSMOL reaction solution. nSMOL proteolysis was performed by adding of 5 µg trypsin-immobilized FG beads with gentle vortexing at 50°C for 5 hours in saturated vapor atmosphere for uniform contact between rProtein A resin and FG bead nanoparticles. After nSMOL proteolysis, the reaction was quenched by adding formic acid at a final concentration of 0.5%. The peptide solution was collected by centrifugation (10,000×g for 1 min) and magnetic separation to remove trypsin–FG beads. These analytes were transferred into low protein-binding polypropylene vials (TORAST-H Bio Vial, Shimadzu GLC) and then analyzed by LC-MS. The peptide quantitation was analyzed using an LC–electrospray ionization source triple quadrupole MS (Nexera X2 and LCMS-8060, Shimadzu). The LC-MS conditions were as follows: solvent A, 0.1% aqueous formic acid; solvent B, acetonitrile with 0.1% formic acid; column, Shim-pack GISS C18, 2.1×50 mm, 1.9 µm, 20 nm pore (Shimadzu); column temperature, 50°C; flow rate, 0.4 mL/min; gradient program, 0–2 min: %B=5, 2–8 min: %B=5–55 gradient, 8–10 min: %B=95 with flow rate 1.0 mL/min, 10–13 min: %B=5 with flow rate 0.4 mL/min. MS spectra were acquired by setting the interface temperature, desolvation line temperature, and heat block temperature to 300°C, 250°C, and 400°C, respectively. Nebulizer, heating, and drying gas flows were set to 3, 10, and 10 L/min, respectively. The dwell time was set to 10 ms for each transition. MRM monitor ions of peptide fragments were imported from the measured values of the structure-assigned fragments by high-resolution LC-MS analysis. Collision-induced dissociation Ar partial pressure in the Q2 cell was set to 270 kPa. Candidate MRM transition m/z was computationally set, and the electrode voltage of Q1 prebias, collision cell CE, and Q3 prebias, and the most abundant m/z of the parent and fragment ion were performed using the fully tryptic peptides of ipilimumab by the optimization support software (LabSolutions, Shimadzu).
Serum analysis
Pretreatment serum levels of CXCL11 and soluble CD25 (sCD25) were measured by multiplex bead array or ELISA, respectively. The results were previously reported elsewhere.7 Serum C reactive protein (CRP) and interleukin (IL)-6 levels at week 7 were measured by ELISA (RayBiotech and R&D Systems, respectively) according to the manufacturer’s instructions.
Statistical considerations
Patient characteristics were summarized by median for continuous variables and frequencies for categorical variables. Ipilimumab levels were compared using Welch’s t-test between independent groups, and Wilcoxon matched-pairs signed-rank test between paired samples. The relationship between the trough levels of ipilimumab at week 7 and pretreatment levels of CXCL11 or sCD25 was assessed descriptively with scatterplots and simple linear regression. The relationship between trough levels of ipilimumab at week 7 and levels of CRP or IL-6 at week 7 was assessed descriptively with scatterplots and simple linear regression. CXCL11 (pretreatment), CRP (week 7), and IL-6 (week 7) levels were log10 transformed as they showed a log-normal distribution. OS endpoint was the time of treatment to time of any cause of death or last follow-up. OS was compared using the Kaplan-Meier method with log-rank test, followed by multivariable Cox proportional hazards modeling to examine for independent prognostic factors, including age, gender, CXCL11 (pretreatment), Eastern Cooperative Oncology Group (ECOG) performance status, prior immunotherapy, and ipilimumab at weeks 7 and 12 associated with the OS. Both continuous ipilimumab levels and binary high versus low ipilimumab levels using median as a cut point were analyzed. Continuous measures were approximately log normal and analyzed as log10 transformed. All tests were two-sided and statistical significance was set at p<0.05.
Results
Establishment of the nSMOL assay for ipilimumab detection
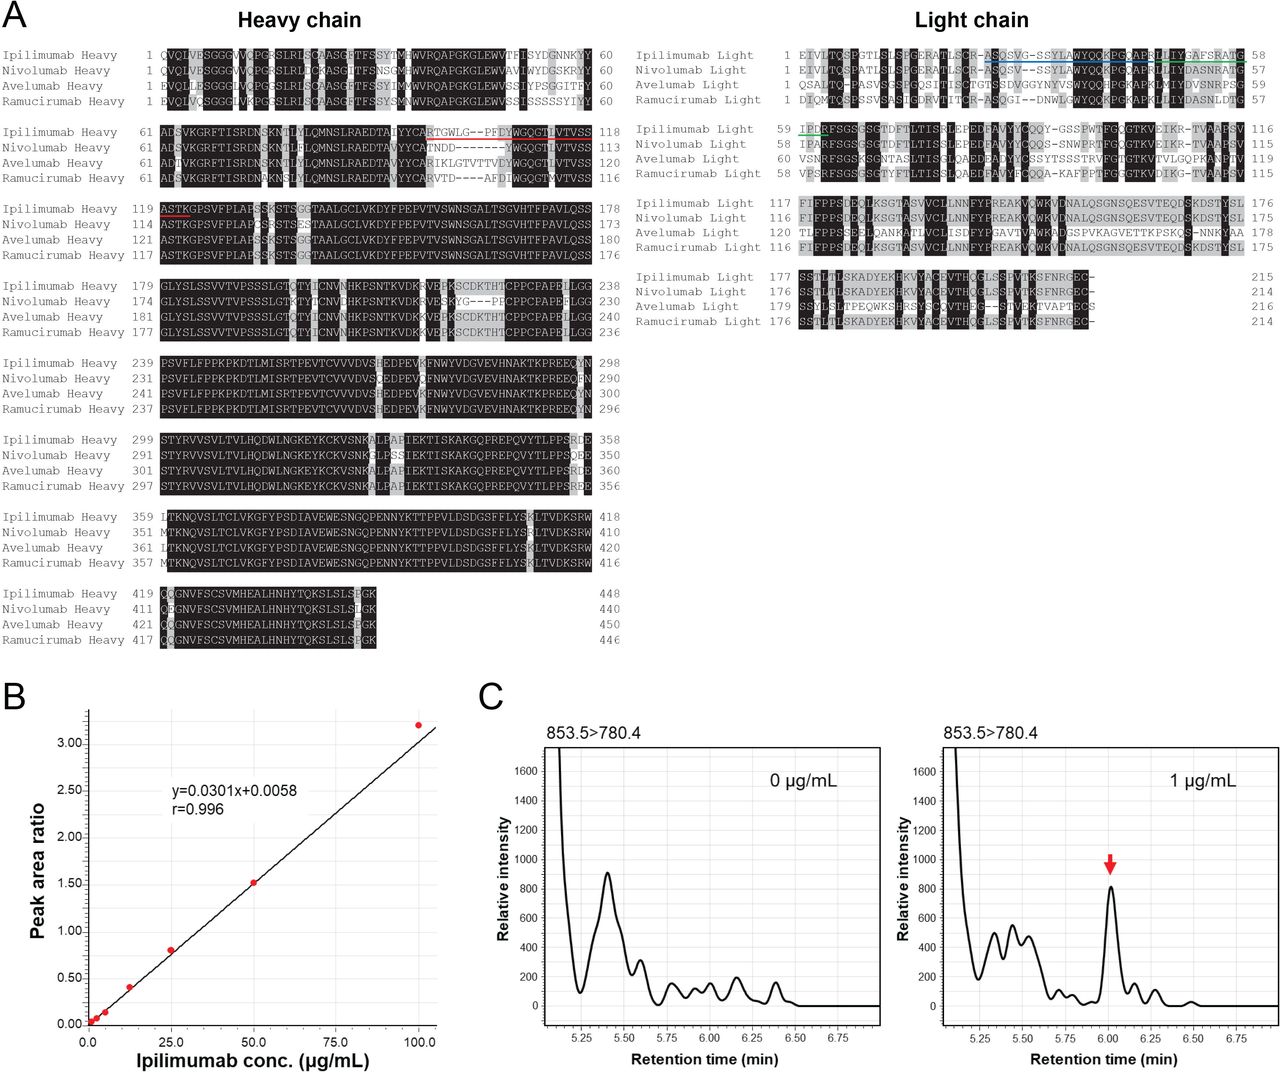
One peptide from the heavy chain and two from the light chain on fragment variable region were selected as suitable peptides based on the significant Mascot score and for nSMOL analysis conditions. Peptide regions were displayed as ClustalW alignment results of four fully human therapeutic antibodies to illustrate the regions for potential signature peptides (figure 1A).

Establishment of nSMOL assay for ipilimumab detection. (A) ClustalW sequence alignment of ipilimumab, nivolumab, avelumab, and ramucirumab. The black area indicates the common sequence for all antibodies. The red line describes the selected signature peptide for ipilimumab quantification. The peptides marked with blue and green lines did not meet the validation criteria. (B) Calibration curve of ipilimumab-spiked serum analyzed by nSMOL method. (C) MRM chromatograms of the signature ipilimumab peptide TGWLGPFDYWGQGTLVTVSSASTK. The peptide peak was observed at a retention time at 6.03 min (red arrow). Representative chromatograms of 853.5→780.4 transition from non-spiked (left) and ipilimumab-spiked (right) serum are shown. MRM, multiple reaction monitoring; nSMOL, nanosurface and molecular-orientation limited proteolysis.
To select the ipilimumab signature peptide, we determined interference of ipilimumab peptides from endogenous immunoglobulins. Each candidate peptide was assessed across a 1–100 µg/mL of concentration standard curve via spike-ins to plasma. The peptide TGWLGPFDYWGQGTLVTVSSASTK from the CDR3 region of the heavy chain was selected as the signature ipilimumab peptide since we observed no interference from human plasma as opposed to other candidate peptides, and it exhibited strong correlation with known spike-in ipilimumab concentrations (figure 1B). We also confirmed that the interference peak was under 20% of the lower limit of quantification (LLOQ) peak area in the MRM chromatograms for the TGWLGPFDYWGQGTLVTVSSASTK signature ipilimumab peptide (figure 1C). Optimized MRM transitions of the signature peptide are shown in online supplemental table S2, with one fragment for quantitation and an additional two fragments for structural confirmation.
To validate the use of the TGWLGPFDYWGQGTLVTVSSASTK signature peptide for ipilimumab detection, we evaluated the carryover and linearity of the spike-in control in plasma. The carryover test was performed by analyzing three replicates for the ipilimumab peptide and one run for the synthetic P14R immediately after the analysis of the ipilimumab peptide from the sample for the highest concentration (100 µg/mL). The carryover was calculated as percent response in the blank serum relative to the analyte response at the LLOQ (1 µg/mL). In nSMOL analysis, carryover was observed at 0%–8.1% for the ipilimumab peptide and no carryover was observed for P14R, confirming minimal levels of carryover influencing our analysis.
Finally, the linearity of nSMOL assay for ipilimumab detection was evaluated by analyzing calibration standards. The calibration plot of weighting was done using the 1/area2 method. The calibration fit formula was Y=0.0301X+0.0058 (r=0.996) (r: correlation coefficient) (figure 1B). The accuracy at LLOQ was 88.6%–115%, and at other concentrations were 87.2%–111% (online supplemental table S3).
Relationships between trough levels of ipilimumab and clinical response, irAEs, OS, predictive and prognostic biomarkers, or biomarkers of inflammation
On establishment of the ipilimumab detection nSMOL assay, we measured the trough levels of ipilimumab at weeks 7 and 12 from patients with advanced melanoma who received ipilimumab monotherapy (3 mg/kg every 3 weeks for four treatments, n=38). The ipilimumab concentrations at week 7 ranged between 4.44 and 33.63 µg/mL (median: 16.30, IQR: 11.41–20.87) and ipilimumab trough concentrations at week 12 ranged between 2.62 and 87.85 µg/mL (median: 24.17, IQR: 10.52–34.74) (figure 2A). As reported previously, trough levels of ipilimumab were higher in week 12 samples (Wilcoxon matched-pairs signed-rank test, p=0.0066).27 In contrast to the previous report, when we compared the trough ipilimumab levels at weeks 7 and 12 based on presence or absence of disease progression (PD vs stable disease (SD)/partial response (PR)/complete response (CR)), we did not observe statistical differences as shown in figure 2B,C (Welch’s t-test: p=0.1089 and p=0.3077, respectively).23 As some patients with PD developed a mixed response (mixed), we separately included them in the cohort of patients without PD and then compared with the remaining patients with PD. We found higher trough levels of ipilimumab at week 7 but not at week 12, in the group for mixed/SD/PR/CR (online supplemental figure S2A,B). We also noticed a significant overlap in the survival curve between patients with or without PD, suggesting a potential involvement of slower growing tumors and/or less disease affecting the clearance of ipilimumab, in part due to the presence of mixed responses (online supplemental figure S2C,D). In agreement with the previous work,23 when we compared the trough levels of ipilimumab at weeks 7 and 12 based on irAE status, we found significantly higher trough levels of ipilimumab in patients who experienced grade 1–4 irAEs on treatment as shown in figure 2D,E (Welch’s t-test: p=0.0116 and p=0.0397, respectively). Patients who developed irAEs also showed longer OS compared with those who did not (online supplemental figure S2E).

Trough levels of ipilimumab were associated with irAE status but not with clinical benefit. (A) The trough levels at weeks 7 and 12 of ipilimumab in individual patients were compared. (B) The trough levels of ipilimumab at week 7 were compared between patients with or without PD (n=27 and n=10, respectively). (C) The trough levels of ipilimumab at week 12 were compared between patients with or without PD (n=22 and n=10, respectively). (D) The trough levels of ipilimumab at week 7 were compared between patients who did not develop irAE (no irAE) and those who developed irAE G1–4 (n=10 and n=27, respectively). (E) The trough levels of ipilimumab at week 12 were compared between patients who did not develop irAE (no irAE) and those who developed irAE G1–4 (n=8 and n=24, respectively). CR, complete response; ipi, ipilimumab; irAE, immune-related adverse event; irAE G1–4, grades 1–4 irAE; PD, disease progression; PR, partial response; SD, stable disease.
Next, we asked whether the trough levels of ipilimumab were associated with OS. We found that patients with higher serum trough levels of ipilimumab showed better OS when patients were combined into two groups based on whether their ipilimumab level was above or below the median trough level (median survival: <median=185.0 days, >median=625.0 days; log-rank test: p=0.0019) (figure 3A). A similar result was observed for ipilimumab trough levels at week 12 (median survival: <median=248.5 days, >median=676.0 days; log-rank test: p=0.0156) (figure 3B).
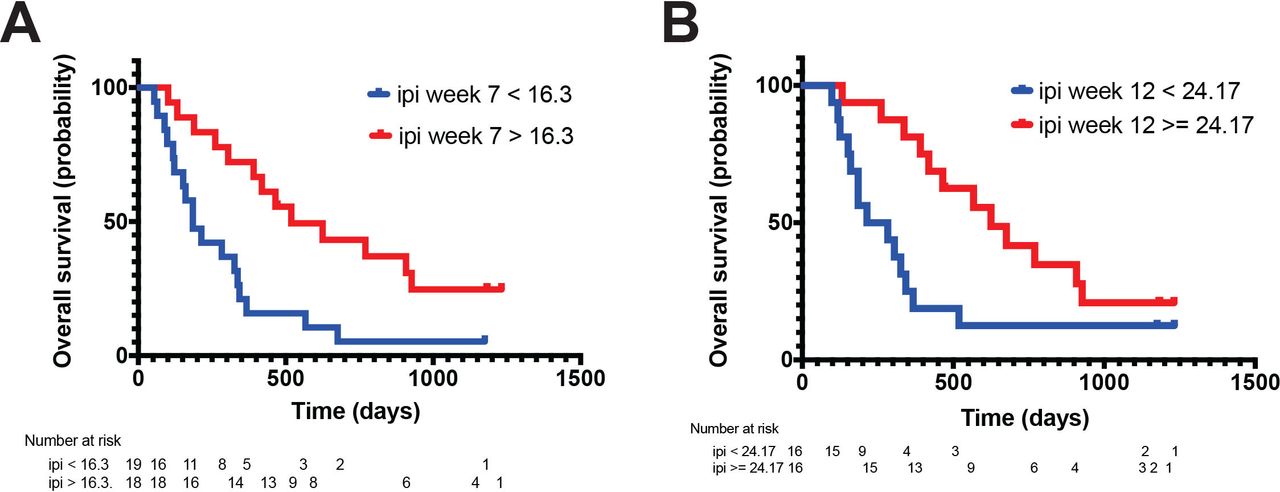
Patients with lower serum trough levels of ipilimumab had worse OS. Curves for OS obtained by applying a median value of ipilimumab trough levels as cut points for week 7 (A) and week 12 (B). The survival curves are significantly different by the log-rank test (A, p=0.0021; B, p=0.0177). ipi, ipilimumab; OS, overall survival.
In a previous study, we identified several pretreatment serum biomarkers for clinical outcome including CXCL11 and sCD25.7 High pretreatment CXCL11 levels were associated with poor OS in patients with metastatic melanoma treated with ipilimumab but not in patients treated with a ‘control’ gp100 vaccine, while high pretreatment sCD25 levels were associated with poor OS in ipilimumab-treated and gp100 vaccine-treated patients. Based on these findings, we concluded that the pretreatment serum level of CXCL11 is a predictive (disease-specific and treatment-specific) biomarker and the pretreatment serum level of sCD25 is a prognostic (disease-specific but not treatment-specific) biomarker.28 29 We confirmed that pretreatment serum levels of CXCL11 and sCD25 were significantly higher in patients with PD than those without, but they did not differ between patients who developed irAEs and those who did not (online supplemental figure S3). To understand potential host factors that could influence the trough levels of ipilimumab, we asked whether there was any association between the trough ipilimumab levels and various biomarkers. We found that trough levels of ipilimumab were inversely associated with pretreatment serum levels of CXCL11 (p=0.0009, R2=0.2891) (figure 4A) and pretreatment serum levels of sCD25 (p=0.0038, R2=0.2210) (figure 4B) but not with pretreatment serum levels of LDH (p=0.217, R2=0.0043) (figure 4C) and other previously described biomarkers such as absolute lymphocyte counts, VEGF, sMICA, and soluble MHC class I polypeptide–related chain B (sMICB) (data not shown). Our previous work with a preclinical model of transplantation demonstrated that inflammation caused rapid clearance of mAb.30 Thus, we examined a potential relationship between the degree of inflammation and trough levels of ipilimumab. We found that week 7 levels of CRP, but not IL-6, were higher in patients with PD (online supplemental figure S4A,B). The levels of CPR and IL-6 at week 7 were lower in patients who developed irAEs than those who did not (online supplemental figure S4C,D). In addition, we observed that patients with higher week 7 CRP or IL-6 levels had better OS (online supplemental figure S4E,F). Trough levels of ipilimumab at week 7 were also inversely associated with CRP (p<0.0001, R2=0.4098) (figure 4D) or IL-6 (p=0.0001, R2=0.3464) (figure 4E) levels at week 7, suggesting that inflammation may regulate the trough levels of ipilimumab. Pretreatment CXCL11 levels were only weakly associated with CRP or IL-6 levels at week 7, while CPR and IL-6 levels at week 7 were strongly associated (online supplemental figure S5). Together, trough levels of ipilimumab seemed to be regulated by multiple factors such as pre-existing baseline factors and on treatment response-driven factors.

Relationship between trough levels of ipilimumab and biomarkers of clinical outcomes and inflammation. The relationship between pre-treatment levels of CXCL11 (A), sCD25 (B), or LDH (C) and the trough levels of ipilimumab at week seven was shown. The relationship between levels of CRP (D) or IL-6 (E) at week seven and the trough levels of ipilimumab at week seven are shown. CRP, C reactive protein; ipi, ipilimumab; IL, interleukin; pre-tx, pre-treatment; sCD25, soluble CD25.
E-R relationship observed during ipilimumab treatment is likely baseline-driven rather than a cause of varying OS
The association of ipilimumab trough levels with biomarkers suggests that ipilimumab trough levels might be a novel biomarker for clinical outcome following ipilimumab treatment for patients with advanced melanoma. Thus, we asked whether the trough levels of ipilimumab as a categorical variable and/or continuous variable were associated with OS using univariate analysis. When the trough level of ipilimumab was treated as the categorical variable, univariate analysis revealed a significant association with OS at weeks 7 and 12 (ipi week 7: HR 0.33, 95% CI 0.16 to 0.68, p=0.003; ipi week 12: HR 0.40, 95% CI 0.19 to 0.88, p=0.023; table 1). However, when the trough level of ipilimumab was treated as a continuous variable, univariate analysis detected a significant association with the OS at week 7 but not at week 12 (log10 ipi week 7: HR 0.20, 95% CI 0.05 to 0.78, p=0.020; log10 ipi week 12: HR 0.56, 95% CI 0.20 to 1.55, p=0.264; table 1). Based on this finding, we analyzed whether the trough levels of ipilimumab at week 7 as a categorical variable and/or continuous variable showed an association with OS after controlling other demographic factors using multivariate analysis. We found a significant association for the trough levels of ipilimumab at week 7 as a categorical, but not continuous, variable with OS (ipi week 7: HR 0.31, 95% CI 0.11 to 0.84, p=0.022; log10 ipi week 7: HR 0.26, 95% CI 0.04 to 1.6, p=0.148; table 2). We did not find a statistically significant association with OS for the trough levels of ipilimumab at week 12 as a categorical or continuous variable (table 3). Together, these results suggested that although the serum trough level of ipilimumab is a useful biomarker of OS for patients with advanced melanoma, the E-R relationship is likely a secondary product of pretreatment conditions rather than a cause of varying OS among patients receiving ipilimumab treatment.
Univariate overall survival analysis for ipilimumab levels as a categorical or continuous variable
Multivariate overall survival analysis on subgroup patients with ipilimumab week 7
Multivariate overall survival analysis on subgroup patients with ipilimumab week 12
Discussion/conclusion
In this study, we established an assay to detect directly ipilimumab in serum using the mass spectrometry-based nSMOL approach and demonstrated the potential use of the trough levels of ipilimumab as a post-treatment biomarker for predicting the long-term outcome of patients with advanced melanoma. One of the limitations in this study is that we did not have a validation cohort. It was not feasible to collect additional samples as it is no longer common practice to treat patients with advanced melanoma with ipilimumab monotherapy. As many patients with advanced melanoma are currently treated with combination therapy of ipilimumab plus nivolumab, we are currently assessing the potential utility of ipilimumab and nivolumab drug monitoring as biomarkers for clinical outcome in that setting.
The E-R relationship has been reported for ICB and has been established for anti-PD-1.14–17 23 31 We have also observed the E-R relationship following pembrolizumab treatment for patients with melanoma.32 The presence of the E-R relationship seems to suggest that the adjustment of dosing may improve the therapeutic efficacy of ICB with the goal of increasing the trough level in some patients, although this has not been investigated. The E-R relationship for mAbs for inflammatory disease prompted the dose adjustment based on TDM, and TDM has been attempted to be incorporated into the clinical practice due to the successful dose adjustment despite practical challenges in its implementation.33 34 In contrast, Turner et al showed that the E-R relationship seen for pembrolizumab at the 2 mg/kg dose was also observed at 10 mg/kg dose in patients with melanoma and non-small-cell lung cancer even though patients treated with 10 mg/kg regimen achieved higher trough levels.17 A similar observation was made for nivolumab treatment.16 These results raised a question regarding the effectiveness of the dose adjustment approach to anti-PD-1 therapy. Closer examinations revealed that confounding factors such as baseline disease characteristics and PD can cause a spurious, rather than true, E-R relationship.13 35 In fact, cachexia was suspected as a baseline disease characteristic associated with the E-R relationship by increased catabolism of ICB,17 19 36 although we did not observe cachexia in our patient cohort according to body mass index (online supplemental table S1). Time-varying clearance, likely due to the change in tumor mass in response to therapy, was also reported to cause spurious E-R relationships for some types of ICB.18 20 31
Similar to anti-PD-1, ipilimumab was reported to have an E-R relationship likely due to baseline disease characteristics such as lactate dehydrogenase (LDH) levels and ECOG status.23 Indeed, while the trough level of ipilimumab was clearly associated with clinical response, patients treated with 10 mg/kg of ipilimumab showed only slightly better survival benefit than those treated with 0.3 mg/kg or 3 mg/kg of ipilimumab. The E-R analysis of ipilimumab was conducted by including all three dose levels and higher trough levels were predominantly from patients treated with 10 mg/kg of ipilimumab. Therefore, it was unclear whether the trough level of ipilimumab was associated with clinical outcome of patients treated with the approved dose of 3 mg/kg of ipilimumab. In this study, we showed that the E-R relationship exists for 3 mg/kg of ipilimumab treatment not with clinical response but with OS, which extends the previous findings. It was puzzling to observe the inconsistency in the relationship of trough levels of ipilimumab with two related clinical outcome measurements, namely, the presence or absence of PD (vs SD/PR/CR) and OS. The lack of statistical difference in trough levels of ipilimumab between patients who progressed and those who did not may be due to the unique challenges associated with the assessment of response to ipilimumab treatment, such as radiographical pseudo-progression and delayed response.37 In fact, several patients with PD had a mixed response in our cohort. When we regrouped the patient groups by including mixed responses (mixed), indicating that some lesions regressed while others grew and/or there were one or more new lesions, to the SD/PR/CR group and compared with the rest of the PD group, we found statistically higher levels of ipilimumab in the mixed/SD/PR/CR group. Therefore, we envision that slower growing tumors in progressors and/or lesser disease affecting clearance of ipilimumab in some of progressors likely contributed to the aforementioned discrepancy.
We also found higher trough levels of ipilimumab in patients who developed irAE, suggesting an exposure–irAE relationship even when treated at the Food and Drug Administration (FDA)-approved dose of 3 mg/kg of ipilimumab. This is compatible with findings by Feng et al,23 where they showed a clear exposure–irAE relationship in patients with advanced melanoma as patients treated with 10 mg/kg of ipilimumab had both higher exposure and higher irAE rates compared with lower doses. Although the relationship between clinical outcomes and an occurrence of irAEs is still controversial,38 we found that patients who developed irAEs had longer OS. Our results may suggest that lymphocytes in patients without irAE did not respond to ipilimumab at all due to the limited exposure to ipilimumab. However, it was shown that ipilimumab treatment elicited proliferation of CD4+ and CD8+ T cells almost unanimously regardless of irAE status.39 We have also confirmed that memory CD4+ T cells increased ICOS expression on ipilimumab treatment regardless of irAE status (Koguchi Y et al, 2014, unpublished observation). Instead, broadening of the T-cell Receptor (TCR) repertoire seemed responsible for the irAE.39 Since increasing ipilimumab dosing from 3 mg/kg to 10 mg/kg greatly increased the incidence of irAEs but slightly improved clinical outcome,23 we envision that lower exposure might result in CD4+ T-cell activation but fail to broaden the T-cell repertoire, and that exposure of ipilimumab above the threshold might induce T-cell repertoire broadening along with irAEs. We also hypothesize that the clinical response was associated with successful emergence and infiltration of tumor-reactive T cells into a less restrictive immune suppressive environment (eg, lower expression of other checkpoint molecules such as PD-1/PD-L1 and LAG-3/LAG-3 ligands) on ipilimumab monotherapy.
Although we and others have shown the potential use of trough levels of ICBs as biomarkers of clinical outcome,14 17 32 the mechanism that regulates clearance of ICBs remained to be elucidated. For this reason, we conducted univariate and multivariate analyses to assess how confounding factors influence association of trough levels of ipilimumab with clinical outcome. Our results from univariate analysis showed that week 7 samples had a better association with OS than those from week 12. This is likely due to the fact that a subset of patients died between weeks 7 and 12, which resulted in the loss of the statistical power to detect differences. Multivariate analyses showed that trough levels of ipilimumab and baseline CXCL11 levels are confounding each other, suggesting that a baseline disease characteristic related to CXCL11 secretion caused the E-R relationship. While we found an inverse association between pretreatment CXCL11 levels and the trough levels of ipilimumab at week 7, we also noticed that pretreatment levels of sCD25 were inversely associated with trough levels of ipilimumab at week 7. As sCD25 is a prognostic biomarker for advanced melanoma,7 our results further support the notion that the E-R relationship we observed might be, at least in part, driven by baseline characteristics of the tumor. We also discovered an inverse relationship between levels of inflammatory markers (CRP and IL-6) and trough levels of ipilimumab at week 7. Both pretreatment and on-treatment CRP and IL-6 were reported to be biomarkers for clinical outcome of ICB including ipilimumab treatment for patients with advanced melanoma.40 Therefore, our findings suggest that baseline-driven (CXCL11-rich TME) and response-driven (inflammatory TME) E-R relationship might play a role in determining trough levels of ipilimumab. We envision that a deeper characterization of the CXCL-rich and/or inflammatory TME will further inform the mechanism by which trough levels of ipilimumab are regulated.
Lower trough levels of ICB may reflect certain TME characteristics that coincide with enhanced clearance of antibodies and resistance to ICB. The clearance of IgG was increased in patients with chronic inflammatory conditions.41 Our earlier work showed that acute and systemic inflammation led to the accelerated clearance of antibody therapeutics.30 Fc receptors play a major role in the homeostasis of antibodies.42 The neonatal Fc-receptor promotes antibody recycling43 44 and is downregulated by IFN-γ.45 In contrast, Fc receptor gamma (FcγR) enhances clearance of antibodies46 47 and is upregulated by IFN-γ.48 These results suggest that inflammation can alter the rate of antibody clearance by changing Fc receptor expressions (and functions). The TME is often characterized with preferential enrichment of myeloid cells that express a high level of FcγR.49 Recent studies also demonstrated that FcγR engagement abrogated the effect of anti-PD-1 by reprogramming macrophages into the protumor phenotype or removal of anti-PD-1 from T cells by macrophages in the TME.50–52 The treatment effect of ipilimumab was reported to be Fc receptor dependent.53 These notions are compatible with our finding of an inverse relationship between inflammatory mediators (CRP and IL-6) and trough levels of ipilimumab as FcγR triggering by the immune complex is known to induce secretion of proinflammatory cytokines including IL-6.54 Together, we hypothesized that trough ICB levels reflect the nature of TME. In the case of anti-PD-1, it is worth investigating the relationship between tumor PD-L1 expression, tumor mutation burden, and the presence of myeloid cells with trough ICB levels to see if anti-PD-1 failure in the presence of high tumor PD-L1 expression and high mutation burden is accompanied with low trough ICB levels and a myeloid cell-rich TME. If this is the case, such patients may benefit from a combination therapy of anti-PD-1/PD-L1 plus myeloid cell-targeted therapy such as anti-CSF-1 receptor.55
Mass spectrometry-based direct quantification provides more accurate measurement of mAb therapeutics with a wider dynamic range than indirect methods, such as ELISA. Currently, there are several ICBs approved by the US FDA: anti-CTLA-4 (ipilimumab), anti-PD-1 (nivolumab, pembrolizumab, and cemiplimab), and anti-PD-L1 (avelumab, durvalumab, and atezolizumab), and this number will likely increase over the next several years. While ELISA is a simple assay, it requires a different capture antibody and extensive assay optimization for each mAb. The mass spectrometry-based assay, on the other hand, allows the use of the same reagents with straightforward determination of the LC/MS settings. Thus, the mass spectrometry-based PK assay provides a practical solution when implementing in a research or clinical laboratory for potential use of trough concentration of ICB as a biomarker. Although the process of antibody digestion by trypsin to obtain a signature peptide is firmly established, it requires protein denaturing, reduction, and alkylation followed by a solid-phase extraction, which is time-consuming and is a potential source of assay variability for quantification. Our nSMOL assay mitigated such cumbersome processes24 and thereby enabled reliable detection of ICB.25 Prospective study of nSMOL in conjunction with other markers of immune activity may allow us to predict antitumor response and potentially elucidate mechanism(s) of primary treatment resistance that hinder the efficacy of ICB.
Data availability statement
Data are available upon reasonable request. All data relevant to the study are included in the article or uploaded as supplementary information.
Ethics statements
Patient consent for publication
Ethics approval
All patients provided written informed consent and all studies were carried out in accordance with the Declaration of Helsinki under good clinical practice and institutional review board approval. Signed informed consent was obtained before enrollment. The study was approved by the Providence Health System Regional Institutional Review Board–Oregon (IRB #07-122) and listed on ClinicalTrials.gov (NCT00495066).
References
Supplementary materials
Supplementary Data
This web only file has been produced by the BMJ Publishing Group from an electronic file supplied by the author(s) and has not been edited for content.
Footnotes
Twitter @WalterUrba, @WWredmond4
Contributors YK and WLR designed the experiments. NI, JC, and TS performed the experiments. YK, BDP, and WLR interpreted the data. SCC performed the statistical analyses. BDC and WJU conducted the clinical trial. YK and WLR wrote the paper. All authors read and agreed on the final version of the submitted manuscript.
Funding Shimadzu Corporation and Providence Portland Medical Foundation.
Competing interests YK: research support from Bristol Myers Squibb (BMS), GlaxoSmithKline, and Shimadzu. NI and TS: employees of Shimadzu Scientific Instruments. BDC: research support from AstraZeneca, Clinigen, and Galectin Therapeutics; patents/royalties: none; advisory boards: Clinigen, Nektar, and Merck. WJU: research support from BMS; royalties: data safety monitoring board for AstraZeneca. BDP: research support from Heat Biologics and Shimadzu; advisory boards: Bayer and UnitedHealthcare. WLR: research support from Galectin Therapeutics, BMS, GlaxoSmithKline, MiNA Therapeutics, Inhibrx, Veana Therapeutics, Aeglea Biotherapeutics, Shimadzu, OncoSec, and Calibr; patents/licensing fees: Galectin Therapeutics; advisory boards: Nektar Therapeutics and Vesselon.
Provenance and peer review Not commissioned; externally peer reviewed.
Supplemental material This content has been supplied by the author(s). It has not been vetted by BMJ Publishing Group Limited (BMJ) and may not have been peer-reviewed. Any opinions or recommendations discussed are solely those of the author(s) and are not endorsed by BMJ. BMJ disclaims all liability and responsibility arising from any reliance placed on the content. Where the content includes any translated material, BMJ does not warrant the accuracy and reliability of the translations (including but not limited to local regulations, clinical guidelines, terminology, drug names and drug dosages), and is not responsible for any error and/or omissions arising from translation and adaptation or otherwise.