Article Text

Abstract
Despite unique genetic alterations within brain metastases (BrMs) and an immunologically distinct surrounding microenvironment, the composition and functional properties of tumor-infiltrating lymphocytes within BrM remain largely unexplored. In particular, the expression of coinhibitory receptors, such as programmed cell death 1 (PD-1), T cell immunoglobulin mucin receptor 3 (TIM-3), and lymphocyte activation gene 3 (LAG-3), within BrMs is unknown. Using multiplexed quantitative immunofluorescence (QIF), this study evaluates the localized expression of PD-L1, level and functional profile of major T cell subsets, and coinhibitory receptors within lung cancer-associated BrMs and primary lung tumors. Clinicopathologically annotated samples from 95 patients with lung cancer between 2002 and 2015 were represented in a tissue microarray format. Spatially resolved and multiplexed QIF was used to evaluate PD-L1 protein, phenotype markers for major T cell subsets (CD3, CD4, CD8, and FOXP3), cell-localized activation and proliferation markers (granzyme B and Ki67), and coinhibitory receptors (PD-1, LAG-3, and TIM-3). The signal for each marker was measured in marker-selected tissue compartments, and associations between marker levels, tumor location, and major clinicopathological variables were studied. In total, 41 primary lung tumors and 65 BrMs were analyzed, including paired samples from 11 patients. Levels of tumor PD-L1 expression were comparable between BrMs and primary lung tumors. BrMs had significantly lower levels of all T cell subsets relative to primary lung tumors, and T cells in BrMs displayed lower levels of granzyme B than primary lesions. PD-1, TIM-3, and LAG-3 levels in CD3+ T-cells were also significantly lower in BrMs. Marker expression in patients with paired samples from BrMs and primary lung tumors showed comparable results. High CD3+ T-cells, as well as high levels of TIM-3 and LAG-3 in CD3+ T-cells, were associated with longer overall survival in BrMs but not primary lung tumors. Lung cancer-associated BrMs display lower T cell infiltration, markers of cytolytic function, and immune regulatory signals than primary lung tumors. Despite these differences, high TIM-3 and high LAG-3 expressions in CD3+ T-cells were associated with longer survival. These features are accompanied by comparable levels of PD-L1 protein expression compared with primary lung tumors. These results highlight unique aspects of the tumor immune microenvironment within the brain and provide further support for intracranially focused therapies.
- biomarkers
- tumor
- brain neoplasms
- lung neoplasms
- lymphocytes
- tumor-infiltrating
- tumor microenvironment
Data availability statement
Data are available upon reasonable request.
This is an open access article distributed in accordance with the Creative Commons Attribution Non Commercial (CC BY-NC 4.0) license, which permits others to distribute, remix, adapt, build upon this work non-commercially, and license their derivative works on different terms, provided the original work is properly cited, appropriate credit is given, any changes made indicated, and the use is non-commercial. See http://creativecommons.org/licenses/by-nc/4.0/.
Statistics from Altmetric.com
Background
Lung cancer brain metastases (BrMs) are associated with significant morbidity and mortality. Traditional treatment paradigms focus on obtaining local control but have a limited survival benefit. Over the past decade, the immune system has emerged as a powerful prognostic and therapeutic target in cancer, leading to the development of immune checkpoint inhibitors. Agents targeting programmed cell death 1 (PD-1) and its binding partner, programmed death-ligand 1 (PD-L1), have shown activity across several cancer subtypes. The anti-PD-1 agent pembrolizumab has been effective in treating melanoma and non-small cell lung cancer (NSCLC)-associated BrM.1 Significant and, in some instances, durable responses to immunotherapy have changed the therapeutic paradigm for treating NSCLC.2 Despite these promising results, immunotherapies have shown efficacy in only a fraction of patients, underscoring the need to optimize predictors of response and identify new therapeutic targets.
Following the success of drugs targeting the PD-L1/PD-1 axis, there has been increased interest in alternative coinhibitory receptors as therapeutic targets, such as T cell immunoglobulin mucin receptor 3 (TIM-3) and lymphocyte activation gene 3 (LAG-3). Upregulation of these receptors was initially observed in chronic viral infection models and reflects T cell activation and functional dysregulation in the setting of continuous T cell stimulation.3 These ‘exhausted’ T-cells were observed to have a reduced capacity to perform cytotoxic effector functions, thereby resulting in a dysregulated immune response. In lung tumors, the coexpression of immune inhibitory receptors in tumor-infiltrating lymphocytes (TILs) can alternatively be interpreted as an indicator of sustained antitumor reactivity. Spatially resolved and single-cell analysis by our team has evidenced prominent expression of activation markers in TILs coexpressing PD-1, LAG-3, and TIM-3 in lung carcinomas, supporting that they may still exert antitumor functions.4 Restoring effector and memory states is therefore of great interest in augmenting antitumor immunity.
Phylogenetic genomic analyses show that BrMs can have distinct somatic genetic alterations relative to matched primary tumors, supporting biological differences in disease within the central nervous system (CNS) and opportunities for selective intracranially targeted therapies.5 6 Though immune checkpoint inhibitors have emerged as effective agents with activity in the CNS, fundamental elements of the tumor immune microenvironment, including the composition and functional characteristics of adaptive immune markers in BrM, remain largely unexplored. Herein, we use multiplexed, quantitative immunofluorescence (QIF) tissue analysis to evaluate the differential expression, functional profile, and clinical significance of major TIL subsets in lung cancer-associated BrMs and primary tumors.
Methods
Patient cohort
Tumor samples from patients with lung cancer treated at Yale Cancer Center between 2002 and 2015 were retrospectively collected to construct a tissue microarray (TMA)-based cohort, as detailed further. Clinicopathological information, including patient demographics, pathological subtype, molecular alterations, lung cancer treatment, and survival, was collected from the electronic medical record.
TMA construction
A TMA was constructed using methods as previously described.7 Briefly, paraffin-embedded, formalin-fixed tissue blocks were obtained from the Yale University Department of Pathology archives. Sections from each block were examined by a pathologist, and representative regions of invasive tumor were selected for inclusion. Cores with diameters of 0.6 mm were collected in triplicate and spaced 0.8 mm apart on slides using a Tissue Microarrayer (Beecher Instruments). Tissue sections of 5 µm were placed on glass slides using an adhesive tape-transfer system (Instrumedics) with UV cross-linking.
Immunohistochemistry (IHC) staining
Tumor and stromal/immune cell PD-L1 were determined using the 22C3 IHC pharmDx kit (Agilent). Values were expressed as percentage of tumor cells displaying predominant membrane signal. Histopathological analysis of TILs was performed on H&E-stained sections using a semiquantitative, pathologist-based four-tiered scoring system, as previously described.8 Briefly, a score of 0 indicated virtual absence; 1+ indicated low infiltration (<30%); 2+ indicated moderate infiltration (30%–60%); and 3+ indicated marked infiltration (>60%).
Multiplexed QIF
PD-L1 was assessed using a protocol involving the simultaneous detection of cytokeratin and 4′,6-diamidino-2-phenylindole (DAPI), as previously validated and described by our group.7 Briefly, TMA sections were first deparaffinized and subjected to antigen retrieval using citrate buffer pH 6.0 for 20 min at 97°C in a pressure-boiling container (PT Module, Lab Vision). Blocking was performed with 0.3% bovine serum albumin in 0.05% Tween solution. PD-L1 (clone E1L3N, Cell Signaling Technology) was incubated overnight. The secondary antibody for cytokeratin was pancytokeratin antibody (clone AE1/AE3, eBiosciences). Cyanine 5 (Cy5) directly conjugated to tyramide (FP1117; Perkin-Elmer) was used for target antibody detection. Slides were mounted using ProlongGold plus DAPI to highlight nuclei.
Multiplexed TIL staining protocols were performed using 5-color multiplex fluorescence. Panels previously validated and described by our group were used to stain consecutive TMA sections.4 9 10 As described, isotype specific antibodies and horseradish peroxidase blockade using benzoic hydrazide (0.136 mg) and hydrogen peroxide (50 µL) incubation steps were used to avoid cross reactivity between secondary antibodies or fluorophores. Panels of primary antibodies included CD4 (clone SP35, Spring Bioscience), CD8 (clone C8/144B, DAKO), and CD20 (clone L26, DAKO) for the TIL panel; CD4, CD8, and FOXP3 (clone D2W8E, Cell Signaling Technology) for the regulatory T cell panel; CD3 (polyclonal, DAKO; clone SP7, Novus), PD-1 (clone EH33, Cell Signaling Technology), TIM-3 (clone D5D5R, Cell Signaling Technology), and LAG-3 (clone 11E3, Abcam) for the co-inhibitory receptor panel; CD3, granzyme B (clone 4E6, Abcam), and Ki67 (clone MIB-1, DAKO) for the activation marker panel. Secondary antibodies and fluorescent reagents used were goat anti-rabbit Alexa546 (Invitrogen), anti-rabbit Envision (K4009, DAKO) with biotynilated tyramide/Streptavidine-Alexa750 conjugate (Perkin-Elmer); anti-mouse IgG1 antibody (eBioscience) with fluorescein-tyramide (Perkin-Elmer), anti-mouse IgG2a antibody (Abcam) with Cy5-tyramide (Perkin-Elmer).
Images were collected and analyzed according to the Automated Quantitative Analysis (AQUA®) method, as previously described.11 Briefly, the QIF score of each fluorescence channel was calculated by dividing the target marker pixel intensities by the area of the desired compartment. Scores were normalized to the exposure time and bit depth at which the images were captured, allowing scores collected at different exposure times to be comparable. Stained slides were visually examined by a pathologist (KAS), and defective samples or areas with staining artifact were reanalyzed or excluded.
Statistical analysis
Non-parametric Spearman correlation coefficients (r) were calculated between markers. Simple linear regression was used to determine associations between marker expression and the age of sample. QIF signal differences between groups were compared using Mann-Whitney or one-way analysis of variance testing. Differences between paired samples were determined using Wilcoxon matched-pairs signed-rank testing. Patient characteristics were compared using Student’s t-test for continuous samples and Fisher’s exact test or χ2 test for categorical variables. Kaplan-Meier analyses were performed to calculate associations between overall survival and high/low marker expression using a median cutpoint. Overall survival was calculated from the date of lung cancer diagnosis (for primary lung cancer samples) or the date of BrMs diagnosis (for BrMs samples) to the date of death. Data from the patients who did not have confirmed death dates were censored based on the last recorded visit date. All statistical significance was defined as p<0.05.
Results
Tissue characteristics
In total, 41 primary lung tumors and 65 BrMs from 95 patients were included for analysis, including paired primary lung and metastatic brain tumors from 11 patients (online supplemental tables 1 and 2). Histological subtypes included adenocarcinoma (63.2%), squamous cell carcinoma (11.6%), small cell (10.5%), and other non-small cell variants (14.7%) (online supplemental table 1). A subset of patients had prior therapy (n=29), including site-specific radiotherapy (18.9%), chemotherapy within 30 days of tissue sampling (16.0%), and prior immunotherapy (1.9%) (online supplemental table 2).
Supplemental material
PD-L1 expression in tumor
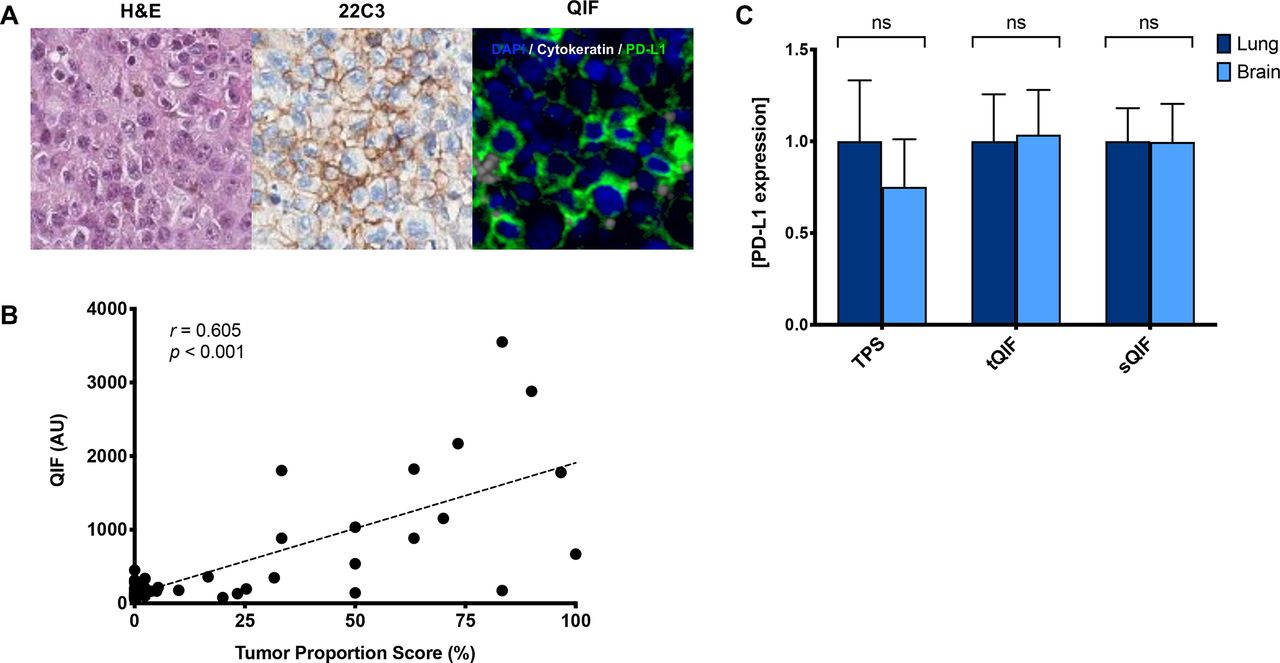
Immunohistochemical staining of PD-L1 was evaluated in all samples and interpreted by a pathologist using tumor proportion scoring (TPS), as used clinically (figure 1A). We also measured PD-L1 using QIF for localized measurements in both the tumor and stromal compartments. While PD-L1 expression was significantly lower in the stromal compartment compared with the tumor compartment (proportion score p=0.023, QIF p=0.018), there was a strong correlation between compartments (r=0.871, online supplemental figure 1). As expected, PD-L1 expression as measured by QIF was correlated with TPS (r=0.605, figure 1B). Comparable tumor PD-L1 expression was observed between primary lung tumors and BrMs as measured by TPS and QIF (figure 1C and online supplemental figures 2A and 3A). A similar trend was noted in the subset of paired samples (online supplemental figures 3B and 4). To assess whether the age of the sample may impact protein-level expression, we performed simple linear regression analysis (online supplemental figure 5). While a statistically significant association was observed between tumor PD-L1 and the age of the sample (p=0.037), the low coefficient of determination (R2=0.042) suggests a weak association.
Supplemental material

PD-L1 expression in primary lung tumors and BrMs. (A) Representative images of BrMs with H&E staining, PD-L1 by immunohistochemistry (22C3), and immunofluorescence (QIF). In the fluorescence image, simultaneous staining shows DAPI (blue), cytokeratin (gray), and PD-L1 (green). (B) Linear correlation coefficient between the PD-L1 expression as measured by TPS and QIF. Non-parametric, Spearman correlation (r) shows a significant moderate strength correlation (p<0.001). (C) PD-L1 expression in tumor and stroma as measured by visual assessment (TPS) or QIF in the tumor (tQIF) or QIF in the stroma (sQIF). No significant differences were found in PD-L1 tumor or stromal expression between primary lung tumors or brain tissues (p>0.05). Overall PD-L1 expression in the stroma was markedly lower than that in the tumor compartment as measured by either visual assessment (p=0.023) or QIF (p=0.018). Expression is displayed as ratios normalized to the average expression in the lung. AU, artificial units; BrM, brain metastasis; DAPI, diamidino-2-phenylindolens; ns, not significant; PD-L1, programmed death-ligand 1; QIF, quantitative immunofluorescence; sQIF, quantitative immunofluorescence in the stroma; tQIF, quantitative immunofluorescence in the tumor; TPS, tumor proportion scoring.
Immune markers and cytotoxic activity
Based on histological assessments using a semiquantitative, pathologist-based four-tiered scoring system, TIL density was significantly lower in BrMs compared with primary lung tumors (p<0.0001; figure 2A,B and online supplemental figures 2 and 3). To resolve the difference in TIL composition, we simultaneously analyzed multiple immune cell markers (figure 2A). All major TIL subset markers measured in the stromal compartment were significantly decreased within BrMs as compared with primary lung tumors (figure 2B), including CD3+ TILs (p<0.0001), CD4+ helper cells (p=0.0416), CD8+ effector cells (p=0.0003), and CD20+ B cells (p=0.0058). Notably, the presence of FOXP3+CD4+ regulatory T cells (p=0.0002) was also lower within BrMs. Selective measurement of granzyme B as a marker of T cell activation or Ki67 for cell proliferation in CD3+ T cells showed lower T cell GZB (p=0.019) and comparable Ki67 levels in BrMs (figure 2C). Similar trends were noted when looking specifically at the paired samples (online supplemental figures 3B and 4).

Immune cell density and activity within primary lung tumors and BrMs. (A) Representative images of primary lung tumors and BrMs. H&E images are provided for reference in addition to fluorescence panels showing immune cell subsets. (B) Immune cell infiltration was significantly lower in BrMs compared with primary lung tumors as measured by visual assessment (TIL) or QIF of CD3+ T cells (p<0.0001), CD4+ helper cells (p=0.0416), CD8+ effector cells (p=0.0003), CD20+ B cells (p=0.0058), and FOXP3+CD4+ regulatory T cells (p=0.0002). Expression is displayed as ratios normalized to the average expression in the lung. (C) GZB expression in CD3+ T cells was also significantly lower in BrMs compared with primary lung (p=0.019), as measured by QIF. Ki67 expression, a measure of proliferation, was not significantly different between primary lung tumors or BrMs (p=0.944). (D) High CD3+ T cells in BrMs were associated with longer survival (p<0.0001). The median cutpoint was used to define high/low expression. *p<0.05. BrM, brain metastasis; GZB, granzyme B; QIF, quantitative immunofluorescence; TIL, tumor-infiltrating lymphocyte.
In primary lung tumors, CD4+ expression (r=0.432) and CD8+ expression (r=0.418) were positively correlated with PD-L1 (online supplemental figure 1B). These correlations were not observed in BrMs (online supplemental figure 1C). Similar correlations were observed with FOXP3 relative to PD-L1 in both primary lung tumors and BrMs (FOXP3: r=0.395 in lung, r=0.256 in BrM).
Coinhibitory receptor expression
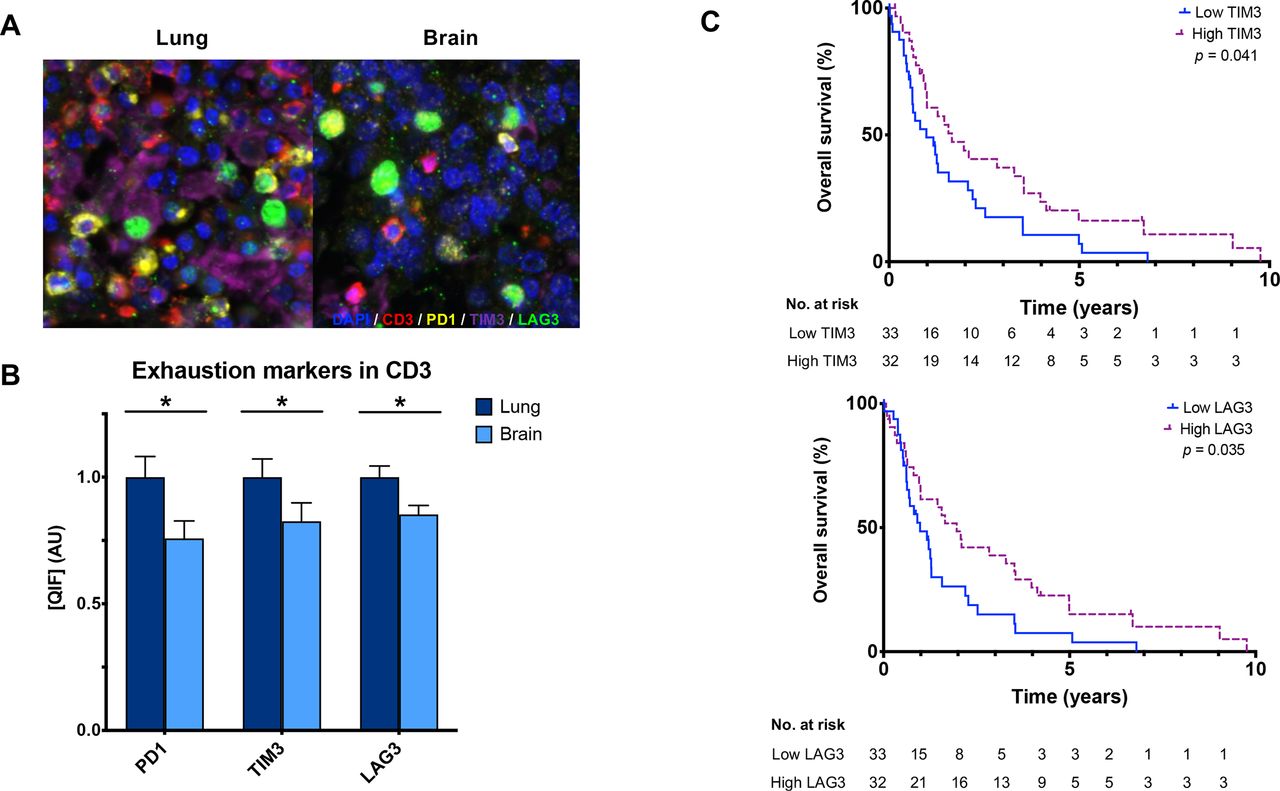
Using a QIF panel simultaneously measuring immune inhibitory receptors on CD3+ T cells (figure 3A), we observed lower PD-1+ (p=0.013), TIM-3+ (p=0.021), and LAG-3+ (p=0.008) in BrMs compared with primary lung tumors (figure 3B and online supplemental figures 2,3). Comparably high correlations were observed between PD-1, TIM-3, and LAG-3 expression in CD3+ T cells in both primary lung (r=0.62–0.79) and BrMs (r=0.64–0.80) (online supplemental figure 1). TIM-3+ (lung r=0.568, brain r=0.433) and LAG-3+ (lung r=0.549, brain r=0.393) expressions in CD3+ T cells were correlated with PD-L1 in both tissues, though the strength of correlation was lower in BrMs. PD-L1 and PD-1 were correlated in lung tumors (r=0.405, p=0.009) but not in BrMs.

CD3+ T cell expression of the coinhibitory receptors in primary lung tumors and BrMs. (A) Representative fluorescence images showing the simultaneous staining of DAPI (blue), CD3 (red), PD-1 (yellow), TIM-3 (purple), and LAG-3 (green) in primary lung tumors and BrMs. (B) CD3+ T cells within BrMs have lower expression of PD-1 (p=0.013), Tim-3 (p=0.021), and LAG-3 (p=0.008) compared with primary lung tumors, as measured by QIF. Expression is displayed as ratios normalized to the average expression in the lung. (C) High TIM-3 (p=0.041) and LAG-3 (p=0.035) expression in CD3+ T cells in BrMs were associated with longer survival. The median cutpoint was used to define high/low expression. BrM, brain metastasis; LAG-3, lymphocyte activation gene 3; PD-1, programmed cell death 1; QIF, quantitative immunofluorescence; TIM-3, T cell immunoglobulin mucin receptor 3. Asterix (*) indicates p<0.05.
Clinical significance of the BrM immune microenvironment
Patients with high CD3+ in BrMs had longer OS compared with those with low CD3+ (p<0.0001); interestingly, this was not observed in primary lung tumors (figure 2D and online supplemental figure 6A). High T cell TIM-3+ (log-rank test, p=0.041) and LAG-3+ (log-rank test, p=0.035) but not PD1+ in BrMs were also associated with longer survival (figure 3C). No differences in overall survival were found based on individual immune marker expression when measured in primary lung tumors (online supplemental figure 6). In BrMs, tumors with neuroendocrine features had significantly higher tumor cell Ki67 and lower TIM-3 compared with other histologies (online supplemental table 3). TIM-3 was also significantly higher in primary lung tumors from patients with stage IV disease at the time of diagnosis than in cases with earlier stages. BrM tissues that had received any previous treatments prior to tissue sampling also had significantly lower CD3 (p=0.022), TIM-3 (p=0.003) and LAG-3 (p=0.031). PD-1 was numerically higher in previously treated BrMs but did not meet statistical significance (p=0.051). BrMs with prior radiation therapy had significantly higher PD-L1 (p=0.023) and lower TIM-3 (p=0.044) compared with radiation-naïve BrMs.
Discussion
Using multiplexed QIF for direct and spatially resolved measurement of protein markers, this study objectively characterizes the differential expression of PD-L1, major TIL subsets, T cell activity, and markers of the coinhibitory receptors PD-1, TIM-3, and LAG-3 within intact lung cancer-associated BrMs and primary tumor samples. We found that immune infiltration and T cell activation were significantly lower in BrMs compared with primary lung tumors. These findings highlight both the exclusionary nature of the blood–brain barrier, which is known to restrict peripheral effector immune cell trafficking via the glia limitans, and the immunosuppressive effects imposed by the distinct cellular and metabolic components of the CNS.12 Interestingly, we did not find a significant difference in PD-L1 expression between tumors in the brain and lung. We observed significantly lower levels of all T cell subsets including regulatory T cells within BrMs, as well as lower levels of T cell PD-1, TIM-3, and LAG-3. However, high levels of CD3+ TILs in BrMs were associated with longer overall survival. Furthermore, high T cell TIM-3 and LAG-3 expression in BrMs was associated with prolonged survival. To our knowledge, this is the first study to report the quantitative protein-level expression, functional properties, and clinical significance of TILs in BrMs relative to primary lung tumors.
Multiple studies have shown that PD-L1 expression on tumor cells is most commonly a consequence of adaptive immune evasion in response to interferon-γ release by TILs. Consistent with previous studies, our finding shows similar tumor cell PD-L1 expression within lung cancer primary tumors and BrMs despite lower TIL infiltration in the brain.4 13–17 While PD-L1 expression was correlated with TIL density in primary lung tumors, no correlation was observed in BrMs. Positive correlations between PD-L1 and FOXP3+ Tregs were observed in both primary lung tumors and BrMs.18 19 This raises the possibility that the regulation of PD-L1 expression in the CNS is less dependent on local cytotoxic T cell infiltration relative to extracranial sites and may instead support the presence of constitutive oncogenic PD-L1 expression,20 21 or other regulatory pathways, which may have clinical implications. The role of reactive astrocytes presents an intriguing, alternative mediator for PD-L1 expression through activation of the MAPK/STAT3 pathway. Colocalization of reactive astrocytes and PD-L1 in a STAT3-dependent manner within NSCLC BrMs has recently been described.22 Whether the observed therapeutic efficacy of STAT3 inhibition in BrMs involves modulating adaptive immunity remains to be elucidated.
High immune infiltration, as measured by CD3 expression, was associated with longer overall survival in lung cancer BrMs, suggesting the relevance of antitumor immunity when effector immune responses can overcome the blood–brain barrier and penetrate the tumor. While some studies have reported a positive association with specific TIL subsets and overall survival in patients with BrMs,14 19 these findings have not been consistently reported in lung cancer, possibly related to the heterogeneous and small patient cohorts in addition to methodological differences in measuring immune infiltration.13 16 18 23
Strikingly, while we observed lower expression of coinhibitory markers in BrMs relative to primary lung tumors implying lower levels of activation and exhaustion, high T cell TIM-3 and LAG-3 expression in BrMs was associated with longer survival. One possible biological explanation for this association may be that BrM TILs reflect tumor-reactive TILs with exhausted phenotype that are able to retain prominent effector function. This would support a model in which coinhibitory receptors are upregulated in clonally expanded, tumor-reactive T cells and are able to exert an antitumor effect.24 This may also account for previous reports of clonal T cell contraction within lung adenocarcinoma-associated BrM.25 Collectively, our findings suggest differences in the antitumor capacity of immune cells within the brain and support the increased role of T cell TIM-3 and LAG-3 as markers of the intracranial antitumor response. Importantly, this might provide avenues for pharmacological targeting in patients with BrMs who have not responded to anti-PD-1 therapy.
Prior work using bulk gene expression profiling from ground/disaggregated tumor samples demonstrated elevated expression of genes associated with T cell exhaustion (EOMES and LAG3) in the brain.26 However, these studies did not conduct direct measurements on marker-selected T-cells of intact tumor slides. Our study further expands on this by simultaneously evaluating multiple exhaustion markers at the protein level and evaluating their clinical significance.
The retrospective nature of this study and the small sample size of the cohort limit the scope of our results. Due to the relative scarcity of tissue sampling lung cancer BrM, we included several lung cancer histologies including small cell lung cancer. Most of the primary lung cancer tissue samples were from patients with early-stage disease and may in part have contributed to differences noted between primary lung tumors and BrMs. However, results from our cohort of patients with matched primary lung tumors and BrMs supported the overall findings in this study. Additionally, the treatment characteristics varied in our patient cohort. Most patients in this historical cohort did not receive immune checkpoint blockade, limiting our ability to assess the predictive value of immune markers for response to immunotherapy. Our study also relies on TMAs that analyze small fragments of tumors. We have incorporated at least two to three samples from each specimen, though this still may fail to capture the overall spatial complexity of each tumor. However, our group has published broadly using TMAs and has shown consistent and significant associations with clinicopathological variables and patient outcomes.4 7 9 10 Findings from this single-institution cohort are exploratory in nature and require validation in larger, independent cohorts.
Together, our findings demonstrate prominent differences in the T cell immune contexture between primary lung tumors and BrMs. These differences could explain clinical differences and open avenues to design optimal biomarker and treatment strategies for this patient population.
Data availability statement
Data are available upon reasonable request.
Ethics statements
Patient consent for publication
Ethics approval
All tissues were collected with the approval of the Yale University Institutional Review Board (HIC# 1310012801).
Acknowledgments
We thank Lori Charette and Sudha Kumar for their technical assistance in constructing the tissue microarray and database.
References
Supplementary materials
Supplementary Data
This web only file has been produced by the BMJ Publishing Group from an electronic file supplied by the author(s) and has not been edited for content.
Footnotes
Twitter @Benjamin_Y_Lu
KAS and SBG contributed equally.
Contributors Study conception and design: BYL, LBJ, HMK, SBG, and KAS. Sample acquisition: VLC, JNC, and SBG. Microarray construction: MR, AJA, KAS, and SBG. Staining and image analysis: MR, RG, AA, NG, and HW. Statistical analyses: BYL and KAS. Drafting of the manuscript: BYL, SBG, and KAS. All authors read and approved the final manuscript.
Funding Research reported in this publication was supported by the National Cancer Institute of the National Institutes of Health under Award Number T32CA233414. The content is solely the responsibility of the authors and does not necessarily represent the official views of the National Institutes of Health. Research was also supported by the Department of Defense through the Lung Cancer Research Program X81XWH-15-1-0203 (SBG, principal investigator (PI)), NIH grants Yale SPORE in Lung Cancer P50CA196530 (R. Herbst, PI), R01 CA227472 (PIs HMK and K. Herold), R01 CA216846 (HMK and GV Desir, PIs), Yale SPORE in Skin Cancer P50 CA121974 (HMK and M. Bosenberg, PIs), grant from the Lung Cancer Research Foundation-LUNGevity and Melanoma Research Alliance, Award#308721 (LJ, PI), the J. Aron Charitable Foundation (SBG), NIH grants R03CA219603 (KAS), R37CA245154 (KAS), Stand Up To Cancer–American Cancer Society Lung Cancer Dream Team Translational Research Grants SU2C-AACR-DT1715 and SU2C-AACR-DT22-17 (KAS). Opinions, interpretations, conclusions, and recommendations are those of the authors and are not necessarily endorsed by the Department of Defense.
Competing interests BYL, RG, AA, HW, MR, VLC, JNC, AJA, and LBJ have nothing to disclose. HMK reports grants and personal fees from Merck and Bristol-Myers Squibb, grants from Apexigen, personal fees from Iovance, Immunocore, Celldex, Array BioPharma, Elevate Bio, Instil Bio, Clinigen, Shionogi, and Chemocentryx, outside the submitted work. KAS reports research funding from Navigate Biopharma, Tesaro/GlaxoSmithKline, Moderna Inc, Takeda, Surface Oncology, Pierre-Fabre Research Institute, Merck-Sharp & Dohme, Bristol-Myers Squibb, AstraZeneca, Ribon Therapeutics, and Eli Lilly. He has received honoraria for consultant/advisory roles from Moderna Therapeutics, Shattuck Labs, Pierre-Fabre, AstraZeneca, EMD Serono, Ono Pharmaceuticals, Clinica Alemana de Santiago, Dynamo Therapeutics, PeerView, Abbvie, Fluidigm, Takeda/Millenium Pharmaceuticals, Merck-Sharp & Dohme, Bristol Myers-Squibb, Agenus and Torque Therapeutics. SBG reports grants and personal fees from AstraZeneca and Boehringer Ingelheim, and personal fees from Bristol-Myers Squibb, Amgen, Spectrum, Blueprint Medicine, Sanofi Genzyme, Daiichi-Sankyo, Regeneron, Janssen, and Takeda.
Provenance and peer review Not commissioned; externally peer reviewed.
Supplemental material This content has been supplied by the author(s). It has not been vetted by BMJ Publishing Group Limited (BMJ) and may not have been peer-reviewed. Any opinions or recommendations discussed are solely those of the author(s) and are not endorsed by BMJ. BMJ disclaims all liability and responsibility arising from any reliance placed on the content. Where the content includes any translated material, BMJ does not warrant the accuracy and reliability of the translations (including but not limited to local regulations, clinical guidelines, terminology, drug names and drug dosages), and is not responsible for any error and/or omissions arising from translation and adaptation or otherwise.