Article Text

Abstract
Background Aging has long been thought to be a major risk factor for various types of cancers. However, accumulating evidence indicates increased resistance of old animals to tumor growth. An in-depth understanding of how old individuals defend against tumor invasion requires further investigations.
Methods We revealed age-associated alterations in tumor-infiltrating immune cells between young and old mice using single-cell RNA and coupled T cell receptor (TCR) sequencing analysis. Multiple bioinformatics methods were adopted to analyze the characteristics of the transcriptome between two groups. To explore the impacts of young and old CD8+ T cells on tumor growth, mice were treated with anti-CD8 antibody every 3 days starting 7 days after tumor inoculation. Flow cytometry was used to validate the differences indicated by sequencing analysis between young and old mice.
Results We found a higher proportion of cytotoxic CD8+ T cells, naturally occurring Tregs, conventional dendritic cell (DC), and M1-like macrophages in tumors of old mice compared with a higher percentage of exhausted CD8+ T cells, induced Tregs, plasmacytoid DC, and M2-like macrophages in young mice. Importantly, TCR diversity analysis showed that top 10 TCR clones consisted primarily of exhausted CD8+ T cells in young mice whereas top clones were predominantly cytotoxic CD8+ T cells in old mice. Old mice had more CD8+ T cells with a ‘progenitor’ and less ‘terminally’ exhausted phenotypes than young mice. Consistently, trajectory inference demonstrated that CD8+ T cells preferentially differentiated into cytotoxic cells in old mice in contrast to exhausted cells in young mice. Importantly, elimination of CD8+ T cells in old mice during tumor growth significantly accelerated tumor development. Moreover, senescent features were demonstrated in exhausted but not cytotoxic CD8+ T cells regardless of young and old mice.
Conclusions Our data revealed that a significantly higher proportion of effector immune cells in old mice defends against tumor progression, providing insights into understanding the altered kinetics of cancer development and the differential response to immunotherapeutic modulation in elderly patients.
- tumor microenvironment
- CD8-positive T-lymphocytes
- lymphocytes
- tumor-infiltrating
- immunity
- cellular
- immunotherapy
Data availability statement
The raw data will be made available by the authors, without undue reservation, to any qualified researcher. The data has been uploaded to scRNA database with the repository name of SCP1261. The persistent URL is https://singlecell.broadinstitute.org/single_cell/study/SCP1261. The data will be allowed for resue purpose without a need of licence.
This is an open access article distributed in accordance with the Creative Commons Attribution Non Commercial (CC BY-NC 4.0) license, which permits others to distribute, remix, adapt, build upon this work non-commercially, and license their derivative works on different terms, provided the original work is properly cited, appropriate credit is given, any changes made indicated, and the use is non-commercial. See http://creativecommons.org/licenses/by-nc/4.0/.
Statistics from Altmetric.com
- tumor microenvironment
- CD8-positive T-lymphocytes
- lymphocytes
- tumor-infiltrating
- immunity
- cellular
- immunotherapy
Introduction
Aging leads to the inevitable time-dependent decline in organ function and is a major risk factor for cancer. Relevant mechanisms of higher cancer incidence in aging individuals include genomic instability, epigenetic changes, loss of proteostasis, and declining immune surveillance.1 Individuals with an aging immune system are more susceptible to infection, and experience reduced vaccine effectiveness, higher incidence of cancer and autoimmune diseases.2 3 More than 50% of cancers and approximately 70% of cancer-related deaths occur in patients older than 65.4 In line with this hypothesis, Ladomersky et al, showed an increased tumor progression and immunosuppression in old animals bearing glioblastoma regardless of treatment with immune checkpoint blockade.5 In addition, Sekido et al, and Ishikawa et al, showed that carcinoma grows faster in old mice than in young mice.6 7 Interestingly, many clinical and preclinical studies indicated that tumors in young patients or animals grow more aggressively than older subjects.8–10 Furthermore, adoptive transfer of bone marrow or spleen cells from old mice has been shown to reduce the aggressiveness of tumor growth in young mice, which is paradoxical to the concept that cancer is defined as a disease of aging.8
Over the past decade, immunotherapies that modulate the immune microenvironment have greatly changed the treatment approaches of cancer.11 The most common treatments that have proven clinical efficacy across a broad range of cancers are immune checkpoint inhibitors against programmed cell death 1 (PD-1), programmed cell death ligand 1, and cytotoxic T lymphocyte-associated antigen 4 (CTLA4), which target T cells to restore their antitumor capacity. Immune checkpoint inhibitors significantly improve overall survival in both young and elder patients, but the magnitude of benefit is age variable.1 Several clinical studies showed that elderly patients could benefit more from immunotherapies than young patients,12 13 while a similar phenomenon is observed in mouse melanoma model.14 15 Therefore, it is of great significance to characterize the immune system of elderly cancer patients and to further explore the possible strategies that improve immunotherapy for the elderly.
The immune system plays a vital role in recognizing tumor cells and inhibiting the growth of malignant tissues.16 Several studies attempted to reveal the mechanisms of delayed tumor progression in the elderly from the perspective of antitumor immunity. It has been shown that an accumulation of 4-1BBL+ B cells in the elderly generated granzymeB+ CD8+ T cells to control tumor growth.17 Furthermore, old CD8+ T cells demonstrate increased adhesion and thus infiltrated more easily into tumors through high expression of integrin α 4.15 However, tumor-infiltrating immune cells form a complex three-dimensional contexure and the cross-talk of different types of immune cells plays a critical role in tumor immune surveillance.18 19 It remains challenging to comprehensively characterize the immune profiles to fully understand the mechanisms of delayed tumor development and the beneficial outcomes of certain immunotherapies in the elderly. As a revolutionary technology, single-cell RNA sequencing (scRNA-seq) analysis allows us to characterize cell types at the single-cell level and accurately define their functional states in the complex tumor microenvironment (TME).20 Accumulating studies using scRNA-seq to explore tumor-infiltrating immune cells have been continuously reported.21–25 Besides, simultaneous analysis of T cell receptor (TCR) sequences with scRNA-seq provides a powerful tool to define the clonotypic T cell signatures and dominant clones recognizing tumor antigens.26
In this study, we used scRNA-seq to decipher the transcriptomic landscape of immune cells in B16 melanoma between young and old mice, and uncovered the key differences in the immune cell composition and their functional features. We showed that intratumoral immune cells consisted of more effector subsets including cytotoxic CD8+ T cells, conventional dendritic cell (cDC), and M1-like macrophages in old mice, while immunosuppressive/dysfunctional subsets including exhausted CD8+ T cells, induced Tregs (iTregs), plasmacytoid DC (pDC), and M2-like macrophages are predominantly found in young mice. Importantly, TCR diversity analysis demonstrated that a significant proportion of cytotoxic CD8+ T cells might be directly differentiated from effector memory like CD8+ T cells (CD8+ EM_like T) in the TME of old mice. Of note, our data showed that tumor-infiltrating effector T cells in old mice did not exhibit the senescent phenotype as previously reported. Altogether, our observations provide important insights into understanding the altered kinetics of cancer development and the differential response to immunotherapeutic modulation in elderly patients.
Materials and methods
Mice and reagents
Female C57BL/6 mice aged 6–8 weeks and 17–22 months were used in this study. All mice were obtained from the Laboratory Animal Center of Xi’an Jiaotong University and were housed in the specific pathogen-free animal facility. All animal procedures were performed with the approval of the Animal Care Committee of Xi’an Jiaotong University and conformed to the Guide for the Care and Use of Laboratory Animals published by the US National Institutes of Health.
The antibodies and intracellular staining kit used were as follows: APC/Cy7 anti-mouse CD4 (clone GK1.5), PE/Cy5 anti-mouse CD4 (clone GK1.5), APC/Cy7 anti-mouse CD8a (clone 53–6.7), Pacific BlueTM anti-mouse CD8a (clone 53–6.7), PE/Cy7 anti-mouse/human CD44 (clone IM7), Pacific Blue anti-mouse Ly108 (clone 330-AJ), PE/Cy7 anti-mouse CD69 (clone H1.2F3), PE/Cy5 anti-mouse CD25 (clone PC61), PE/Cy5 anti-mouse CD127(IL-7Rα) (clone A7R34), FITC anti-mouse CD11c (clone N418), FITC anti-mouse/human CD11b (clone M1/70), PE/Cy7 anti-mouse I-A/I-E (clone M5/114.15.2), APC/Cy7 anti-mouse CD19 (clone 6D5), Pacific BlueTM anti-mouse/human CD45R/B220 (clone RA3-6B2), PE/Cy5 anti-mouse CD45R/B220 (clone RA3-6B2), FITC anti-mouse CD45.2 (clone 104), PE anti-mouse CD45.2 (clone 104), PE/Cy7 anti-mouse IL-10 (clone JES5-16E3), Pacific BlueTM anti-mouse FOXP3 (clone MF-14), APC/Cy7 anti-mouse IFNγ (clone XMG1.2), APC anti-mouse LAP (TGF-β1) (clone TW7-16B4), APC anti-mouse CD223(LAG-3) (clone C9B7W), PE anti-mouse CD279 (clone 29F.1A12), PE/Cy7 anti-mouse TIM3 (clone B8.2C12), and Fixation Buffer(Cat # 420801) and Intracellular Staining Perm Wash Buffer(Cat # 421002). All above-mentioned reagents were purchased from BioLegend (San Diego, California, USA). FITC anti-Mo Granzyme B (clone NGZB), and Transcription Factor Fixation/Permeabilization Concentrate and Diluent were purchased from eBioscience.
Tumor model and preparation of cell suspensions
Young and old mice were injected subcutaneously with 2×10⁵ B16F10 cells per mouse. The tumors were visible 5 days after engraftment and then the volumes were measured every 2 days. Tumor volumes were determined by caliper measurement using the formula V = length×width2/2. Finally, tumor tissues were excised and weighed at indicated time point (17 days after engraftment). Next, freshly isolated tumor tissues were minced into approximately 1 mm3 cubic pieces and digested using 0.1% collagenase IV (LS004186, Worthington), 0.002% DNAse I (D8071, Solarbio), and 0.01% hyaluronidase (H3506-1G, SIGMA), then incubated on a rocker at 37°C for 40–50 min (according to tumor size). The digested cells were filtered through a 70 µm cell strainer and washed twice with cold PBS (phosphate-buffered saline) added 2% FBS (Fetal bovine serum) buffer. The remaining cells were stained with APC-CD45.2 (Clone 104; BioLegend) and 7AAD (Part 76332; Lot B226294 Biolegend) for 30 min at 4°C, then washed and suspended in PBS (2% FBS) buffer for flow cytometric sorting using FACS Aria II Cell Sorter (BD Biosciences). Sorted CD45.2+7AAD- cells with a purity greater than 95% and viability higher than 90% were used for 10X genomics scRNA-seq.
ScRNA-seq and VDJ sequencing
The single-cell library preparation was constructed using 10X Chromium Single Cell V(D)J V2 Reagent Kits according to the manufacturer’s protocol. Briefly, single-cell suspensions with a concentration of 1000 cells/µL were loaded on the 10X genomics chromium controller single-cell instrument. Reverse transcription reagents, barcoded gel beads, and partitioning oil were mixed with the cells for generating single-cell gel beads in emulsions (GEM). After reverse transcription reaction, the GEMs were broken. The barcoded, full-length cDNA was amplified and purified to build V(D)J enriched TCR library and 5’ gene expression library. The mouse T Cell V (D) J Enrichment Kit was used to isolate and enrich for the V (D) J sequence. Finally, the constructed libraries were sequenced on the Illumina NovaSeq 6000 platform with NovaSeq 6000 S4 Reagent Kit (300 cycles).
ScRNA-seq data processing
Cell Ranger (V3.0.2, https://support.10xgenomics.com/) was used to process scRNA-seq data and generate the matrix data containing gene counts for each cell per sample. Briefly, raw base call files from Illumina sequencers were first demultiplexed into FASTQ files with the cellranger mkfastq pipeline. Then, the splicing-aware aligner STAR was used to align FASTQs files to the mouse reference genome (mm10). The aligned reads were further counted using the cellranger count pipeline. Finally, the gene expression matrixes of all samples were imported into Seurat V327 and merged for subsequent analyses. The following filtering steps were carried out to exclude low-quality cells: cells with fewer than 200 and more than 3000 detected genes were discarded; cells with a high fraction of mitochondrial genes (>10%) were removed. As a result, a total of 4606 cells (young mice) and 5375 cells (old mice) with 973 informative genes were included in the analyses.
Clustering of single cells and cell-type annotation
The gene expression data were log-normalized and scaled with default parameters. The top 3000 most variable genes identified by Seurat function ‘FindVariableFeatures’ were used for the principal component analysis (PCA). The data were scaled using ‘ScaleData’ and the first 50 principal components (PCs) selected based on the ElbowPlot were used for clustering analyses. Cell clusters were identified using ‘FindNeighbors’ and ‘FindClusters’ functions implemented in Seurat with default parameters and resolution parameter as 1.2. The t-distributed stochastic neighbor embedding (t-SNE) and uniform manifold approximation and projection (UMAP) were used to visualize the clustering results with default parameters. Myeloid cells and lymphocytes were further separated into different subtypes based on the same procedures. The singleR package (V1.4.0)28 and ‘MouseRNAData’ and ‘ImmGenData’ reference databases were used to annotate the cell type of large cell populations. The cell types of clusters and subclusters were further confirmed and annotated by comparing the specifically expressed genes identified by the Seurat ‘FindAllMarkers’ function with the known cell markers reported in the literature.
Single-cell trajectory analysis and definition of cell states
The activated_CD8+ T cell, cytotoxic CD8+ T cell and exhausted CD8+ T cell were selected for single-cell trajectory analysis, which were used to probe the activation status of tumor-infiltrating CD8+ T cell. In addition, the memory-like CD8+ T cell, cytotoxic CD8+ T cell and exhausted CD8+ T cell were selected for single-cell trajectory analysis, which defined the differentiation status of tumor-infiltrating CD8+ T cells after tumor antigen stimulation. Using Monocle (V2.0),29 cells were ordered according to their inferred pseudotime by following the steps described on Monocle documentation (http://cole-trapnell-lab.github.io/monocle-release/docs/). Only the top 100 differentially expressed genes identified by Seurat were used for dimensionality reduction and trajectory reconstruction. The reduce dimension function with DDRTree as the reduction method was applied to the top PCs and projected the cells onto two dimensions. After the dimension was reduced, the ‘orderCells’ function was used to order cells and the plot_cell_trajectory function was used to visualize the trajectory in two-dimensional spaces.
TCR sequencing data analysis
The clonotypes of single cells were defined using the Cell Ranger pipeline and default settings. TCR reads were aligned to mm10 reference genome. The consensus TCR annotation was performed using Cell Ranger VDR. Only in-frame rearrangement of TCR alpha and beta chains were considered to be productive and were used to define the dominant TCR of a single cell. Each unique dominant alpha-beta pair was defined as a clonotype. Two cells with identical alpha and beta sequences were assigned to the same clonotype. Cells harboring the clonotype that also presents in other cells were considered as clonal populations, and the number of such cells with the dominant alpha-beta pair indicated the degree of clonality of the clonotype. A total of 699 cells (young mice) and 356 cells (old mice) with such TCR alpha-beta pairs were identified.
GO, KEGG, GSEA and gene set variation analysis analysis
Gene Ontology (GO) and Kyoto Encyclopedia of Genes and Genomes(KEGG) enrichment analyses were performed by WebGestalt (http://www.webgestalt.org), using genes specifically expressed in memory_like CD8+ T cells as the input gene list. Gene set variation analysis (GSVA) was used to estimate the enrichment scores of gene sets using the gene count data of each cell and was performed using R package ‘GSVA’ (V.1.37).30 The differential pathways (log2 fold change >0.32 and adjusted pvalue <0.05) identified by limma package (V.3.44) were plotted in the bubble chart. Gene Set Enrichment Analysis (GSEA) analysis was performed for each cell subpopulation using the scaled gene expression matrix and GSEA package (V.4.1) available at https://www.gsea-msigdb.org/gsea/downloads.jsp with default parameters. The gene sets for both GSVA and GSEA are provided by R package msigdbr.
In vivo antibody depletion assay
To deplete CD8+ T cells, young or old mice were treated with either anti-CD8 antibody (2.43 (BE0061, Bio X Cell) or isotype controls (rat IgG2b (BE0090, Bio X Cell)). Antibodies were injected intraperitoneally every 3 days starting 7 days after tumor cell inoculation. The depletion efficiency of was assessed using flow cytometry of blood samples collected on day 10 after tumor inoculation.
Flow Cytometry analysis
Single immune cells were obtained from draining lymph nodes and tumor tissues of indicated mice. For cell surface analysis, a total of 1–5×10⁶ cells were stained with Abs in the dark at 4°C for 30 min. After washing with cold resuspension solution buffer (1×PBS supplemented with 2% FBS), cells were analyzed using CytoFLEX flow cytometer (Beckman Coulter). CytExpert software (V.2.4) was used for data analysis. To detect the expression of intracellular transcriptional factors, cells were fixed and permeabilized following 30 min surface staining according to the manual of Transcription Factor Staining kit (eBioscience), followed by anti-Foxp3 antibody staining and Flow Cytometry (FACS) analysis. For cytokine analysis, cell samples were stimulated in vitro with Phorbol 12-myristate 13-acetate/Ionomycin in the presence of Brefeldin A (BioLegend) and Monensin (BioLegend) for 4 hours. Cells were washed and stained with surface marker antibodies, fixed and permeabilized using Fixation/Permeabilization buffer (BioLegend), and stained with intracellular antibodies.
Quantification and statistical analysis
Statistical analyses were performed using GraphPad Prism (V8) and R (V3.6). Graphs were generated using GraphPad Prism and R ggplot2 package. Statistical analysis was applied to biologically independent mice or technical replicates for each experiment. The two-tailed Student’s t-test was used for all statistical calculations using GraphPad Prism V8 software. All error bars were reported as mean±SEM with n=3 or n=5 independent biological replicates. The level of significance was indicated as *p<0.05, **p<0.01, ***p<0.001, ****p<0.0001.
Results
Changes in immune cell composition of the TME during aging
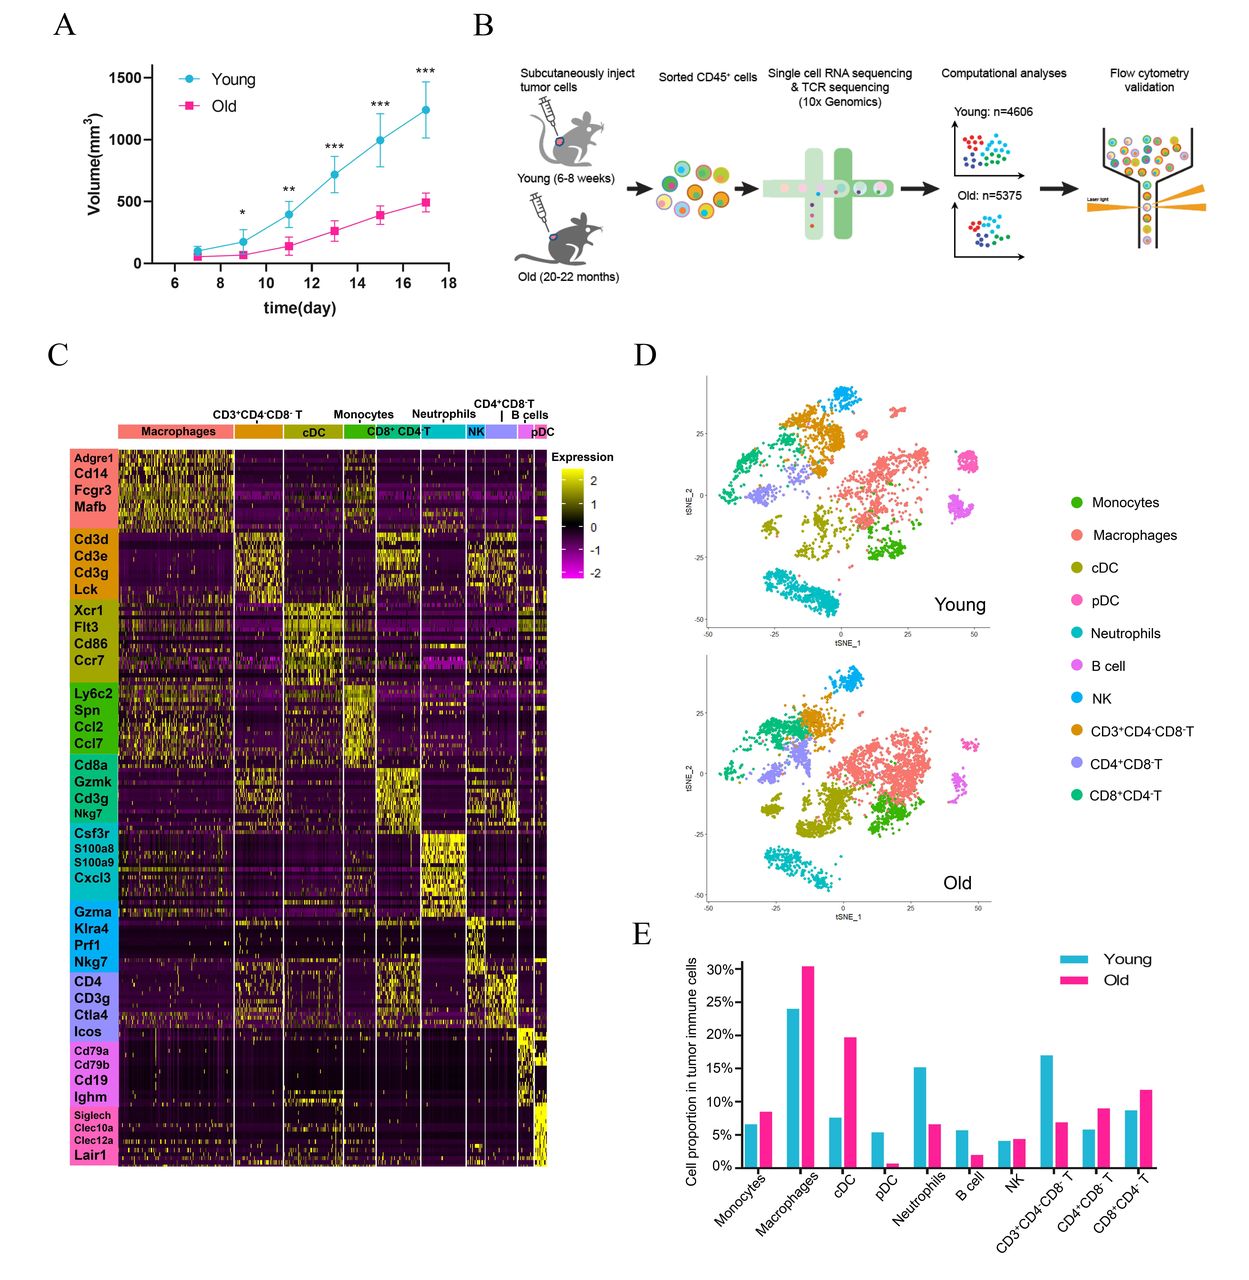
To assess the effects of young and old host immune environment on tumor growth, we established syngeneic tumor models by subcutaneously implanting B16F10 melanoma cells into the right flanks of young (8–10 weeks, n=6) and old (20–22 months, n=6) C57BL/6J mice. Consistent with published results,8 15 31 old mice underwent significantly delayed tumor growth compared with young mice (figure 1A), indicating that host-intrinsic factors indeed influenced tumor growth. To reveal the tumor-infiltrating immune cell composition, we carried out single-cell transcriptomes of CD45+ immune cells paired with TCR sequences of T cells in tumors isolated from young and old mice (figure 1B). After quality control and filtering, we obtained single-cell transcriptomes from 9981 cells (4606 for young mice and 5375 for old mice) with a median of 973 genes (Methods). The scRNA data was normalized together and no batch effects were detected by PCA analysis (online supplemental figure S1A). The clustering result was neither predominately contributed by cell cycle phases (online supplemental figure S1B) nor by the sample group (online supplemental figure S1C). Clustering analysis revealed 25 cell populations in the tumors of young and old mice. All clusters, except for cluster 25 that expressed a high level of Ptprc, were identified as immune cells and used for subsequent analyses (data not shown). Analysis of the top 20 differentially expressed genes across these clusters revealed 10 cell types with unique transcriptional features (figure 1C, online supplemental data 1), including macrophages (Adgre1, Cd14, and Fcgr3), cDCs (Xcr1, Flt3, and Ccr7), pDCs (Siglech, Clec10a, and Clec12a), monocytes (Ly6c2 and Spn), neutrophils (Csf3r, S100a8, and Cxcl3), natural killer cells (Gzma, Klra4, and Nkg7), CD3+CD4−CD8− T cells (Cd3d, Cd3e, and Cd3g), CD8+CD4− T cells (Cd3d, Cd3e, and Cd8), CD4+CD8− T cells (Cd3g, Cd4, and Ctla4), and B cells (Cd79a, Cd79b, and Cd19) (online supplemental S1D). We visualized these cell types in two-dimensional spaces using tSNE and confirmed their cell identities by examining the expression of classic marker genes curated from the literature (online supplemental S1E).32–34 The distribution of cell types captured by scRNA was comparable between young and old mice (figure 1D). However, the proportions of CD3+CD4-CD8- T lymphocytes, B lymphocytes, pDC, and neutrophils were dramatically reduced, whereas the proportions of macrophages, cDCs, and CD4+CD8- T lymphocytes were increased in old mice compared with young mice (figure 1E), highlighting the significant differences of tumor-infiltrating immune cells during aging.
Supplemental material
Supplemental material

Changes in immune cell composition of the TME during aging. (A) Tumor growth of B16 melanoma in young (n=6) and old (n=6) mouse models. Mice with the tumor size of length × width2/2 (mm2) were monitored. (B) Schematic diagram of the experimental design, scRNA-seq, data analysis, and validation. (C) Heatmap showing the relative expression (expression of normalized log2 (count +1)) of marker genes across different immune cell types. (D) tSNE projections of immune cells in tumors of young (upper) and old (below) mice. (E) The proportions of various immune cell types in tumors of young and old mice. cDC, conventional dendritic cells; NK, natural killing cells; pDC, plasmacytoid dendritic cells; scRNA-seq, single-cell RNA sequencing; TCR, T cell receptor; TME, tumor microenvironment; t-SNE, t-distributed stochastic neighbor embedding.
Percentage comparison within tumor-infiltrating myeloid cells between young and old mice
Since myeloid cells were the most abundant cell types in our dataset, we first investigated the heterogeneity of myeloid cells in tumors of young and old mice through finer clustering. Although the size of total myeloid population was similar between young and old mice, old mice showed significantly lower percentage of neutrophils but higher percentage of DCs in comparison to that of young mice, and the proportions of tumor-infiltrating monocytes and macrophages showed a slight increase (figure 2A). To assess whether neutrophils harbored potential functional differences between young and old mice, we compared gene expression profiles across these two groups (online supplemental S2A). Most genes displayed comparable expression levels between young and old mice, suggesting that aging may not affect the functional activity of neutrophils such as infiltration and cytokine production. Other myeloid cells, including macrophages, DCs, and monocytes, which consisted of diverse subtypes,35 36 were then partitioned into 5, 4, and 2 subsets, respectively (figure 2B, online supplemental S2B-C). We confirmed their identities by examining the expression of classic markers (online supplemental figure S2D-E, data 2).33 37 The subsets that belong to the same cell type were clearly clustered together. Each subset was characterized by a specific gene expression pattern (figure 2C) and was labeled using their cluster index. The subtypes of macrophages and DCs showed striking differences in their proportions (figure 2D). We, thus, performed elaborate analyses on their subgroups.
Supplemental material
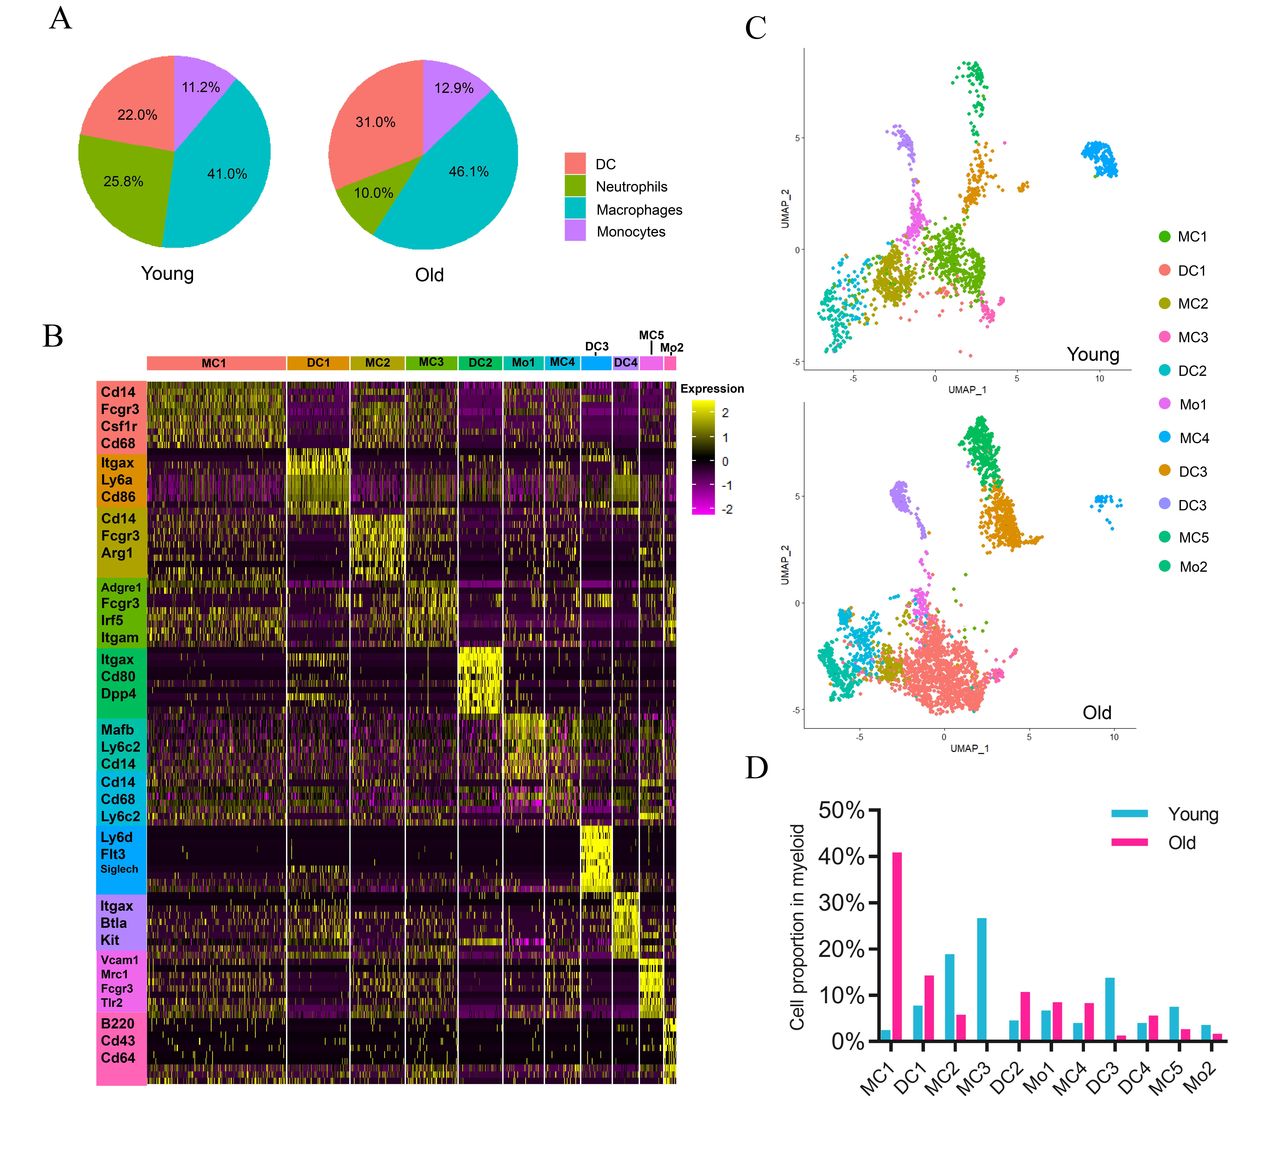
Myeloid cell composition of the TME in young and old mice. (A) Pie charts showing the proportions of four major myeloid cell types in tumors of young and old mice. (B) Heatmap showing the relative expression (expression of normalized log2 (count +1)) of top differentially expressed genes across different myeloid cell clusters. (C) UMAP projections of myeloid cell subpopulations in tumors of young (upper) and old (below) mice. (D) The proportions of various myeloid cell clusters in young and old mice. DC, dendritic cell; TME, tumor microenvironment; UMAP, uniform manifold approximation and projection.
Macrophage subsets in tumors of young and old mice
Macrophages are highly plastic cells with distinct functional features in the TME.35 38 To further understand the potential functions of diverse macrophage subsets in the TME of old mice, we first evaluated the expression of classical M1-like and M2-like macrophage lineage markers in tumor-infiltrating macrophages (figure 3A). Most M1-like macrophage markers (eg, inflammatory genes), including Cd86, Cxcl10, Ccl9, and Ly6a, were highly expressed in MC1, whereas the M2-like macrophage markers, ie, Arg1 and Mrc1 were highly expressed in M2 and M4. All subsets showed considerable differences between these two groups (figure 3B). The most striking observation was the accumulation of MC1 in tumors of old mice in contrast to highly enriched MC2 and MC3 in tumors of young mice.

Macrophage cell subtypes and their heterogeneity in tumors of young and old mice. (A) Violin plots comparing the relative expression of marker genes across various macrophage subsets. (B) Comparison of the proportions of five macrophage subsets in young and old mice. (C) Heatmap showing expression profiles of chemokines in different macrophage subsets. (D) Bubble plots showing the scores (represented by the color gradient) of different gene sets and proportions (represented by the size of bubble) of each macrophage cluster in young and old mice. The gene set score is calculated by averaging the z-scores of gene expression values of all genes in this gene set. The gene expression in A, C is represented as expression of normalized log2 (count +1)). MC1–MC5: five clusters of macrophages.
Chemokines greatly impact activation, chemotaxis, and polarization of macrophages.39 40 We found that each macrophage subset displayed a distinct chemokine expression profile (figure 3C). MC1 expressed higher level of Cxcl10 which may allow cells to attract both DCs and T lymphocytes via chemotaxis.41 42 MC2 highly expressed Ccl4, Ccl6, and Cxcl13; MC3 highly expressed Ccr2; MC4 highly expressed Ccl8, Ccl12, and Cxcl16 which was associated with tumor progression43; MC5 highly expressed Ccl3, Cxcr4, and integrin Itga4 (also known as Cd49d), which are specifically expressed in the monocyte-derived Tumor-associated macrophages (TAMs).44 Moreover, we found that a large proportion of MC1 displayed the highest inflammatory, macropinocytotic and phagocytotic activities among all macrophage subtypes in old mice (figure 3D, online supplemental data 3). Several genes including Maf, Il4ra, Ly6c2, and C1qa were strikingly different in MC2 of young mice compared with old mice (online supplemental figure S2B). Both MC2 and MC4 in old mice expressed higher Vascular Endothelial Growth Factor A (VEGFA) (online supplemental S2B,C), which suggests that decreased angiogenesis in tumors of old mice was likely not due to decreased VEGFA production. Overall, we demonstrated that macrophages in old mice acquired increased proinflammatory states.
Supplemental material
DC subtypes in tumors of young and old mice
DCs are also heterogeneous and display various functional states in the TME.45 Four DC subsets were identified based on known biomarkers and genes critical for DC function (figure 4A). DC1 was identified as Itgax+Itgam+Cd14+ Monocyte-derived DC (MoDC); DC2 was identified as Flt3+Zbtb46+Flt3+Ncoa7+ cDC2; DC3 was defined as pDC with Siglech+Irf8+Clec12a+; DC4, which shared several common biomarkers with DC2 but specifically expressed Clec9a, Btla, Xcr1, and Itgae, was identified as cDC1. cDC2 and MoDC were highly enriched in tumors of old mice, while the pDC was highly enriched in tumors of young mice (figure 4B). We then determined the differential expression of genes relevant to cytokine production and chemotaxis, as well as those critical for antigen processing and presentation, and immune regulators, which allow DCs to regulate immune responses (figure 4C, online supplemental figure S4A,B). We showed that chemokine receptor Ccr7, a member of the G protein-coupled receptor family responsible for the recruitment of lymphocytes and mature DCs to lymphoid tissues, was highly enriched in MoDC. Both cDC1 and cDC2 highly expressed costimulatory genes Cd80, Cd86, Cd83 and/or Ly6a, indicating their potential roles in activating immune response. pDC highly expressed Cd37, Lag3, Sla2, and Lair1, suggesting the inhibitory roles in downregulating local immune response (figure 4C). Flow cytometry analysis using previous defined DC markers (online supplemental S4C) confirmed that old mice had lower percentages of pDC (CD11C+MHCII+B220+) (figure 4D), while higher percentages of cDC (CD11C+MHCII+B220−) in tumors (figure 4E). Next, we confirmed the pDC proportions by verifying the expression of Lag3 both in draining lymph nodes (dLNs) (figure 4F) and tumor tissues (figure 4G) of young and old mice. In addition, we found that H2 genes were highly expressed in cDC1 and MoDC, indicating enhanced antigen presentation capacity (online supplemental S4D). To further explore the differences in subset proportions and potential functions between young and old groups, we performed gene GO enrichment analysis on gene sets related to DCs (figure 4H, online supplemental data 3). While pDCs in young mice produced larger quantities of cytokines, cDC1 and MoDC in old mice also tended to express high levels of cytokine-related genes. cDC2 in old mice expressed a batch of genes enriched in processes critical for DC differentiation, chemotaxis, positive regulation of antigen processing and presentation, and showed downregulation in genes associated with apoptotic process. MoDC in old mice presented relatively higher expression of genes related to cytokine production, antigen presentation, and survival compared with that in young mice. For instance, both Fcgr1 and Tcf4 genes, which are associated with immunoglobulin production, were highly expressed in MoDC of old mice. In contrast, Cd37, which is associated with negative regulation of myeloid DC activation,46 was preferentially expressed in MoDC of young mice (figure 4I). Overall, these findings demonstrated that in old mice, cDC and MoDC are the predominant populations correlating with antitumor responses.
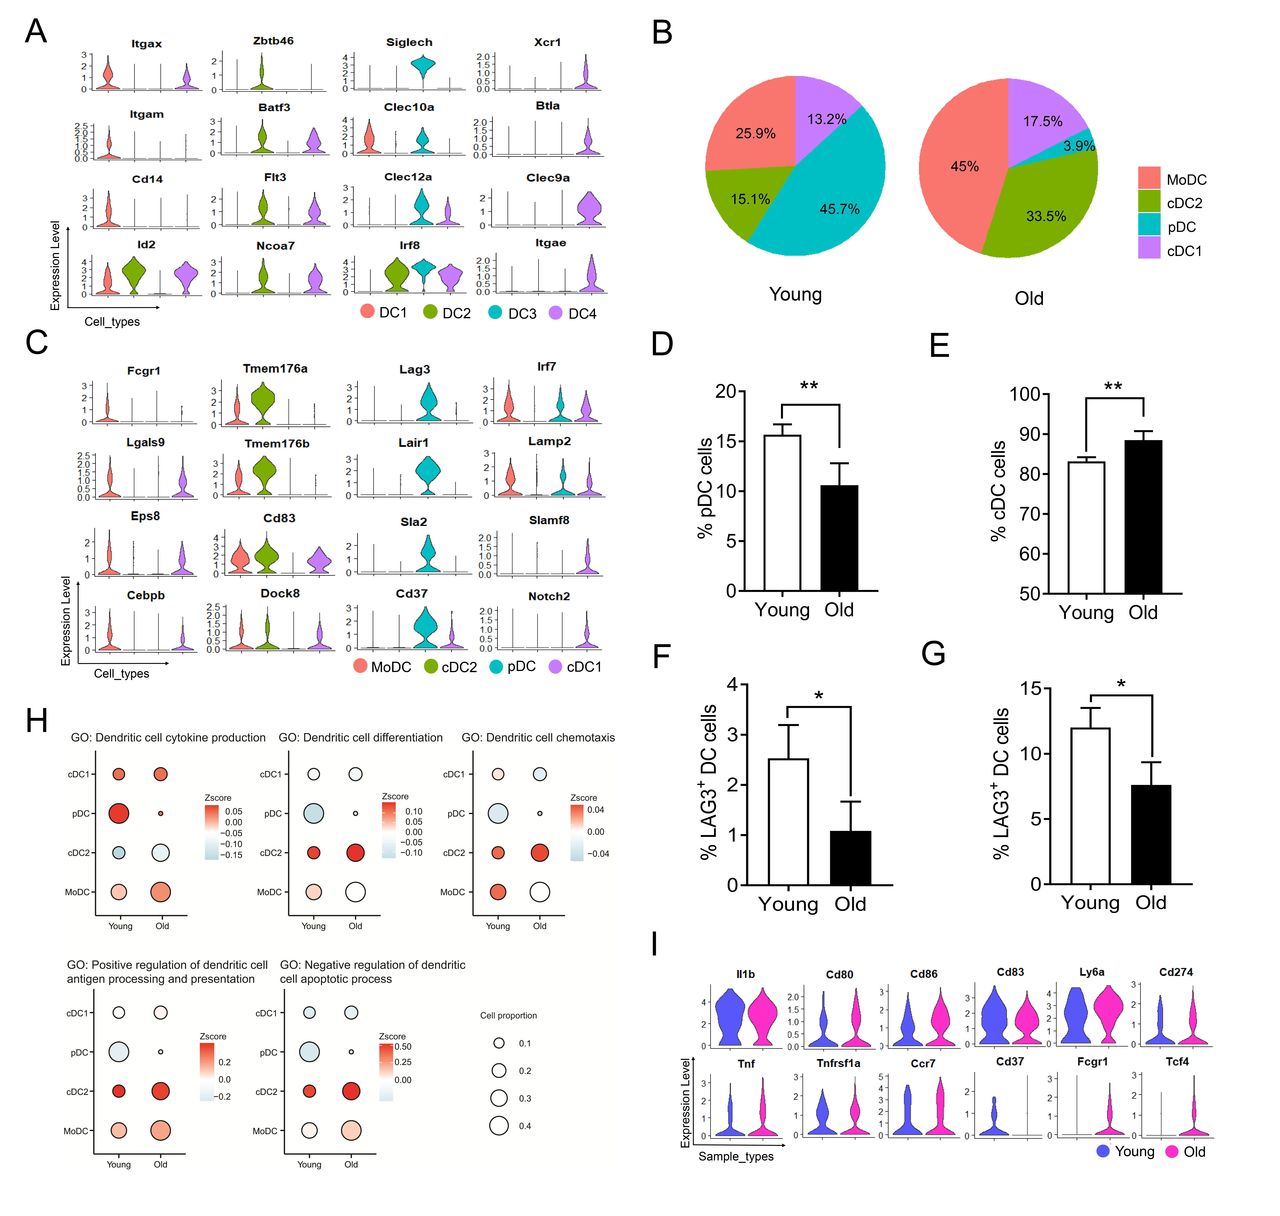
Dendritic cell (DC) and their heterogeneity in tumors of young and old mice. (A) Violin plots comparing the expression levels of representative marker genes among different DC subtypes. (B) Pie charts showing the proportions of four DC subtypes in tumors of young and old mice. (C) Violin plots comparing the gene expression among different DC subtypes. (D, E) Percentages of pDC (D) and cDC (E) in the tumor tissues of young and old groups (n=5). (F, G) Percentages of Lag3+ DC in the dLN (F) and tumor tissues (G) of young and old groups (n=3). (H) Bubble plots showing the scores (represented by the color gradient) of different gene sets and proportions (represented by the size of bubble) of each DC cluster in young and old mice. The gene set score was calculated by averaging the z-scores of gene expression values of all genes in this gene set. (I) Violin plots showing gene expression in MoDC in tumors of young and old mice. The gene expression in A, C and G is represented as expression of normalized log2 (count +1). cDC, conventional DC; MoDC, monocyte-derived DC; pDC, plasmacytoid DC. The level of significance is indicated as *P < 0.05, **P < 0.01.
Characterizations of T cell subtypes in tumors of young and old mice
T cells are the main effector cells of adaptive immunity mediating antitumor response and their function is coupled to the differentiation status.47 We extracted 2934 T cells (1445 in young mice and 1489 in old mice) and performed unbiased clustering using highly variable genes to reveal 9 clusters of T cell populations. The clusters were visualized using UMAP (figure 5A). Each subpopulation was annotated based on the expression levels of the classical T cell markers (figure 5B, S5A) and regulators related to cell differentiation and function (figure 5C, online supplemental figure S5B). The universal T cell markers, for example, Cd3e, Cd3d, were highly expressed in all subpopulations. Four clusters highly expressing Cd8a gene were assigned as CD8+ T cells, including activated_CD8+ T (Cd69+Cd28+), exhausted_CD8+ T (Gzmb+Prf1+Pdcd1+Lag3+Tigit+Havcr2+), cytotoxic_CD8+T (Gzmk+Gzmb+Pdcd1+), and Clec4e_CD8+ T (Clec4e+); two clusters were assigned as effector memory like (EM_like) with high expression of genes such as Cd44, Cd69, including CD8+ EM_like T with expression of Gzmk and Cd8a, and CD4+ EM_like T with expression of Gzmb and Cd4; The rest of clusters were assigned as naive_T with high expression of naïve gene markers Ccr7, Sell, Tcf7 and Lef1, memory-like T cells (Memory_like T; Il7r+Icos+Gzmk-Gzmb-) and regulatory T cells (Treg; Cd4+Foxp3+) (online supplemental S5C). The density distributions reflected the differences in population frequency (figure 5A, online supplemental data 4). Old mice exhibited higher proportions of cytotoxic_ CD8+ T, CD8+ EM_like T, CD4+ EM_like T, and memory_like T but lower proportions of activated_CD8+ T, exhausted_CD8+ T, and naive_T compared with young mice (figure 5D). No obvious differences were observed in the proportions of Tregs and Clec4e_CD8+ T cells between the two groups. In general, Tregs can be divided into two subsets with distinct phenotypes and functions, including naturally occurring Tregs (nTregs) and iTregs. GSEA showed more genes associated with iTregs within tumors of young mice compared with old mice (online supplemental S6A). Consistently, FACS analysis of Tregs in tumors of old mice revealed higher proportion of Helios+ Tregs (online supplemental figure S6B) and higher level of Helios expression compared with that of young mice (online supplemental figure S6C). Ccr7, a critical factor controlling thymic Tregs recirculation, was highly expressed in old mice (online supplemental figure S6D). Transforming growth factor (TGF)-β, essential for iTregs to exert suppressive function,48 was also highly expressed in Tregs of old mice. Flow cytometry assay further confirmed that old mice had significantly higher percentages of TGF-β+ Tregs in both dLNs (online supplemental figure S6E) and tumor tissues (online supplemental figure S6F), though the immunosuppressive function of TGF-β+ Tregs remains to be addressed in the future studies. Therefore, more CD8+ effectors were present in the TME of old mice.
Supplemental material

T cell subtypes and their heterogeneity in tumors of young and old mice. (A) UMAP projections of T cells in tumors of young (left) and old (right) mice. (B, C) Expression of signature genes (B) and genes essential for T cell function (C) projected onto UMAP plots in (A). Color scale shows z-score transformation of log2 (count +1). (D) Bar graph showing the percentages of various T cell subtypes in the tumors of young and old mice. EM, effector memory; UMAP, uniform manifold approximation and projection.

Diversity of tumor-infiltrating CD8+ T lymphocytes and their functional states in young and old mice. (A) Pie charts showing the proportions of CD8+ T subtypes in young and old mice. (B) Percentages of PD-1+LAG3+ CD8+ T(left) and TIM3+LAG3+ CD8+ T(right) cells in tumor tissue of young (n=5) and old mice (n=5). (C) Percentages of IFN-γ+ CD8+ T(left) and GranzymeB+ CD8+ T(right) cells in tumor tissue of young (n=3) and old mice (n=3). (D) tSNE plots representing T-cell receptor (TCR) profiles of top 10 clonotypes in tumors of young (left) and old (right) mice. (E, F) Differentiation trajectory of CD8+ T cells reconstructed by monocle2 using scRNA-seq data. Color scale indicates either the ordering of cell in pseudotime (E) or the cell state (F). (G) Venn plots showing the number of shared TCR clones between exhausted CD8+ T and other CD8+ T cells in tumors of young and old mice. (H) Bar graph showing the percentages of TCR sequences shared by exhausted CD8+ T and other CD8+ T cells in young and old mice. (I) Violin plots comparing the gene expression among ‘progenitor’ exhausted CD8+ T and ‘terminally’ exhausted CD8+ T cells. (J) UMAP projections of ‘progenitor’ exhausted CD8+ T and ‘terminally’ exhausted CD8+ T cells in tumors of young (left) and old (right) mice. The icon indicates the cell proportion of the two groups. (K) Percentages of progenitor 1 exhausted CD8+ T (left) and progenitor 2 exhausted CD8+ T (right) cells in tumor tissue of young and old mice (n=5). (L) Percentages of intermediate exhausted CD8+ T (left) and “terminally” exhausted CD8+ T (right) cells in tumor tissue of young and old mice (n=5). The gene expression in I is represented as expression of normalized log2 (count +1). EM, effector memory; ns, not significant; PD-1, programmed cell death 1; scRNA-seq, single-cell RNA sequencing; UMAP, uniform manifold approximation and projection.
Striking shift of tumor-infiltrating CD8+ T subsets in young versus old mice
To gain further insights into CD8+ T cell features in the TME of old mice, we categorized total CD8+ cells into four groups, including activated, cytotoxic, exhausted, and Clec4e positive CD8+ T cells according to gene expression signature. Intriguingly, there was a higher proportion of cytotoxic_CD8+ T cells in old mice compared with young mice while more activated_CD8+ T cells and exhausted_CD8+ T cells were present in young mice (figure 6A). To further confirm these findings, we thus measured the expression level of exhaustion markers such as PD-1, LAG3, and TIM3 (online supplemental figure S7A,B) with flow cytometry analysis, and found that old mice indeed had lower percentages of PD-1+LAG3+ and TIM3+LAG3+ (exhausted) cells (figure 6B), but displayed higher percentages of Interferon (IFN)-γ+ and Granzyme B+ (cytotoxic) cells in dLN (online supplemental figure S7C) and tumor tissues (figure 6C). Therefore, those observations clearly suggested the less exhausted phenotype of CD8+ T cells in old mice. Importantly, these findings were also confirmed by the TCR repertoire analysis given the top 10 clones in young mice were annotated as exhausted_CD8+ T cells and the top 10 clones in old mice were annotated as cytotoxic_CD8+ T cells (figure 6D, online supplemental data 5). To elucidate the transcriptional fate of effector CD8+ T cells, we performed trajectory analysis on activated, cytotoxic, and exhausted CD8+ T cells (figure 6E). The trajectory branch started with activated_CD8+ T cells and ended with cytotoxic and exhausted_CD8+ T cells (figure 6F, online supplemental figure S7D), suggesting that activated_CD8+ T cells subsequently differentiated into cytotoxic or exhausted states. Moreover, we found that most genes associated with T cell exhaustion were enriched in young mice while the genes associated with T cell activation were enriched in old mice (online supplemental figure S7E). Moreover, cytotoxic population was enriched in cell proliferation-related pathways in old mice whereas apoptosis process-associated pathways were enriched in young mice (online supplemental figure S7F). The exhausted population expressed cell adhesion-related genes in old mice whereas pathways negatively regulating proliferation were enriched in young mice (online supplemental figure S7G). Consistent with pathway enrichment analysis, activated and exhausted CD8+ T cells in young mice displayed significantly higher apoptosis score (online supplemental figure S7H, data 3), indicating that effector T cells are likely more prone to death. Moreover, we analyzed the shared TCR repertoires of exhausted population with all other CD8+ T cells, including activated_CD8+ T, cytotoxic_CD8+ T, and CD8+ EM_like T (figure 6G). The statistical results showed that tumor-infiltrated exhausted_CD8+ T in young mice shared more TCR clones with activated_CD8+ T and cytotoxic_CD8+ T (figure 6H), suggesting that CD8+ T cells in young mice are more prone to exhaustion.
Supplemental material

Characterization of tumor-infiltrating naive and memory like CD8+ T cells in young and old mice. (A) Pie charts showing the proportions of four T cells subtypes in young and old mice. (B, C) Percentages of CD8+ EM_like T(B) and CD4+ EM_like T (C) in the dLN (upper) and tumor tissues (below) of young and old. (D) Pathway enrichment result of top differential expressed genes in memory_like T cells. (E) Violin plots showing the gene expression in naive_T and different memory_like T cells. (F) Differentiation trajectory of CD8+ EM_like T cytotoxic_CD8+ T and exhausted_CD8+ T cells reconstructed by monocle2 using scRNA-seq data from young and old mice. Colors indicate the cell differentiation states. (G) Tumor volume in B16-bearing young and old mice with or without (IgG) anti-CD8 antibody treatment (n=5). EM, effector memory; scRNA-seq, single-cell RNA sequencing. The level of significance is indicated as *P < 0.05, **P < 0.01, ***P < 0.001.
Exhausted CD8+ T cells are primarily distinguished as ‘progenitor’ and ‘terminally’ subsets based on phenotypical and functional heterogeneity.49 We, thus, extracted all exhausted CD8+ T cells and divided them into two clusters via unbiased analysis. Consistent with previous studies,49 50 our data showed that ‘progenitor’ exhausted CD8+ T cells had proliferative potential, as indicated by high level expression of cell cycle genes (Mki67, Top2a, Ccnb2) and activation marker Cd28. On the other hand, ‘terminally’ exhausted CD8+ T cells highly expressed coinhibitory genes (Pdcd1, Tigit, Lag3, Havcr2, Vsir) and certain cytotoxic genes (Ifng, Gzmb, Pf1) (figure 6I). Of note, old mice presented more ‘progenitor’ and less ‘terminally’ exhausted CD8+ T cells as compared with young mice (figure 6J). In order to further prove these findings, we performed flow cytometry verifications based on the expression pattern of Ly108 and CD69 (online supplemental figure S7I).51 Consistently, we found that there were more prog2 exhausted CD8+ T cells (Ly108+CD69-) in tumors of old mice (figure 6K), while the proportion of terminally exhausted CD8+ T cells (Ly108-CD69+) was significantly reduced (figure 6L).
Characterization of tumor-infiltrating CD8+ memory like T cells in young and old mice
In line with previous studies demonstrating that the number of memory T cells increases during aging in both human52 and mice,53 we found that old mice exhibited higher proportions of CD8+ EM_like T, CD4+ EM_like T, and memory_like T cells than young mice, as well as lower proportions of naive_T cells (figure 7A). Flow cytometry analysis confirmed more CD8+ TEM (figure 7B, online supplemental figure S8A) and CD4+ TEM (figure 7C, online supplemental figure S8B) cells in both dLNs (upper pannel) and tumor tissues (lower pannel) of old mice. While the expression of memory markers was similar, CD8+ EM_like T cells expressed higher levels of Cd28, Ly6a and Gzmk and lower levels of Cd69, Fcer1g, and Cd7 in old mice compared with young mice (online supplemental figure S8C). Similarly, CD4+ EM_like T cells expressed inflammation-related genes including Nfkb1, Isg15, and Jund in old group, whereas those in young mice expressed immunosuppressive genes including Tigit, and glycolysis-related gene Aldoa (online supplemental figure S8D).
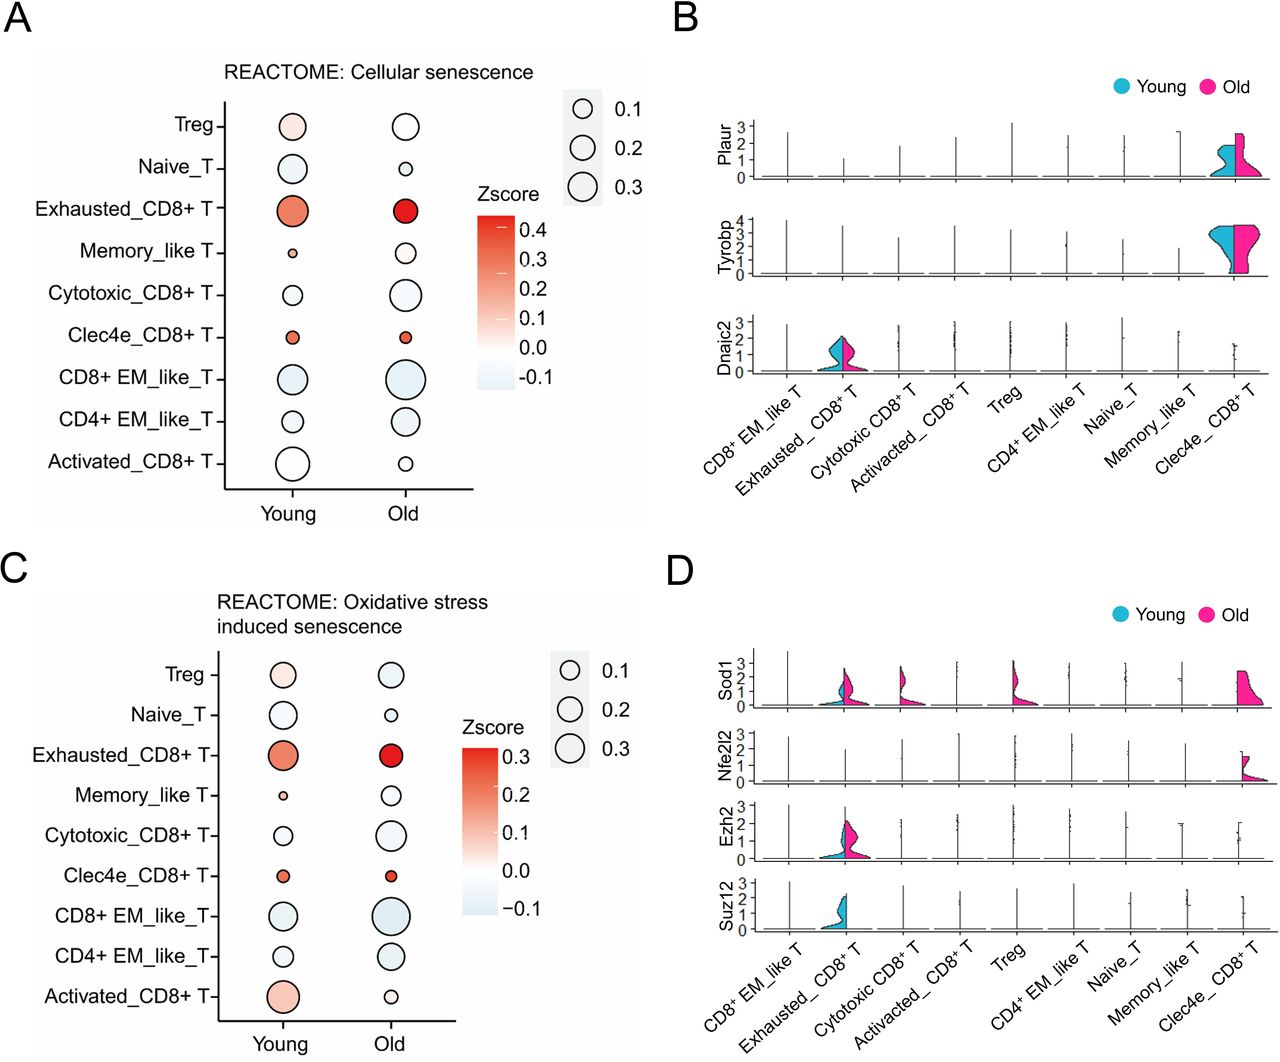
The senescent phenotype of T cells in TME of young and old mice. (A) Bubble plots showing the cellular senescence scores (represented by the color gradient) of different gene sets and proportions (represented by the size of bubble) of each T cells cluster in young and old mice. (B) Violin plots showing senescent marker genes expression in T cells of young and old mice. (C) Bubble plots showing the oxidative stress induced senescence scores (represented by the color gradient) of different gene sets and proportions (represented by the size of bubble) of each T cells cluster in young and old mice. (D) Violin plots showing antioxidant genes expression in T cells of young and old mice. The gene set score was calculated by averaging the z-scores of gene expression values of all genes in this gene set. The gene expression in C and D is represented as expression of normalized log2 (count +1). EM, effector memory; TME, tumor microenvironment.
In addition to CD4+ and CD8+ EM_like T cells, we also discovered an undefined type of memory_like T cells uniquely present in old mice, expressing genes related to T cell activation and differentiation (figure 7D). Apart from highly expressing costimulatory genes (Cd82, Icos, Ly6a, Cd44), memory_like T cells also expressed high level of differentiation-related genes (Rora, Cebpb, Zeb1, and Ikzf3), and proliferation-related genes (Cdkn1a, Bcl2a1d, Bcl11b, and Zc3h12a) (figure 7E). Yet, it requires further validation and investigation regarding the phenotypic and functional features of this memory_like T cells in old mice.
To further explain the differentiation relationship among CD8+ T cell populations, we constructed a trajectory tree for CD8+ EM_like T, cytotoxic_CD8+ T and exhausted_CD8+ T cells. CD8+ EM_like T cells were located at the beginning of the trajectory tree based on pseudotime (online supplemental figure S8E), while cytotoxic_CD8+ T, and exhausted_CD8+ T cells were located in the middle and ends of the trajectory tree, respectively (online supplemental figure S8F). CD8+ EM_like T cells of old mice were activated to become cytotoxic_CD8+ T earlier than that of young mice. In contrast, cytotoxic_CD8+ T cells of young mice underwent exhaustion earlier and more readily than that of old mice (figure 7F). To further investigate the contributions of CD8+ T cells in mediating antitumor immunity, we carried out the CD8+ T cell depletion experiment with anti-CD8 antibody administered intraperitoneally in tumor-bearing young or old mice (figure 7G). Of note, compared with the isotype control group (IgG), both young and old mice showed an increased tendency of tumor growth after deleting CD8+ T cells. In particular, old mice displayed a greater change of tumor size compared with young group (113.6% vs 28.4%) (online supplemental figure S8G). In this regard, there are still considerable differences between young and old groups on CD8+ T cell depletion, indicating that other factors in old mice may also contribute to the delayed tumor growth.
The senescent phenotype of tumor-infiltrated T cells in young and old mice
T cells are more inclined to adopt the characteristics of senescence with aging or undergoing various viral infections and certain diseases.54 In order to explore the senescent status of intratumoral T cells, we extracted the sequencing data of all T cells for the following analysis. The two groups of tumor-infiltrated T cells showed similar status with exhausted CD8+ T and Clec4e_CD8+ T cells ranking higher cellular senescent scores (figure 8A), whereas cytotoxic_CD8+ T cells exhibited low scores of cellular senescence for both groups. The markers of senescent T cells, such as Plaur, Tyrobp, and Zrf1 (Dnaic2), were also highly expressed in Clec4e_CD8+ T cells and/or exhausted_CD8+ T cells (figure 8B).55–57
Increasing reactive oxygen species production is one of the main factors accompaning cell senescence owing to accumulated protein and lipid damage.58 Exhausted_CD8+ T and Clec4e_CD8+ T cells in both young and old mice displayed high levels of oxidative stress-induced senescence, but not Cytotoxic_CD8+ T cells from both groups, whereas activated_CD8+ T cells in young mice showed a higher level of oxidative stress-induced senescence than that in old mice (figure 8C). In addition, our results showed that the expression of antioxidant factors including Sod159 and Nrf2 (Nfe2l2)60 was elevated in certain types of T cells from old mice (figure 8D), which may respond to gradually increasing oxidative stress. Moreover, we also found that exhausted_CD8+ T cells differentially expressed senescence repressors: Ezh2 and Suz12 (figure 8E),58 indicating a feedback mechanism in these cells that are undergoing senescent stress. Collectively, intratumoral exhausted_CD8+ T cells, but not cytotoxic_CD8+ T cells, displayed senescent features regardless of old and young mice.
Discussion
In this study, we reported the profile of immune cells in the TME of young and old hosts at the single-cell level and revealed possible immune-related mechanisms for old individuals that underwent delayed tumor progression. Given that most preclinical models used young animals, and most common cancers behaved differently in young and elderly patients, we and others considered using old animals to explore the role of aging in the tumor immune microenvironment.61–64 Although the life span of mice and humans are very different, many studies have shown that humans and mice are very similar in disease progression, the physiological functions of various organs, and the molecular mechanism of aging.65 66 In mice, senescence begins at around 17 months. Therefore, we selected mice that are 17–22 months as the old group and 8–10 weeks mice as the young group. After confirming delayed tumor growth in old mice,61 we sorted CD45+ immune cells with flow cytometry before performing scRNA-seq analysis. Our data showed that immune cells were distinct in composition and characteristics between these two groups, supporting that in comparison to young mice, old mice present a tumor environment with effector populations armed with stronger functional features to better defend against tumor progression.
T cell-mediated immunity is a vital component of the immune response for host defense against cancer.62 CD8+ T cells, the major cytotoxic killers of tumor cells, exhibited heterogeneity in the TME by scRNA-seq.23 32 67 68 Here, we aimed at investigating tumor-infiltrating T cell populations and the corresponding characteristics, and determining the clonal dominance of CD8+ TILs in B16 melanoma tumor model. Nine types of T cells were characterized based on transcriptome analysis of single cells, including four types of CD8+ T cells, three types of memory like T cells, naïve T cells, and Tregs. We found that a large proportion of tumor-infiltrating CD8+ T cells were newly activated or exhausted in young mice, whereas a significantly higher proportion of cytotoxic or memory T cells were present in old mice. Moreover, both sequencing and flow cytometric analysis suggested that old mice presented more ‘progenitor’ and less ‘terminally’ exhausted CD8+ T cells, which was in line with previous studies showing that immunotherapy was highly effective in old animals with oral cancer and melanoma model.7 69 Of note, in other studies immune checkpoint blockade showed comparable therapeutic effects between young and old mice in B16 melanoma model and hematological malignancy model, but was less effective in glioblastoma model.5 70 71 Therefore, it remains controversial and requires further investigations to solve all these discrepancies with different model systems. Besides, flow cytometry analysis confirmed that old mice had higher percentages of IFN-γ+ and Granzyme B+ CD8+ T cells in both dLNs and tumor tissues. Consistently, a recent study reported that Cd49dhi CD8+ T cells are more abundant in tumors and exhibit a stronger antitumor effect in old mice.15 In addition, tumor-infiltrating CD8+ T cells showed enhanced survival in old mice, while those in young mice were more prone to apoptosis. These findings are largely supported by the functional experiment, in which old mice displayed more severely reduced antitumor response on CD8+ T cell depletion compared with young mice. The remaining difference of tumor growth between old and young mice after Ab treatment indicates that other factors in old mice may also contribute to antitumor effects. The trajectory analysis of activated_CD8+ T, cytotoxic_CD8+ T, and exhausted_CD8+ T cells showed that tumor-infiltrating CD8+ T cells underwent two sequential stages following activation with continuing differentiation trajectory in young mice, whereas CD8+ T cells were primarily located at the end of the trajectory tree in old mice, suggesting that effector CD8+ T cells underwent distinct differentiation programming during defense against tumor cells in the TME of young versus old mice.
With aging, continuous antigen stimulation and degeneration of the thymus cause the distribution of T cell subsets to shift from naive T cells to memory or memory-like cells.72 Previous studies demonstrated a reduction of response to neoantigens in elderly individuals due to a lower number of naive T cells.62 However, this does not necessarily indicate that the ability of old individuals to defend against foreign antigens is reduced, given that memory T cells cross-reactive to neoantigens may directly differentiate into effector T cells, and secrete inflammatory cytokines together with bystander memory-like cells. Consistently, there are several subsets of memory-like cells that exhibit stronger effector function. In old mice, CD8+ EM_like T expressed higher levels of costimulatory genes: Ly6a, Cd28, and the cytotoxic gene Gzmk, while CD4+ EM_like T expressed higher levels of inflammation-related genes: Nfkb1, Isg15, and Jund. In contrast, CD4+ EM_like T cells in young mice expressed higher inhibitory genes: Tight, and Aldoa. In addition, we also identified a unique population, Memory_like T cells, which highly expressed Il7r, Cd44, and costimulation genes (eg, Cd82, Icos, Ly6a). Gene expression enrichment analysis showed that upregulated genes in these cells were related to cell differentiation, proliferation, and T cell activation, suggesting that this cluster of unique T cells in the elderly represent recently activated effector cells derived from memory T cells. Analysis of shared TCR clones between T cell populations in different states can be used to infer differentiation and cell origin.73 Compared with the old group, CD8+ EM_like T cells, cytotoxic_CD8+ T cells, and exhausted_CD8+ T cells in the young group shared a higher proportion of TCR clones. The relationships among three subpopulations were further confirmed by trajectory analysis.
The decline in the ability of elderly individuals to respond to potential viral infections and vaccines is related to the senescence of the adaptive immune system.54 As the only source of T cells, the thymus begins to degenerate during adulthood, making T cells more susceptible to senescence than other adaptive immune cells.74 The current understandings on T cell aging are mainly limited to homeostatic condition. It is unknown whether T cell senescence affects their antitumor immunity even though the occurrence and progression of tumors are closely related to T cell senescence.56 By analyzing the phenotypes of senescence in tumor-infiltrating T cells, we showed that exhausted CD8+ T cells presented higher senescent scores, whereas cytotoxic_CD8+ T cells exhibited low senescent scores regardless of old and young mice. Clearly, T cells from old mice demonstrated considerable antitumor capacities as that from young mice. However, CD8+ T cells in old mice expressed increased antioxidant markers, such as Sod1 and Nrf2, suggesting enhanced resistance to oxidative stress-induced senescence than that in young mice.
NK cells are another key player of immune surveillance against tumorgenesis. However, distinct from the general decline of T cells with aging,75 the proportion and function of NK cells remained relatively stable. Although GSEA showed that NK cells of young mice were relatively active (online supplemental figure S9A), many functions showed no difference except for pathways related to metabolism (online supplemental figure S9B). Our single-cell data demonstrated that tumor-infiltrating NK cells expressed similar levels of functional molecules, such as Prf1, Gzmb, Nkg7, NKG2D(Klrk1), Ly-49g(Klra7), and CD94 (Klrd1) in both young and old hosts (online supplemental figure S9C). Consistent with a previous report in humans,76 our data also showed that NK cells in old mice expressed a lower level of NKG2A(Klrc1) but a higher level of Ly49(Klra4) (online supplemental figure S9C). In addition, we found that NK cells in old mice expressed higher levels of inflammatory genes (Nfkb1 and Stat3) and activation molecule 4-1BB, indicating stronger effector function of NK cells and the proinflammatory status in the elderly.77
Previous studies show that B cells are generated at a reduced rate,78 showing lower levels of percentage and absolute numbers79 80 while also differentiating into longer-lived memory B cells80 in old individuals. In the tumor environment, our data also showed that the infiltrating B cells in the tumors of old mice tended to be memory B cells (online supplemental figure S10A), and were present at a lower percentage than that in young mice (online supplemental figure S10B). In addition, tumor-infiltrating B cells of old mice expressed lower levels of canonical B cell markers (Cd19, Cd79a, and Cd79b) compared with that of young mice (online supplemental figure S10C). These cells were similar to a type of exhausted or ‘double negative’ memory B cells expressing low level of IgD and Cd27 reported in a previous study.81 IgM memory B cells accumulate with age and become the predominant memory B cell subset. Consistently, our data showed that tumor-infiltrating B cells in old mice express higher level of IgM but lower IgD expression. Previous studies found that 4-1BBL-expressing B cells increase with age in humans and mice, enhancing granzyme B expression of CD8+ T cells by presenting endogenous antigens,15 however, the current study did not reveal an enrichment of this population in the tumor of old mice.
Among myeloid cell lineages, cDCs and M1-like macrophages play positive roles in defending against tumor growth through innate mechanisms and activation of adaptive immunity.35 36 cDC1 mainly activates CD8+ T cells by processing and presenting exogenous antigens through MHC class I molecules, while cDC2 is crucial for inducing the immune response of CD4+ T cells.36 82 Our data also showed that the proportion of DCs that produce the inflammatory factor (TNF-α), and Ccl5, critical for cDC1 recruitment to TME,83 were increased in old mice. cDC2, vital to stimulating CD4+ T cell-mediated immunity in cancer,84 had similar abilities of antigen processing and presentation in young and old mice, but a higher percentage of cDC2 was found in old mice. M1-like macrophages express higher inflammatory genes and are associated with antigen presentation.38 85 We showed that a higher percentage of macrophages in the tumor of old mice are M1-like with enhanced inflammatory factor expression (TNF-α) and potential costimulatory function (Cd80, Cd86). Previous studies showed that M1-like macrophages in old mice display powerful phagocytosis and micropinocytosis abilities, which are beneficial to the internalization of exogenous antigen.86
Parallel to effector cells playing positive roles in mediating antitumor response, there are well-identified immune cells that negatively regulate immune response, including Tregs, MDSCs, M2-like macrophages, and pDCs in tumor environment.87 88 Previous studies revealed that elderly individuals demonstrated changes in Tregs’ frequency and function with aging.89 90 In contrast, the current study showed that the proportion and functional gene expression of Tregs in old mice were similar to that in Tregs of young mice. However, tumor-infiltrating Tregs tended to be of thymic origin (nTregs) in old mice whereas more are iTregs in young mice, supported by flow cytometry analysis showing higher expression of Helios in Tregs from old mice. In addition to Tregs, MDSCs are specialized immunosuppressors to prevent excessive inflammation91 92 and promote tumor growth and metastasis.37 However, no MDSCs were identified in the current data. M2-like macrophages are characterized by high expression of Arg1, Vcam1 or Cd206, and are associated with immunosuppression93 and tumor growth.35 We identified two types of macrophages with high expression of Arg1 (MC2) and high expression of Vcam1 (MC4), and both groups of macrophages were elevated in young mice. pDCs have been shown to associated with poor patient prognosis in several cancers by inducing the expansion of Tregs.94 pDCs were present a lower level in old mice, potentially allowing for more robust antitumor immunity.
In conclusion, we used scRNA-seq analysis to evaluate the proportion and gene expression differences of immune cell components in tumors of young and old mice. In comparison to young mice, old mice showed a higher proportion of effector cells (cytotoxic T cells, cDC, and M1-like macrophages) and a lower proportion of dysfunctional and immunosuppressive cells (exhausted T cells, iTregs, pDC, and M2-like macrophages) in the TME. TCR spectrum and trajectory inference analyses demonstrated preferential differentiation of CD8+ T cells into cytotoxic cells in old mice vs exhausted cells in young mice. Importantly, cytotoxic CD8+ T cells in tumors of old mice did not display cellular and oxidative stress-induced senescent features and remained capable of protection against tumor development. Collectively, our data provided rational evidences for protection against tumor growth in old animals based on a comprehensive examination of the immune profile in the TME.
Code availability
The codes generated in this study are available at the GitHub repository (https://github.com/Immugent/single-cell-data-process).
Data availability statement
The raw data will be made available by the authors, without undue reservation, to any qualified researcher. The data has been uploaded to scRNA database with the repository name of SCP1261. The persistent URL is https://singlecell.broadinstitute.org/single_cell/study/SCP1261. The data will be allowed for resue purpose without a need of licence.
Ethics statements
Patient consent for publication
Ethics approval
The animal study was reviewed and approved by the Animal Care Committee of Xi’an Jiaotong University.
Acknowledgments
We thank Dr Guohua Zhang from Beckman Coulter, Professor Chen Huang and Dr Xiaofei Wang from Department of Cell Biology and Genetics for flow cytometry technical supports.
References
Supplementary materials
Supplementary Data
This web only file has been produced by the BMJ Publishing Group from an electronic file supplied by the author(s) and has not been edited for content.
Footnotes
CZ, LL and XY contributed equally.
Contributors BZ, LZ and CZ conceptualized the study and designed experiments. CZ and HZ collected the tumor samples and FACS analysis with help from LL, YS, HL, KM and XW. LS, AJ, YZ and CZ prepared samples for single-cell sequencing and performed experiments with help from XY and YS. CZ analyzed scRNA-seq data with input from ZX. CZ, LZ and BZ wrote the manuscript. BZ, LZ, ZX, CS, XZ and YH reviewed and revised the manuscript.
Funding This work was supported by grants from Major International (Regional) Joint Research Project (81820108017, BZ), Natural Science Foundation of China (81771673, BZ; 82071828, CS), PUMC Fundamental Research Funds for the Central Universities (3332021074, KM), Young Talent Program of Xi'an Jiaotong University (YX1J005, BZ), Natural Science Foundation of Shaanxi Province (2020JM-065, XZ; 2020JQ-098, LL; 2021JQ-025, XY), Project of Independent Innovative Experiment for Postgraduates in medicine in Xi’an Jiaotong University (YJSCX-2021-xx), Early Career Research Start-up Plan of Xi'an Jiaotong University, Central University Basic Research Fund (sxxj032021015, CS).
Competing interests None declared.
Provenance and peer review Not commissioned; externally peer reviewed.
Supplemental material This content has been supplied by the author(s). It has not been vetted by BMJ Publishing Group Limited (BMJ) and may not have been peer-reviewed. Any opinions or recommendations discussed are solely those of the author(s) and are not endorsed by BMJ. BMJ disclaims all liability and responsibility arising from any reliance placed on the content. Where the content includes any translated material, BMJ does not warrant the accuracy and reliability of the translations (including but not limited to local regulations, clinical guidelines, terminology, drug names and drug dosages), and is not responsible for any error and/or omissions arising from translation and adaptation or otherwise.