Article Text

Abstract
Background Breast cancer (BC) progression to metastatic disease is the leading cause of death in women worldwide. Metastasis is driven by cancer stem cells (CSCs) and signals from their microenvironment. Interleukin (IL) 30 promotes BC progression, and its expression correlates with disease recurrence and mortality. Whether it acts by regulating BCSCs is unknown and could have significant therapeutic implications.
Methods Human (h) and murine (m) BCSCs were tested for their production of and response to IL30 by using flow cytometry, confocal microscopy, proliferation and sphere-formation assays, and PCR array. Immunocompetent mice were used to investigate the role of BCSC-derived IL30 on tumor development and host outcome. TCGA PanCancer and Oncomine databases provided gene expression data from 1084 and 75 hBC samples, respectively, and immunostaining unveiled the BCSC microenvironment.
Results hBCSCs constitutively expressed IL30 as a membrane-anchored glycoprotein. Blocking IL30 hindered their proliferation and self-renewal efficiency, which were boosted by IL30 overexpression. IL30 regulation of immunity gene expression in human and murine BCSCs shared a significant induction of IL23 and CXCL10. Both immunoregulatory mediators stimulated BCSC proliferation and self-renewal, while their selective blockade dramatically hindered IL30-dependent BCSC proliferation and mammosphere formation. Orthotopic implantation of IL30-overexpressing mBCSCs, in syngeneic mice, gave rise to poorly differentiated and highly proliferating MYC+KLF4+LAG3+ tumors, which expressed CXCL10 and IL23, and were infiltrated by myeloid-derived cells, Foxp3+ T regulatory cells and NKp46+RORγt+ type 3 innate lymphoid cells, resulting in increased metastasis and reduced survival. In tumor tissues from patients with BC, expression of IL30 overlapped with that of CXCL10 and IL23, and ranked beyond the 95th percentile in a Triple-Negative enriched BC collection from the Oncomine Platform. CIBERSORTx highlighted a defective dendritic cell, CD4+ T and γδ T lymphocyte content and a prominent LAG3 expression in IL30high versus IL30low human BC samples from the TCGA PanCancer collection.
Conclusions Constitutive expression of membrane-bound IL30 regulates BCSC viability by juxtacrine signals and via second-level mediators, mainly CXCL10 and IL23. Their autocrine loops mediate much of the CSC growth factor activity of IL30, while their paracrine effect contributes to IL30 shaping of immune contexture. IL30-related immune subversion, which also emerged from computational analyses, strongly suggests that targeting IL30 can restrain the BCSC compartment and counteract BC progression.
- tumor microenvironment
- breast neoplasms
- cytokines
Data availability statement
Data are available on reasonable request. All data generated or analysed during this study are available from the corresponding author on reasonable request.
This is an open access article distributed in accordance with the Creative Commons Attribution Non Commercial (CC BY-NC 4.0) license, which permits others to distribute, remix, adapt, build upon this work non-commercially, and license their derivative works on different terms, provided the original work is properly cited, appropriate credit is given, any changes made indicated, and the use is non-commercial. See http://creativecommons.org/licenses/by-nc/4.0/.
Statistics from Altmetric.com
Background
Breast cancer (BC) is the leading cancer killer among women worldwide.1 Mortality is due to metastatic disease for which there is no effective cure. Metastasization is driven by a small population of cancer stem cells (CSCs), which are prevalent in BCs with a worse prognosis,2 and may contribute to their propensity for metastasis and chemotherapy resistance.3 Signals regulating CSC entry or exit from the steady-state condition are fundamental in shaping BC behavior and patient outcome.3 The immunoregulatory molecule, interleukin (IL) 30, has been found in murine (m) prostate cancer (PC) stem-like cells (SLCs) and has revealed autocrine and paracrine effects in the PC stem cell niche microenvironment and a critical role in PC onset and progression.4 5 Targeting IL30 signaling in PC-SLCs and host environment has proven to counteract PC growth and improve host survival.5
Discovered in 2002 and identified as the p28 subunit of the heterodimeric cytokine IL27,6 which has demonstrated antitumor effects,7–9 IL30 can act as a self-standing cytokine, endowed with its own functional properties,10–12 that signals via IL6 Receptor Subunit Alpha (IL6R) by recruiting a gp130 homodimer.13
In PC and BC, IL30 is produced by cancer and leukocytes infiltrating the tumor or draining lymph nodes (LNs), particularly in the high grade and stage of disease.14 15 In human BC cells, IL30 boosts, via STAT1/STAT3 signaling, a broader program of proliferation, invasive migration and inflammatory milieu and induces cancer cell expression of MYC and SHH, which are fundamental in the maintenance of a putative CSC compartment.16 17 In patients with BC, high levels of IL30, in tumor and draining LNs, have been associated with recurrence and correlated with mortality at multivariate analyses.15 The lack of IL30 in the tumor microenvironment has proved effective in inhibiting the growth and progression of Triple-Negative (TN) BC,18 the molecular subtype with the highest CSC content.19
In the present study, we provide evidence that human and murine BCSCs are both the source and target of IL30, and identify the second-level mediators induced by IL30 in BCSCs and their impact on CSC behavior, immunological context, and host outcome.
Materials and methods
Cell cultures and MTT assay
Human (h) BCSCs, BCSC-608 and BCSC-105, were generated and provided by Professor G Stassi (University of Palermo, Italy), who characterized them as CSCs, which grew in spheres and reproduced, in immunocompromised host, the tumor of origin.20 Both cell lines were authenticated by surface staining for characteristic markers, as described.20
Murine (m) BCSCs, Py230 cells, were derived from a mammary tumor spontaneously arisen in a MMTV-PyMT (mouse mammary tumor virus promoter driven Polyoma middle T-antigen) transgenic female C57BL/6J mouse, and were identified as CSCs, which grew in spheres and reproduced the parental tumor, when implanted as a single cell into syngeneic host.21 mBCSCs were purchased from ATCC (ATCC Cat# CRL-3279, RRID:CVCL_AQ08) and authenticated by Short-Tandem Repeat profiling.
Murine (m) BC cells, E0771 mammary adenocarcinoma cell line (RRID:CVCL_GR23), were derived from a spontaneous mammary tumor developed in a female C57BL/6J mouse,22 and were characterized as Triple-Negative and Basal-like.23 E0771 cells were purchased from CH3BioSystems (Amherst, NY, USA) and authenticated by Short-Tandem Repeat profiling.
All cell lines were passaged for fewer than 6 months after resuscitation and were confirmed mycoplasma-free by PCR analysis.
Cell proliferation was assessed using the CellTiter 96 AQueous One Solution Cell Proliferation Assay (#G3582; Promega, Madison, WI, USA), according to manufacturer’s instructions, as described in the online supplemental materials and methods.
Supplemental material
Flow cytometry
To assess phenotype markers, BCSCs were harvested and mechanically dissociated into a single cell suspension. The cells were pelleted, suspended in PBS and incubated, for 30 min at 4°C, with the antibodies (Abs) listed in online supplemental table S1, at a concentration of 0.25 µg/100 µl. Acquisition was performed using a BD Scientific Canto II Flow Cytometer (RRID:SCR_018056) and the data were analyzed using FlowJo software (FlowJo, RRID:SCR_008520). Dead cells were excluded by 7AAD staining. All experiments were performed in triplicate.
Supplemental material
Transfection with IL27p28 (IL30) expressing vector
Creation of IL30 lentiviral expression vector, and its transfection into Py230 cells, were performed as described in online supplemental materials and methods. Expression of IL30 was confirmed by real-time RT-PCR, Western blotting (WB) and ELISA.
For transient overexpression of human IL30 in BCSC-608, we used the IL27 Human Tagged ORF Clone (#RC209337L1; Origene, Rockville, MD, USA), which was transfected in BCSC-608 cells using Lipofectamine 3000 Reagent (#L3000001; Thermo Fisher Scientific, Waltham, MA, USA). Overexpression of IL30 was confirmed by real-time RT-PCR and WB.
IL30 gene silencing
IL30 silencing in hBCSCs was achieved by using the Human shRNA Plasmid Kit (#TR303941; Origene, Rockville, MD, USA). Non-effective scrambled (Scr) shRNA was used as control. Downregulation of IL30 expression was confirmed by real-time RT-PCR and WB.
PCR array and real-time RT-PCR
PCR array and real-time RT-PCR were performed, as described in online supplemental materials and methods. Expression of human and murine inflammation and immunity genes, listed in online supplemental tables S2,S3, was investigated in IL30 overexpressing or silenced human and murine BCSCs.
Enzyme-linked immunosorbent assay
Quantitation of IL30, CXCL10, IL23, CXCL1 and CSF2, in the supernatant derived from murine or human BCSCs, was carried out as described in online supplemental materials and methods.
Western blotting
Western blot (WB) was performed to assess IL30 overexpression in mBCSCs and IL30 overexpression or silencing in hBCSCs, as described in the online supplemental materials and methods.
Sphere formation assay
The sphere-formation efficiency, and the associated self-renewal ability, of murine and human BCSC cells was assessed by using the Extreme Limiting Dilution Analysis (ELDA, RRID:SCR_018933),24 as described in online supplemental materials and methods.
Mouse studies
The tumorigenicity of mBCSCs was assessed, by limiting dilution analysis, by Bao and coworkers.21 Experimental conditions for tumor growth were determined after orthotopic implantation, in C57BL/6J mice (RRID:IMSR_JAX:000664, purchased from Envigo, Indianapolis, IN, USA), of different dilutions of mBCSCs, and after the assessment of the tumor microenvironment and latency times, as reported in online supplemental materials and methods and figure S1.
Supplemental material
Finally, three groups of forty-five 8 week old mice were subcutaneously injected with 1×10⁴ wild-type (CTRL) mBCSCs, Empty Vector (EV) or IL30 lentiviral-DNA (IL30LV-DNA) transfected mBCSCs, also referred to as IL30mBCSCs. Based on tumor growth and progression rate, 15 mice from each group were euthanized at key time points (3 mice per point) for histopathological and molecular analyses. The remaining 30 mice per group were kept until tumors reached 1000 mm3 or evidence of suffering was observed. Autopsy and histopathological examinations of the different organs (liver, lungs and spleen) were performed. With an overall sample size of 30 mice per group, a one-sided log-rank test detected a difference of 30% in tumor growth between two groups, with a 90% power, at a 0.05 significance level (G*Power, RRID:SCR_013726).25
For the experimental metastasis assay, three groups of 30 C57BL/6J mice were injected, into the tail vein, with 5×10⁴ mBCSCs, EVmBCSCs or IL30mBCSCs. Mice were sacrificed 40 days after tumor cell injection and the lungs were analyzed for the presence of metastases. Briefly, formalin-fixed lungs were cut into transverse slices, embedded in paraffin and subjected to semiserial 3 µm sections. H&E-stained sections were histopathologically analysed, for the presence of spontaneous or experimental metastasis, under a light microscope (DMLB light microscope; Leica Microsystems, Wetzlar, Germany).
Patients and samples
Thirty-two tumor samples classified as Triple-Negative BCs, according to the St. Gallen International Expert Consensus in 2011, were obtained from the Anatomic Pathology Department of the “S.S. Annunziata Hospital”, Chieti, Italy, after written informed consent from patients. Patients’ clinicopathological characteristics are shown in online supplemental table S4. This sample size allows to detect, with an 80% power, a difference of 10% in the number of CXCL10 (or IL23) positive cells/total number of CD133+IL30+ cells per field, at a 0.05 significance level.26
Histopathology, immunohistochemistry and confocal microscopy
Histology, immunohistochemistry and confocal microscopy were performed as described in online supplemental materials and methods, using the antibodies listed in online supplemental table S5.
Proliferation index, microvessel and cell counts were assessed by light microscopy (DMLB light microscope; Leica Microsystems), at ×400 in an 85,431.59 µm2 field, on single or triple (CD133/IL30/CXCL10 or IL23) immunostained sections, using QWin image analysis software (Leica QWin, RRID:SCR_018940). Six to eight high-power fields were analyzed for each section and three sections per sample were evaluated. Results were expressed as mean±SD of positive cells per field (F4/80, CD11b, Foxp3, CD3, Ly-6G, CD4, CD8, NKp46/RORγt), or mean percentage±SD of positive cells/number of total cells per field (PCNA, MYC, KLF4), or mean percentage±SD of CXCL10 or IL23 positive cells/total number of CD133+IL30+ cells per field. Microvessels were identified as small tubes or circles marked by CD31 Abs and results were expressed as mean±SD of positive vessels/field. Each slide was analyzed by two independent investigators, in a blind fashion, and there was an almost perfect agreement (kappa value=0.82) between their evaluations.
Bioinformatic analyses
For bioinformatic analyses (cBioPortal, RRID:SCR_014555), gene expression data from the “Breast Invasive Carcinoma TCGA PanCancer collection” dataset,27 which includes 1084 BC cases, and from Waddell’s database, which predominantly contains TNBCs (26 out of 75 cases), were downloaded from the cBioportal for Cancer Genomics database (https://www.cbioportal.org; cBioPortal, RRID:SCR_014555) and Oncomine website (https://www.oncomine.org; Oncomine Research Platform, RRID:SCR_007834), respectively. For each sample, the Z-scores of gene expression levels were calculated, compared with the mean of all samples in the study, and all samples with a Z-score ≥2 were considered overexpressing. Subsequently, we selected only the cases for which information regarding the tumor subtype was available, and assessed the association between gene expression and BC subtypes using Fisher’s exact test. The correlation between gene expressions was assessed using Spearman’s rank correlation coefficient (ρ). The Cancer Outlier Profile Analysis (COPA) on Waddell’s database was performed using the data analysis tool included in the Oncomine Platform.
To estimate the tumor-infiltrating immune cell content in BC samples, transcripts per million–normalised RNA-seq data of the “Breast Invasive Carcinoma TCGA PanCancer collection” were downloaded from http://firebrowse.org and analyzed using CIBERSORTx,28 a computational framework, which accurately infers cell type abundance from the RNA profiles of tissue samples, using specific gene signatures. LM22 was used as signature matrix that contains 547 genes, which distinguish 22 human hematopoietic cell phenotypes,29 and batch correction option was enabled to remove technical differences between the signature matrix and RNA-seq data. Results were converted in .xlsx file format, and between-group differences were assessed by Student’s t-test.
All statistical tests were evaluated at an α level of 0.05.
Statistical analysis
For in vitro and in vivo studies, between-group differences were assessed by Student’s t-test, or ANOVA, followed by Tukey HSD test. Between-group differences in sphere-forming potential were evaluated by ELDA.24 Survival curves were constructed using the Kaplan-Meier method and survival differences were analyzed by the log-rank test. All statistical tests were evaluated at an α level of 0.05 using Stata V.13 (StataCorp, College Station, TX, USA; RRID:SCR_012763).
Results
IL30 promotes the viability and mammosphere forming ability of BCSCs
To explore IL30’s impact on human (h) and murine (m) BCSC behavior, we first investigated whether they expressed the IL30 receptor (R) and produced the cytokine.
hBCSCs, referred to as BCSC-608 and BCSC-105, were isolated from invasive ductal adenocarcinomas and are endowed with the functional properties of CSCs.20 mBCSCs, Py230, were isolated from a spontaneously arising tumor in MMTV-PyMY transgenic mouse and identified as multipotent mammary CSCs.21 To exclude differentiated cells, human and murine BCSCs were phenotypically validated by flow cytometry. hBCSCs displayed a CD24+CD29+CD117+CD133+ phenotype and mBCSCs were characterized by a CD24+CD44+CD49f+ phenotype (online supplemental figure S2). Both human and murine BCSCs expressed the two IL30R chains,11 14 IL6Rα (CD126) and gp130 (CD130) (figure 1A).

Expression of IL30 receptor in breast cancer stem cells (BCSCs) and their response to IL30 treatment. (A) Cytofluorimetric analyses of gp130 (CD130) and IL6Rα (CD126) expression in human and murine BCSCs. Red lines: isotype control. Blue lines: specific Abs. Experiments were performed in triplicate. (B) Amino acid sequence and (C) tertiary structure of hIL30 protein. The extracellular portion is shown in orange, the signal peptide is shown in pink, the transmembrane helix is shown in gray (starting with the serine residue at position 209 and ending with the leucine residue at position 224) and the cytoplasmic portion is shown in white. (D) Cytofluorimetric analyses of IL30 expression in hBCSCs. The BCSC-608 cells showed a mean fluorescence intensity (MFI) ratio of 8.5 whereas BCSC-105 cells showed a MFI ratio of 2.3. The MFI was obtained calculating the ratio between the fluorescence of the samples and their isotype controls. Red lines: isotype control. Blue lines: anti-IL30 Abs. Experiments were performed in triplicate. (E, F) Western blot analyses of IL30 protein expression in the cytosolic and plasma membrane fractions of wild-type (CTRL), EV and IL30 gene transfected (IL30-over) BCSC-608 (E) and BCSC-105 (F). (G, H) Confocal microscopy analyses of BCSC-608 (G) and BCSC-105 (H) highlights in green the plasma membrane expression of IL30 that co-localizes with the red-stained Na+K+-ATPase, and in blue the nuclei, stained with 4′-6‐diamidino‐2‐phenylindole (DAPI). Magnification: ×400. Scale bars: 6 µm. (I, J) Relative expression±SD of IL30 mRNA in wild-type (CTRL), EV and IL30 gene transfected (IL30-over) BCSC-608 (I) and BCSC-105 (J). ANOVA, p<0.0001. *p<0.01, Tukey HSD test compared with CTRL and EV-hBCSCs. (K, L) MTT assay of IL30 gene transfected (IL30-over) BCSC-608 (K) and BCSC-105 (L) versus EV-transfected and CTRL cells. ANOVA, p<0.05. *p<0.05, Tukey HSD test compared with CTRL and EVhBCSCs. (M, N) MTT assay of BCSC-608 (M) and BCSC-105 (N), after 48 hours of treatment with anti-IL30Abs (BCSC-608: 0.5 µg/mL and BCSC-105: 5 µg/mL). *Student’s t-test: p<0.05. (O) Sphere-forming assay, evaluated by ELDA, of BCSC-608 after 5 and 10 days of treatment with anti-IL30Abs (0.5 µg/mL). *p=0.00489, χ2 test compared with untreated cells. **p=0.021, χ2 test compared with untreated cells. (P) BCSC-608–derived spheres were dissociated, seeded at concentrations of 1 cell/well, and untreated (CTRL, pictures on the left) or treated with anti-IL30 Abs (0.5 µg/mL) (pictures on the right). Magnification: ×400. Scale bars: 100 µm. (Q) Sphere-forming assay, evaluated by ELDA, of BCSC-105 after 5 and 10 days of treatment with anti-IL30Abs (0.5 µg/mL). *p=0.00374, χ2 test compared with untreated cells. **p=0.012, χ2 test compared with untreated cells. (R) Relative expression±SD of Il30 mRNA in Il30 gene transfected (IL30LV-DNA) mBCSCs, that is, IL30mBCSCs. ANOVA, p<0.0001. *p<0.01, Tukey HSD test compared with wild-type (CTRL) and EVmBCSCs. (S) Western blot analysis of IL30 protein expression in CTRL, EV and IL30mBCSCs (IL30LV-DNA). (T) MTT assay of mBCSCs after 48 hours of treatment with rIL30 (50 ng/mL), and of IL30mBCSCs (IL30LV-DNA) with and without anti-IL30 Abs. ANOVA, p<0.0001. *p<0.01, Tukey HSD Test versus CTRL, EV, IL30LV-DNA and IL30LV-DNA + IL30 Abs. **p<0.01, Tukey HSD test versus CTRL, rIL30, EV and IL30LV-DNA + IL30 Abs. ***p<0.05, Tukey HSD test versus CTRL, rIL30, EV and IL30LV-DNA. (U) Sphere-forming assay, evaluated by ELDA, of mBCSCs after 15 days of culture with rIL30 (50 ng/mL), and of IL30mBCSCs (IL30LV-DNA) with and without anti-IL30 Abs. *p<0.05, χ2 test versus CTRL, EV and IL30LV-DNA + IL30 Abs. **p<0.05, χ2 test versus CTRL, EV and IL30LV-DNA + IL30 Abs. Experiments were performed in triplicate.

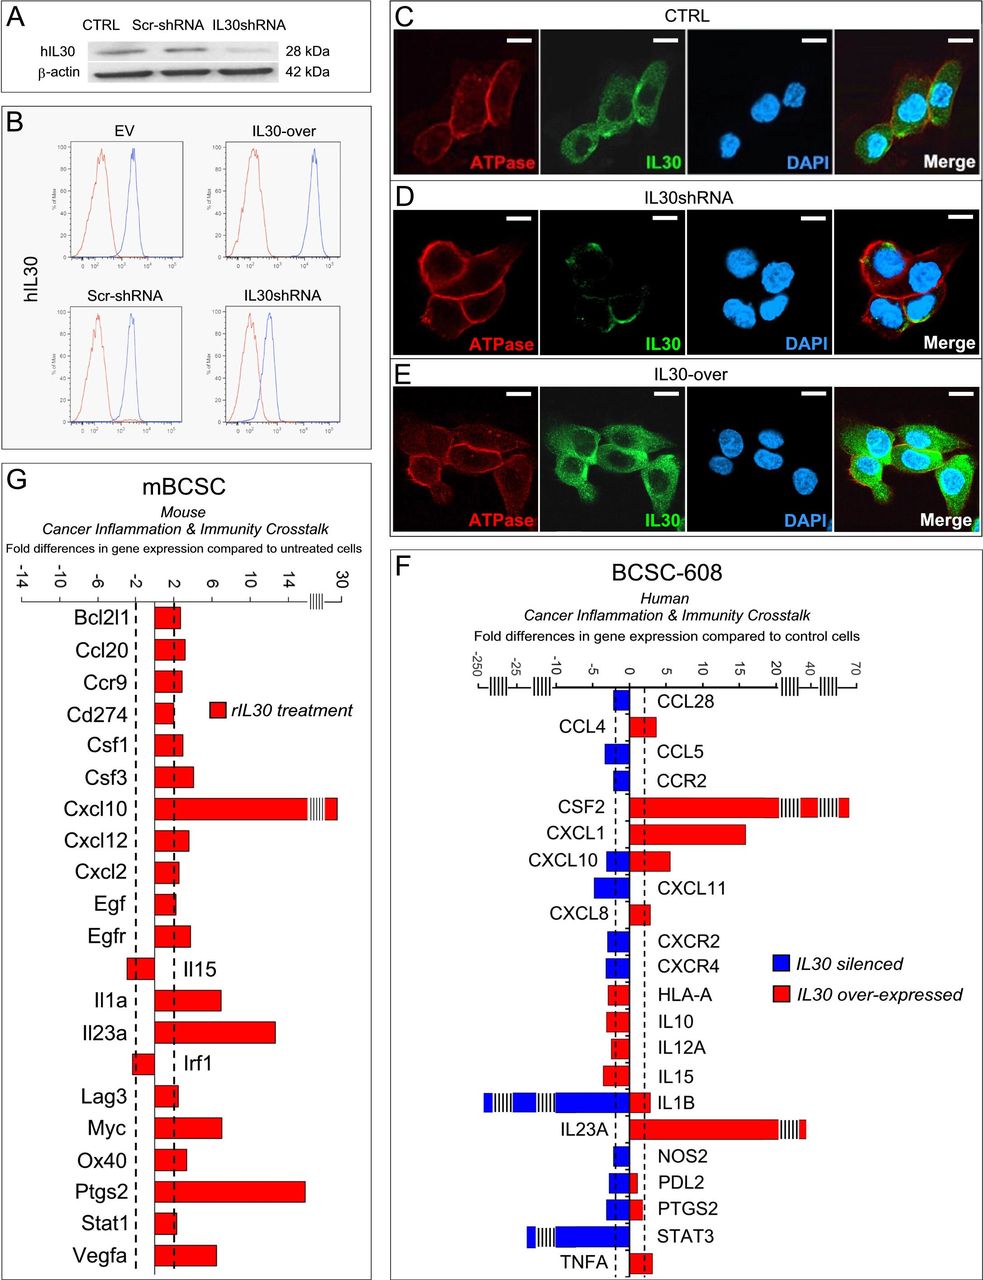
IL30-dependent regulation of the immunity gene expression in breast cancer stem cells (BCSCs). (A) Western blot analyses of IL30 protein expression in wild-type (CTRL), IL30shScrRNA and IL30shRNA transfected BCSC-608 cells. (B) Flow cytometric analysis of IL30 expression on the cell membrane of EV and IL30-over, ScrRNA and IL30shRNA transfected BCSC-608 cells. Results from untransfected BCSC-608 cells are comparable with those from EV and IL30shScrRNA transfected cells. (C–E) Confocal microscopy images of IL30 expression (green) that co-localizes with the red-stained Na+K+-ATPase in wild-type (CTRL) (C), IL30-silenced (shRNA) (D) and IL30-overexpressing (IL30-over) (E) BCSC-608. DAPI: DNA-stained nuclei. Magnification: ×400. Scale bars: 6 µm. (F) Fold differences of mRNAs of human inflammation and immunity-related genes between IL30shRNA-transfected and ScrRNA-transfected BCSC-608 (blue bars) and between IL30 gene-transfected and EV-transfected BCSC-608 (red bars). Results from ScrRNA-transfected and EV-transfected cells are comparable with those from untransfected wild-type cells. Pooled results±SD are from two experiments performed in duplicate. A significant threshold of 2-fold change in gene expression corresponded to p<0.001. (G) Fold differences of mRNAs of murine inflammation and immunity genes between Il30 gene-transfected and EV-transfected mBCSCs. Results from EV-transfected cells are comparable with those from untransfected wild-type cells. Pooled results±SD are from two experiments performed in duplicate. A significant threshold of 2-fold change in gene expression corresponded to p<0.001.
IL30 was undetectable, by ELISA, in the supernatant of hBCSCs. Unlike its murine counterpart, which is secreted as a soluble mediator, hIL30 (IL27p28 subunit, or IL27α) is not released, unless it heterodimerizes with a β-subunit (EBI3 or Cytokine-Like Factor 1) or a molecular mechanism, which affects protein folding, determines protein secretion.30
However, analysis of its peptide sequence, with PSIPRED (Department of Computer Science, University College of London; figure 1B,C), revealed the presence of a stretch of 16 residues toward the carboxy-terminus of the protein, made up of 75% hydrophobic amino acids, which is predictive of a single-pass type I transmembrane helix. Flow cytometry (figure 1D), WB analyses (which discriminated the cytoplasmic and plasma membrane protein fractions; see CTRL cells in figure 1E,F) and confocal microscopy (which showed IL30 co-localization with Na+K+-ATPase31 (figure 1G,H), demonstrated that IL30 localized in the plasma membrane of hBCSCs.
IL30 overexpression, via gene transfection, in both BCSC-608 and BCSC-105 (figure 1I,J), confirmed the localization of IL30 in the cell membrane (figure 1E,F) and significantly increased BCSC proliferation (ANOVA: p=0.03 and p=0.001, respectively; figure 1K,L). By contrast, the blockade of constitutively produced IL30, by specific neutralizing Abs, significantly decreased the proliferation (Student’s t-test, p=0.0006) (figure 1M,N) and mammosphere-forming capability of both hBCSCs (χ2 test, p<0.05) (figure 1O, P and Q), an effect that could not be ascribed to the blockade of IL27, since IL30 was undetectable in the supernatants.
Considering that IL30 was neither produced nor released by mBCSCs, as assessed by ELISA, we transfected them with the IL30 gene and generated a clone, namely IL30mBCSC (figure 1R,S), that released 20.25 ng/mL of IL30. Both IL30mBCSCs, and wild-type mBCSCs treated with rIL30 (50 ng/mL), showed a higher proliferation rate (ANOVA: p<0.0001; Tukey HSD test, p<0.01) (figure 1T) and mammosphere-forming efficiency (χ2 test, p<0.05) (figure 1U) when compared with EVmBCSCs and mBCSCs (CTRL), respectively. The addition of neutralizing anti-IL30 Abs to the culture medium of IL30-overexpressing mBCSCs consistently decreased both their proliferation (ANOVA: p<0.0001; Tukey HSD test, p<0.01) and mammosphere formation efficiency (χ2 test, p<0.05) (figure 1T,U).
Human “membrane-bound” and murine “secreted” IL30 shapes immunity gene expression profiles of BCSCs that share a strong upregulation of CXCL10 and IL23
To assess whether IL30 affects BCSC−host immunity interactions, we first analyzed the inflammation and immunity gene expression profile of BCSC-608, which among hBCSCs had the highest level of constitutive IL30 expression (figure 1D), after IL30 gene silencing and overexpression. Changes in the expression level of membrane-bound IL30, obtained by IL30 gene silencing and overexpression in hBCSC-608, were proved at the transcriptional (figure 1I) and protein level by WB (figures 1E and 2A), flow cytometry (figure 2B) and confocal analyses (figure 2C, D and E).
IL30-overproduction by hBCSCs stimulated their expression of cytokines and immune regulatory mediators (figure 2F), such as IL1B (2.87 times), TNFA (3.15 times) and, especially, of CSF2 (67.41 times) and IL23A (36.12 times), whereas the expression of HLA-A (−2.88 times), IL10 (−3.11 times), IL12A (−2.47 times) and IL15 (−3.57 times) were inhibited. hIL30 overproduction by hBCSCs also promoted the expression of genes coding for chemokines, such as CCL4 (3.69 times), CXCL1 (15.83 times), CXCL8 (2.86 times) and CXCL10 (5.57 times). By contrast, hIL30 silencing downregulated CXCL10 (−3.12 times), PTGS2 (−3.14 times) and IL1B (−241.7 times), together with chemokines and chemokine receptors, CCL5 (−3.34 times), CCL28 (−2.15 times), CXCL11 (−4.83 times), CCR2 (−2.21 times), CXCR2 (−3.01 times) and CXCR4 (−3.2 times). Expression of NOS2 (−2.15 times), PDL2 (−2.76 times) and, primarily, STAT3 (−21.41 times) was also downregulated in hBCSCs by hIL30 silencing.
Assessment of the most highly upregulated mediators, specifically CSF2 and CXCL1, in the supernatant of IL30-overexpressing BCSC-608 confirmed their substantial increase at the protein level (CSF2: 20.57±0.56 pg/mL in IL30-over, versus 8.62±1.73 pg/mL in EV, and 8.46±0.70 pg/mL in CTRL cells. ANOVA: p<0.0001; Tukey HSD test: p<0.01 versus both EV and CTRL cells) (CXCL1: 8.41±1.26 pg/mL in IL30-over, versus 3.91±1.57 pg/mL in EV, and 3.33±1.40 pg/mL in CTRL cells. ANOVA: p=0.009; Tukey HSD test: p<0.05 versus both EV and CTRL cells).
To compare the response of hBCSCs to IL30 with that of its murine counterpart, which will be useful in vivo in the immunocompetent model, the immunity gene expression profile was also analysed in mBCSCs after rIL30 treatment (figure 2G).
In mBCSCs, rIL30 upregulated Stat1 (2.31 times), Bcl-2-like protein 1 (Bcl2l1) (2.69 times) and Myc (7.04 times), and boosted the expression of a set of genes coding for growth factors, such as Csf1 (2.93 times), Csf3 (4.04 times), Vegfa (6.50 times), Egf (2.21 times), Egfr (3.78 times) and inflammatory mediators, such as Il1a (6.94 times) and, especially, Il23a (12.68 times) and Ptgs2 (15.78 times), whereas Il15 and Irf1 were downregulated (−2.90 and −2.38 times, respectively).
Recombinant IL30 also stimulated mBCSC expression of chemokines and their receptors, such as Ccr9 (2.89 times), Ccl20 (3.22 times), Cxcl2 (2.54 times), Cxcl12 (3.56 times) and particularly Cxcl10 (27.47 times), along with expression of immune checkpoint molecules Cd274/Pd-l1 (2.02 times), Lag3 (2.46 times) and Ox40 (3.33 times).
Comparative analysis of human and murine IL30-driven transcriptional profiles revealed a common and substantial upregulation of CXCL10 and IL23A, which prompted us to assess their role in IL30-dependent regulation of BCSC viability.
CXCL10 and IL23 autocrine loops mediate IL30-dependent proliferation of BCSCs
IL30-induced upregulation of CXCL10 and IL23 in human and murine BCSCs, led us to investigate their production and functional consequences.
The treatment of mBCSC cells with rIL30 (50 ng/mL, 48 hours) stimulated the production and release of CXCL10 (105.90±11.20 pg/mL versus 69.60±5.73 pg/mL in untreated cells; Student’s t-test: p=0.02). At concentrations ranging from 30 to 150 ng/mL, CXCL10 significantly increased the proliferation of both mBCSCs (ANOVA: p<0.0001; Tukey HSD test: p<0.05) (figure 3A) and mBC cell line E0771 (ANOVA: p<0.0001; Tukey HSD test: p<0.01) (figure 3B), a TN cell line isolated from a mammary tumor developed in a female mouse with the identical genetic background of mBCSCs. Both cell lines expressed the CXCL10 receptor, CXCR3 (figure 3C).

IL30-dependent regulation of breast cancer stem cell (BCSC) viability. (A) MTT assay of mBCSCs after 48 hours treatment with rCXCL10 at concentrations of 30, 50, 100 and 150 ng/mL. ANOVA: p=0.00001. *p<0.05, Tukey HSD test compared with 0 ng/mL. (B) MTT assay of mBC cells after 48 hours of treatment with rCXCL10 at concentrations of 30, 50, 100 and 150 ng/mL. ANOVA: p=0.00006. *p<0.01, Tukey HSD test compared with 0 ng/mL. (C) Cytofluorimetric analyses of CXCR3 expression in mBCSCs and mBC cells. Red lines: isotype control. Blue lines: specific Abs. Experiments were performed in triplicate. (D) MTT assay of mBCSCs 48 hours after the treatment with rmIL30 (50 ng/mL), with or without anti-CXCL10 Abs (40 µg/mL), or with IL30sup, with or without anti-CXCL10 Abs (40 µg/mL). ANOVA: p<0.0001. *p<0.01, Tukey HSD test compared with CTRL, rmIL30 + anti-CXCL10 Abs and IL30sup. **p<0.01, Tukey HSD test compared with CTRL, rmIL30, rmIL30 + anti-CXCL10 Abs and IL30sup + anti-CXCL10 Abs. ***p<0.01, Tukey HSD test compared with CTRL. (E) Cytofluorimetric analyses of IL23R expression in mBCSCs and mBC cells. Red lines: isotype control. Blue lines: specific Abs. Experiments were performed in triplicate. (F) Cytofluorimetric analyses of CXCR3 expression in hBCSCs. Red lines: isotype control. Blue lines: specific Abs. Experiments were performed in triplicate. (G) Expression of CXCR3 isoforms in hBCSCs, as determined by RT-PCR. CXCR3A: 111 bp; CXCR3B: 79 bp; CXCR3-alt: 135 bp. (H, I) Relative expression±SD of mRNA of the three CXCR3 isoforms in BCSC-608 (H) and in BCSC-105 (I). (J) Cytofluorimetric analyses of IL23R expression in hBCSCs. Red line: isotype control. Blue lines: specific Abs. Experiments were performed in triplicate. (K) MTT assay of BCSC-608 after 48 hours of treatment with rCXCL10 at concentration of 5–100 ng/mL. ANOVA: p=0.00001. *p<0.01, Tukey HSD test compared with 0 ng/mL. (L) MTT assay of BCSC-105 after 48 hours of treatment with rCXCL10 at concentrations of 5–100 ng/mL. ANOVA: p=0.00002. *p<0.01, Tukey HSD test compared with 0 ng/mL. (M) MTT assay of BCSC-608 after 48 hours of treatment with rIL23 at concentrations of 5–100 ng/mL. ANOVA: p=0.0000002. *p<0.01, Tukey HSD test compared with 0 ng/mL. (N) MTT assay of BCSC-105 after 48 hours of treatment with rhIL23 at concentrations of 5–100 ng/mL. ANOVA: p=0.0028. *p<0.05, Tukey HSD test compared with 0 ng/mL. (O, P) Sphere-forming capacity, evaluated by ELDA, of (O) BCSC-608 (*p<0.0001, χ2 test versus CTRL) and (P) BCSC-105 (*p=0.0029, χ2 test versus CTRL) cells, after 8 days of treatment with 50 ng/mL of rCXCL10. (Q, R) Sphere-forming capacity, evaluated by ELDA, of (Q) BCSC-608 (*p<0.0001, χ2 test versus CTRL) and (R) BCSC-105 (*p=0.0044, χ2 test versus CTRL) cells, after 8 days of treatment with 50 ng/mL (BCSC-608) or 10 ng/mL (BCSC-105) of rIL23.
The increased proliferation of mBCSCs induced by rIL30 or the supernatant obtained from IL30mBCSCs (IL30sup) was significantly inhibited, although not abolished, by the addition of anti-CXCL10 Abs (ANOVA: p<0.0001; Tukey HSD test: p<0.05) (figure 3D), which strongly suggests the existence of an autocrine loop triggered by IL30-induced CXCL10.
Treatment of mBCSCs with rIL30 (50 ng/mL) also stimulated the production and release of IL23 (75.10±13.71 pg/mL versus 53.26±6.19 pg/mL in untreated cells; Student’s t-test p=0.04). However, although both mBCSCs and mBC cells expressed the IL12Rβ1 (online supplemental figure S3), neither cell lines expressed the IL23R (figure 3E),32 which indicates that, at least in the mouse model, only paracrine effects can be expected by IL30-induced IL23.
CXCR3, specifically the isoforms CXCR3-A and CXCR3-B (figure 3F,G,H,I), and IL23R (figure 3J) were expressed by hBCSCs, and the treatment with rCXCL10 or rIL23 (5–100 ng/mL) significantly increased both their proliferation (ANOVA: p<0.01) (figure 3K, L, M and N) and their mammosphere formation efficiency (rCXCL10 treated BCSC-608, p<0.0001, χ2 test versus CTRL; rCXCL10 treated BCSC-105, p=0.0029, χ2 test versus CTRL; rIL23 treated BCSC-608, p<0.0001, χ2 test versus CTRL; rIL23 treated BCSC-105, p=0.0044, χ2 test versus CTRL) (figure 3O, P, Q and R).
ELISA revealed that both BCSC-608 and BCSC-105 constitutively released CXCL10 (23.86±1.31 pg/mL and 4411.40±62.98 pg/mL, respectively), but not IL23.
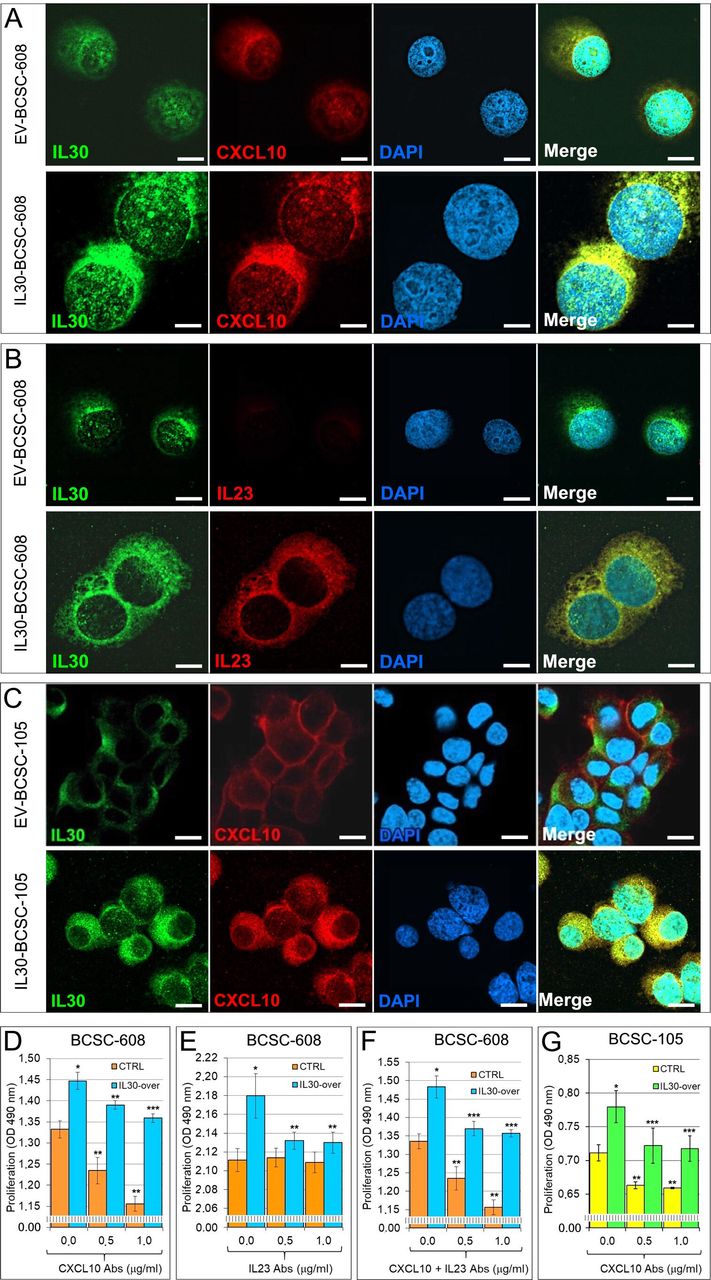
IL30 overexpression by IL30 gene transfected BCSC-608 dramatically increased the production (figure 4A) and release of CXCL10 (IL30-over: 28.64±0.53 pg/mL, versus EV: 23.41±0.60 pg/mL, and CTRL cells: 23.86±1.31 pg/mL; ANOVA: p=0.0006; Tukey HSD test: p<0.01 versus both EV and CTRL cells) and induced the production (figure 4B) and release of IL23 (IL30-over: 8.89±1.28 pg/mL, versus EV and CTRL cells: 0.00 pg/mL).

IL30-dependent production of CXCL10 and IL23 in breast cancer stem cells (BCSCs) and related autocrine loops. (A) Confocal microscopy images of IL30 (green) and CXCL10 (red) in EV and IL30 gene transfected BCSC-608 cells. DAPI: DNA-stained nuclei. Magnification EV-BCSC-608: ×630; IL30-BCSC-608: ×1000. Scale bars EV-BCSC-608: 6 µm; IL30-BCSC-608: 3 µm. (B) Confocal microscopy images of IL30 (green) and IL23 (red) in EV and IL30 gene transfected BCSC-608 cells. DAPI: DNA-stained nuclei. Magnification EV-BCSC-608: ×630; IL30-BCSC-608: ×1000. Scale bars EV-BCSC-608: 6 µm; IL30-BCSC-608: 3 µm. (C) Confocal microscopy images of IL30 (green) and CXCL10 (red) in EV and IL30 gene transfected BCSC-105 cells. DAPI: DNA-stained nuclei. Magnification: ×630. Scale bars: 6 µm. (D) MTT assay of IL30-overexpressing (light blue bars) or wild-type (CTRL, orange bars) BCSC-608 cells, treated with different concentrations of anti-CXCL10 Abs. ANOVA: p<0.0001. *p<0.01, Tukey HSD test compared with untreated CTRL cells. **p<0.05 Tukey HSD test compared with untreated CTRL and IL30-overexpressing cells. ***p<0.01 Tukey HSD test compared with untreated IL30-overexpressing cells. Results obtained from EV-transfected cells were comparable with those from CTRL cells. (E) MTT assay of IL30-overexpressing (light blue bars) or wild-type (CTRL, orange bars) BCSC-608 cells, treated with different concentrations of anti-IL23 Abs. ANOVA: p<0.01. *p<0.01, Tukey HSD test compared with untreated CTRL cells. **p<0.05 Tukey HSD test compared with untreated IL30-overexpressing cells. Results obtained from EV-transfected cells were comparable with those from CTRL cells. (F) MTT assay of IL30-overexpressing (light blue bars) or wild-type (CTRL, orange bars) BCSC-608 cells, treated with different concentrations of anti-CXCL10 and anti-IL23 Abs. ANOVA: p<0.0001. *p<0.01, Tukey HSD test compared with untreated CTRL cells. **p<0.01 Tukey HSD test compared with untreated CTRL and IL30-overexpressing cells. ***p<0.01 Tukey HSD test compared with untreated IL30-overexpressing cells. Results obtained from EV-transfected cells were comparable with those from CTRL cells. (G) MTT assay of IL30-overexpressing (light green bars) or wild-type (CTRL, yellow bars) BCSC-105 cells, treated with different concentrations of anti-CXCL10 Abs. ANOVA: p<0.0001. *p<0.01, Tukey HSD test compared with untreated CTRL cells. **p<0.05 Tukey HSD test compared with untreated CTRL and IL30-overexpressing cells. ***p<0.05 Tukey HSD test compared with untreated IL30-overexpressing cells. Results obtained from EV-transfected cells were comparable with those from CTRL cells.
IL30 overexpression by IL30 gene transfected BCSC-105 also increased the production (figure 4C) and release of CXCL10 (IL30-over: 4738.63±15.75 pg/mL, versus EV: 4406.82±68.30 pg/mL, and CTRL cells: 4411.40±62.98 pg/mL; ANOVA: p=0.0004; Tukey HSD test: p<0.01 versus both EV and CTRL), while IL23 was undetectable (online supplemental figure S4).
The addition of neutralizing anti-CXCL10 Abs (0.5–1.0 µg/mL) or anti-IL23 Abs (0.5–1.0 µg/mL) to the culture medium of IL30-overexpressing BCSC-608 significantly (ANOVA: p<0.001) inhibited IL30-dependent cell proliferation (figure 4D,E). At a concentration of 0.5 µg/mL, the anti-CXCL10 Abs reduced, but did not abolished, the proliferative effect induced by IL30 overexpression, and the combination with anti-IL23 Abs brought the proliferation back to CTRL levels. (figure 4F).
As observed in wild-type BCSC-608 (figure 4D), neutralizing anti-CXCL10 Abs (0.5–1.0 µg/mL) decreased the proliferation of wild-type BCSC-105, since they constitutively released the chemokine, and significantly (ANOVA: p<0.0001) suppressed the proliferation of IL30-overexpressing BCSC-105 (figure 4G), thus strengthening the role of the CXCL10-triggered autocrine loop in mediating IL30-induced BCSC proliferation.
IL30 overproduction by BCSCs boosts tumor growth and reduces survival in association with tumor production of CXCL10 and IL23 and infiltration by MDC, Tregs and ILC3
The effect of IL30 overexpression by BCSCs on tumor onset and progression was investigated after orthotopic implantation of IL30mBCSCs and control clones (1×10⁴ cells) in syngeneic C57BL/6 female mice. Fifteen days after their implantation, IL30mBCSCs gave rise to tumors, which grew and reached, 48 days later, a mean tumor volume (MTV) significantly higher than control tumors (MTV of IL30mBCSC tumors: 671.66±158.95 mm3; MTV of EVmBCSC tumors: 160.31±56.34 mm3; MTV of mBCSC tumors: 164.50±58.90 mm3; ANOVA: p<0.0001; Tukey HSD test: p<0.01; figure 5A).

Growth rate and immune contexture of tumors developed after orthotopic implantation of IL30-overexpressing mBCSCs in syngeneic host. (A) Mean volume of tumors developed after orthotopic implantation of IL30mBCSCs, EVmBCSCs or wild-type mBCSCs. ANOVA, p<0.0001; Tukey HSD test, p<0.01 versus both controls. (B) Kaplan-Meier survival curves of mice bearing tumors developed after orthotopic implantation of IL30mBCSCs, EVmBCSCs or mBCSCs. Log-rank test: p=0.000024. (C) H&E-stained sections (a, b) and immunopathological features (c–l) of tumors developed after orthotopic implantation of EVmBCSCs or IL30mBCSCs in syngeneic mice. Histology and immunopathology of tumors induced by mBCSCs were comparable with those induced by EVmBCSCs. Magnification: ×400. Scale bars: 20 µm. (D) Expression of MYC and KLF4 in tumors induced by EV (a, c) and Il30 gene transfected (b, d) mBCSCs. Magnification: ×400. Scale bars: 20 µm. (E) Fold differences of mRNAs of stemness-related genes between IL30mBCSCs and EVmBCSCs. Results obtained from EVmBCSCs are comparable with those from wild-type CTRL cells. Pooled results±SD are from two experiments performed in duplicate. A significant threshold of 2-fold change in gene expression corresponded to p<0.001. (F) Automated immune cell count in tumors developed after implantation of IL30mBCSCs, EVmBCSCs (EV) or mBCSCs (CTRL) in syngeneic mice, assessed by immunohistochemistry, as described in Methods section. ANOVA: p<0.001. *p<0.01, Tukey HSD test compared with EV and CTRL. (G) Immune cell contexture of tumors developed after orthotopic implantation of IL30mBCSCs reveals a greater content of F4/80+ macrophages (a, b), CD11b+ cells (c, d; red stained in the inset) mostly co-expressing Gr-1 (brown stained in the inset), Ly-6G+ granulocytes (e, f) and Foxp3+ Tregs (g, h) than control tumors. Magnification: ×400; inset in d: ×630. Scale bars: 20 µm; inset in d: 10 µm. (H) Double staining with anti-RORγt (brown) and anti-NKp46 (red) Abs revealed that, unlike control tumors (a), tumors induced by IL30mBCSCs (b) were heavily infiltrated by NKp46+ cells endowed with RORγt+ nuclei, indicative of ILC3. Intratumoral expression of IL22 (c, d) and IL17 (e, f) was localized in the areas infiltrated by ILC3. Magnification: ×400. Scale bars: 20 µm.
The survival of mice bearing IL30-overexpressing tumors was significantly lower (log-rank test: p<0.0001) than that of control tumor-bearing mice (figure 5B). Both EV-derived and mBCSC-derived tumors recapitulated the histologic and immunophenotypic features (E-cadherin+, CK8+, CK14+, ER− and PR−, HER2low) of the BC from which the cells were isolated (online supplemental figure S5).21 33 By contrast, tumors developed after implantation of IL30mBCSCs were poorly differentiated (figure 5C a,b), and expressed IL30 (figure 5C, c,d) and stemness genes, especially Myc (which is upregulated by IL30, both in vitro, figure 2G, and in vivo, figure 5D, a,b; IL30mBCSC tumors, 81.56%±7.38%; EVmBCSC tumors, 49.20%±7.15%; mBCSC tumors, 46.6%±4.55%; ANOVA: p<0.0001; Tukey HSD test: p<0.01, IL30mBCSC tumors versus EVmBCSC and mBCSC tumors) and Klf4 (figure 5D c,d; IL30mBCSC tumors, 76.33%±6.67%; EVmBCSC tumors, 53.67%±8.49%; mBCSC tumors, 51.89%±3.52%; ANOVA: p<0.001; Tukey HSD test: p<0.01, IL30mBCSC tumors versus EVmBCSC and mBCSC tumors; figure 5E; 10.32 times upregulation of Klf4 in vitro), which, along with Snai2 (2.48 times), Zeb1 (3.61 times) and Zeb2 (3.01 times), were upregulated also in mBCSCs treated with rIL30 (figure 5E). IL30-overexpressing tumors were highly proliferating (IL30mBCSC tumors, 83.00%±6.56%; EVmBCSC tumors, 48.78%±4.84%; mBCSC tumors, 49.00%±3.20%; ANOVA: p<0.0001; Tukey HSD test: p<0.01, IL30mBCSC tumors versus EVmBCSC and mBCSC tumors) and well vascularized (MVD: IL30mBCSC tumors, 14.13±2.64; EVmBCSC tumors, 7.11±1.76; mBCSC tumors, 6.44±1.51; ANOVA: p<0.0001; Tukey HSD test: p<0.01, IL30mBCSC tumors versus EVmBCSC and mBCSC tumors; figure 5C, e–h). Genes that were the most upregulated by IL30 in BCSCs, including Cxcl10 and IL23, were strongly expressed also by IL30-overexpressing tumors (figure 5C, i–l), which were heavily infiltrated by F4/80+ macrophages, CD11b+Gr-1+ myeloid derived cells (MDC), Ly-6G+ granulocytes, Foxp3+ T regulatory (Tregs) cells and NKp46+RORγt+ type 3 innate lymphoid cells (ILC3) (figure 5F,G). This immune cell population mostly co-localised with intratumoral expression of IL22 and IL17 (figure 5H).
IL30 overproduction by BCSCs promotes their survival in the bloodstream and seeding in the lung, increasing the incidence of metastases, which recapitulate the immune contexture of the primary tumors
The most common sites of metastasis for BC are the bones and lungs.34 IL30 has proven to boost tumor progression4 12 18 and this article and to favor bone marrow and lung colonization.4 In the present model of BCSCs, in which the lung is the main site of metastasis,19 to investigate the effects of IL30 on the different metastatic phases, we compared spontaneous versus experimental metastasis.
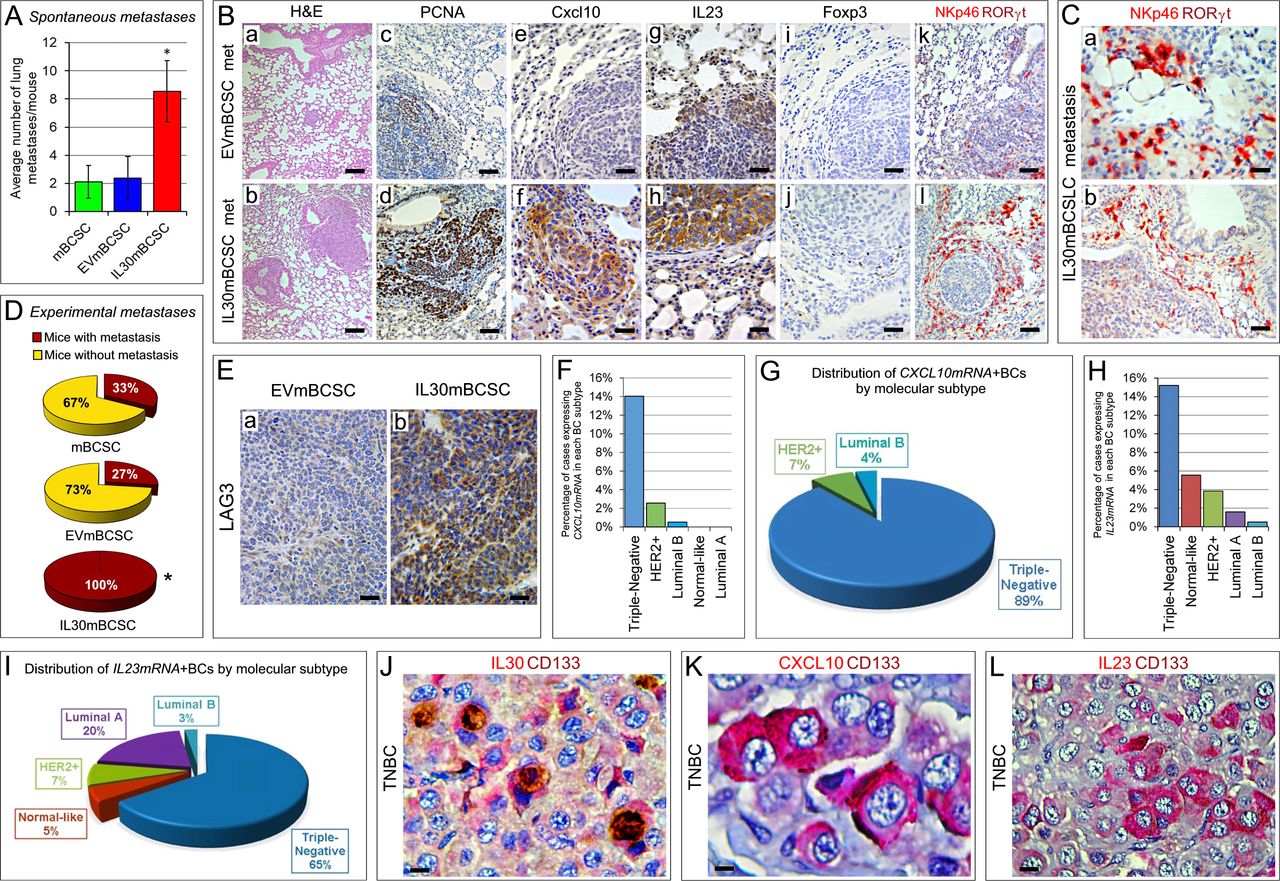
Although the number of mice which developed metastases was not significantly different between mice bearing EV, or wild-type, tumors and mice bearing IL30-overexpressing tumors (18/30 versus 24/30), the latter developed an average number of lung metastases (mets) that was significantly higher than in control tumor-bearing mice (average number of 9 mets/mouse developed from IL30mBCSC tumors versus 2 mets/mouse from mBCSC and EVmBCSC tumors; ANOVA: p<0.0001; Tukey HSD test: p<0.01; figure 6A). The number of metastases per mouse did not correlate with the tumor size, as determined by Pearson’s correlation coefficient (r=0.0137).

Immune microenvironment of lung metastasis induced by IL30-overexpressing mBCSCs and expression of IL30-induced secondary mediators, CXCL10 and IL23, in human breast cancers (BCs). (A) Average number of lung metastasis per mouse spontaneously developed from tumors induced by IL30mBCSCs, EVmBCSCs or wild-type mBCSCs. ANOVA: p<0.0001; Tukey HSD test: p<0.01 versus both controls. (B) Histopathological features and immune contexture of lung metastasis spontaneously developed from tumors induced by IL30mBCSC and EVmBCSC implantation in syngeneic mice. Magnification: a, b, k, l, ×200; c–j: ×400. Scale bars a, b, k, l: 30 µm; c–j: 20 µm. (C) In lung metastasis developed from IL30-overexpressing tumors, ILC3 infiltrate extends under the pleura (a, detail of figure B, l) and bronchial mucosa (b). Magnification a: ×630; b: ×200. Scale bars a: 10 µm; B: 30 µm. (D) Percentage of mice which developed lung metastasis 40 days after intravenous injection of IL30mBCSCs, EVmBCSCs or mBCSCs. *Fisher’s exact test, p<0.0001 versus both controls. (E) Immunohistochemical analysis of LAG3 expression in tumors developed after orthotopic implantation of EV-mBCSCs (a) and IL30mBCSCs (b) in syngeneic mice. Magnification: ×400. Scale bars: 20 µm. (F) CXCL10mRNA expression in human BC subtypes from the PanCancer cohort. The histogram represents the percentage of CXCL10mRNA overexpressing cases (Z-score >2) out of the total number of cases for each BC subtype. (G) Distribution of CXCL10+ BCs by molecular subtypes, represented as percentage of the total number of BC expressing CXCL10mRNA. (H) IL23mRNA expression in human BC subtypes from the PanCancer cohort. The histogram represents the percentage of IL23 overexpressing cases (Z-score >2) out of the total number of cases for each BC subtype. (I) Distribution of IL23+ BCs by molecular subtypes, represented as percentage of the total number of BC expressing IL23mRNA. (J) Double immunostaining of TNBC tissues showing IL30 (red) co-localization with CD133+ (brown) cancer cells. Magnification: ×630. Scale bar: 10 µm. (K) Double immunostaining of TNBC tissues showing CXCL10 (red) co-localization with CD133+ (brown) cancer cells. Magnification: ×1000. Scale bar: 6 µm. (L) Double immunostaining of TNBC tissues showing IL23 (red) co-localization with CD133+ (brown) cancer cells. Magnification: ×630. Scale bar: 10 µm.
Inflammatory microenvironment and immune contexture of lung metastasis (figure 6B, a,b) were consistent with the immunopathologic features of the primary tumors. Indeed, metastasis which developed from IL30-overexpressing tumors showed higher proliferation index (mean percentage±SD of PCNA-positive cells/number of total cells per field: IL30mBCSC tumors, 77.33%±7.99%) than metastasis from control tumors (EVmBCSC tumors, 36.75%±6.30%; mBCSC tumors, 37.25%±7.92%; ANOVA: p<0.0001; Tukey HSD test: p<0.01 versus both controls) (figure 6B, c,d) and a prominent expression of CXCL10 and IL23 (figure 6B, e–h). Metastases developed from IL30-overexpressing tumors were heavily infiltrated by macrophages (11.57±3.69 versus EVmBCSC, 3.00±1.26, and mBCSC, 3.83±1.47), Foxp3+ Tregs (9.44±3.28 versus EVmBCSC: 2.11±1.17 and mBCSC: 3.00±1.41) (figure 6B, i,j) and NKp46+RORγt+ ILC3 (12.67±4.18 versus EVmBCSC, 3.70±1.42, and mBCSC, 4.10±2.13) (ANOVA: p<0.0001; Tukey HSD test: p<0.01 versus both controls) (figure 6B, k,l, and magnification in figure 6C a), which expanded under the pleura, and bronchial mucosa (figure 6C, b). Experimental metastasis experiments revealed that 100% (30/30) of mice intravenously injected with IL30mBCSCs developed lung metastasis (average number of 1.7 metastasis/mouse) versus only 27% (8/30) of mice injected with EVmBCSCs, and 33% (10/30) of mice injected with mBCSCs (average number of 1.5 metastasis/mouse) (Fisher’s exact test, p<0.0001; figure 6D). The immunopathological characteristics were comparable with those found in spontaneous metastases. These findings suggest that IL30 produced by BCSCs supports their survival in the bloodstream and favors their extravasation and proliferation in the lungs.
Expression of IL30 in clinical BC samples correlates with that of CXCL10 and IL23, which are prevalent in TNBC
To evaluate whether the induction of CXCL10 and IL23, by IL30, in BCSCs may have clinical–pathological implications, we analysed RNA-sequencing data of tumor samples obtained from 1084 patients with BC, included in the “Breast Invasive Carcinoma TCGA PanCancer collection” published by the Cancer Genome ATLAS (TCGA) Consortium27 Bioinformatics revealed that expression of IL30mRNA was associated with Triple-Negative BC,18 the subtype with the highest CD133+ stem cell content.19 35
Since TNBC is the most represented BC subtype (26 out of 75 cases) in the database developed by Waddell et al,36 included in the Oncomine Platform (https://www.oncomine.org), we performed an outlier analysis of gene expression data from this sample collection, using the Cancer Outlier Profile Analysis (COPA) algorithm, which revealed that IL30 expression ranked beyond the 95th percentile and, therefore, it was in the top 5% (COPA score=16.727) of the most expressed genes.
Profiling of tumor infiltrating immune cells, by using CIBERSORTx computational method (http://cibersort.stanford.edu/), revealed that the median percentage of both naïve and memory resting CD4+ T cells, γδ T cells and resting dendritic cells (DCs) was significantly lower in IL30 highly expressing (IL30high) BC samples (calculated after the exclusion of cases that also overexpressed EBI3, Z-score ≥1, to avoid effects due to IL27) versus IL30 low expressing (IL30low) BCs (online supplemental table S6). Profiling of immune exhaustion markers, which include immune checkpoint molecules (online supplemental table S7), performed to test the functional status of tumor-infiltrating immune cells, revealed a significantly higher expression of LAG3 in M1 macrophages infiltrating IL30high BCs (1.67-fold), compared with the corresponding cell population in IL30low BCs (Student’s t-test: p=0.0121). This finding is consistent with the upregulation of LAG3 by IL30 treatment in mBCSCs (figure 2G) and mTNBC cells,18 and with its production, by cancer and infiltrating immune cells in IL30-overexpressing murine tumors (figure 6E, a,b).
Analysis of gene expression profiles, provided by the PanCancer dataset, also revealed a significant association between the expression of CXCL10mRNA and TNBC (Fisher’s exact test, p<0.05 versus HER2+, Normal-like, Luminal A and Luminal B) (figure 6F). CXCL10mRNA expression was detected in 89% of TN, 7% of HER2+ and 4% of Luminal B (figure 6G). A significant association was also found between the expression of IL23AmRNA and TNBC (Fisher’s exact test, p<0.01 versus HER2+, Luminal A and Luminal B) (figure 6H). IL23AmRNA expression involved 65% of TN, 7% of HER2+, 20% of Luminal A, 5% of Normal-like, and 3% of Luminal B (figure 6I).
Bioinformatic analyses revealed a positive correlation, by Spearman’s rank correlation coefficient, between the expression of IL30 and that of CXCL10 (ρ=0.493), and IL23A (ρ=0.313). Furthermore, the expression of CXCL10 was positively correlated to that of IL23A (ρ=0.421). Immunostaining confirms, in TNBC samples, the production of IL30 in CD133+ BCSCs (figure 6J) and the frequent co-expression of CXCL10 (58.34%±4.62%, mean±SD of CXCL10-positive cells/total number of CD133+IL30+ cells per field) and IL23 (51.28%±8.22%, mean±SD of IL23-positive cells/total number of CD133+IL30+ cells per field) (Student’s t-test: p<0.00001) (figure 6K,L, and online supplemental table S8), thereby supporting the finding of the role of IL30-driven cytokine circuits in BCSC behavior.
Discussion
Despite therapeutic advancements, BC remains a dreadful disease, estimated to cause 655,690 deaths worldwide this year.1 Leading causes of BC‐related deaths are tumor recurrence and metastasis, which are driven by self-renewing and multipotent BCSCs, highly resistant to current therapies.2 3 The balance between quiescence, proliferation and differentiation of CSCs is regulated by paracrine, autocrine and contact-dependent signals.37 Here, we provide evidence that IL30 affects directly, and via second-level mediators, BCSC behavior and immune contexture. Cancer SCs isolated from human BCs are unable to release IL30 or IL27, but constitutively express IL30 as a membrane-anchored glycoprotein and alteration of its expression levels, by enforced overexpression or silencing, dramatically increases, or inhibits, respectively, their viability and self-renewal efficiency, and subverts their immunity gene expression profile. The lack of IL30 in the supernatant of hIL30 gene transfected hBCSCs is consistent with data reported by Pflanz and coworkers,6 who failed to detect hIL30 protein in the supernatant of hHEK293 cells, after transfection with hp28, whereas transfection with the murine counterpart resulted in protein secretion.
Since alteration of IL30 protein levels, by gene transfection, localized neither in the cytoplasm nor in the supernatant, but in the plasma membrane, the functional outcomes are likely due to juxtacrine signals activated by a membrane-bound bioactive IL30. The blockade of these contact-dependent signals, by anti-IL30 neutralizing Abs, hinders proliferation and self-renewal of hBCSCs, suggesting IL30’s ability to control the maintenance and expansion of the CSC compartment. Therefore, IL30 enters the group of human membrane-anchored cytokines, which includes IL1α,38 IL15,39 M-CSF,40 Flt3 ligand,41 TNFα,42 LTα,43 Fractalkine/CX3CL1,44 TGFβ45 and IFNγ,46 that have demonstrated biological effects via the juxtacrine route, under physiological conditions. Signaling through cell–cell contact, IL30 overexpressed by hBCSCs triggers a storm of inflammatory mediators, including IL1β, TNFα, CCL4, CXCL8, CXCL10 and, especially, CSF2/GM-CSF, CXCL1, IL23A and CXCL10. By contrast, silencing of the IL30 gene downregulates tumor-promoting factors, such as CCL28, CCL5, CCR2, CXCR2, CXCR4, NOS2, PDL2, PTGS2 and, especially, IL1β and STAT3, which is functional to IL30 signaling in TNBC cells.15 TNBC has the highest BCSC content19 and the most frequent expression of IL30.15 Targeting IL30 in the host environment has proven effective against TNBC progression.18 Analyses of TNBCs developed in IL30 knocked out mice after implantation of IL30 responsive or unresponsive (ie, with or without IL30R) TNBC cells provided an opportunity to analyze the effects of IL30 on the tumor immune contexture.5 18 Regardless of the induction of CXCL10, IL23 or other mediators in tumor cells, endogenous IL30 prevents the intratumoral recruitment of CD8+ T, CD4+ T and NKp46+ cells, along with IFNγ production, and favors the influx of immunosuppressive IDO+ MDCs, macrophages and Tregs. By contrast, the lack of endogenous IL30 prevents the expansion of IL10+CD4+CD25+Foxp3+ Tregs, during tumor growth, whereas it favors intratumoral T-cell infiltration, mainly of CD4+ T lymphocytes, and cytotoxic functions. These data could explain why, despite IL30 induces in tumor cells CXCL10, which has been reported to recruit activated CXCR3+ Th1 cells,47 IL30-overexpressing tumors lack enrichment in T lymphocytes.
Unlike the human counterpart, mIL30 is efficiently released by Il30 gene transfected mBCSCs, as a soluble mediator. Similarly to the human cytokine, mIL30 promotes the proliferation and self-renewal of mBCSCs, and fosters their expression of oncogenes Bcl2l1 and Myc, and a range of immune regulatory factors, such as Ccl20, Csf3, Cxcl12 and, particularly, Ptgs2, Vegfa, Cxcl10 and Il23, most of which are also induced by IL30 in murine and human TNBC cells.15 18
Human and murine IL30-associated immune gene signatures share a substantial upregulation of CXCL10 and IL23. Both molecules are secreted by BCSCs in response to IL30 and mediate most of the IL30-dependent proliferation and self-renewal, which are suppressed by their selective blockade, suggesting novel autocrine loops that foster CSCs and can be disrupted by targeting IL30 signaling. In hBCSCs, IL30 overexpression also promotes the release of CSF2 and CXCL1. Despite being used for its immune adjuvant function,48 when produced by BC, CSF2 has revealed immunosuppressive and tumor-promoting effects, and positive correlation with a worst clinical outcome.49 50 CXCL1 has been recently demonstrated to sustain proliferation and self-renewal of BCSCs, and to regulate their transcriptional profile, by promoting tumor progression and immune escape programs.51
Orthotopic implantation, in immune-competent host, of BCSCs engineered to release IL30 provides novel insight into the tumor-promoting functions of this cytokine. IL30 overexpression by mBCSCs accelerates tumor growth and reduces host survival, in association with an increased cancer proliferation, vascularization and expression of stemness genes, including MYC and KLF4, which play a key role in the maintenance of BCSCs.16 52 CXCL10 and IL23 were produced by IL30-overexpressing tumors, which were heavily infiltrated by macrophages, MDCs, granulocytes, Tregs and ILC3. In addition to CXCL10 and IL23, a wide range of IL30-induced pro-inflammatory factors could account for this immune cell context, in particular, CSF3/G-CSF, IL1α, VEGF and PTGS2, which are the most upregulated.
G-CSF can modulate the tumor microenvironment, by promoting angiogenesis and granulocyte, macrophage and MDSC recruitment.53 IL1α recruits neutrophils,54 favors angiogenesis,55 and promotes the expansion of BCSCs and metastasis.56 57 Tumor hyperproduction of VEGFA fosters endothelial cell proliferation and vascular leakage favoring leukocyte extravasation, but also inhibits functional maturation of DC58 and promotes immature myeloid cell recruitment.58
High levels of COX2 and PGE2 by tumor cells directly recruit Tregs and contribute to CD8+ T lymphocyte apoptosis in murine BC.59
CXCL10 exhibits pleiotropic function in tumor biology since its interaction with CXCR3-A leads to tumor cells survival and proliferation, whereas interaction with CXCR3-B mediates anti-proliferative, pro-apoptotic and angiostatic effects.60 In BC, overexpression of CXCR3-B has demonstrated to enhance the sphere-forming potential of CSC and to amplify their compartment, which is depleted by CXCR3-B silencing.61 Here, we demonstrated that mBCSCs are endowed with CXCR3, and hBCSCs express isoforms A and B, and that both cell lines respond to CXCL10 by increasing their proliferation and sphere-forming ability. Originally identified as a chemoattractant of CXCR3+ leukocytes, including macrophages, dendritic and NK cells and activated T lymphocytes,62 CXCL10 has been shown to also recruit Tregs63 and increase transcription of T-bet and RORγt, leading to the polarization of Tr1 and Th17 from naïve T cells.64 Thereby, CXCL10 released by IL30-stimulated BCSCs may contribute in shaping their immune contexture, which is enriched in Tregs and NKp46+RORγt+ ILC3. ILC3 co-localizes with IL22 and IL17, which fuel an immunosuppressive environment.65 66 Produced by IL30-overexpressing tumors, IL23 can lead to the expansion of ILC367 and enable their expression of IL17 and IL22.67 Although their role in cancer is yet to be clarified, ILC3 promote LN metastasis in BC,68 and in NSCLC their percentage has been associated with IL23 expression in tumor cells and with short patient survival.69 Expression of IL23p19 is frequent in human tumors and it has been demonstrated to boost angiogenesis and innate inflammatory influx, while inhibiting CD8+ T cell infiltrate, thus promoting tumor growth.70 In patients with BC, serum level of IL23 correlates with shorter overall survival and its overexpression with BCSC proliferation.71 72 Hyperproliferation, along with the considerable production of IL23 and CXCL10, observed in the context of murine IL30-positive tumors, was also found in spontaneous and experimental metastasis induced by IL30-overexpressing BCSCs. Although the metastatic propensity of mBCSCs21 does not allow to detect a difference in the number of mice which develop metastasis, between those bearing IL30-negative and IL30-positive tumors, the latter develop more metastasis per mouse and have reduced survival. The greater number of metastatic cases among mice receiving intravenous inoculation of IL30-overexpressing BCSCs versus control cells indicates that IL30 supports CSC survival in the bloodstream, extravasation and engraftment in the lung, where the immune contexture mirrors that of spontaneous metastasis and their primary tumors. Bioinformatic evidence of a correlation between the expression of IL30 and that of CXCL10 and IL23 in human BC tissues, and their prevalence in TNBCs, in which IL30+ BCSCs frequently co-express CXCL10 and IL23, supports the translational value of our finding and emphasizes the pathobiological role of the IL30-driven inflammatory cascade in BC behavior. Since IL30 has been found in the top 5% of the most expressed genes in the TN enriched BC collection,36 it can be argued that the IL30-driven tumor-promoting circuit may be of relevance in the pathobiology and evolution of the most aggressive forms of BC.
The CIBERSORTx algorithm provided new information on the immune profile associated with IL30 overexpression in the BC microenvironment, by revealing a lower content in γδ T cells, and a defective infiltrate of naïve and memory resting CD4+ T cells and DCs, in IL30high compared with IL30low BCs.
Intratumoral γδ T cells emerged as the most significant favorable cancer-wide prognostic population73 and have been associated with remission in TNBC subtype.74 However, their role is controversial,75 76 possibly due to the heterogeneity of the BC microenvironment that, depending on the immune contexture, oncogenic signaling and cytokine milieu, can polarize γδ T cells toward an anti-tumoral or pro-tumoral phenotype.77 78 The question of whether the IL30low TME can shape cytotoxic effector γδ T-cell subsets endowed with anti-tumor activity is yet to be investigated, as well as the biological and prognostic value of its naïve and memory resting CD4+ T and DC infiltrate.
On the other hand, expression of LAG3 in M1 macrophages, which has recently been observed also in diffuse large B-cell lymphoma,79 characterizes IL30high BCs, and corroborates our experimental findings, 18 and this paper providing evidence of the functional immune exhaustion associated with IL30-rich microenvironment.
In addition to providing new clues, through biostatistical investigations, of the tumor-promoting activity of IL30, our study demonstrates that BCSCs express membrane-bound IL30, which sustains their expansion directly and via second-level cytokines, mainly, CXCL10 and IL23. These immune regulatory factors mediate autocrine proliferative and self-renewal loops, but also contribute, together with the other second-level mediators, to the IL30-associated immune microenvironment. Targeting the IL30 pathway is a valuable strategy to restrain the BCSC compartment and to counteract immune suppression and BC progression.
Data availability statement
Data are available on reasonable request. All data generated or analysed during this study are available from the corresponding author on reasonable request.
Ethics statements
Patient consent for publication
Ethics approval
Animal procedures were performed in accordance with the European Community guidelines and were approved by the Institutional Animal Care Committee of the “G. d’Annunzio” University and by the Italian Ministry of Health (Authorization n. 892/2018-PR). The study on human tissue samples was performed in accordance with the principles outlined in the Declaration of Helsinki and approved by the Ethical Committee of the "G. d'Annunzio" University and Local Health Authority of Chieti, Italy (Protocol ONCO-2017-1, 04/19/2018). Informed consent to participate in the study was obtained from the participants.
References
Supplementary materials
Supplementary Data
This web only file has been produced by the BMJ Publishing Group from an electronic file supplied by the author(s) and has not been edited for content.
Footnotes
CS and SLC contributed equally.
Contributors EDC conceived the study. CS, SLC, LD'A, PL and CF performed the experiments, collected and assembled the data. EDC, CS and SLC performed data analyses. AT and MT provided human BCSCs. EDC interpreted the data and wrote the manuscript. All authors read and approved the final manuscript.
Funding The research leading to these results has received funding from AIRC, under IG 2019 - ID. 23264 project – P.I. Di Carlo Emma and IG 2018 - ID. 14415 project - P.I. Todaro Matilde, and from the Italian Ministry of University and Research (PRIN - 2017M8YMR8 – Unit 3 P.I. Di Carlo Emma).
Competing interests None declared.
Provenance and peer review Not commissioned; externally peer reviewed.
Supplemental material This content has been supplied by the author(s). It has not been vetted by BMJ Publishing Group Limited (BMJ) and may not have been peer-reviewed. Any opinions or recommendations discussed are solely those of the author(s) and are not endorsed by BMJ. BMJ disclaims all liability and responsibility arising from any reliance placed on the content. Where the content includes any translated material, BMJ does not warrant the accuracy and reliability of the translations (including but not limited to local regulations, clinical guidelines, terminology, drug names and drug dosages), and is not responsible for any error and/or omissions arising from translation and adaptation or otherwise.