Article Text

Abstract
Background Melanoma brain metastases (MBMs) are a challenging clinical problem with high morbidity and mortality. Although first-line dabrafenib–trametinib and ipilimumab–nivolumab have similar intracranial response rates (50%–55%), central nervous system (CNS) resistance to BRAF-MEK inhibitors (BRAF-MEKi) usually occurs around 6 months, and durable responses are only seen with combination immunotherapy. We sought to investigate the utility of ipilimumab–nivolumab after MBM progression on BRAF-MEKi and identify mechanisms of resistance.
Methods Patients who received first-line ipilimumab–nivolumab for MBMs or second/third line ipilimumab–nivolumab for intracranial metastases with BRAFV600 mutations with prior progression on BRAF-MEKi and MRI brain staging from March 1, 2015 to June 30, 2018 were included. Modified intracranial RECIST was used to assess response. Formalin-fixed paraffin-embedded samples of BRAFV600 mutant MBMs that were naïve to systemic treatment (n=18) or excised after progression on BRAF-MEKi (n=14) underwent whole transcriptome sequencing. Comparative analyses of MBMs naïve to systemic treatment versus BRAF-MEKi progression were performed.
Results Twenty-five and 30 patients who received first and second/third line ipilimumab–nivolumab, were included respectively. Median sum of MBM diameters was 13 and 20.5 mm for the first and second/third line ipilimumab–nivolumab groups, respectively. Intracranial response rate was 75.0% (12/16), and median progression-free survival (PFS) was 41.6 months for first-line ipilimumab–nivolumab. Efficacy of second/third line ipilimumab-nivolumab after BRAF-MEKi progression was poor with an intracranial response rate of 4.8% (1/21) and median PFS of 1.3 months. Given the poor activity of ipilimumab–nivolumab after BRAF-MEKi MBM progression, we performed whole transcriptome sequencing to identify mechanisms of drug resistance. We identified a set of 178 differentially expressed genes (DEGs) between naïve and MBMs with progression on BRAF-MEKi treatment (p value <0.05, false discovery rate (FDR) <0.1). No distinct pathways were identified from gene set enrichment analyses using Kyoto Encyclopedia of Genes and Genomes, Gene Ontogeny or Hallmark libraries; however, enrichment of DEG from the Innate Anti-PD1 Resistance Signature (IPRES) was identified (p value=0.007, FDR=0.03).
Conclusions Second-line ipilimumab–nivolumab for MBMs after BRAF-MEKi progression has poor activity. MBMs that are resistant to BRAF-MEKi that also conferred resistance to second-line ipilimumab–nivolumab showed enrichment of the IPRES gene signature.
- melanoma
- immunotherapy
- central nervous system neoplasms
- tumor microenvironment
Data availability statement
Data are available on reasonable request. All data relevant to the study are included in the article or uploaded as supplementary information. We will make available our sequencing data on reasonable request. All clinical information has been made available in the main manuscript and supplementary data files.
This is an open access article distributed in accordance with the Creative Commons Attribution Non Commercial (CC BY-NC 4.0) license, which permits others to distribute, remix, adapt, build upon this work non-commercially, and license their derivative works on different terms, provided the original work is properly cited, appropriate credit is given, any changes made indicated, and the use is non-commercial. See http://creativecommons.org/licenses/by-nc/4.0/.
Statistics from Altmetric.com
Background
Melanoma brain metastases (MBMs) are a common clinical problem with population based studies from the US Surveillance, Epidemiology and End Results database indicating approximately 35% of patients with advanced melanoma exhibit brain metastases.1 Large single institutional studies of patients with MBMs conducted prior to the advent of effective systemic treatment display historical median overall survival (OS) between 3 and 6 months.2–4 In recognition of this historically poor prognosis, the American Joint Staging Committee system for melanoma stratifies the presence of brain metastases as a separate category, M1d.5
However, the advent of targeted therapy and immunotherapy has substantially changed the therapeutic paradigm for MBMs. BRAF inhibitors (BRAFi) namely dabrafenib and vemurafenib both display intracranial activity, although responses are short lived with median progression-free survival (PFS) of around 4 months.6 7 The COMBI-MB trial that investigated dabrafenib–trametinib for patients with MBMs demonstrated an intracranial response rate of 58%, although median PFS of 5.6 months was considerably less than the extracranial PFS seen in the phase III registration trials of approximately 12 months.8 However, combination ipilimumab-nivolumab has emerged as a highly effective systemic treatment in the first-line setting.9 10 Intracranial response rates from two Phase II studies (ABC, CHECKMATE 204) were approximately 50%–55%; similar to that observed with extracranial disease.9–11 Importantly, responses appeared durable, with 5-year landmark PFS and OS of 46% and 51%, respectively.12 Hence, ipilimumab–nivolumab offers the prospect of long-term disease control in patients with MBMs.
Combination BRAF-MEKi is a standard first-line systemic treatment; however, central nervous system (CNS) involvement is observed in approximately 30% of patients who experience progression.13 Additionally, the utility of second-line ipilimumab–nivolumab after intracranial progression on BRAF-MEK inhibitors is unknown. We conducted a retrospective analysis of patients treated with second-line ipilimumab–nivolumab after BRAF-MEKi intracranial progression. For comparison, we also assessed the outcomes of patients with MBMs treated with first-line ipilimumab–nivolumab combination therapy. Alongside this retrospective analysis of patient outcome, we also conducted whole transcriptome sequencing of treatment naïve (n=18) and BRAF-MEKi resistant (n=14) MBMs to investigate the mechanisms of drug resistance.
Methods
Clinical information
Patients were identified by review of Peter MacCallum Cancer Centre pharmacy dispensing records from March 1, 2015 to June 30, 2018.
Inclusion criteria for the retrospective analysis was any patient who received at least 1 dose of combination ipilimumab–nivolumab (combined 3 mg/kg ipilimumab and 1 mg/kg nivolumab every 21 days for four doses) for MBMs in the first to third line setting and had thin slice gadolinium enhanced MRI brain imaging at baseline, at week 6 post ipilimumab–nivolumab commencement and at 8–12 weekly intervals thereafter. Patients who received ipilimumab–nivolumab in the second/third line setting were only included if they harbored BRAFV600 mutations and had MRI brain imaging showing intracranial progression when receiving prior BRAF-MEKi treatment with minimum MBM diameter of 3 mm (ie, all second/third line patients had intracranial progression documented with brain MRI while on prior BRAF-MEKi therapy). Patients with excised MBMs were included if ipilimumab–nivolumab was commenced within 8 weeks of surgery. Patients who received whole brain radiotherapy (WBRT) or stereotactic radiation treatment prior to commencement of ipilimumab–nivolumab were also included.
Patients were excluded if they received ipilimumab–nivolumab in greater than third-line settings or if their baseline MRI brain was conducted more than 6 weeks prior to commencement of ipilimumab–nivolumab. Other exclusions were patients with uveal melanoma or if BRAF-MEKi was not ceased at least 1 day prior to commencement of ipilimumab–nivolumab in the second/third line group.
Intracranial imaging reviewed by a single neuroradiologist using modified intracranial Response Evaluation Criteria in Solid Tumours (RECIST) as per the ABC trial.9 Up to five non-irradiated target CNS lesions were identified with measurable MBMs defined as measuring 5 mm or more on the longest diameter. Non measurable lesions were those with a lesion size of ≥3–<5 mm or leptomeningeal disease. Intracranial partial response was defined as a minimum of 30% reduction in sum of CNS lesion diameters. Intracranial progression was defined as a minimum of 20% increase of sum of CNS lesion diameters and an absolute increase of 5 mm or symptomatic progression. Patients with only non-measurable disease were excluded from intracranial RECIST response assessment but included in the intracranial PFS calculations. Leptomeningeal disease was defined by the presence of abnormal enhancement involving the subarachnoid space, ventricular ependymal surface and/or along cranial nerves on postcontrast T1-weighted MRI.14 Patients with at least one non-irradiated, measurable MBM were included for the intracranial RECIST analysis. However, patients who received WBRT or stereotactic radiosurgery (SRS) within 12 weeks of commencement of ipilimumab–nivolumab were excluded from intracranial RECIST analyses but included in PFS calculations and highlighted separately in the waterfall plots.
Intracranial PFS was defined as date of commencement of ipilimumab–nivolumab to: modified intracranial RECIST CNS progression, symptomatic progression, or death. Patients who did not progress by modified intracranial RECIST and received SRS/WBRT were censored for intracranial PFS. Extracranial staging was performed by F-18 fluorodeoxyglucose positron emission tomography (FDG-PET) and assessments evaluated using Positron Emission Tomography Response Criteria in Solid Tumors (PERCIST).15 Systemic treatment, surgery and radiotherapy treatment details were recorded. Data for PFS and OS cut-off was December 15, 2020. Overall survival was defined as date of commencement of ipilimumab–nivolumab to date of death.
RNA sample preparation
Formalin-fixed paraffin-embedded (FFPE) samples were cut into 5 and 10 micron thick sections for IHC and DNA/RNA studies, respectively. Samples with tumor purity of at 70% as assessed by a specialist melanoma pathologist underwent DNA/RNA extraction. RNA extraction was performed using the Qiagen All Prep DNA/RNA FFPE Kit (Qiagen, 80234) according to manufacturer instructions. Purity and concentration was assessed using the Agilent Tapestation 2200. Macroscopically pigmented RNA elutes were also subjected to a separate purification step to remove melanin using Zymo-Spin-II-hHRC (Zymo Research, C1059-50) filters as per manufacturer’s instructions. Approximately 50 ng of RNA was used for library preparation according to standard protocols (SMART-Seq, Takara Biosciences) by the Molecular Genomics Core facility at Peter MacCallum Cancer Centre. Samples were sequenced using a NovaSeq6000 (Illumina) to generate approximately 100 million paired-end 50 bp reads per sample at the Australian Genomics Research Facility in a single batch.
RNA sequencing
Online supplemental appendix B table S2 displays the RNA sequencing and mapping statistics. Each sample was subjected to a minimum of 4.0×10⁷ paired reads with an optimal read count of >5.0×10⁷. Raw data files were trimmed and aligned to human genome 19. Paired exonic reads of 1.0×10⁷ was established as the minimum threshold for data analysis.
Supplemental material
Transcriptome analysis
Raw transcript read counts were processed in R V.3.6.316 with edgeR V.3.26.8,17 18 limma V.3.40.6,19 tidyverse packages20 and convenience wrapper functions from tidybulk 0.99.6.21 Samples failing manual quality control defined by <1.0×10⁷ paired exonic reads were filtered out first. Biotypes namely protein coding, miRNA or lincRNA were included so long as they had abundance of greater than 10 counts per million (CPM) in over 70% of samples. The remaining counts were normalized using upper quartile scaling to adjust for library size.
To test for batch effects in the expression data principal component analysis and canonical correlation analysis on the normalized and raw counts was performed. No significant variance between sample preparation kit or sequencing batch was observed with respect to library size or estimated purity.
ESTIMATE V.1.0.1322 and MCPcounter V.1.2.023 were run on the CPM-transformed raw counts to produce per-sample estimates of tumor purity and immune cell fraction, respectively. Differentially expressed genes (DEGs) were obtained with edgeR’s glmFit and glmLRT functions, using an appropriate design matrix. This matrix consisted of treatment or tissue type as a covariate and additionally patient in any patient-matched contrast. Heatmaps of the DE genes and gene sets were produced using z-scores of the log-transformed, normalized read counts. Hierarchical clustering was performed row-wise and column-wise in these heatmaps using Euclidian distance and the ‘complete linkage’ agglomeration method from hclust.
Gene set testing
We performed Hallmark, Kyoto Encyclopedia of Genes and Genomes (KEGG) and Gene Ontogeny (GO) pathway analysis using limma’s implementation of the algorithms in GOseq for RNA-seq gene ontology analysis. These analyses were repeated using GSEA V.4.03 (Broad Institute) using standard and preranked methods. All other gene set enrichment testing was conducted with limma’s fry() function, which implements rotation gene set testing for negative binomial models.
Immunohistochemistry
Immunohistochemistry for CD3 and CD8 was performed as follows: slides were baked at 65°C for 60 min and dewaxed followed by heat induced epitope retrieval in a pressure cooker in sodium citrate pH6 or Tris EDTA pH9. Slides were stained using a BONDRx autostainer (Leica Biosystems) using the following incubations at room temperature: endogenous peroxidize quenching for 5 min in 3% hydrogen peroxide, protein block for 10 min, primary antibodies for 60 min, mouse or rabbit ImmPRESS (Vector Labs) for 30 min and finally AEC+solution (Dako) for up to 25 min. Slides were washed with PBS between each step. Slides were counterstained with haematoxylin and mounted in aqueous mounting media. Primary antibodies used were: rabbit anti-CD3 (1:100, Abcam ab166690) and mouse anti-CD8 (1:50, Invitrogen/Thermofisher Scientific MA1-80231).
Statistical analysis
Patient characteristics and clinical parameters were summarized using median (range) for continuous variables and frequency (proportion) for categorical variables. Graphs and statistical analysis were performed using Prism V.9.0 and Stata V.16.0.
Results
The primary aim was to assess the activity of second/third line ipilimumab–nivolumab for intracranial metastases after BRAF-MEKi treatment. Seventy-three patients were identified from Peter MacCallum Cancer Centre pharmacy and radiology records who received ipilimumab–nivolumab for MBMs. Patient disposition is displayed in online supplemental appendix A figure S1. Patients with MBMs who received ipilimumab–nivolumab in the first to third line setting were included. Patients who received second or third line ipilimumab–nivolumab were required to have BRAFV600 mutant melanoma.
Supplemental material
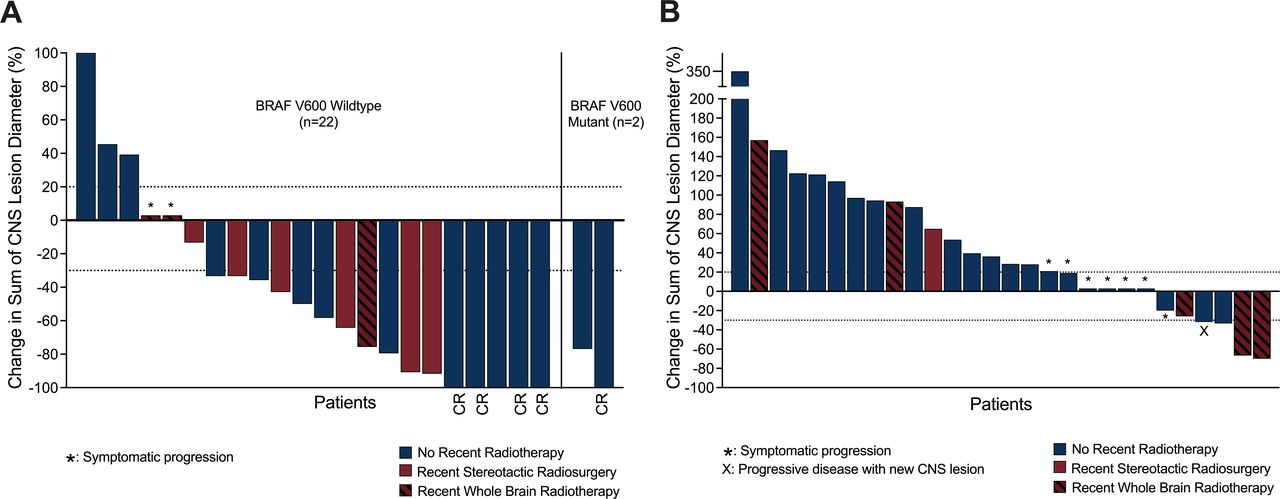
Waterfall plot of ipilimumab–nivolumab for melanoma brain metastases (MBMs). Panel A displays the waterfall plot of first-line ipilimumab–nivolumab (n=24) for MBMs. Panel B displays the waterfall plot of second/third line ipilimumab–nivolumab (n=28) for BRAFV600 mutant MBMs. Note from the first and second/third line ipilimumab–nivolumab groups, one and two patients, respectively, did not have measurable MBMs and were excluded from this analysis. Maroon columns display patients who were treated with SRS or WBRT within 12 weeks prior to commencing ipilimumab–nivolumab. CR, complete response; SRS, stereotactic radiosurgery; WBRT, whole brain radiotherapy.
A total of 55 patients with MBMs treated with combination ipilimumab–nivolumab were included and their baseline characteristics displayed in table 1. The number of patients treated with first-line and second/third line ipilimumab–nivolumab (BRAFV600 mutant) was 25 and 30, respectively. Median age was different at 64.0 and 54.0 years in the first line and second/third line groups, respectively (p=0.027). Eastern Cooperative Oncology Group performance status favored the second/third line ipilimumab–nivolumab group (p=0.043). Most first-line patients were BRAF wildtype (23/25, 92.0%) due to government reimbursement restrictions that mandated upfront use of a BRAF-MEKi for patients with BRAFV600 mutant melanoma. Receipt of corticosteroids at time of initiation of ipilimumab–nivolumab was 7.3% (4/55) of the entire cohort.
Baseline characteristics of patients treated with ipilimumab–nivolumab (I–N) for melanoma brain metastases
The burden of MBMs with relation to number, size, and poor prognostic features were similar between the first and second/third line groups (table 2). Median number of measurable metastases for the first line and second/third line groups was 1 and 2, respectively (p=0.146) (table 2). Median sum of MBM lesion diameters was similar for first line (13 mm) and second/third line (20.5 mm) ipilimumab-nivolumab groups (p=0.327). Patients with progressive symptomatic MBMs accounted for 44.0% (11/25) and 26.7% (8/30) in the first-line and second/third line groups, respectively. Leptomeningeal disease was present in 12.0% (3/25) and 23.3% (7/30) in the first-line and second/third line groups, respectively.
Characteristics of melanoma brain metastases (MBMs) at commencement of ipilimumab–nivolumab (I–N)
All second/third line patients received prior BRAF-MEKi therapy prior to ipilimumab-nivolumab (online supplemental appendix A table S1). Two patients received first-line anti-PD1 then second line BRAF-MEKi prior to ipilimumab-nivolumab. Seven patients received third-line ipilimumab-nivolumab. Baseline characteristics of the second/third line ipilimumab-nivolumab BRAFV600 mutant group at time of initiation of systemic therapy are displayed in online supplemental appendix a table S2). Of these 30 patients, 17 had MBMs at initiation of systemic treatment (de novo) and 13 acquired MBMs while on treatment with BRAF-MEKi. Patients with de novo MBMs experienced intracranial progression with a median of 6.8 months.
The majority (63.6%) received local therapy such as stereotactic radiosurgery (SRS), whole brain radiotherapy (WBRT), surgical excision, or combination thereof prior to commencement of ipilimumab-nivolumab (online supplemental appendix A table S3). Receipt of local therapies such as surgery, radiation, or both was similar between the first and second/third line groups. Most local therapy included surgical excision (25/55, 45.5%), SRS (19/55, 34.5%) and WBRT was delivered in 21.8% of the study population.
Second-line ipilimumab–nivolumab has low intracranial activity following BRAF-MEKi CNS progression
Intracranial response rate assessed by modified intracranial RECIST for patients with at least one measurable, non-irradiated target lesion for first-line ipilimumab-nivolumab was 75.0% (12/16) and in the second/third line ipilimumab-nivolumab group was 4.8% (1/21) (table 3). Figure 1 displays the intracranial response waterfall plots of the first line and second/third line groups including the patients who received SRS or WBRT within 12 weeks of commencing ipilimumab-nivolumab.
Intracranial response rate to ipilimumab–nivolumab (I–N)
Extracranial responses were assessed by FDG-PET using PERCIST criteria15 and were generally concordant with intracranial response with an objective metabolic response rate of 82.4% (14/17) and 11.1% (1/9) for first-line and second/third line ipilimumab–nivolumab, respectively (table 4).
Extracranial response rate to ipilimumab–nivolumab (I–N)
Median intracranial PFS was 41.6 months in first-line ipilimumab-nivolumab and 1.3 months in second/third line (figure 2). Intracranial PFS was superior in first-line versus second/third line ipilimumab-nivolumab (Mantel Cox χ2=21.0, HR=0.208, p<0.001). Overall survival from commencement of ipilimumab-nivolumab is displayed in figure 2. Median follow-up for first-line and second/third line ipilimumab nivolumab was 34.5 (range: 0.5–47.9) and 4.6 (range 0.1–46.3) months, respectively. Median OS for first line was not reached, but landmark OS at 12 and 24 months was 76.0% and 72.0%, respectively. Although OS for second/third line ipilimumab-nivolumab does not take into account the impact of prior BRAF-MEKi therapy, median OS for this group was 4.6 months. However, a subset of patients had prolonged survival with landmark 12 and 24 month OS rates at 27.6% and 24.1%, respectively.

Kaplan-Meier curve of intracranial progression free survival and overall survival of first-line versus second/third line ipilimumab–nivolumab. Panel A: intracranial progression-free survival (PFS). Median intracranial PFS for first-line ipilimumab–nivolumab was 41.6 months and second/third line was 1.3 months. Intracranial first-line versus second/third line ipilimumab-nivolumab PFS Mantel Cox test χ2 21.0 hazard ratio (HR)=0.208, p<0.001. Panel B: overall survival of first-line and second/third line from time of initiation of ipilimumab–nivolumab. Median overall survival for first-line and second/third line ipilimumab-nivolumab was not reached and 4.6 months, respectively. One-year and 2-year survival of first ipilimumab–nivolumab was 76.0% and 72.0%, respectively. One-year and 2-year survival of second/third line ipilimumab–nivolumab was 27.6% and 24.1%, respectively.
The pattern of BRAFV600 MBMs progression with second/third line ipilimumab-nivolumab is displayed in online supplemental appendix A table S4). New MBMs were observed in 33.3% (10/30) of patients and extracranial only progression was infrequent in the second/third line ipilimumab-nivolumab group (3.3%). Following progression of second/third line ipilimumab-nivolumab, 40.0% (12/30) had subsequent systemic therapy with six patients swapping back to BRAF-MEKi (online supplemental appendix A table S5). Radiation postprogression of second/third line ipilimumab-nivolumab was used in 66.7% (20/30) of the patients comprising of WBRT (n=12) and SRS (n=8) (online supplemental appendix A table S5). Five out of seven patients who had OS of 2 years or more after receiving second/third line ipilimumab-nivolumab received SRS to metastases on progression of immunotherapy (online supplemental appendix A table S6). In this small group of survivors, three patients received BRAF-MEKi, one patient combination immunotherapy with targeted therapy, two patients continued nivolumab monotherapy and one patient did not require further systemic therapy after progression with second/third line ipilimumab-nivolumab (online supplemental appendix A table S6). Notably, this group of survivors had relatively small volume MBM at commencement of second/third line ipilimumab with a median lesion diameter of 7 mm (range 6–30 mm).
MBM transcriptome analysis
Given the surprising poor intracranial activity of second-line ipilimumab-nivolumab, we sought to investigate the mechanisms associated with progression on BRAF-MEKi in MBMs that conferred near universal resistance to subsequent combination immunotherapy using whole transcriptome analyses. We sequenced 32 FFPE BRAFV600 mutant MBMs that were naïve to systemic therapy (n=18) and those that progressed on BRAF-MEKi treatment (n=14) derived from 29 patients and performed comparative analyses using RNAseq. Patient details of this cohort and RNA sequencing statistics are displayed in online supplemental appendix B tables S1,S2 respectively.
We first compared the transcriptome of 11 patients with matched MBMs (n=13) and extracranial metastases (n=14). Extracranial metastases comprised of nine lymph node samples, four distant metastatic and one regional in-transit lesion that were sampled for diagnostic or therapeutic purposes prior to initiation of systemic therapy (online supplemental appendix B table S1). Gene set enrichment analysis (GSEA) showed Hallmark gene sets denoting metabolic pathways were enriched in brain compared with extracranial metastases such as glycolysis (p=0.00138), adipogenesis (p=0.00268), fatty acid metabolism (p=0.0363) and oxidative phosphorylation (p=0.047) (online supplemental appendix B table S3). In contrast, immune-related pathways were enriched in extracranial lesions including allograft rejection (p=0.00485), Interleukin-2 (IL-2)-Stat 5 signaling (p=0.0193) and interferon gamma response (p=0.0214). These findings are broadly consistent with Fischer et al,24 that showed extracranial lesions were enriched with immune-related gene sets, whereas brain metastases exhibited oxidative phosphorylation and other metabolic pathway upregulation. Furthermore, MCPcounter gene expression analysis of the tumor microenvironment showed higher B cell lineage (p<0.0001), T cell (p=0.0019) and cytotoxic lymphocyte (p=0.0033) scores in the extracranial lesions compared with MBM (online supplemental appendix B figure S1). Collectively, these findings are consistent with prior studies that show the brain tumor microenvironment is relatively immunosuppressed compared with extracranial sites.24
We then compared the transcriptome of treatment naïve BRAFV600 mutant MBM (naïve) to those that progressed (PROG) on BRAF-MEKi. DEGs were considered significant with p value <0.05 and false discovery rate (FDR) of <0.1. The majority of DEG (155/178, 87.1%) were upregulated in the progression group and 96 genes had FDR of <0.05 (online supplemental appendix B table S4). The top 30 DEG included genes encoding a range of cellular functions including structural cytoskeleton (eg, ARHGEF5, EMILIN2 and MAP1B), cell signaling (eg, TSPAN12 and CRMP1), metabolism (ACOT11 and CD36), chemokine (CXCL2 and IL-8) and myeloid activation (TREM1 and CD36). ACAN exhibited the highest log fold change of 4.27 and encodes aggrecan, which is a proteoglycan necessary for cartilage development. ARHGEF5 (rho guanine nucleotide exchange factor 5) encodes a rho GTPase important for G protein cell signaling and cytoskeleton organization.
The 23 DEGs that were downregulated in the progression group, encompassed heterogenous cellular functions including ion transport (eg, CLCN5), metalloproteinase inhibitor (eg, TIMP3), ubiquitin ligase (eg, SIAH1) and other assorted genes. Notably dual specificity protein phosphatase 6 (DUSP6) was downregulated in the progression group, and its function includes inactivation of ERK2, which raises the possibility as a potential resistance mechanism to BRAF-MEKi.25
Unsupervised hierarchical clustering based on DEG with FDR <0.05 and sample group (naïve or progression; n=32) was performed. Two clusters emerged from these analyses, naïve (n=18) to systemic treatment and progression on BRAF-MEKi (n=14) (figure 3, panel A). Figure 3 panel B displays the volcano plot of naïve versus progression on BRAF-MEKi treatment (PROG) MBM. A series of monocyte and myeloid chemokines that are associated with tumor-associated macrophages and monocyte derived myeloid-derived suppressor cells (MDSCs) including chemokine ligand 2 (CCL2), chemokine CXC ligand 8 (CXCL8) and CXCL2 were upregulated in progressive MBM. Additionally, myeloid cell activation genes were also upregulated in the progressive metastases such as integrin alpha-M (ITGAM), C-type lectin member 5A (CLEC5A), matrix metalloproteinase-25 (MMP25), CD93 and CD36. ITGAM or CD11b is a fundamental marker of myeloid cells including macrophages, microglia, monocytes and granulocytes.26 27 CD36 and CD93, which are upregulated in BRAFi resistant MBM, have both angiogenic and myeloid cell activation functions.
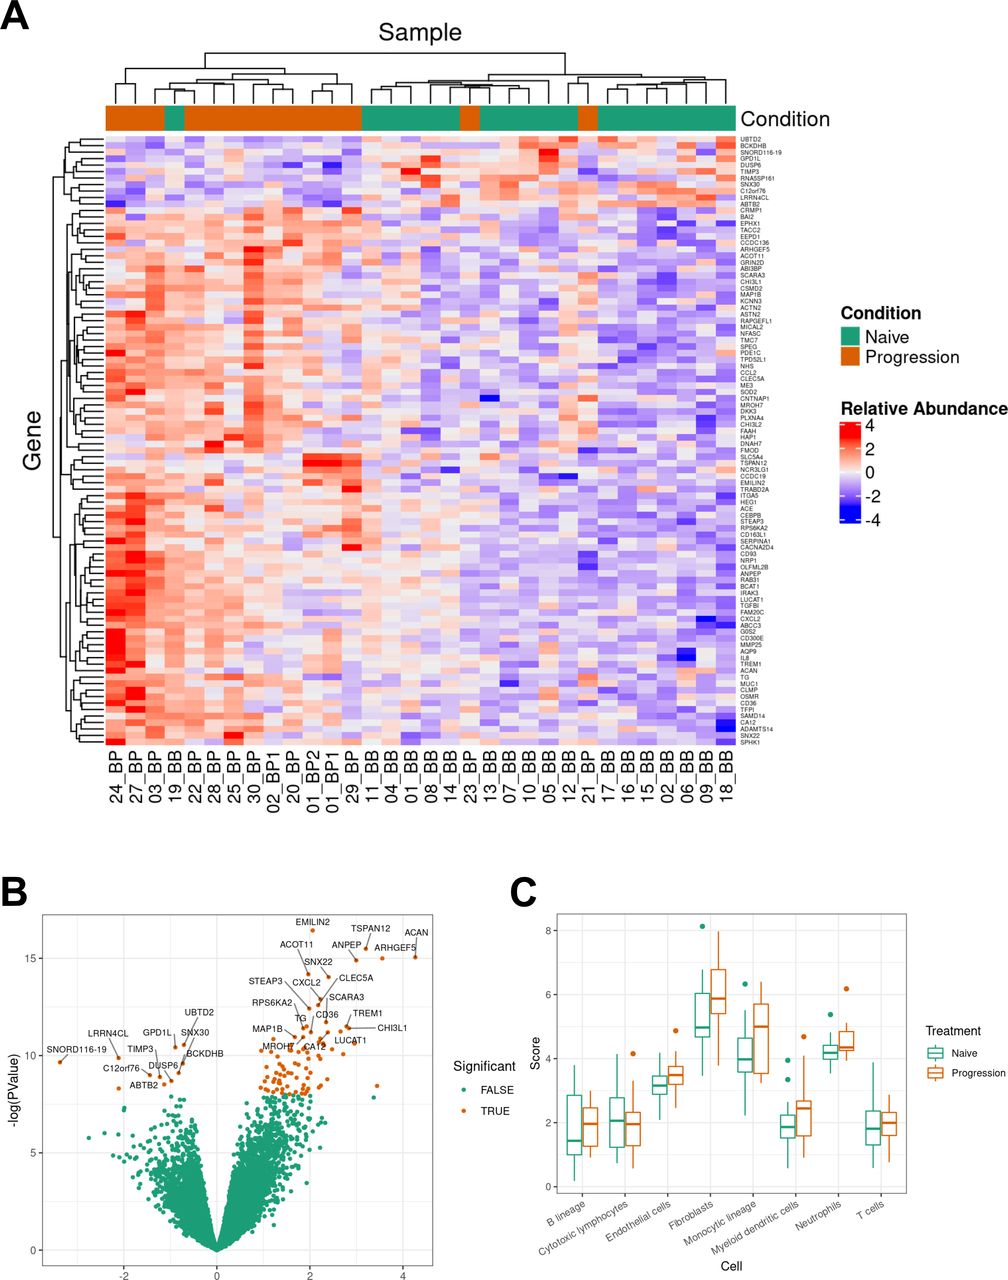
Transcriptome analyses of BRAFV600 mutant MBMs naïve and with progression on BRAF-MEKi treatment. Panel A: heatmap of differentially expressed genes (DEGs) of naïve (n=18) versus progression (n=14) melanoma brain metastases (MBMs) on BRAF-MEKi treatment. DEGs, defined by a log2 fold change ≥0.58 or ≤−0.58 with a p value <0.05 and false discovery rate (FDR) <0.05, were included in this heatmap. Seventeen of the 18 naïve MBMs clustered with one another with 12 out of 14 progression MBMs grouping together. Panel B: volcano plot of DEGs of naïve (n=18) versus progression (n=14) MBMs on BRAF-MEKi treatment. LogFC mRNA expression between MBMs naïve to treatment and with progression on BRAF-MEKi plotted on the x-axis, and FDR-adjusted significance is plotted on the y-axis (–log10 scale). Panel C: MCPcounter analysis displaying immune cell populations of naïve (n=18) versus progression (n=14) MBMs on BRAF-MEKi treatment. There were no differences in MCPcounter scores between the naïve and progression MBMs of any cell type. BB, baseline MBM; BP, BRAF-MEKi progressive MBM; FFPE, formalin-fixed paraffin-embedded.
Responses to immune checkpoint inhibitors is reliant on colocation of cytotoxic T cells with the tumor and given the enrichment of myeloid related chemokines and activation genes, we investigated the composition of the tumor microenvironment using gene expression analysis. Using MCPcounter, we found no differences in immune cell populations between the naïve and progressive MBM groups (figure 3 panel C). Furthermore, immunohistochemistry did not show a difference in tumor infiltrating CD3 and CD8 between naïve and progressive MBMs (online supplemental appendix B figure S2).
MBMs resistant to BRAF-MEK inhibitors are associated with the innate PD-1 resistance (IPRES) gene expression signature
Comparative GSEA using Hallmark, GO and KEGG libraries was then performed on MBMs naïve (n=18) versus progression on BRAF-MEKi (n=14). Using GSEA standard and preranked algorithms, there were no identified pathways using FDR of <0.25 and p value of 0.1 thresholds.
To assess whether similar mechanisms of immunotherapy resistance were present in this cohort of brain metastases, comparative gene set testing from prominent studies investigating mechanisms of response or resistance to anti-PD1 from Ayers et al,28 Gide et al29 and Hugo et al was performed. The 18-gene IFN-γ signature from Ayers et al is a predictive assay associated with clinical benefit of anti-PD1 monotherapy.28 Gide et al compared the transcriptome of melanoma patients who responded and progressed on either anti-PD1 monotherapy or anti-CTLA-4/anti-PD1.29 They identified 331 DEG (defined by p value <0.05) between responders (n=38) and non-responders (n=13) of melanoma patients treated with combination anti-CTLA-4/anti-PD-1.29 Hugo et al30 described the Innate Anti-PD1 Resistance Signature (IPRES), which incorporates a set of 26 gene pathways that are associated with resistance to anti-PD1 monotherapy. As displayed in table 5, the DEG from the IPRES signature was the only statistically significant gene set that displayed enrichment in our brain metastasis cohort with p=0.0078 and FDR of 0.031.
Supervised gene set testing of correlates of anti-PD1 therapy
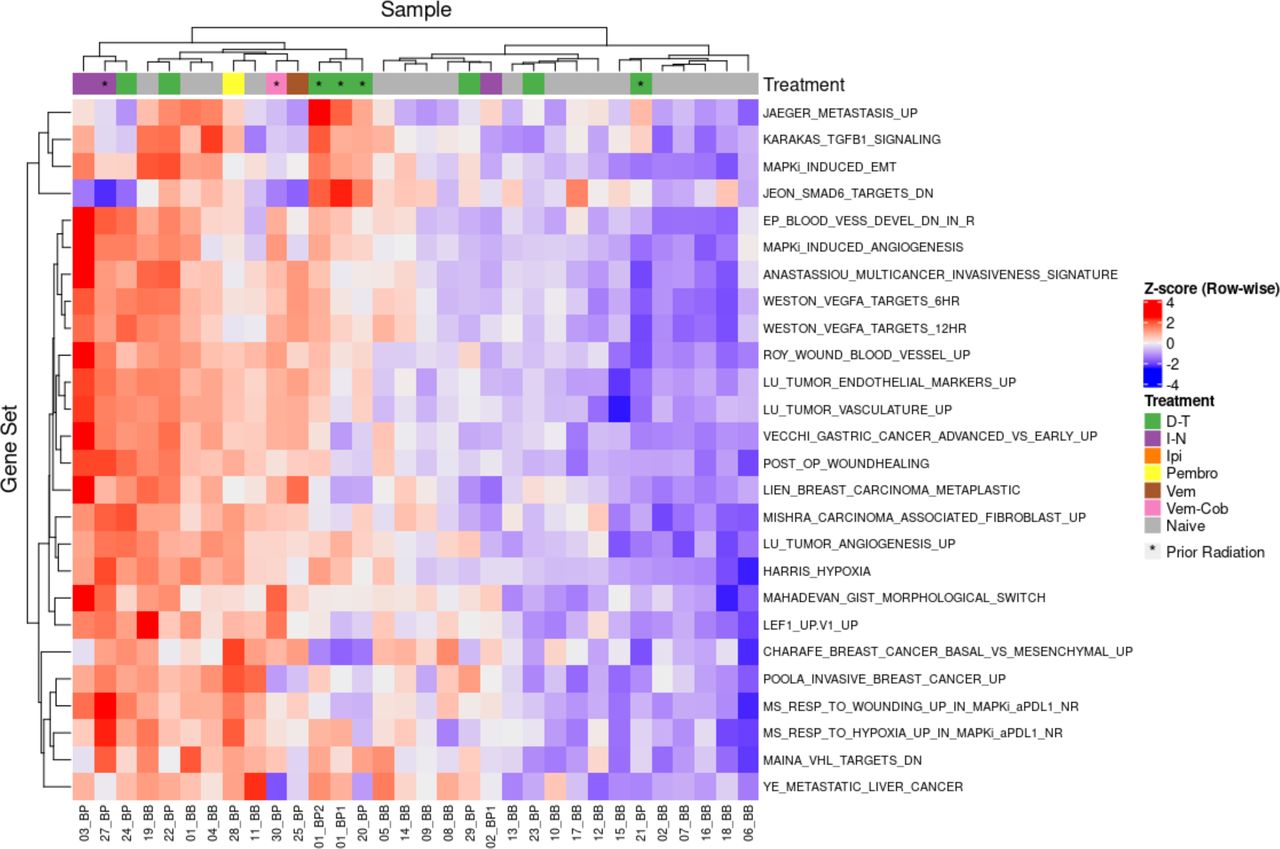
Figure 4 displays a heatmap of the individual IPRES gene sets. The naïve and progression samples generally clustered together with 14 of 18 naïve MBMs in one group and 10 of 14 progression metastases in another. Given some naïve MBMs will not respond to anti-PD1, it is unlikely that all samples would cluster exclusively based on naïve or progression status. Generally, the progression samples exhibited upregulation of epithelial-mesenchymal transformation, angiogenic and wound healing gene sets. Upregulation of the EMT related gene sets ‘MAPKI Induced EMT’ and ‘Karakas TGFB1 Signaling’ was observed in most of the progression samples. Similarly, vascular and endothelial gene pathways such as ‘Weston VEGFA Targets 6Hr’, ‘Lu Tumour Vasculature’ and ‘Post Op Woundhealing’ were upregulated in the progression metastases. As such, the BRAF-MEKi resistant MBMs exhibited enrichment of the IPRES signature with vascular, endothelial and EMT pathway upregulation.

Heatmap of individual IPRES pathways in melanoma brain metastases (MBMs) naive and with progression on BRAF-MEKi treatment. This heatmap displays the 26 individual gene pathways that comprise the Innate Anti-PD1 Resistance Signature (IPRES) with the individual melanoma brain metastases comprising of naïve (n=18) and progression (n=14) MBMs on BRAF-MEKi treatment. These gene sets involve epithelial mesenchymal transformation, angiogenesis, wound healing and immunosuppression. Generally, progression samples upregulated vasculature and endothelial gene sets compared with naïve samples.
Discussion
This study sought to investigate the impact of second-line ipilimumab-nivolumab after BRAF-MEKi progression for BRAFV600 mutant MBMs. The first-line ipilimumab-nivolumab group were almost exclusively BRAF wildtype as first-line BRAF-MEKi was required by the Australian government reimbursement regulations that mandated upfront targeted therapy in patients with BRAFV600 melanoma. This restriction was lifted in March 2020. Despite inclusion of symptomatic patients, the outcomes for first-line ipilimumab-nivolumab were comparable with that of phase II trials in asymptomatic participants with almost 80% overall survival of our cohort at 12 months. CHECKMATE 204 also included a cohort with symptomatic MBMs and permitted concurrent dexamethasone up to 4 mg, which was required in 66.7% of patients (12/18) in this group.31 Intracranial response rates were significantly lower at 22% (4/18) with only two patients who received dexamethasone exhibiting an intracranial response. In our first-line ipilimumab-nivolumab group, 44.0% (11/25) presented with symptomatic MBMs, which invariably required surgery or radiation prior to initiation of systemic treatment. Local therapy was effective at facilitating cessation of corticosteroids with only 4.0% (1/25) patients requiring dexamethasone at commencement of ipilimumab–nivolumab. This indicates multimodal treatment of MBMs can be associated with favorable long-term outcomes. Further studies are required to delineate sequencing of local therapy with combination ipilimumab-nivolumab. Upfront SRS with ipilimumab-nivolumab for MBMs is currently under investigation with the ABC-X trial (NCT03340129).
The most significant finding of our study was the poor efficacy of second-line ipilimumab-nivolumab following intracranial progression on first-line BRAF-MEKi with median PFS of less than 6 weeks and response rates of less than 5%. The lack of activity was not explained by differences in size of intracranial lesions, presence of leptomeningeal disease or LDH as these key prognostic factors were similar to that of the first-line group. Moreover, tumor infiltrating CD3 and CD8 populations in naïve and BRAF-MEKi resistance MBMs were similar. Together with the poor intracranial PFS, we suggest that ipilimumab-nivolumab rather than BRAF-MEKi should be given as first-line treatment for MBMs given the poor second-line activity of combination immunotherapy. Given intracranial response rates did not differ between BRAFV600 mutant and wildtype MBMs to ipilimumab-nivolumab in CHECKMATE 204, this infers PFS between the two molecular groups are likely to perform similarly.10 Although BRAF mutation status was imbalanced in the first-line and second-line ipilimumab-nivolumab groups, the substantial differences in response rate and PFS indicate that combination immunotherapy should be given up front for MBMs.
Based on these clinical findings, whole transcriptome sequencing of BRAFV600 mutant MBMs that were treatment naïve or after progression on BRAF-MEKi was undertaken to investigate potential mechanisms of resistance. Our work showed enrichment of the IPRES signature with endothelial, myeloid chemokine and activation genes are upregulated in progressive MBMs. The IPRES signature comprises of 26 gene pathways involved with epithelial-mesenchymal transformation, endothelial, myeloid and growth signaling associated with anti-PD1 resistance.30 Examination of these individual pathways showed vascular gene sets were particularly enriched in BRAF-MEKi resistant MBMs. Our dataset also showed enrichment of myeloid chemokines (CCR2, IL-8 and CXCL2) and upregulation of myeloid activation genes (eg, ITGAM, CLEC5A and CD93) in progressive BRAF-MEKi MBMs. These findings are like those of Hugo et al32 who also previously identified upregulation of macrophage chemokines (IL-8) and activation genes (ITGAM and CD163) with BRAFi progression although in patients without brain metastases. Interestingly, CD163L and CLEC5A, which are potential markers of the M2 macrophage phenotype, were also enriched in our BRAF-MEKi resistant brain metastases. Hugo et al showed approximately half of patients with progression on BRAFi also exhibited loss of Major histocompatibility complex (MHC) class I or associated antigen presentation genes indicating a high likelihood of immunotherapy resistance.32 Our cohort did not clearly identify loss of MHC Class I related genes, nor a reduction in CD3 or CD8 cells in MBMs on BRAF-MEKi progression based on immunohistochemistry. Given MBMs resistant to BRAF-MEKi were almost always refractory to ipilimumab-nivolumab, these findings were somewhat unexpected. However, patient heterogeneity and the variation in time from BRAF-MEKi progression to surgical excision of MBMs may account for this.
Overcoming the immunosuppressive immune landscape of MBMs remains a clinical challenge. Several studies of MBMs indicate that the T cell infiltrate of intracranial lesions is reduced compared with other anatomical sites.24 33 The protective blood–brain barrier might contribute to the inherently immunosuppressive immune landscape of the brain although recent preclinical studies suggest additional anatomical factors might also contribute. Intracranial responses to murine MBMs to anti-PD1 and anti-CTLA-4 were enhanced by treatment with a vascular endothelial growth factor-C construct that enhanced lymphatic vessels that drained to cervical lymph nodes.34 A separate group also showed immune checkpoint inhibitor responses to MBMs were dependent on the presence of an extracranial lesion, which suggests the anatomy of the brain is inherently less conducive to T cell priming.35 Furthermore, RNA sequencing of patient-matched MBMs with extracranial lesions showed the latter exhibited immune signaling pathways enrichment such as Hallmark interferon gamma response, TGF-β signaling and IL-2 Stat 5, while the intracranial samples showed upregulation of oxidative phosphorylation pathways,24 which again exemplifies the relatively immunosuppressive tumor microenvironment of the central nervous system. This pre-existing ‘immunosuppressed’ or ‘cold’ brain tumor microenvironment might potentially explain that there was no observed change in immune cell composition between naïve and BRAF-MEKi resistant MBMs in our dataset.
Our data also supports ongoing evaluation of the use of lenvatinib; a second-generation multitargeted tyrosine kinase inhibitor (TKI) with activity against vascular endothelial growth factor receptor (VEGFR) and fibroblast growth factor receptors (FGFR), which are present in the IPRES signature.36 37 Lenvatinib inhibits VEGFR 1–3 at potent nanomolar concentrations and has comparatively higher activity against all FGFR isoforms (FGFR IC50: 22 nM) compared with other TKIs (eg, sunitinib IC50: 437–880 nM).36 Combination lenvatinib-pembrolizumab is under investigation in patients with metastatic melanoma refractory to immune checkpoint inhibitors in the LEAP-04 study (NCT03776136). Preliminary response rates to lenvatinib-pembrolizumab with prior progression on ipilimumab-nivolumab are promising at 33.3% (10/30).37
Radiation may also play a role in overcoming MBMs resistance with one cohort showing the response rate of combined SRS and pembrolizumab approaching 70% (16/23).38 Radiation can potentially enhance adaptive immune responses by inducing DNA damage, cell death and antigen release with subsequent influx of immune cells.39 Preclinical models have shown radiation combined with anti-PD1 can increase CD8 effectors40 and reduce MDSC populations41 in the tumor microenvironment. The latter effect is notable given the myeloid activation and chemokine gene enrichment present in resistant MBMs in our dataset. Furthermore, a high proportion of patients (66.7%) received radiation after MBMs progression in the second/third line ipilimumab-nivolumab group, which may partly account for the plateau in overall survival observed in a subset of patients. Five of the seven patients with OS of 2 years or more after commencing second line ipilimumab-nivolumab received radiation on progression of immunotherapy. Hence, radiation should play a role in switching between BRAF-MEKi and ipilimumab-nivolumab in progressive MBMs.
Given the rapid and often high-volume intracranial progression observed with second/third line ipilimumab-nivolumab in this cohort, continuing BRAFi during initiation of combination immune checkpoint inhibitors is a seemingly logical approach. Continuation of BRAFi might facilitate sufficient intracranial stability to allow a potential antitumor response to ipilimumab-nivolumab. However, two phase I studies of combination ipilimumab-BRAFi were closed due to early and severe toxicity.42 43 In a phase I study of combination dabrafenib–trametinib–ipilimumab, two of seven patients sustained grade 4 colitis with bowel perforations within 6 weeks.42 Furthermore combination ipilimumab–vemurafenib resulted in four of six patients exhibiting grade 3–4 hepatitis within 2–4 weeks.43 As such, continuing BRAFi while introducing ipilimumab-nivolumab might lead to severe toxicity but could be contemplated in highly extenuating circumstances.
Our work also provides potential insights into optimal systemic treatment sequencing of upfront ipilimumab-nivolumab or BRAF-MEKi in patients with extracranial disease only. A post hoc subgroup analysis of CHECKMATE067 showed patients with BRAFV600 melanoma treated with ipilimumab-nivolumab (n=103) exhibited durable responses with a 5-year landmark PFS of 38%,44 which compares favorably with a pooled analysis of first-line phase III trials of dabrafenib-trametinib (n=563) showing 19% PFS at the same timepoint.45 MBMs were excluded from these pivotal phase III registration trials. Notwithstanding the limitations of cross trial comparisons, upfront ipilimumab-nivolumab is generally favored by clinicians given its inherently longer duration of response. Hence, studies that investigate the optimal sequencing of combination immunotherapy versus BRAF-MEKi such as DREAMseq (EA6134, NCT02224781) and SECOMBIT (NCT02631447) are eagerly awaited. Importantly, intracranial involvement was observed in almost 30% of all patients who exhibited progression in a large-pooled analysis of dabrafenib-trametinib clinical trials (n=617) that excluded MBMs at study entry.13 Given the frequency of central nervous system progression on targeted therapy and our observations indicating poor intracranial responses to second-line ipilimumab-nivolumab further support the use of combination immunotherapy as first-line therapy regardless of the presence or absence of MBMs.
To our knowledge, this is the first time whole transcriptome sequencing has been employed to investigate BRAF-MEKi resistant MBMs. Limitations of our work include the low number of BRAFV600 MBMs treated with first-line ipilimumab-nivolumab, which could permit a direct comparison of survival outcomes with targeted therapy. We also acknowledge the potential bias associated with the intracranial progression criteria used to switch patients from BRAF-MEKi to second-line ipilimumab-nivolumab and heterogeneity in treatments in this retrospective study. Another limitation is the heterogenous timepoints that the resistant MBMs were excised and numbers of samples available. Access to serial patient matched MBMs with extracranial metastases naïve to BRAF-MEKi and on progression is ideal to limit intrapatient heterogeneity influencing the data analysis. A prospective study to investigate resistance mechanisms of MBMs would be the optimal approach. However, given MBMs are commonly surgically inaccessible or located in areas where neurosurgery would result in high morbidity (eg, paralysis) presents both ethical and logistical challenges. Furthermore, some patients may opt for SRS given the reduced morbidity associated with neurosurgery. These issues underscore the challenges in acquiring MBMs for analyses and highlights the need for further studies to corroborate our findings. Future studies of patient-matched MBMs with extracranial metastases before and after BRAF-MEKi treatment would also be helpful to affirm our findings of IPRES enrichment.
Overall, this work supports use of ipilimumab-nivolumab for BRAFV600 mutant MBMs as first-line systemic therapy rather than targeted therapy. MBMs with progression on first-line BRAF-MEKi conferred near universal resistance to second-line combination ipilimumab-nivolumab. We identified enrichment of the IPRES signature with myeloid cell activation and angiogenesis gene upregulation in BRAF-MEKi resistant MBMs. Further studies into the unique tumor microenvironment of the brain may unlock additional mechanisms of resistance.
Data availability statement
Data are available on reasonable request. All data relevant to the study are included in the article or uploaded as supplementary information. We will make available our sequencing data on reasonable request. All clinical information has been made available in the main manuscript and supplementary data files.
Ethics statements
Patient consent for publication
Ethics approval
The study was approved by the Peter MacCallum Cancer Centre human research ethics committee (HREC) approval 18/90R and a waiver of written consent for the clinical information as part of the retrospective analysis was granted. Written patient consent for the acquisition and analysis of MBM samples was provided under the ethics approvals under the Melanoma Research Victoria (HREC approval 07/38) and Peter MacCallum Cancer CentreCenter Melanoma Biomarker projects (HREC approval 11/105).
Acknowledgments
We would like to thank the patients and families who participated and donated tissue used in this work. We are indebted to Peter and Bernice Moritz, who kindly provided funds that enabled the sequencing for this project. We would also like to thank Sonia Mailer (sample acquisition), Gisela Mir Arnau (RNA sequencing) and Melanie Watson (statistical assistance). PKHL was supported by the Australian Government post graduate award. AL was supported by a Peter MacCallum Cancer Foundation Discovery Partner Fellowship.
References
Supplementary materials
Supplementary Data
This web only file has been produced by the BMJ Publishing Group from an electronic file supplied by the author(s) and has not been edited for content.
Footnotes
Twitter @drpeterlau, @Smith_Lorey, @RamyarMolania, @kortnye_s, @DrDamienKee, @bensolomon1, @McArthurGrant
Presented at Aspects of this work were previously presented at the Society of Melanoma Research Annual Scientific Meeting, Salt Lake City 2019 and European Society of Medical Oncology Congress 2020.
Contributors All authors were involved in the data collection and contributed to the writing of the manuscript. PKHL, BR, LS, RM, CA, RJY, HAY, IAV, PJN, KES, TP, BJS, SS and GAM contributed to data acquisition and experimental design of the translational studies. PKHL, AL, KS, AW, DKe, PB, BL, AI, DKo, KD, SS and GAM contributed to data acquisition of the clinical data. PKHL, TP, SS and GAM conceived the clinical and translational studies.
Competing interests PKHL has received honoraria (Bristol-Myers Squibb, Pfizer) and support for meeting attendance (Merck Sharp and Dohme). DKe has received honoraria (Merck Sharp and Dohme, and Bristol Myers Squibb), support for meeting attendance (MSD) and fees for advisory board (Novartis and Merck). PB has received honoraria (Novartis) and received support for meeting attendance (Merck Sharp and Dohme). DKo has received support for meeting attendance (Merck and Pfizer). PS has received grants (Bristol-Myers Squibb, Roche/Genentech, Allergan, Compugen, Beigene and Crispr Therapeutics), support for meeting attendance (Bristol-Myers Squibb, Roche/Genentech and Astra Zeneca) and advisory board (Bristol-Myers Squibb). BS has received honoraria and fees for advisory board (Bristol-Myers Squibb, Merck Sharp and Dohme, AstraZeneca, Pfizer, Roche/Genentech, Amgen, Lilly, Amgen and Sanofi/Regeneron) SS has received grants (Novartis, Advanced Accelerator Applications, AstraZeneca, Merck Sharp and Dohme, Amgen and Genentech) and personal fees donated to the institution (AstraZeneca, Merck Sharp and Dohme, Bristol Myers Squibb and AstraZeneca) outside the submitted work. GAM has been a consultant or advisor (Provectus), received research funding from (Pfizer, Celgene, and Ventana) and has had travel accommodation and expenses paid (Roche and Novartis). No stated competing interests: BF, LS, AL, RM, KS, AW, CA, BL, RJY, AI, HAY, IAV, KD, KES and TP.
Provenance and peer review Not commissioned; externally peer reviewed.
Supplemental material This content has been supplied by the author(s). It has not been vetted by BMJ Publishing Group Limited (BMJ) and may not have been peer-reviewed. Any opinions or recommendations discussed are solely those of the author(s) and are not endorsed by BMJ. BMJ disclaims all liability and responsibility arising from any reliance placed on the content. Where the content includes any translated material, BMJ does not warrant the accuracy and reliability of the translations (including but not limited to local regulations, clinical guidelines, terminology, drug names and drug dosages), and is not responsible for any error and/or omissions arising from translation and adaptation or otherwise.