Article Text

Abstract
Background Individualized neoantigen-specific immunotherapy (iNeST) requires robustly expressed clonal neoantigens for efficacy, but tumor mutational heterogeneity, loss of neoantigen expression, and variable tissue sampling present challenges. It is assumed that clonal neoantigens are preferred targets for immunotherapy, but the distributions of clonal neoantigens are not well characterized across cancer types.
Methods We combined multiregion sequencing (MR-seq) analysis of five untreated, synchronously sampled metastatic solid tumors with re-analysis of published MR-seq data from 103 patients in order to characterize their globally clonal neoantigen content and factors that would impact neoantigen targeting.
Results Branching evolution in colorectal cancer and renal cell carcinoma led to fewer clonal neoantigens and to clade-specific neoantigens (those shared across a subset of tumor regions but not fully clonal), with the latter not being readily distinguishable in single tumor samples. In colorectal, renal, and bladder cancer, most tumors had few globally clonal neoantigens. Prioritizing mutations with higher purity-adjusted and ploidy-adjusted variant allele frequency enriched for globally clonal neoantigens (those found in all tumor regions), whereas estimated cancer cell fraction derived from clustering-based tools, surprisingly, did not. Neoantigen quality was associated with loss of neoantigen expression in the bladder cancer case, and HLA-allele loss was observed in the renal and non-small cell lung cancer cases.
Conclusions We show that tumor type, multilesion sampling, neoantigen expression, and HLA allele retention are important factors for iNeST targeting and patient selection, and may also be important factors to consider in the development of biomarker strategies.
- antigens
- neoplasm
- biomarkers
- tumor
- clonal selection
- antigen-mediated
- urinary bladder neoplasms
- computational biology
Data availability statement
Data are available on reasonable request. All data relevant to the study are included in the article or uploaded as supplementary information. Most data is available in our text, but additional would be available upon request.
This is an open access article distributed in accordance with the Creative Commons Attribution Non Commercial (CC BY-NC 4.0) license, which permits others to distribute, remix, adapt, build upon this work non-commercially, and license their derivative works on different terms, provided the original work is properly cited, appropriate credit is given, any changes made indicated, and the use is non-commercial. See http://creativecommons.org/licenses/by-nc/4.0/.
Statistics from Altmetric.com
- antigens
- neoplasm
- biomarkers
- tumor
- clonal selection
- antigen-mediated
- urinary bladder neoplasms
- computational biology
Introduction
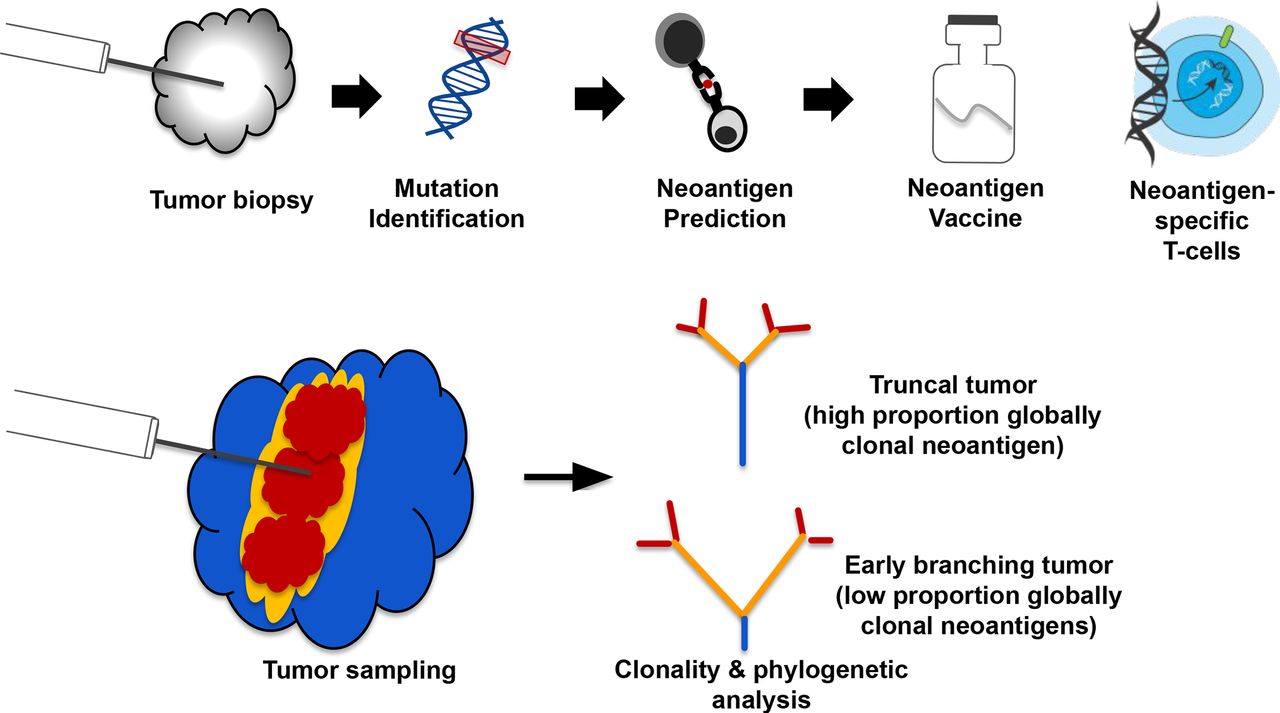
Tumor neoantigens are mutant peptide sequences that arise from expressed somatic mutations and can mediate antitumor T cell responses when presented on Major Histocompatibility Complex (MHC) molecules. The vast majority of neoantigens correspond to private passenger mutations,1 2 meaning they are unique to a given tumor and have unknown functional consequences. Several types of individualized cancer immunotherapies have been under development in recent years, with a major modality being neoantigen vaccines.3–5 These immunotherapies typically use a single tumor biopsy for identification of tumor mutations, which are then translated into mutant peptide sequences that are fed into MHC binding/presentation prediction algorithms. These predictions allow the selection of specific patient-derived tumor neoantigens, which then inform the design of a customized therapeutic (figure 1A) such as genetically modified neoantigen-specific T cells or a neoantigen vaccine.

An example of a neoantigen-specific immunotherapy (iNeST) workflow, and neoantigen heterogeneity analysis by multiregion sequencing. (A) Individualized iNeST targets neoantigens, which are unique to an individual’s tumor. A neoantigen vacccine is an example of an iNeST. (B) Mutational heterogeneity in metastatic disease settings may pose a problem for iNeST targeting and efficacy. Mutation/Neoantigen clonality varies across indications, with melanoma and non-small cell lung carcinoma having low heterogeneity (highly clonal), and colorectal adenocarcinoma, renal cell carcinoma, and breast cancer having high heterogeneity (low clonality). Predominantly primary tumors have been studied in non-metastatic disease setting, so the benefit of global mutation clonality prediction from standard clonality metrics determined using single tumor samples is unclear.
It has been suggested that clonal neoantigens should be targeted for neoantigen-specific immunotherapies to be most effective and to limit tumor escape, as clonal neoantigens are by definition present in every tumor cell.6 However, the clonal composition of metastatic solid tumors remains relatively underexplored, particularly in terms of neoantigen content across lesions at baseline. Indeed, various MR-seq studies have explored somatic mutation distributions across tumor lesions in patients with metastatic disease,7–10 but these studies are often complicated by samples being taken at different surgical time points as well as by intervening treatments. Although computational tools exist that aim to estimate mutation clonality from single biopsies, unambiguously identifying clonal mutations from single tumor biopsies is a challenge due to technical limitations on mutation detection. Identifying globally clonal mutations shared across tumor lesions presents yet another challenge due to clonal heterogeneity within lesions and diverse processes underlying metastatic seeding.11 Here, we use the term ‘clonal’ to refer to mutations inferred to be present in all tumor cells within a single sample or lesion, and the term ‘globally clonal’ to refer to mutations empirically detected across tumor lesions regardless of their variant allele frequency (VAF). In contrast to targetable oncogene alterations such as those in EGFR, ALK, PIK3CA, BRAF, which are typically globally clonal,12 it is unclear how often private passenger mutations are globally clonal. Previous studies suggest that some indications, such as non-small cell lung carcinoma (NSCLC) and melanoma, generally have a high proportion of clonal mutations, whereas other indications such as renal and breast generally have a low proportion of clonal mutations due to branching evolution (wherein clones diverge early from their common ancestor).8 13–15 Advanced disease state and time between surgeries16 as well as prior treatment17 can lead to tumors with high overall mutation burden. As such, tumors with high mutation loads may only have observed high numbers of clonal neoantigens depending on when the earliest clone-branching events occurred, whether there was intervening treatment and whether the sampled lesion captures a large proportion of globally clonal mutations. We therefore sought to characterize clonal neoantigen distributions in untreated primary and metastatic tumors from four solid tumor indications taken at a single time point to address the feasibility and implications of targeting globally clonal neoantigens from single samples.
Assuming that globally clonal neoantigens are preferable for individualized neoantigen-specific immunotherapy (iNeST), several bioinformatics tools and approaches exist to estimate mutation clonality, or cancer cell fraction (CCF). Empirical methods for calculating CCF rely on prior knowledge of genome-wide copy number alterations (CNA) from tumor/normal sequencing data, as well as the associated tumor purity estimates. These methods then normalize the VAF of each mutation to tumor purity and local copy number, with some using conditional probabilities to determine the exact adjustment needed on a mutation-by-mutation basis.10 11 (We refer to the CCF estimates derived from empirical methods as ‘emp-CCF’). Separately, a number of computational tools have been developed that rely on Bayesian clustering of tumor VAFs, adjusted for local copy number and tumor purity, to derive CCF for each mutation (which we refer to as ‘clust-CCF’).18–20 However, it remains unclear how well single-sample VAF, emp-CCF, or clust-CCF correlate with global mutation clonality across tumor lesions. We therefore investigated whether these mutation abundance metrics could predict global mutation clonality from single tumor samples using an MR-seq-based ‘truth set’ of mutations from each patient. We also explored whether tumor sample type (eg, primary vs metastatic) had inherently better or worse predictive value for globally clonal mutations.
Levels of neoantigen presentation by MHC-I are correlated with neoantigen expression, and higher levels of presentation may trigger immune responses that subsequently lead to downregulation or tumorous removal of the mutant allele underlying these immunogenic neoantigens. To generate efficacious iNeST, it is therefore important to understand the prevalence and characteristics of such ‘neoantigen loss’, and how to consider this factor in neoantigen selection. Neoantigen loss can occur via genetic loss of mutations, by loss of mutant allele expression, or by loss of MHC-I presentation, for example, via loss of HLA alleles.14 15 Neoantigen loss has been associated with changes in T-cell receptor clonality and could impact tumor response to immunotherapy.21 However, a systematic and unbiased characterization across lesions in metastatic tumors has been lacking. We therefore explored whether the metastatic solid tumors in our study showed any evidence of neoantigen loss via any of the above mechanisms. Our findings suggest that indication-specific tumor evolution, emp-CCF, and neoantigen loss are important factors in neoantigen targeting, and that additional tumor sampling can help mitigate the limitations of single samples. Our findings have additional implications for the development of biomarker strategies for individualized cancer immunotherapies.
Methods
Clinical sample identification and pathology analysis
Surgical resection cases diagnosed as colorectal adenocarcinoma (CRC), NSCLC, urothelial bladder carcinoma (UBC), or renal cell carcinoma (RCC) between 1992 and 2018 were identified from the pathology database at Northwestern Memorial Hospital. Cases with three or more regions from primary tumor, three or more regions from lymph node metastasis close to the tumor and three or more regions from metastasis distant from the tumor as well as paired normal tissue from a single surgical time point were identified. All patient identifiers were reassigned to protect anonymity. A surgical pathologist reviewed all slides associated with each case, established that regions were located >1 cm from each other based on the gross description and confirmed diagnoses based on morphological and immunohistochemical findings. Estimated viable tumor content (% viable tumor/total epithelial surface area), per cent tumor nuclei (%viable tumor nuclei/total nuclei) and per cent tumor area necrosis (% necrosis/total tumor area) for each case were then estimated by an independent pathologist. Retrospective chart review was performed to identify and capture relevant clinical and demographic information (table 1).
Clinical sample demographics for MR-seq data generation
AVENIO Millisect tissue harvest
Tumor enrichment using AVENIO Millisect automated dissection was performed on all cases. Five of 49 cases demonstrated low tumor content (tumor areas below 30 mm2) and were removed from downstream analyses. These were mostly lymph node metastases. The tissue processing, sequencing and data analysis workflow overview is presented in online supplemental figure 1. Formalin-fixed paraffin embedded (FFPE) tissue blocks were serially sectioned with five sections at 10 µm, followed by five sections at 4 µm, collected onto Superfrost Plus positively charged slides (Thermo Scientific, Runcorn, UK) and allowed to dry at room temperature overnight. Serial section 6 (4 µm) was baked at 60℃ for 30 min and stained with H&E on an automated Leica Autostainer XL using a routine protocol. H&E-stained slides were scanned on a NanoZoomer 2.0 HT whole slide imager (Hamamatsu, Bridgewater, New Jersey, USA) at 20× magnification. Scanned slide images were annotated by a pathologist for tumor regions and digital masks were created as a dissection reference.
Supplemental material
Supplemental material
Tissue sections were dissected using the reference mask image to collect regions of interest using AVENIO Millisect milling tips (Roche Sequencing Solutions, Pleasanton, California, USA), collected with Molecular Grade Mineral Oil (Sigma-Aldrich, St. Louis, Missouri, USA) as dissection fluid and dispensed into nuclease-free 1.5 mL Eppendorf tubes. Dissections from slides one through five were centrifuged for 10 min at 20 000 rpm to pellet tissue. Mineral oil was removed from the tissue pellets and pellets were pooled in a single 1.5 mL Eppendorf tube and held for DNA and RNA dual extraction. Postdissection slides were baked at 60ºC for 30 min and stained with H&E on an automated Leica Autostainer XL using routine protocols and scanned on a NanoZoomer 2.0 HT whole slide imager (Hamamatsu) at 20× magnification in order to confirm that selected tumor regions were successfully removed. DNA and RNA extraction was performed using the Qiagen AllPrep DNA/RNA tissue kit (Qiagen, Germantown, MD) at Q2 Solutions (Valencia, California, USA).
Tumor content ranged from 1% to 90% and tumor input ranged from 2.5 to 1950 mm2 (online supplemental table 1). Surrounding normal tissue and necrotic regions were excluded from capture and analysis (online supplemental figure 2). Matched normal tissue was dissected from separate tissue blocks in regions >5 cm away from any tumor mass for DNA extraction.
Multiregion sequencing and exome data analysis
The quantity of isolated DNA and RNA was determined using a Qubit, and the quality and fragment lengths were confirmed using a BioAnalyzer. DNA sequencing libraries were created with Agilent SureSelectXT and libraries were used for hybridization and capture with SureSelect All Exon V6 bait probes at Q2 Solutions. Whole-exome sequencing (WES) coverage was approximately 75 million 100 bp paired-end reads, yielding an average depth (before removing duplicate reads) of 150× per sample. RNA sequencing (RNA-seq) libraries were generated using the RNA Access platform. Sequencing coverage was approximately 50 million 50 bp paired-end reads per sample. DNA and RNA sequence read alignments were performed using GSNAP,22 which was run within the HTSeqGenie pipeline for sequence read alignment and QC (see https://bioconductor.org/packages/release/bioc/html/HTSeqGenie.html). Full alignment statistics for RNA-seq can be found in online supplemental table 5.
Somatic mutation calling was performed using Strelka V.1.0.1423 and LoFreq,24 and a combined VCF file containing the union of calls from the two callers was generated for each sample. Somatic mutation calls were carefully filtered using read coverage, VAF, allele frequency in normal sample (NAF), and Exome Aggregation Consortium (ExAC) global minor allele frequency (GMAF) criteria such that only high confidence mutations were included in downstream analyses. To be included in downstream analysis, a mutation had to meet the following criteria: VAF ≥0.05 in at least one sample, a coverage minimum of 20 reads in at least one sample, a maximum ExAC GMAF of 0.01, and a maximum NAF of 0.01.
Mutational signatures were generated using the MutationalPatterns R package.25 Clonal copy number analysis was performed using TitanCNA.26 Identification of putative neoantigens was performed using custom code to annotate and translate in silico transcripts containing the mutations to mutant peptide sequences. HLA class I alleles were called from the matched normal exome sequencing data for each patient using HLA-HD.27 Neoepitope presentation was then predicted for tumor-specific peptides of length 8–11 using the eluted-ligand mode of NetMHCpan-4.0.28 HLA genetic loss was identified using a custom algorithm that quantified DNA sequence reads from tumor versus normal as mapped to patient-specific HLA reference sequences.
Sample and sequencing data quality control was performed using several metrics from the sequencing alignments, somatic mutation calls, and copy number calls. For each sample, the number of uniquely mapping reads and cumulative coverage distribution were first examined, followed by VAF distributions, and finally genome-wide logR signal for somatic copy number. Tumor samples that had compressed VAF distribution (median VAF <0.1 and IQR <0.5) or low median logR values when visualized in IGV were removed from the analysis. These QC procedures led to the removal of four lymph node samples from the NSCLC case, as well as one primary tumor region from the CRC2 and RCC cases. All downstream analyses were performed using custom scripts in R.
Phylogenetic analysis
Mutation matrices were constructed for each patient by joining together the VAF values for the mutations called in each tumor region. The VAF values were binarized to a discrete character set (0=absence and 1=presence of the mutation in the sample), and the binarized mutation matrices were used to plot heatmaps and to create mutational trees (figure 2). The full set of input mutations passing the previously described filters was used. An additional germline (GL) sample was introduced as an outgroup containing all zeroes, setting the ancestral state of all the tumor mutations. Tumor mutational phylogenies were constructed with the R package phangorn.29 For each patient, a maximum parsimony tree was generated using the parsimony ratchet method30 implemented in the function phangorn::pratchet(). Branch lengths were determined by the Hamming distance between all the samples involved in a tree as an input to the non-negative least squares method implemented in the function phangorn::nnls.phylo(). Finally, bootstrapping to estimate the confidence of the tree topology values was performed by re-sampling 100 trees from the data using the function ape::boot.phylo() from the ape R package.31 Tree plotting was then performed using standard R functions.
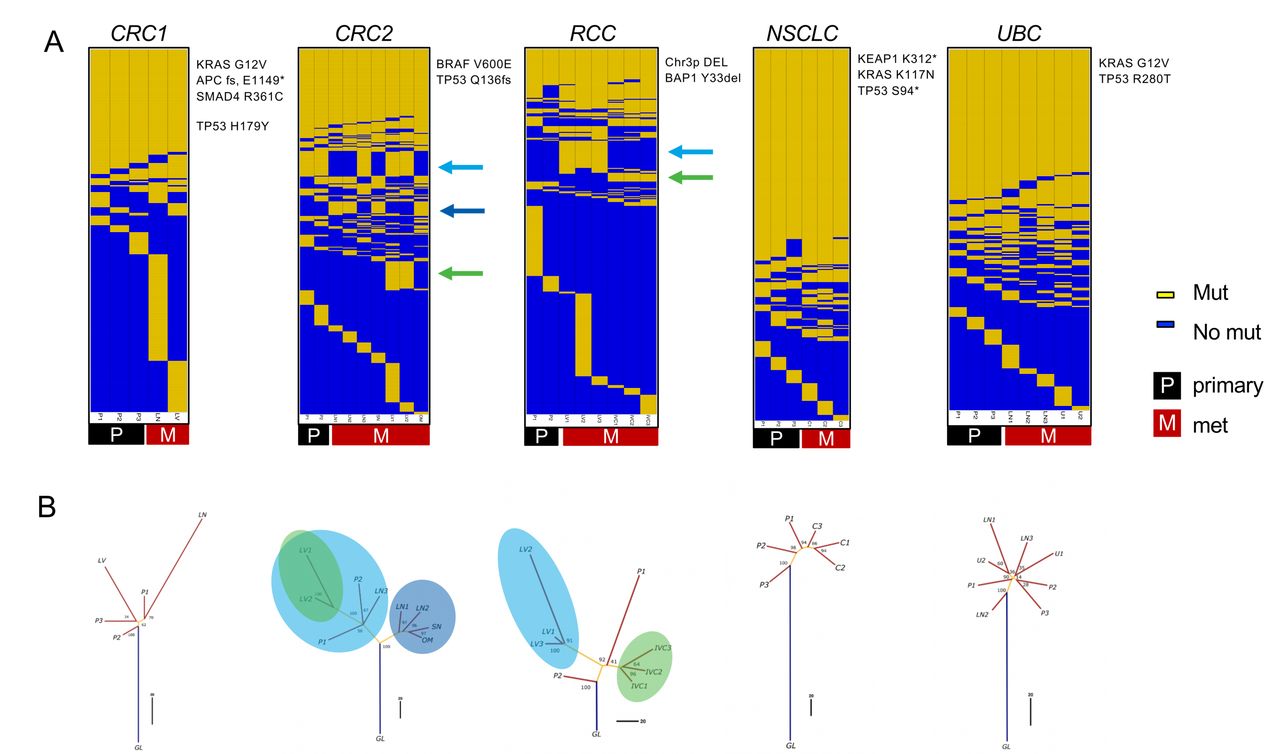
Evolutionary analysis reveals clade-specific neoantigens in colorectal adenocarcinoma (CRC)2 and renal cell carcinoma (RCC) cases. (A) Somatic mutation calls were used to create sorted binarized mutation heatmaps for each case. (B) The mutation data were also used to reconstruct mutational phylogenies of each tumor. The early branching evolutionary pattern in RCC and CRC2 cases contrasts with a more truncal pattern in the non-small cell lung carcinoma (NSCLC) and urothelial bladder carcinoma (UBC) cases. For the RCC and CRC2 cases, the green and blue arrows in (A) and circles in (B) indicate clade-specific mutations shared across multiple tumor regions. C, chest wall met; GL, germline; IV, tumor thrombus; LN, lymph node; LV, liver met; OM, omental met; P, primary; SN, satellite nodule; U, uretal mass.
Global clonality analysis and VAF/CCF comparisons
A mutation was called ‘global’ if it was found in all regions of a given tumor. The per cent global for mutations in each tumor sample was calculated as:
 (1)
(1)
In contrast, the total global fraction (equivalent to the percentage of all unique mutations in a tumor that are shared across all tumor regions) was calculated as:
 (2)
(2)
For the re-analysis of global mutations in published cases, median global neoantigens numbers were estimated using a linear model: lm(global_expr_neo~global_nonsyn_muts). Mutation/Neoantigen numbers from the five patients in the present study were used as input to the model.
For the VAF and CCF metric comparisons, VAF was calculated using the standard approach per mutant site:
 (3)
(3)
emp-CCF was calculated following the method of Turajlic et al10:
 (4)
(4)
where p is estimated tumor purity from TitanCNA, CNn is the total copy number for the overlapping segment in the matched normal sample (assumed to be two in all cases), CNt is the total copy number for the overlapping segment in the tumor sample and CNm is the copy number of the mutant allele. An important exception was that CNm was assigned a fixed integer value for each mutation, using the MajorCN value for the overlapping segment from TitanCNA. In calculating emp-CCF, there were approximately 100 mutations across the five cases where the tumor purity integer CNA values appeared incorrect, and there was no clear way to determine the correct integer copy number (these mutations were removed from the analysis). Additionally, there were approximately 50 mutations where VAF, local copy number and/or tumor purity were incorrect and the CCF values were slightly >1 (we adjusted these to emp-CCF=1).
clust-CCF was determined by providing the combined somatic mutation calls (union) from Strelka and LoFreq and the CNA calls from TitanCNA to phyloWGS V.1.0-rc2.20 PhyloWGS was run with standard parameters, including 1000 burn-in samples and 2500 MCMC samples. The highest likelihood tree was then taken, and the resulting phi values for each cluster were converted to clust-CCF values using phi/max(phi).
Neoantigen loss analysis and RNA expression signatures
Quantification of neoantigenic allele expression was performed using custom R and Python code to count variant and reference allele-containing read pairs. The Python code made use of pysam (https://github.com/pysam-developers/pysam), which wraps samtools.32 The ratio of variant-containing read pairs to total read pairs (ie, RNA VAF) was multiplied by the gene-level RPKM to estimate mutant allele expression. To assess neoantigen expression as a function of neoantigen presentation, the mutant allele expression values were compared for neoantigens with minimum ELmut≤2 (ie, presented) and those with minimum ELmut >2, using Mann-Whitney U tests. The same tests were also performed using alternative allele-containing read depth in lieu of mutant allele expression. Where appropriate, correction for multiple testing was performed using the method of Benjamini and Hochberg.33
RNA-seq data were used to estimate the relative infiltration of B cells, dendritic cells, macrophages, neutrophils, NK cells, CD4 T cells, CD8 T cells, CD8 T-effector cells, Th1 cells and Th2 cells in tumor samples. Gene expression signatures were derived for these cell types using the method by Danaher et al.34 The mean cross-sample-normalized expression values of cell type signature genes was then used as a proxy for the relative infiltration of each cell type. The correlation of the CD8 T cell signature and the immunohistochemistry (IHC) CD8 density estimates was then assessed.
IHC analysis
IHC was performed on 4 μm thick FFPE tissue sections mounted on glass slides. IHC for programmed death-ligand 1 (PD-L1) clone SP263 (Roche Tissue Diagnostics, Tuscan, Arizona, cat 790-4905) was performed on the Ventana Benchmark XT platform. Slides were pretreated with CC1 for 64 min followed by primary antibody incubated for 16 min at 37°C. Antibody was detected with the OptiView DAB IHC Detection Kit.
PanCK and CD8 duplex chromogenic IHC was performed using established methods on the Ventana Discovery Ultra. The fraction of viable tumor cells (%) that express membrane PD-L1 were quantified. The overall immune phenotype was classified as desert (predominantly absent), inflamed (within tumor epithelium), or excluded (within tumor stroma) based on the predominant (>20%) location of CD8+ cells. Quantitative assessment using Visiopharm analysis software selected panCK-positive tumor area to generate an epithelial tumor mask and determine the relative surface area of CD8+ cells within stromal and epithelial tumor compartments. CD8 density categories of absent (0), low (1), moderate (2), or high (3) in intratumoral panCK-positive areas and intratumoral panCK-negative (stromal) areas were also captured and used to calculate H-scores.
Results
MR-seq analysis reveals distinct evolutionary modes across indications and clade-specific neoantigens
Systematically characterizing mutation presence/absence and mutation expression across tumor regions could yield insights into how neoantigens and their related properties are distributed across lesions in patients with metastatic cancer. We used MR-seq to identify somatic mutations (WES), to determine their expression levels (RNA-seq), and to predict neoantigens from the in silico translated mutant peptide sequences across tumor regions. We sequenced 42 tumor regions across 5 patients, including 15 primary regions and 27 regions from metastases, as well as a matched normal sample distant from the tumor from each patient (table 1). Following sample quality control procedures, 36 tumor regions with WES and 35 tumor regions with RNA-seq were used for downstream analyses. Somatic mutation analysis revealed the expected patterns of base substitution and mutational signatures previously established for each indication (online supplemental figure 3).35–39 Several known driver mutations and CNAs commonly associated with each indication were identified in each tumor (figure 2A, online supplemental figure 4), and these alterations were generally globally present across tumor samples.
Phylogenetic analysis of binarized somatic mutations from each tumor identified striking cross-indication differences in how mutations were or were not shared across tumor lesions. We use ‘truncal’ to describe tumors in which a single clone grows out and persists through metastasis and ‘branching’ to refer to multiple mutationally distinct tumor clones emerging early in tumor development (figure 1B). The CRC2 and RCC cases followed a branching evolutionary mode, with low proportions of globally clonal mutations (figure 2A,B). Early branching in these cases led to a relative dearth of globally clonal neoantigens, with 15 in CRC2 and 9 in RCC. In contrast, the NSCLC and UBC cases followed a more truncal evolutionary mode, with higher proportions of globally clonal mutations (online supplemental table 2). The CRC1 case appeared intermediate between these two groups of cases. These results are generally consistent with previous findings in these indications9 40 41 with the exception of UBC, which may remain more complex.
Notably, the CRC2 and RCC cases each harbored sets of clade-specific shared mutations that were shared by distinct tumor lesions and regions. In the RCC case, there were 36 clade-specific mutations (10 clade-specific neoantigens): 28 mutations (7 neoantigens) were exclusive to the liver met, and 8 mutations (3 neoantigens) were exclusive to the tumor thrombus. In the CRC2 case, there were 74 clade-specific mutations (15 clade-specific neoantigens): 14 mutations (3 neoantigens) were exclusive to the LN1, LN2, OM, and SN mets, 28 mutations (5 neoantigens) were exclusive to the primary regions, LN3 and liver met, and an additional 32 mutations (7 neoantigens) were exclusive to the liver met. Thus, considering clade-specific neoantigens in addition to globally clonal neoantigens would effectively double the total set of neoantigens shared across tumor regions in both of these cases.
Relatively low numbers of globally clonal neoantigens are found across RCC, CRC, and UBC
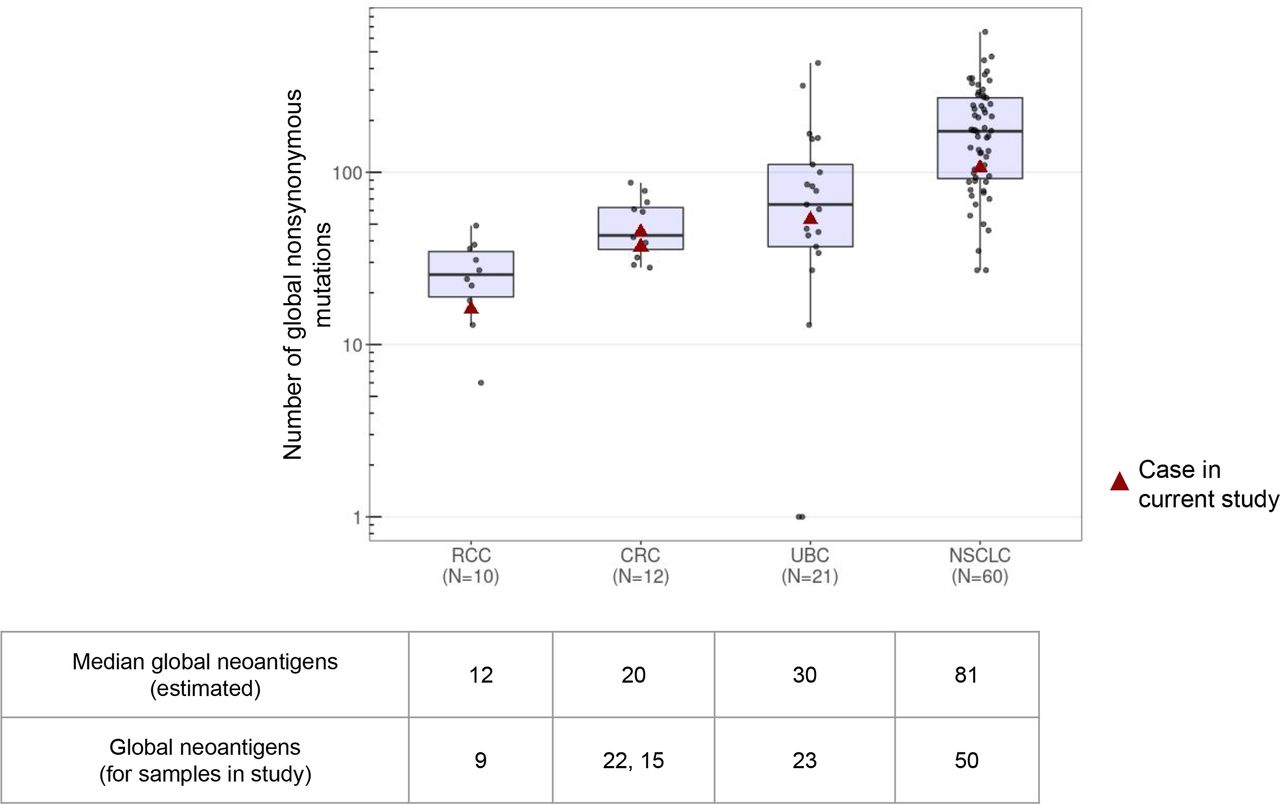
MR-seq provides an ability to measure both the total numbers and the proportions of globally clonal neoantigens across indications. We re-analyzed 103 MR-seq cases from several previous studies to determine how the number of globally clonal neoantigens varies across samples and across indications.9 40 42–45 We found that the numbers of global non-synonymous mutations varied nearly sevenfold across indications: RCC (median=25.5), CRC (median=43), UBC (median=65), and NSCLC (median=173) (figure 3). We then inferred which of these mutations would represent likely neoantigens, and found that the median number of global neoantigens in these indications ranged from 12 in RCC to 81 in NSCLC. CRC and UBC were intermediate, but notably the UBC tumors had surprisingly low numbers of global neoantigens. The numbers and trends were similar for the cases in our current study. Additionally, the IQR for global mutations/neoantigens was greater for UBC and NSCLC than for RCC and CRC. A caveat of this analysis is that we were not able to match disease stage across indications, with NSCLC in particular having almost no published metastatic MR-seq cases.

Distributions of global coding mutations across indications. The absolute numbers of global mutations per tumor were determined from published multiregion sequencing studies (limited to cases with at least three tumor regions). Mutation data were collected from Hu Nat Gen 2019, Jamal-Hanjani NEJM 2017, Gerlinger Nat Gen 2014, Lamy Cancer Res 2016, Faltas Nat Gen 2016, Heide J Pathol 2019. The five cases from the present study are indicated by red triangles. Note that all published non-small cell lung carcinoma (NSCLC) cases were non-metastatic and there was some intervening treatment in the urothelial bladder carcinoma (UBC) studies. *The median global neoantigens per indication for previously published cases was estimated from the global neoantigen numbers in the current study using a linear model (see ‘Methods’ section and online supplemental table 2). CRC, colorectal adenocarcinoma; RCC, renal cell carcinoma.
Proportions of globally clonal mutations differ when sampling single primary versus single metastatic tumor sites
Because most iNeSTs rely on upfront identification of somatic mutations, we sought to understand how well a given tumor sample could capture globally clonal mutations. We considered the set of mutations found in all samples from a given patient to represent the globally clonal set and then asked what percentage of the mutations found in a given tumor sample were in that set (figure 4A, see Eq. 1 in ‘Methods’ section). We note that the percentage of mutations that are global per sample (‘per cent global’) is equivalent to the predictive value of that tumor sample for the identification of globally clonal mutations. Thus, a tumor sample with 60% global mutations would yield a ~60% probability of identifying a global mutation when choosing randomly. Samples with a higher percentage of global mutations should therefore have an inherently higher likelihood of yielding global neoantigen targets for immunotherapy.
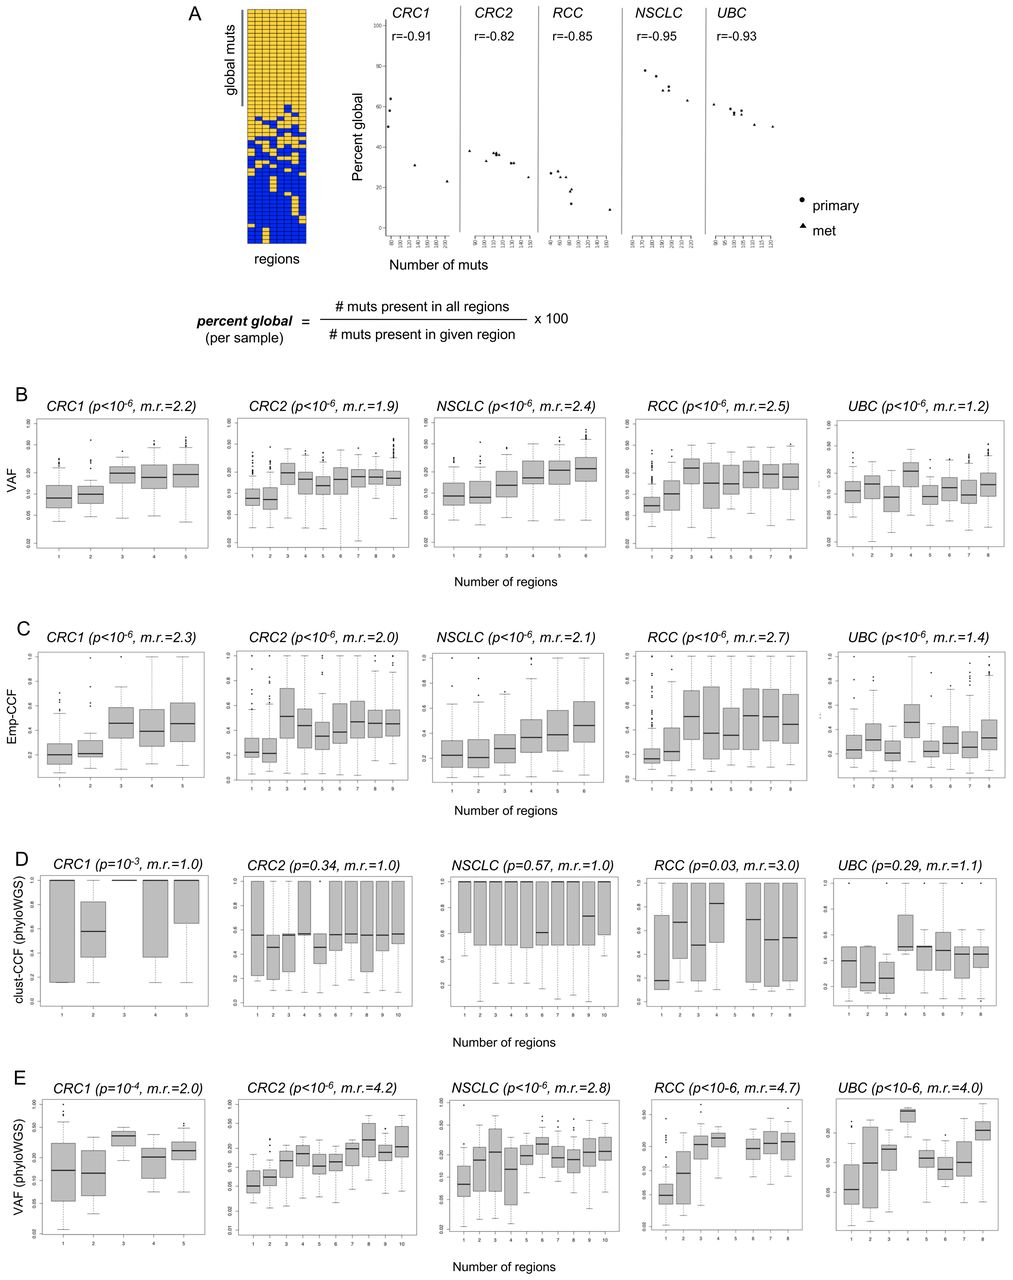
Predictive value of individual tumor samples for globally clonal mutations, and comparison of variant allele frequencies (VAF), emp-cancer cell fraction (CCF), and clust-CCF with mutation presence across tumor regions. (A) Multiregion sequencing (MR-seq) can inform tissue sampling for neoantigen-specific immunotherapy (iNeST). The ‘per cent global’ statistic can also be used as a measure of predictive value for each tumor region for globally clonal mutations (those found in all regions). Primary samples generally had higher predictive value for clonal mutations than metastasis samples did. Mets tended to have more mutations (p=0.03), consistent with later clone emergence. Some lymph node samples suffered from severe underdetection of mutations due to inadequate tumor tissue area, and were removed from all analyses (see ‘Methods’ section). (B) VAF are plotted for mutations found in different numbers of regions for each case. The VAF distribution for singleton mutations (those found in just one region) are at the left-most x-axis position, and the VAF distribution for globally clonal mutations (those found in all regions) are at the right-most x-axis position of each box plot as the number of regions increases from left to right on the x-axis. The p value from a Kruskal-Wallis test (VAF ~num_regions) is indicated in parentheses next to each case name, as well as the ratio of median VAF for clonal mutations divided by the median VAF for singleton mutations (‘m.r.’). (C) Empirical cancer cell fractions (emp-CCF), as calculated using Eq. 4 (see ‘Methods’ section) are plotted for mutations found in different numbers of regions for each case. Results from similar analyses as performed in (B) are shown, with p values from Kruskal-Wallis tests (emp-CCF ~num_regions). (D) Cancer cell fractions (CCF) determined by phyloWGS are plotted for mutations found in different numbers of regions for each case. Results from similar analyses as performed in (B) and (C) are shown, with p values from Kruskal-Wallis tests (clust-CCF ~num_regions) and the ratio of median clust-CCF for global mutations divided by the median VAF for singleton mutations (‘m.r.’). (E) VAF from the set of mutations passed to phyloWGS are plotted for mutations found in different numbers of regions for each case.
The per cent global for each sample tended to vary across samples and patients and was also associated with indication (figure 4A). Across the five cases, the median per cent global varied from 20% in the RCC case to 70% in the NSCLC case. Per cent global was also negatively correlated with the number of mutations per sample, suggesting that samples with fewer mutations may yield a higher proportion of global neoantigens on average. In the CRC1 and NSCLC cases, primary samples tended to have fewer mutations and higher per cent global, whereas metastasis samples tended to have more mutations and lower percent global. Although this trend did not clearly hold across the other cases, it was notable that all but one primary sample had at or above the median per cent global mutations across all five cases. Finally, the lymph node metastases in the NSCLC case likely suffered from severe mutation underdetection due to inadequate tumor input secondary to low tumor area in the sample (online supplemental figure 2 and online supplemental table 1).
It has been suggested that sequencing a second tumor sample can help enrich global mutations.46 We tested how consistently second samples would enrich for global mutations using mutation set analysis (online supplemental figure 5). Although a second sample would help at least modestly in all five cases, it led to the best enrichment of global mutations in the CRC1 case, which had numerous singleton mutations, or mutations found in only one tumor region. In the CRC2 and RCC cases that demonstrated a moderate number of singleton mutations, sequencing a second sample would enrich both global mutations and clade-specific mutations. The NSCLC case harbored relatively few singleton mutations across samples, and a second sample would have only marginal benefit. Sequencing an additional tumor sample in some indications could therefore help, but does not readily allow one to distinguish clade-specific mutations from global mutations.
VAF and emp-CCF, but not clust-CCF, can enrich for globally clonal neoantigens in single tumor samples
We next asked whether standard mutation abundance metrics, as determined from single samples, could be used to enrich for global mutations. Single-sample VAF was compared with the number of regions in which a mutation was present. As expected, higher VAF was significantly associated with mutation presence in multiple regions across all five cases (figure 4B). Global mutations had median VAF ranging from 1.2-fold to 2.5-fold higher than that of singleton mutations, suggesting that VAF alone could enrich global mutations in single tumor samples. We next compared emp-CCF with the number of regions in which a mutation was present. Higher emp-CCF was significantly associated with mutation presence in multiple regions across all five cases, and global mutations had median emp-CCF ranging from 1.4-fold to 2.7-fold higher than that of singleton mutations (figure 4C). This suggested that emp-CCF may be marginally better at enriching for singleton mutations than VAF, but with important technical caveats related to tumor purity and local copy number estimation (see ‘Methods’ section).
Surprisingly, clust-CCF values were poorly associated with mutation presence in multiple regions, and median clust-CCF was not substantially higher among global mutations compared with singletons except in the RCC case (figure 4D). Although many somatic mutations had to be dropped from this analysis due to the requirement for overlapping copy number segments in all tumor regions (see ‘Methods’ section), we note that this did not explain the poor association of clust-CCF with global mutation clonality, as VAF from the same subset of mutations was still robustly associated with global mutation presence across all five cases (figure 4E).
The presence of even minimal mutant allele expression significantly enriched for globally clonal mutations (online supplemental table 2). Across all five cases, comparisons of the total global fraction (see Eq. 2 in ‘Methods’ section) for expressed mutations versus for all mutations suggested that the presence of mutant allele expression in a tumor sample provided a robust enrichment of global mutations (CRC1: OR=3.7, p=10−5; CRC2: OR=2.3, p=5×10⁻⁴; NSCLC: OR=1.8, p=2×10⁻³; RCC: OR=3.0, p=9×10⁻⁴; UBC: OR=2.5, p=10−4 by Fisher’s exact test).
Evidence for PD-L1 and CD8 heterogeneity
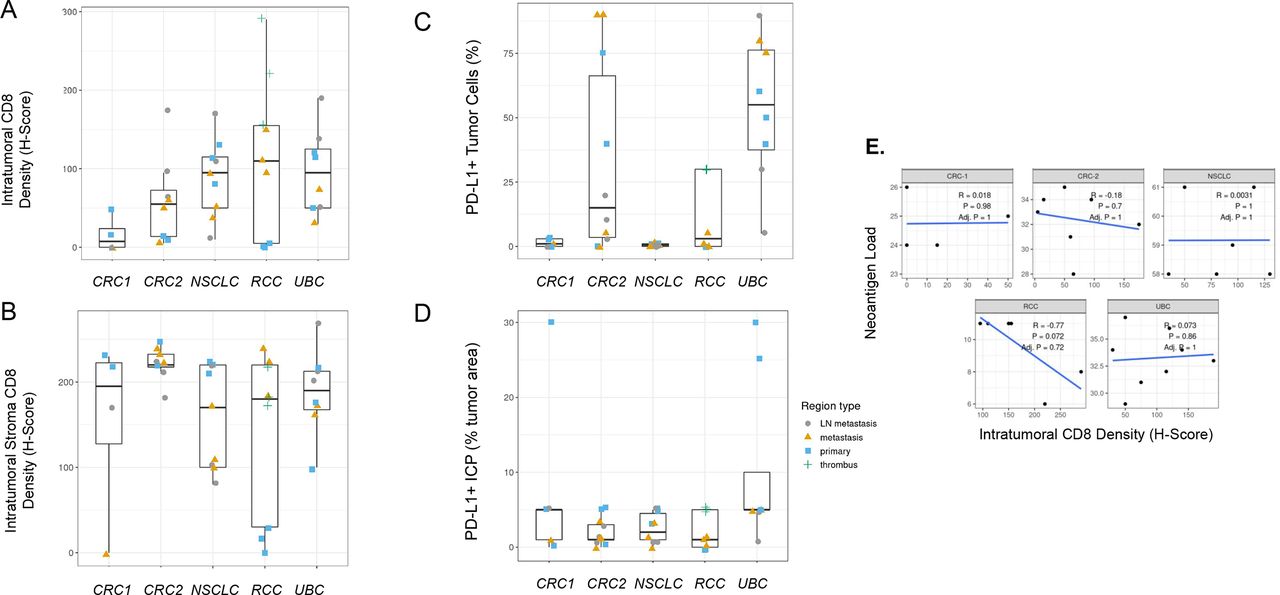
It has long been recognized that levels of CD8+ T cell infiltration and PD-L1 expression within the tumor microenvironment provide important information regarding patient prognosis and likelihood of treatment response. Although thorough investigations into each of these biomarkers across several indications has been done,47 48 to our knowledge, analysis of differences across primary and metastatic regions at a single time point has not been performed. We therefore investigated tumor CD8 levels and CD8+ T cell localization as well as PD-L1 tumor and immune cell expression by immunohistochemistry. We detected significant PD-L1 tumor and immune cell expression heterogeneity across both primary and metastatic regions and in some tumors in multiple indications (figure 5C,D). In the UBC case in particular, regional PD-L1 variability was present and would have impacted histopathological classification based on standard scoring algorithms for UBC, an indication where scoring could impact treatment decisions; however, only one region for this case (a lymph node metastasis with <25% tumor cell PD-L1 expression) would have produced scores leading to a different treatment decision for the patient. Intraepithelial and intrastromal CD8 density was also heterogeneous across regions, but primary or metastatic regions tended to demonstrate similar levels of intraepithelial or intrastromal CD8 cell infiltration in some cases (figure 5A,B). Interestingly in the RCC case, CD8 intraepithelial and intrastromal content was higher in regions of tumor thrombus and metastatic regions compared with primary regions, which could support branching evolution in the development of these distinct regions or represent less well-established immunosuppression (figure 5A,B). Estimated neoantigen load was not significantly correlated to tumor intraepithelial CD8 levels assessed by H-score (figure 5E), with the RCC case being a possible exception.

Programmed cell death ligand 1 (PD-L1) and CD8 immunohistochemistry (IHC) heterogeneity across indications. (A) Intratumoral CD8 T-cell density and (B) intratumoral stroma CD8 T-cell density across regions of each tumor by IHC H-score demonstrate that heterogeneity across regions may influence interpretations from single region analysis. (C) PD-L1-positive tumor cells across cases by IHC (SP263 clone) show that region-to-region variation in PD-L1 IHC signal can impact interpretation of immune phenotype for a tumor, but this would have impacted a treatment decision in only one urothelial bladder carcinoma (UBC) region that shows <25% of tumor cells positive. (D) The per cent of tumor area occupied by PD-L1-positive tumor-associated immune cells (immune cells present (ICP)) across cases were generally less heterogeneous but demonstrated large differences in a few regions. (E) Neoantigen load correlation to tumor intraepithelial CD8 levels assessed by H-scores across regions for each case lacked statistical significance. Neoantigen load is the number of neoantigenic mutations with evidence for expression in any tumor region.
Neoantigen loss in NSCLC, RCC, and UBC cases occurs via distinct mechanisms
Previous studies have suggested that neoantigens can become depleted in untreated tumors via genomic deletion or expression downregulation to enable tumor escape following immune recognition.15 We systematically examined the five metastatic cases for evidence of neoantigen loss by mutation loss via CNA (genomic deletion or loss of heterozygosity [LOH] spanning the mutation), loss of mutant allele expression, and genetic loss of class I HLA alleles. We first looked for neoantigenic mutations (those giving rise to peptides with minimum ELmut scores <2) with overlapping copy number loss alterations in multiple tumor regions. We required that either the mutation VAF be reduced in regions harboring the CNA loss, or that the CNA be in mutually exclusive tumor regions relative to the neoantigenic mutation. Overall, there were relatively few instances of genetic neoantigen loss, although at least one neoantigenic mutation found in one tumor region of the NSCLC primary was lost from a metastasis region as well as other primary regions due to copy number loss (online supplemental table 3). Similarly, there were a few neoantigens that were present in the RCC primary tumor but lost in all regions of the liver metastasis. These apparent neoantigen losses represented a small proportion of the total neoantigens in these cases, and overall neoantigenic mutations were not enriched in regions of CNA loss relative to all non-synonymous mutations. This observation held true whether RNA-seq support for the alternative allele was disregarded (online supplemental table 3A), or required (online supplemental table 7A).
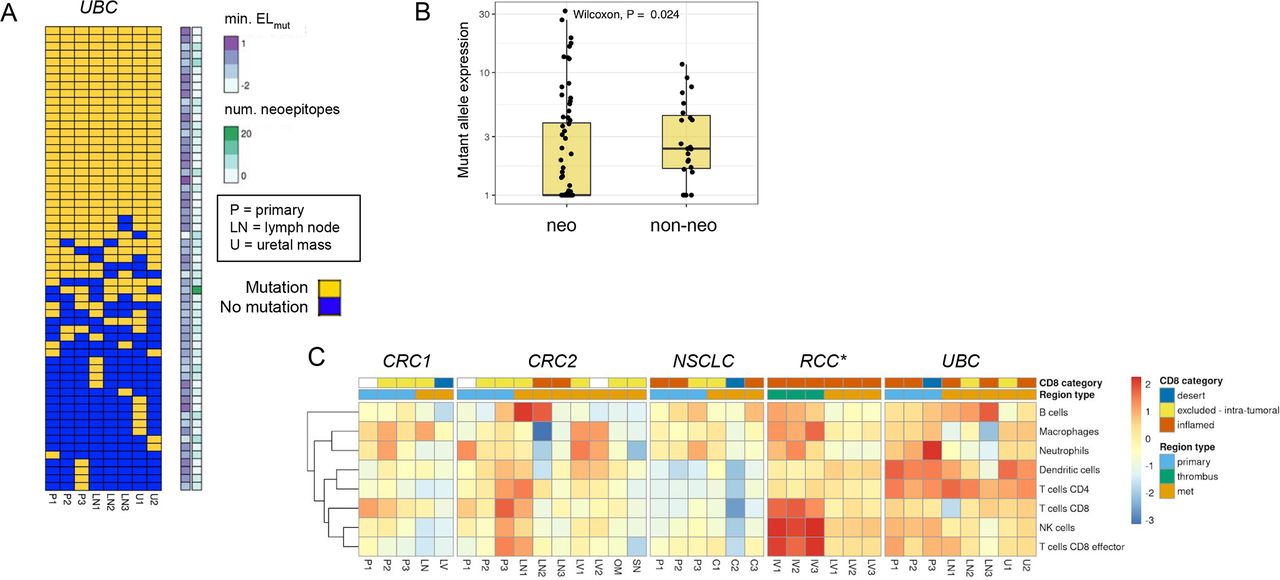
We next looked for expression loss of neoantigens using two approaches. We first looked for variable mutant allele expression across regions of each tumor to determine if there was a clear trend where non-primary regions had significantly lower expression than primary regions. We did not find substantial evidence for neoantigen expression loss using this approach. We next looked for association of mutant allele expression with neoantigenic status, and we found a significant trend in the UBC case where neoantigenic mutations had consistently lower expression across tumor regions than non-neoantigenic mutations (figure 6A,B). This trend could be observed either in aggregate or when looking across individual UBC tumor regions, and was statistically significant in three of eight regions (online supplemental figure 6A). One of eight regions retained statistical significance after correction for multiple testing (online supplemental table 6A). With use of raw alternative allele-supporting read counts as an alternative metric, 7/8 of the comparisons were significant after multiple testing correction (online supplemental figure 6B), (online supplemental table 6B). These results suggested that the UBC tumors may have employed neoantigen expression loss as a mechanism to evade immune surveillance. We identified 14 candidate neoantigens that were shared across tumor regions and appeared to mediate the loss effect, as when these neoantigens were removed the trend largely disappeared in all tumor regions (online supplemental table 3, online supplemental figure 7). Notably, we did not observe similar neoantigen loss trends in any of the other four cases (online supplemental figure 8). We also found a consistent gene expression signature of inflammation in the UBC samples composed of dendritic cells and CD4 T cells (figure 6C), consistent with immune-based selection driving neoantigen loss as has been previously observed15 despite heterogeneity in the CD8-based IHC classification. We looked for evidence of similar neoantigen loss in two independent UBC cohorts, the TCGA BLCA cohort,38 and the IMvigor210 clinical trial cohort.49 In the IMvigor210 cohort, tumors with putative neoantigen expression loss were present but relatively rare (5%–8%, online supplemental figure 9A–C. This rarity was not surprising as most tumors may harbor only one or two strongly immunogenic neoantigens, whereas a tumor would need to have several immunogenic neoantigens undergoing expression downregulation for neoantigen loss to be detected following this approach. The signal of neoantigen loss was also potentially present but less apparent in the TCGA BLCA cohort (online supplemental figure 9D–F).
Neoantigen expression loss and high immune inflammation across tumor regions in urothelial bladder carcinoma (UBC) case. (A) Sorted binary heatmap shows predicted neoantigens from the UBC case. There was no obvious relationship between neoantigen quality scores and neoantigen clonality/truncality. (B) In the UBC case, neoantigenic mutations (‘neo’) had reduced mutant allele expression relative to non-neoantigenic mutations (‘non-neo’). This trend was observed across all tumor regions, and was significant in 3/8 regions. (C) RNA expression signature analysis for immune cell types across tumor regions for each case. The CD8 immunohistochemistry (IHC) category is indicated at top, along with the type of tumor region. There was a consistent signature of inflammation across most UBC tumor samples related to dendritic cells and CD4 T cells. *Note that RNA sequencing (RNA-seq) failed for RCC primary samples, but the CD8 IHC phenotype for these regions was desert.
Finally, we looked across the five cases for evidence of loss of neoantigen presentation via HLA allele loss, which has been shown to be prevalent in NSCLC.14 Using a custom method for detecting HLA genetic loss, we observed clonal single-allele loss of HLA-A/B/C genes in the NSCLC tumor via copy neutral LOH, and non-clonal single-allele loss of HLA-A/B/C in the liver metastasis of the RCC tumor via genomic deletion (online supplemental figure 10). The NSCLC tumor was only modestly and somewhat heterogeneously immune-cell infiltrated (as assessed by RNA-seq and IHC) across regions (figure 6C), and it also did not have an especially high tumor mutation burden (6.5–7.5 muts/Mb across regions). Interestingly, the immune phenotype of the RCC liver metastasis was inflamed by both IHC and RNA-seq, consistent with the metastasis-specific HLA loss occurring as a result of immune recognition specific to that lesion. For each of these two patients, we tested whether the lost HLA alleles tended to present more neoepitopes than retained HLA alleles. In both cases, there was no significant difference in the number or in the average quality scores of neoepitopes presented by lost versus retained alleles (online supplemental figure 11). We also identified specific neoantigens whose presentation was predicted to be lost due to loss of the presenting HLA allele (online supplemental table 8A,B). We identified eight neoantigens that were substantially expressed and whose presentation was predicted to be lost in the NSCLC tumor (RLF, ECHDC2, DGUOK, ARHGEF4, TTC3, HNRNPDL, PDE5A, ABLIM3), and five neoantigens that were predicted to be lost in the RCC liver metastasis (MACF1, SRGAP1, BRCA1, BAP1, LRP12).
Discussion
iNeST relies on detecting and targeting somatic cancer mutations or neoantigens, but the factors underlying effective neoantigen targeting for antitumor activity are still coming into focus. Here, we have leveraged an unique cohort of untreated solid tumors sampled at a single time point to provide insight into how intratumoral heterogeneity and patterns of tumor evolution across indications impact neoantigen-specific therapies. Our study suggests that a thorough understanding of region-to-region genetic variation in tumors may be important both to maximize the efficacy of iNeST neoantigen targeting strategies and to inform biomarkers for cancer immunotherapy.
It is commonly assumed that, to ensure efficacy, iNeST should preferentially target clonal neoantigens, as they occur in all tumor cells. Our results suggest that a more nuanced ‘clonality strategy’ may be necessary. They highlight that the prevalence of clade-specific neoantigens in certain indications, the utility of emp-CCF to enrich for globally clonal neoantigens from single tumor samples, and the possibility of reduced expression levels of immunogenic neoantigens are all important considerations. Our cross-indication phylogenetic analyses demonstrate that focusing on clonal neoantigens would likely be effective in metastatic NSCLC, as this indication has an abundance of clonal neoantigens. Owing to the high number of clonal neoantigens in melanoma, we expect this to hold true in that indication as well. However, in indications with lower neoantigen loads and in which early branching evolution is common, such as RCC and CRC, tumors tend to harbor small numbers of clonal neoantigens. The early branching evolution of these tumors can lead to relatively large numbers of clade-specific neoantigens, representing over half of all shared neoantigens in two of the tumors in our study (CRC2 and RCC). Thus, our results suggest that prioritizing high VAF mutations based on single sample sequencing in order to target clonal neoantigens would overlook many targetable clade-specific neoantigens that were not present in that sample, particularly in RCC and CRC.
The standard clonality metric, CCF, can either be calculated empirically using linear normalization of VAF to tumor purity and copy number, or estimated with informatics tools that rely on Bayesian clustering of VAF and also generally adjust for tumor purity and local copy number. In our comparisons of these metrics, VAF and emp-CCF appeared largely equivalent, with emp-CCF having marginally better association with global mutation clonality (figure 4B,C). An important caveat is that CCF was not evaluable for some mutations and need for post hoc adjustments in calculating emp-CCF due to the requirement for overlap of mutations and CNA calls, and also due to potentially incorrect estimation of VAF, integer CNA values, and/or tumor purity (CNm in Eq. 4, see ‘Methods’ section). In most tumors, only a small percentage of mutations require VAF adjustment by local copy number. In contrast, clust-CCF performed poorly in our comparisons with global mutation clonality. We suggest that the analytical process (including VAF and copy number estimation by upstream tools) and the clustering methodology of most clonality estimation tools is brittle and susceptible to frequent errors in subclone quantification or mutation assignment given noisy sequencing data. Even with the enriched tumor material, as well as carefully curated sample and data quality, clust-CCF still under-performed in predicting global mutation clonality. An important distinction between emp-CCF and clust-CCF that may partly explain this poor performance is that clust-CCF values within a single sample are effectively discrete whereas emp-CCF values remain continuous. This discretization, when combined with reduced ‘VAF resolution’ due to sample quality issues inherent to FFPE material, may lead to the poor correlation between clust-CCF and the number of regions in which a mutation is present. A potential biological confounder of this analysis is polyclonal tumor evolution, whereby metastases are seeded by multiple clones from the primary tumor leading to the presence of ‘shared subclonal’ mutations across lesions.11 However, this biological phenomenon is expected to reduce the clonality-predictive value of both VAF and CCF. Therefore, either VAF alone or emp-CCF can be used to enrich clonal mutations and neoantigens, and future work is needed toward predictive metrics for globally clonal mutations that result from formally modeling tumor evolutionary processes.
Single tumor samples are most commonly used for biomarker analysis and iNeST therapeutic design. High specimen quality, extensive sampling, and tumor enrichment afforded us a data set capable of shedding more light on the impact of regional sampling in the detection of neoantigens. We found that targeting primary tumors over metastases would give us the highest likelihood of identifying globally clonal neoantigens across indications. Sequencing a second sample can further improve clonal neoantigen detection across indications, with the greatest impact in tumors with early branching. Additionally, samples with low tumor content tended to suffer from mutation underdetection due to insufficient tumor input, and pointed to a tradeoff between sensitivity for mutation detection and enriching for globally clonal mutations. Lymph node metastases were regions most likely to demonstrate small tumor regions resulting in insufficient tumor content or area of harvest for mutation detection in our data set. Therefore, iNeST efforts to target clonal neoantigens may benefit from sampling primary tumor regions that provide the highest level of tumor content and from acquiring a second sample in certain indications (when clinical decision making allows it).
Our systematic characterization of neoantigen quality scores, neoantigen expression, and HLA loss in five metastatic tumors revealed distinct mechanisms with the potential to impact iNeST efficacy. We found minimal evidence for genetic loss of neoantigens via CNA in the five multiregion cases. However, given the limited number of patients examined, genetic neoantigen loss may still occur and further studies with larger sample sizes are warranted. The statistically significant neoantigen expression loss observed in the UBC case, and the related trends in two additional UBC cohorts, suggested that in some patients certain neoantigens may show decreased expression due to immune surveillance and concomitant negative selection imposed on the tumor. The selective loss of neoantigenic mutations and the resulting loss across all tumor regions suggested that the neoantigen loss in this UBC tumor may have been established early in tumor development and largely maintained into metastatic disease. Notably, only 1%–5% of neoantigens are thought to be truly immunogenic,50 and so it may be that only specific neoantigens detected by the immune system relatively early in tumor development are subject to such expression loss and that such immune detection is variable across patients. We identified HLA loss occurring both clonally in the NSCLC case and specific to the liver metastasis in the RCC case. Although both the tumor thrombus and the liver metastasis had an immune-inflamed CD8 IHC phenotype, the liver metastasis did have the highest number of neoantigens overall, suggesting selection for HLA loss in a late-emerging subclone with higher neoantigen diversity.
Unfortunately, peripheral blood mononuclear cells were not available from the patients in our study for testing T-cell responses to tumor neoantigens. We therefore searched available databases and literature for evidence of T-cell responses to neoantigens in our study, but did not find such evidence. We searched for all neoepitopes from these patients’ tumors in STCRDab (http://opig.stats.ox.ac.uk/webapps/stcrdab/), VDJdb (https://vdjdb.cdr3.net/), McPAS-TCR (http://friedmanlab.weizmann.ac.il/McPAS-TCR/), IEDB (https://www.iedb.org/), and dbPepNeo (https://academic.oup.com/database/article/doi/10.1093/database/baaa004/5747759). This combined set of databases amounts to 2266 peptide-HLA pairs with experimentally verified T-cell responses. However, we did not find any neoepitopes from the five patients in our study in these databases. We additionally searched the literature for examples of TCRs reacting to shared neoantigens that have been found in screens for neoantigen-reactive T cells, including the neoantigens KRAS G12V, SMAD4 R361C, TP53 H179Y, BRAF V600E, KRAS K117N, and TP53 R280T. We found examples of patient-derived TCRs for KRAS G12V50 51 SMAD4 R361,52 and BRAF V600.53 However, the patients in our study harboring these mutations did not have the corresponding HLA alleles identified in the aforementioned publications that would be needed to present the corresponding neoepitopes. Therefore, T-cell responses to the neoantigens identified in our study are not able to be identified given the currently available information in the literature. Further studies are needed to explore whether such neoantigen loss impacts tumor response to immunotherapy.
Depending on the level and type of neoantigen loss or HLA loss, one might expect that a given tumor might be primed for response to immunotherapy due to the presence of expanded neoantigen-specific T cells prior to therapy (if neoantigen presentation is reduced just below a threshold required for a robust antitumor response), or the tumor might be rendered refractory to immunotherapy if neoantigen presentation is reduced to a point where it cannot readily be restored. We note that in our study and in previous studies, tumors with signs of immune-editing via neoantigen loss or HLA allele loss tend to be immune inflamed, consistent with the possibility that these tumors could remain responsive to iNeST or checkpoint inhibitor therapy. Taken together, our results suggest the following may be necessary to ensure iNeST efficacy across indications: (1) consider the likely mode of tumor evolution per indication and the inclusion of clade-specific neoantigens in indications with branching evolution such as RCC, (2) consider neoantigens of various expression levels, and (3) consider the presence/absence of the presenting HLA allele in the tumor when prioritizing neoantigen targets. Our efforts to characterize neoantigen qualities and presentation anticipate a broader and deeper collective effort to understand how selective pressures sculpt the tumor neoantigen landscape and ultimately how hallmark patterns of neoantigens correspond to immunotherapy response.
Data availability statement
Data are available on reasonable request. All data relevant to the study are included in the article or uploaded as supplementary information. Most data is available in our text, but additional would be available upon request.
Ethics statements
Patient consent for publication
Ethics approval
Northwestern University Institutional Review Board approved this study on archival human material.
Acknowledgments
We thank Suchit Jhunjhunwala, Lelia Delamarre, Bill Forest and other colleagues for helpful discussions. Funding was provided by Genentech.
References
Supplementary materials
Supplementary Data
This web only file has been produced by the BMJ Publishing Group from an electronic file supplied by the author(s) and has not been edited for content.
Footnotes
Twitter @XimoPechuan
Contributors AAL and OAZ devised the project and the main conceptual ideas. AAL, OAZ, AW, CH, NL, DO, XP-J, TDW, RJ, KK, and G-YY performed the technical work and analyses with the help of RB. AAL, OAZ, and AW wrote the manuscript.
Funding Funding was provided by Genentech.
Competing interests The authors from Genentech are employed by and stockholders of Genentech, Inc.
Provenance and peer review Not commissioned; externally peer reviewed.
Supplemental material This content has been supplied by the author(s). It has not been vetted by BMJ Publishing Group Limited (BMJ) and may not have been peer-reviewed. Any opinions or recommendations discussed are solely those of the author(s) and are not endorsed by BMJ. BMJ disclaims all liability and responsibility arising from any reliance placed on the content. Where the content includes any translated material, BMJ does not warrant the accuracy and reliability of the translations (including but not limited to local regulations, clinical guidelines, terminology, drug names and drug dosages), and is not responsible for any error and/or omissions arising from translation and adaptation or otherwise.