Article Text

Abstract
Background A profound insight into the immune landscape of vulvar squamous cell carcinoma (VSCC) is lacking. Here, an in-depth interrogation of T cell infiltration, local immune contexture, signaling pathways and checkpoint molecule expression was performed in early-stage and late-stage VSCC.
Methods The type, location, and infiltration pattern of T cells were studied in 109 patients with primary VSCC FIGO stage I–III. RNA expression of genes involved in immune oncology and oncogenic signaling pathways was analyzed in 40 VSCC, matched for prognostic clinicopathological variables, analyzed for HPV and p53 status, and selected based on T cell infiltration.
Results High intraepithelial infiltration with CD4 or CD8 T cells was associated with longer overall and recurrence-free survival and formed an independent prognostic factor, outperforming molecular subtype and stage of the disease. Strong T cell infiltrated VSCC displayed a coordinated immune response reflected by a positive association between T cells and different lymphocyte and myeloid cell subsets. The expression of genes involved in the migration of T cells and myeloid cells, T cell activation and costimulation, interferon (IFN)-γ signaling, cytotoxicity and apoptosis was higher than in low infiltrated tumors. An active immune signaling profile was observed in all inflamed, part of the altered-excluded and not in altered-immunosuppressed or deserted VSCC. While several checkpoint molecules were overexpressed, only PD-L1 expression displayed discriminatory ability and clinical usefulness. High PD-L1 expression was detected in all inflamed and ~60% of the altered-excluded VSCC.
Conclusion An active immune signaling profile is present in 35% of primary FIGO I–III VSCCs, suggesting potential responsiveness to neoadjuvant PD-1/PD-L1 immunotherapy.
- immunotherapy
- gene expression profiling
- tumor microenvironment
Data availability statement
Data are available in a public, open access repository. Data are available on reasonable request. All data relevant to the study are included in the article or uploaded as supplementary information.
This is an open access article distributed in accordance with the Creative Commons Attribution Non Commercial (CC BY-NC 4.0) license, which permits others to distribute, remix, adapt, build upon this work non-commercially, and license their derivative works on different terms, provided the original work is properly cited, appropriate credit is given, any changes made indicated, and the use is non-commercial. See http://creativecommons.org/licenses/by-nc/4.0/.
Statistics from Altmetric.com
Introduction
Vulvar squamous cell carcinoma (VSCC) is the predominant histologic type of vulvar cancer.1 VSCC comprise three molecularly defined subtypes: HPV-associated tumors (HPVpos VSCC), HPV-independent tumors with wildtype p53 expression (HPVneg/p53wt VSCC), and those with mutant p53 expression (HPVneg/p53mut VSCC).2 3 HPVpos VSCC display a better overall survival (OS) and a longer recurrence-free period (RFP) than HPVneg VSCC. Local recurrences more often occur after primary treatment in patients with HPVneg/p53mut VSCC than in HPVneg/p53wt VSCC.3 VSCC is currently treated with radical surgery and/or (chemo)radiotherapy, which causes impressive short-term and long-term morbidity.4
In many cancer types and precancerous lesions, a coordinated and dense infiltration with type 1 CD4+ and CD8+ tumor-infiltrating CD3+ lymphocytes (TILs) as well as innate effector cells was positively associated with longer survival and a favorable IFN-γ mediated response to therapy.5–8 The association between strong tumor infiltration with activated T cells and favorable clinical outcomes was also found for a homogeneous group of early-stage VSCC, irrespective of the molecular subtype.9 In addition, we demonstrated that the CD39+ fraction of CD4+ and CD8+ TILs in VSCC comprised tumor-reactive T cells.10 Altogether this suggests that immunotherapy may be a viable treatment option for some patients with VSCC. Indeed, data from basket trials report occasional complete and partial responses as well as stable disease in VSCC after treatment with pembrolizumab or nivolumab.11–14
The response to immunotherapy is affected by many tumor intrinsic and extrinsic mechanisms that bear an impact on the infiltration and functional status of tumor infiltrating T cells.15 For example, alterations in the activity of p53, WNT/β-catenin, STAT3, NFκB, RAS/RAF/MAPK, and PI3K/PTEN/AKT/mTOR pathways have been shown to influence the composition of the tumor microenvironment.16–18 This may well explain why the percentage of strongly infiltrated tumors declined from HPVpos VSCC to HPVneg/p53wt VSCC to HPVneg/p53mut in early-stage VSCC.9 However, a profound insight into the immune contexture and active cancer-associated canonical signaling pathways separating low and high T cell infiltrated VSCC is lacking.
Here we first extended our T cell infiltration analysis in early-stage (FIGO I and II) VSCC to patients with FIGO stage IIIA/B. The latter stage of disease presents with lymph node metastases and is treated by radical inguinofemoral lymphadenectomy, causing additional treatment-related morbidity. Thereafter, a selection of FIGO stage I–IIIA/B VSCC with either high or low T cell infiltration was analyzed by Nanostring technology using the PanCancer IO360 and the PanCancer oncogenic pathway panels. Our data show that T cell infiltration is an independent predictor for survival outperforming molecular subtyping and tumor staging. A strong upregulation of several immune-related pathways and a coordinated response of different immune cell subsets was observed in high T cell infiltrated tumors. These VSCC displayed a strong expression of a variety of checkpoint molecules, including PD-1. Based on their T cell inflamed gene expression profile (GEP) score, a measurement for potential responsiveness to PD-1 checkpoint blockade based on an 18 gene signature representing IFN signaling, cytotoxic effector molecules, antigen presentation, and T cell active cytokines,19 these patients may qualify for (combination) PD-1 checkpoint therapy.
Material and methods
Study cohort and multiplex six color immunofluorescence
Archived formalin-fixed paraffin-embedded (FFPE) tumor tissue from VSCC patients was selected from a large cohort with known HPV and p53 status. Tumors were consequently subclassified as HPVpos, HPVneg/p53wt or HPVneg/p53mut VSCC.2 20 Tumor staging was done according to FIGO staging 2009. A recurrence was defined as a histologically confirmed local or locoregional recurrence after primary treatment. In total, 64 primary early-stage VSCC and 45 late-stage (FIGO IIIA/B) VSCC were all matched for age (40–85 years), ≥8 mm tumor-free margin, no use of immunosuppression, and no documented medical history.
We selected patients with FIGO stage IIIA and IIIB of disease for our analysis and excluded patients with FIGO stage IIIC and IV, because the latter group is associated with significantly worse prognosis21 and could therefore be considered as a separate group. Patient demographics are provided in online supplemental table 1. All included samples were handled according to Helsinki’s declaration. The workflow to study the immune infiltration in FIGO stage IIIA/B VSCC was similar to that described previously for early-stage VSCC.9 Briefly, 4 µm FFPE tissue samples were stained with DAPI, CD3, CD8, Foxp3, PD-1, and pan-keratin. The tissue slides were imaged and semiautomatically quantified with the Vectra 3.0 Automated Quantitative Pathology Imaging System (Perkin Elmer) by using spectral libraries defined with single-marker immunofluorescence detection.9 VSCC can be classified into four categories based on the pattern of T cell infiltration.9 22 23
Supplemental material
Study cohort GEPs
FFPE tissue samples of 42 patients (30 FIGO stage I and II and 12 FIGO stage IIIA/B) with invasive VSCC and known T cell infiltration were used (online supplemental table 2). The group consisted of 12 HPVpos VSCC, 11 HPVneg/p53wt VSCC, and 19 HPVneg/p53mut VSCC, which were divided on the basis of T cell infiltration counts into 19 patients with high and 23 patients with low T cell infiltration. Based on their T cell infiltration pattern, patients were subclassified further into inflamed (n=6), altered excluded (n=13), altered immunosuppressed (n=9), and deserted (n=14) (online supplemental figure 1A,B).9
Supplemental material
Macrodissection and RNA isolation
Routinely FFPE histological specimens were evaluated by a gynecology-expert pathologist, and areas with >70% tumor percentage were annotated. Ten sections of 10 µm thick were cut from the FFPE tissue blocks for RNA extraction. After the sections were deparaffinized, the tumor areas were macrodissected using the marked H&E stained slide as a reference. For RNA extraction, the RNeasy FFPE Kit (Qiagen, Hilden, Germany) was used according to the manufacturer’s instructions. The quality and quantity of the RNA were tested with the BioAnalyzer. Samples were approved for further processing when >20% of the fragments were >300 bp, and the corrected concentration remained >60 µg/µL.
Expression analysis
To measure the GEPs, 300 ng of total RNA samples were hybridized with probes of the PanCancer IO360 and with the PanCancer oncogenic pathway panels (online supplemental table 3) for 17 hours at 65°C, following the manufacturer’s instruction (Nanostring Technologies, Inc, Seattle, Washington, USA). The number of copies of each gene in every sample were counted by scanning 490 Field Of View using the nCounter FLEX system (Nanostring Technologies). The raw data (counts of genes) were uploaded to the nSolver V.4.0 software (Nanostring Technologies), after which a quality check was performed in the gene expression analysis. The housekeeping genes within PanCancer oncogenic pathway panel and the housekeeping genes in the IO360 panel facilitated sample-to-sample normalization. Eight negative controls and six synthetic positive controls were included in both panels. Both panels had 182 genes in common resulting in 548 and 588 non-shared genes in the PanCancer oncogenic pathway panel and IO360, respectively. The data were reviewed for reliability and validity based on the imaging (>0.75) and binding density (0.1–2.25) QC metrics, and performance check of the positive controls (>0.95–1). The data were analyzed using nCounter Advanced Analysis module V.2.0 software (Nanostring Technologies). Automated cell type profiling was performed by the nCounter Advanced Analysis V.2.0 software based on the expression of predefined genes (online supplemental table 4). GraphPad Prism V.7 (GraphPad Software Inc, LA Jolla, California, USA) was used to illustrate the data by graphs together with nCounter Advanced Analysis V.2.0.
PD-L1 immunohistochemistry
We performed one immunohistochemistry (IHC) for PD-L1 expression on FFPE samples. PD-L1 IHC was carried out locally with a protocol used for clinical purposes. Slides were stained with the 22c3 anti-PD-L1 antibody and scored by a trained and blinded pathologists for the combined positive score and tumor positive score.
Statistical analysis
We categorized the number of T cells as high or low based on the best cut-off value (CU) for each subset as determined by receiver operating characteristics curve analysis for each outcome separately. For the expression analysis, Benjamini-Hochberg adjusted p-values were used to decrease the false-discovery rate. We selected genes of interest based on an adjusted p-value <0.05 in combination with a log2 fold change of >1 or ≤−1. The median and 95% CI of the normalized count per significant gene was plotted to check for differences between groups, after which we excluded genes that were not different between the groups. For comparison of DEGs and pathways involved, we used the statistical software package SPSS V.23.0 (SPSS Inc). Two-sided p-values <0.05 were considered significant. Significant differences between two groups were calculated using the log2 fold of the selected genes and an independent t-test. An analysis of variance test was used to calculate differences between >2 groups. The expression of genes in the heatmap were given as log2 transformed values relative to the average value of that particular gene. The T cell inflamed GEP score was calculated based on the weighted sum of 18 genes as previously described.12 24
Results
The number of intraepithelial T cells is an independent prognostic factor for survival that outperforms molecular subtyping and tumor staging
The number of tumor-infiltrating T cells varied highly between the 45 FIGO stage IIIA/B VSCC patients, with some of the VSCC more strongly infiltrated with T cells than others (figure 1A). In comparison with the 64 early-stage VSCC patients, the overall intraepithelial T cell infiltration was lower in late-stage VSCC, and also a lower overall CD8 T cell infiltration was observed (figure 1A). Categorization of the T cell infiltration patterns22 defined 9 (20%) late-stage VSCC as inflamed, 13 (28.9%) as altered excluded, 9 (20%) as altered immunosuppressed and 14 (31.3%) as deserted, a pattern that did not differ much from that in early-stage VSCC patients (figure 1B, online supplemental figure 1A–C). Since both groups of early-stage and late-stage VSCC tumors displayed heterogenous T cell infiltration, all patients were categorized into low or high T cell infiltrated VSCC and subsequently its impact on clinical outcome was determined. High intraepithelial, stromal or total infiltration with CD3+, and CD3+CD8−Foxp3− T cells was strongly associated with longer OS and RFP (figure 1C, online supplemental figure 2), and this was also true for high intraepithelial CD3+CD8+Foxp3− (figure 1C) and CD3+PD-1+ T cell infiltration (online supplemental figure 2). Survival analysis of the patients when grouped according to T cell infiltration pattern revealed that patients with an inflamed or altered-excluded T cell pattern displayed superior OS (online supplemental figure 1D). Subsequently, the impact of the intraepithelial T cells in clinical outcome was corrected for stage as well as p53 and HPV status. In the multivariate analysis, the CD3+, CD3+CD8−Foxp3− and CD3+CD8+Foxp3− T cell counts were all correlated with OS and RFP. However, CD3+CD8+Foxp3− T cells were not correlated with RFP. Notably, stage and molecular subtypes were not associated with OS and RFP when corrected for immune infiltration (online supplemental table 5).
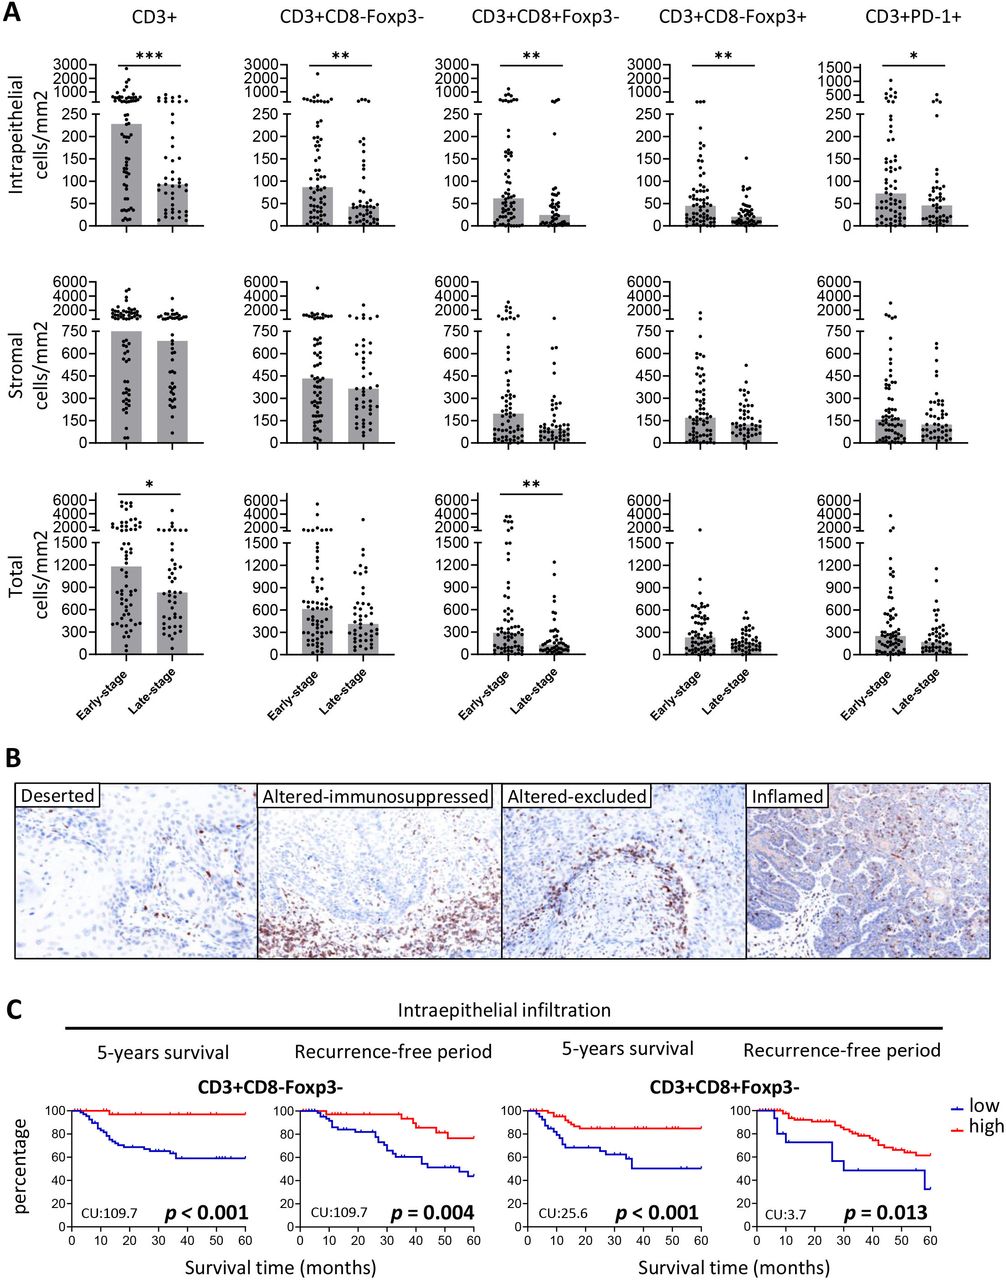
Intraepithelial and stromal T cell counts in early-stage and late-stage VSCC. (A) The number of intraepithelial (top), stromal (middle) and total (bottom) T cells/mm2 for early-stage (FIGO1A/B; n=64) and late-stage (FIGO IIIA/B; n=45) VSCC patients. The bars represent the median T cell counts, and individual cases are indicated by solid circles. Statistical differences were calculated with a non-parametric Wilcoxon rank-sum test. *P<0.05, *p<0.01, ***p<0.001. (B) VSCC can be classified into four categories based on the pattern of T cell infiltration.9 22 23 Depicted are four representative examples of T cell infiltration patterns: deserted (left), altered immunosuppressed (middle-left), altered excluded (middle-right), and inflamed (right). (C) Kaplan-Meier curves showing overall survival and the recurrence-free period for VSCC patients with high (red) and low (blue) numbers of indicated intraepithelial CD3+CD8−Foxp3− and CD3+CD8+Foxp3−. High and low groups are based on the best cut-off value (CU) for each subset as determined by receiver operating characteristics curve analysis for each outcome separately. CU values were displayed in the low left corner of each Kaplan-Meier curve. Significant differences p<0.05 were shown in bold. VSCC, vulvar squamous cell carcinoma.
Minor differences in cancer-associated canonical signaling pathways and immune signature between molecular subtypes of VSCC
A selection of 42 VSCCs, balanced with respect to T cell infiltration, T cell pattern and molecular subtype (online supplemental table 2), was used to analyze the expression of genes associated with cancer-associated canonical signaling pathways (PanCancer pathway panel) or with immune-related pathways (PanCancer IO360 panel). Two samples (#26 and #36) failed the quality control due to low binding density and were excluded.
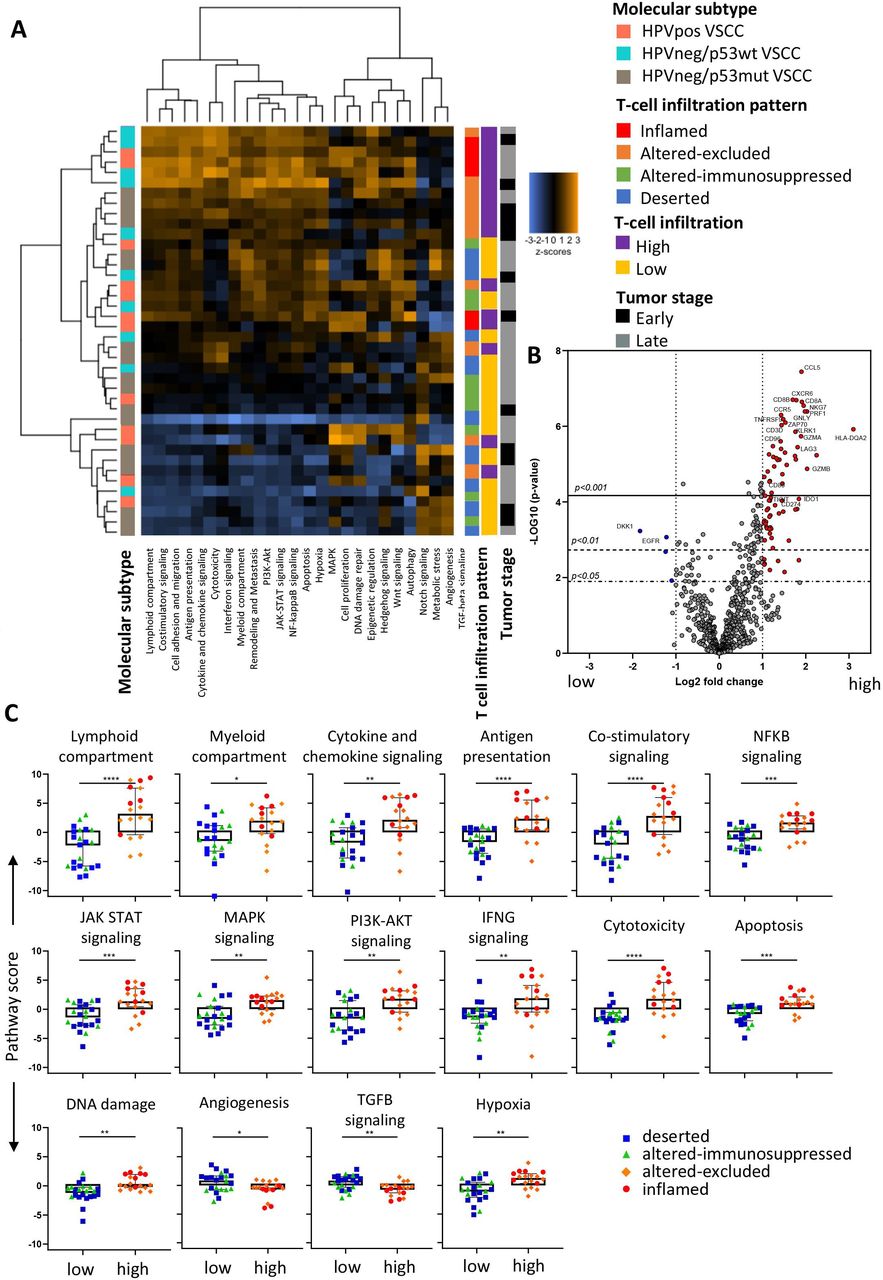
The cancer-associated canonical signaling pathways were interrogated in the 29 early-stage VSCC. At the single gene level, only 2.2% (16/730) of the genes were upregulated in HPVpos VSCC compared with HPVneg/p53wt VSCC and 2.3% (17/730) when compared with HPVneg/p53mut. No differentially expressed genes (DEGs) were observed between HPVneg/p53wt and HPVneg/p53mut VSCC (online supplemental figure 3A, table 6A). Notably, the expression of specific genes such as TP53, RB1, CDK4, E2F5, and CCND1, the proteins of which are involved in TP53 and/or HPV-mediated transformation, did not differ as would be expected by the biological mechanism acting on the protein level instead of RNA level.25 26 Overall higher expression of genes associated with DNA damage and chromatin pathways and a lower expression of genes associated with the Hedgehog pathway was observed in HPVpos VSCC, when compared with the two HPVneg VSCC subtypes (online supplemental figure 3B). Unsupervised clustering of the patient based on differences in the 13 cancer-associated canonical signaling pathways tested (online supplemental figure 3C) revealed that the low number of differently expressed genes in all the cancer-associated canonical signaling pathways was not enough to segregate them into distinct groups. Similarly, the genes associated with 25 immune-related pathways present in the PanCancer IO360 panel were analyzed in the 40 early-stage and late-stage patients. Again, the differences in DEGs between molecular subtypes were small (online supplemental figure 3D, table 6B), while unsupervised clustering identified two major groups with a distinct expression of the 25 immune-related pathways irrespective of the three molecular subtypes (figure 2A). In conclusion, the expression of genes presented in both panels revealed only minor differences between VSCC when they are grouped according to the three predefined molecular subtypes.

Immune-related pathways and single genes differ between high and low infiltrated tumors. Forty VSCC samples of all three molecular subtypes (HPVpos VSCC (n=12), HPVneg/p53wt (n=10) and HPVneg/p53mut (n=18)) were analyzed for 25 predefined immune-related pathways within the PanCancer IO360 panel. (A) Heatmap plot displaying pathway scores of the 25 immune-related pathways. Pathway scores were calculated with using nCounter Advanced Analysis module 2.0 software and displayed as Z-transformed values with orange representing high scores and blue representing low scores. (B) Volcano plot depicting the differentially expressed genes (DEGs; n=79/750) between high and low infiltrated tumors based on a log2 fold change of >1 or <−1 in combination with Benjamini-Hochberg (BH) adjusted p<0.05. Lines indicate the indicated significant BH values. Significant (p<0.05) upregulated DEGs in high infiltrated tumors are indicated in red and in low infiltrated tumors in blue. (C) Box plots showing the differences in the immune-related pathway scores between low and high infiltrated VSCC. Color codes indicate the T cell infiltration pattern observed in the patients. *p<0.05, **p<0.01, ***p<0.001, and ****p<0.0001. VSCC, vulvar squamous cell carcinoma
High T cell counts reflect active immune signaling and a coordinated tumor infiltration with different immune cell types
Although VSCC did not cluster based on their molecular subtype, clustering of samples was observed based on the predefined grouping by tumor-infiltrating T cell counts or infiltration patterns (figure 2A). The difference between low-infiltrated and high-infiltrated tumors was captured by 79 DEGs (figure 2B), only four of which were expressed at higher levels in low-infiltrated tumors (online supplemental table 7), leaving no clues why some VSCC are not well infiltrated. High T cell infiltration was associated with increased expression of genes in many of the pathways (figure 2C), reflecting an ongoing immune response (eg, lymphoid, myeloid, cytokine and chemokine, antigen presentation, and costimulatory signaling) and immune signaling (eg, NFkB, JAK-STAT, MAPK, and PI3K-Akt). In addition, a series of genes suggestive of a strong effector T cell response (IFN signaling, cytotoxicity, apoptosis and DNA damage) was overexpressed in these tumors (figure 2C). This was coupled to a lowered expression of genes associated with angiogenesis and transforming growth factor (TGF)-β signaling as well as increased hypoxia (figure 2C), indicative of less neovascularization. ClueGO analyses27 of the 75 genes associated with high-infiltration confirmed a strong relation with immune enrichment processes related to T cell activation, proliferation, and effector processes as well as with lymphocyte migration and MHC class II antigen presentation (figure 3A). A more in-depth analysis using gene expression-based automatic profiling of immune cell content28 indicated that T cell infiltration was strongly correlated to the presence of (‘exhausted’) CD8+ T cells, cytotoxic cells, natural killer (NK) cells, neutrophils, dendritic cells (DCs), macrophages, TBX21+ (IFN-γ producing) cells and FOXP3+ (all p<0.001; figure 3B). A similar correlation was found between DCs, macrophages, T cells, NK cells and cytotoxic cells (online supplemental figure 4). In conclusion, strong T cell infiltration of VSCC reflects a highly active tumor immune microenvironment with a coordinated influx of several adaptive and innate immune cells.
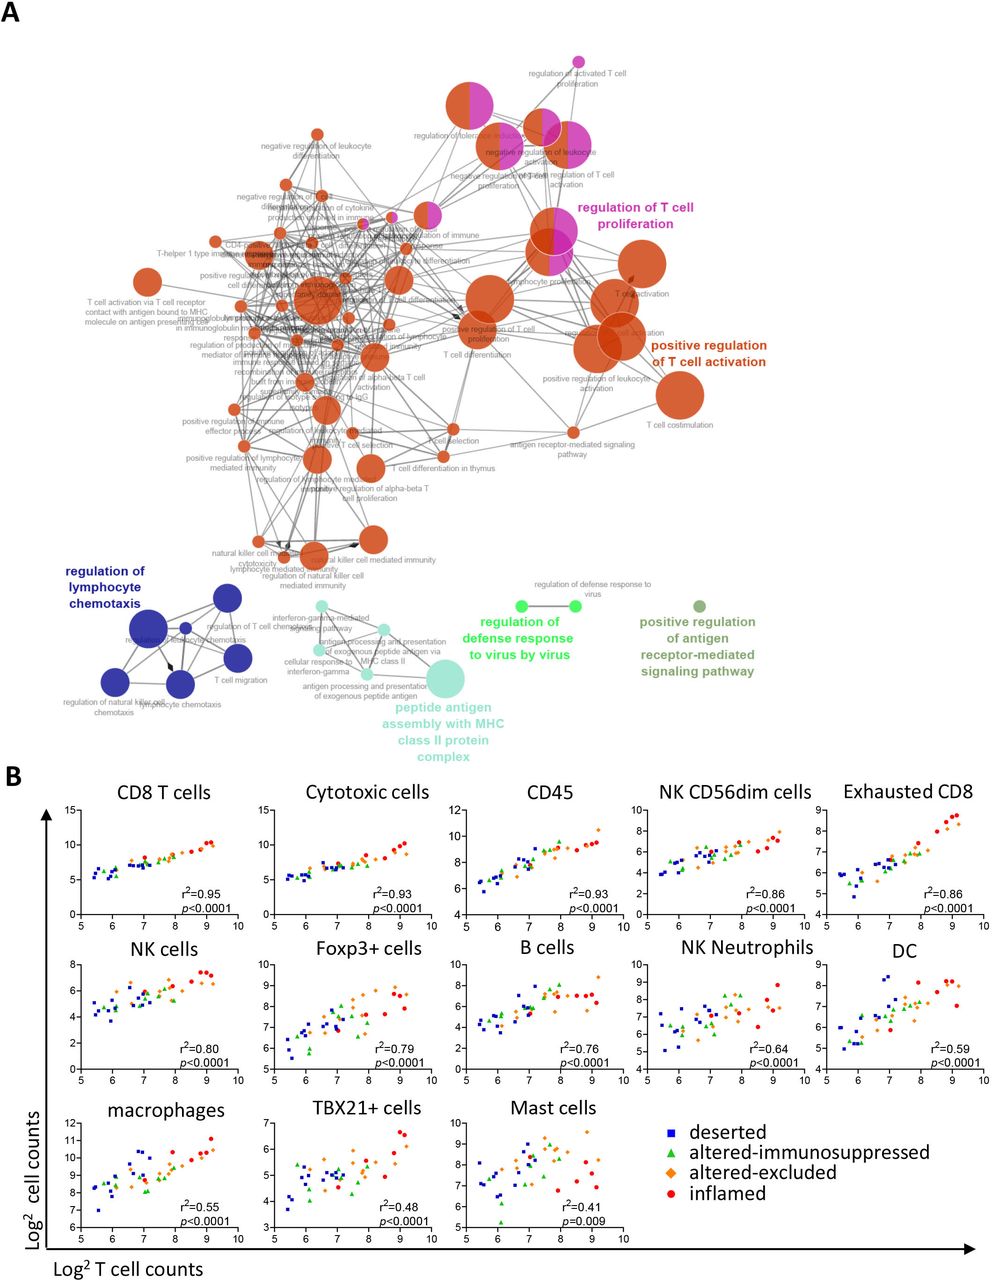
High infiltrated tumors display a coordinated immune response. (A) ClueGo analysis of 79 differentially expressed genes (DEGs) between high and low T cell infiltrated patients, visualizing the pathways in which these genes are involved. All GeneOntology (GO) terms were represented by at least three genes. (B) Linear regression analyses of indicated deconvoluted cell types (y-axis) versus T cells (x-axis). The cell counts are generated using nCounter Advanced Analysis module 2.0 software and based on the expression of predefined genes (online supplemental table 4). Data are given as log2 transformed cell counts. The different T cell infiltration patterns are depicted in color code. *P<0.05, **p<0.01, ***p<0.001, and ****p<0.0001.
The levels of DEGs reflect the T cell infiltration patterns
Unsupervised clustering of the DEGs resulted in the partial separation of VSCC patients with inflamed and altered-excluded tumors from the others (figure 2A). Therefore, we grouped all DEGs manually into the categories: upregulated in low infiltrated tumors, lymphoid compartment, myeloid compartment, cytotoxicity, immune cell adhesion and migration, cytokine and chemokine signaling, T cell signaling, checkpoint molecules, antigen presentation, IFN signaling and miscellaneous. When ordered on the basis of the T cell infiltration pattern, it became clear that the inflamed and part of the altered-excluded tumors displayed a higher expression of most of the DEGs, whereas altered-immunosuppressed and deserted tumors had a low expression of all DEGs (figure 4). A stepwise decrease or increase in the expression of these DEGs was observed for grossly all genes when patients were grouped based on their T cell infiltration pattern (online supplemental figure 5).

High infiltrated tumors showed higher expression of immune-related single genes and checkpoint inhibitors. Heatmap displaying all significant differentially expressed genes (corrected p value <0.05 and log2 fold change >1 or <−1) between high and low infiltrated tumors. Genes were manually categorized in groups based on their main effector function (vertical column) and tumors were ordered based on their corresponding T cell infiltration pattern (horizontal axis).9 Expression of the selected single genes in the heatmap were given as 2log2 transformed values relative to the average value of that particular gene.
Fifteen checkpoint molecules were upregulated in high-infiltrated tumors when compared with low-infiltrated tumors (figure 4). Six of these checkpoints are involved in T cell costimulation (CD28, CD80, CD96, TNSFR9 (CD137), KLRD1, and KLRK1), five of which are expressed at higher levels in inflamed and altered-excluded VSCC when compared with deserted tumors, whereas CD80 was expressed at higher levels in inflamed only. The coinhibitory genes CD274 (PD-L1), PDCD1LG2 (PD-L2), TIGIT, HAVCR2 (TIM-3), LAG-3, KLRB1, and LILRB4 displayed the same pattern. LILRB2 was expressed at higher levels in inflamed versus deserted only, and CTLA4 did not display significant differences between all the different T cells patterns (online supplemental figure 5).
The expression of the checkpoint inhibitor PD-L1 is related to OS
A hot, T cell inflamed immune microenvironment is considered as an important correlate for superior response to immunotherapy and in particular to immune checkpoint inhibitors (ICIs). We calculated the pan-tumor 18-gene T cell inflamed GEP score (figure 5A). High T cell infiltration, T cell infiltration pattern, but not molecular subtype, was associated with a higher T cell inflamed GEP score (figure 5A). There were minor differences between deserted and altered-immunosuppressed tumors. Inflamed tumors had a significantly higher T cell inflamed GEP score compared with deserted and altered-immunosuppressed tumors (p<0.0001). Interestingly, most of the altered-excluded tumors showed similar T cell inflamed GEP scores as the inflamed group. Because the T cell inflamed GEP is a weighted sum, we also analyzed the log10 transformed normalized expression counts of the 18 individual genes used to calculate this GEP score. Clearly, 89% (16/18) of the T cell inflamed GEP-related genes were significantly upregulated in inflamed tumors when compared with the other T cell infiltration patterns, confirming the TME inflammatory state of inflamed and part of the altered-excluded tumors (figure 5B). Within the group of altered-excluded tumors, a number of tumors are less immune-active (figure 5A, second panel). This emphasizes that the T cell infiltration pattern more accurately predicts the T cell GEP score when compared to the number of infiltrating T cells but still not perfect.
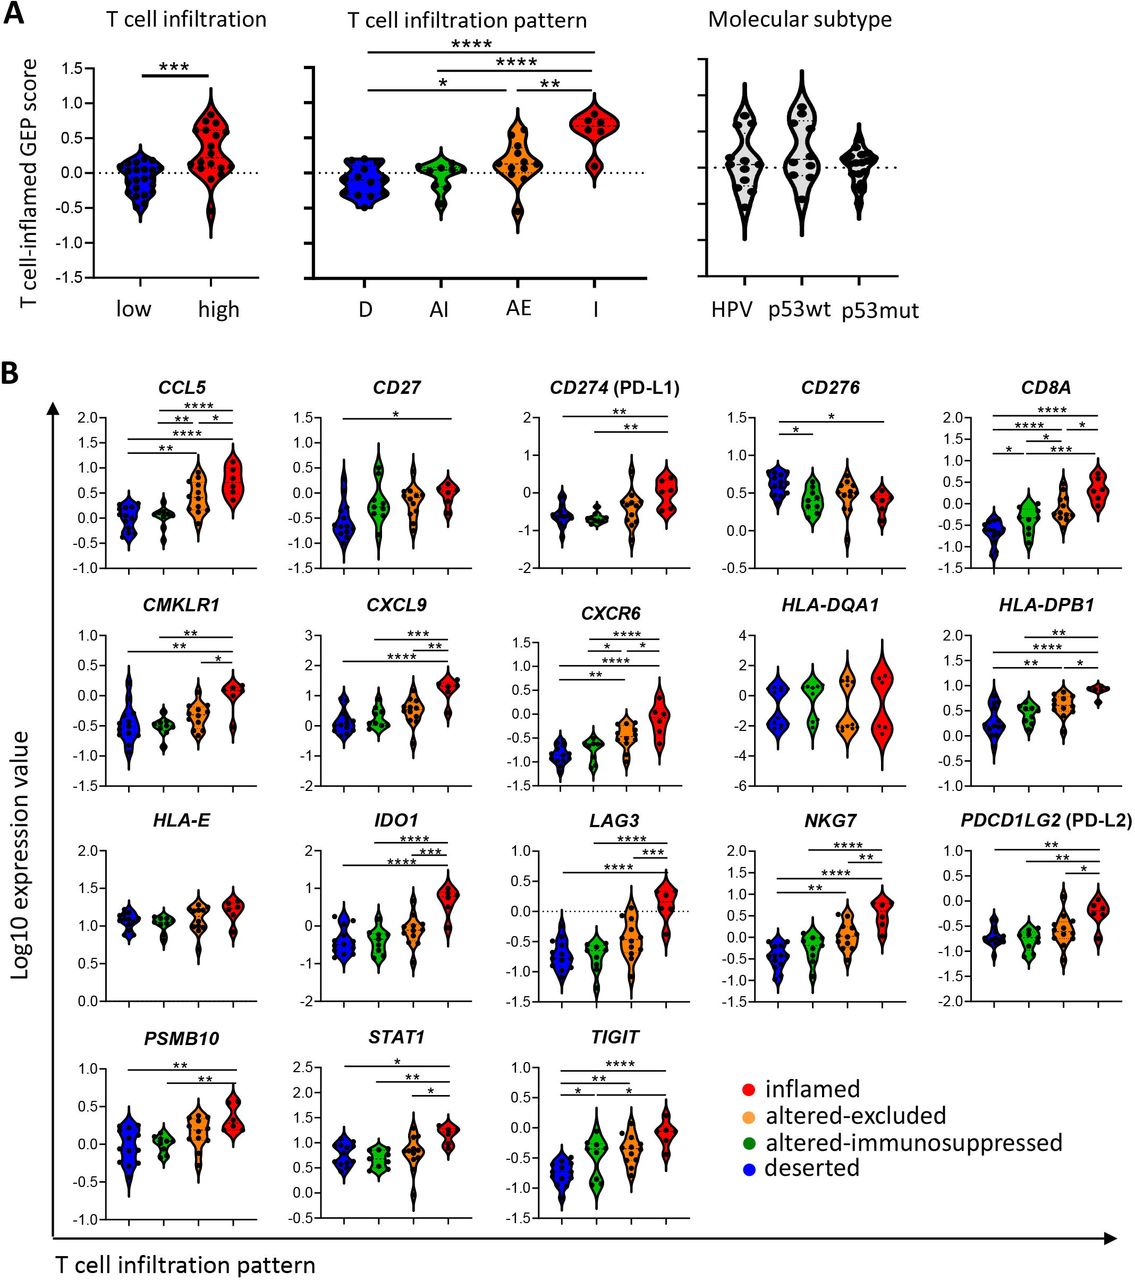
High infiltrated tumors are associated with a higher T cell inflamed gene expression profile (GEP) score. Forty early-stage and late-stage VSCC samples were analyzed by the Nanostring IO360 PanCancer panel. (A) Violin plots displaying the T cell inflamed GEP score for T cell infiltration (left), T cell infiltration pattern (middle) and tumor molecular subtype (right). The T cell inflamed GEP score was calculated as the weighted sum of the normalized expression values of 18 genes.19 (B) Violin plots displaying the normalized expression values of the single T cell GEP genes. Values are given as log10-transformed values. *P<0.05, **p<0.01, ***p<0.001, and ****p<0.0001.
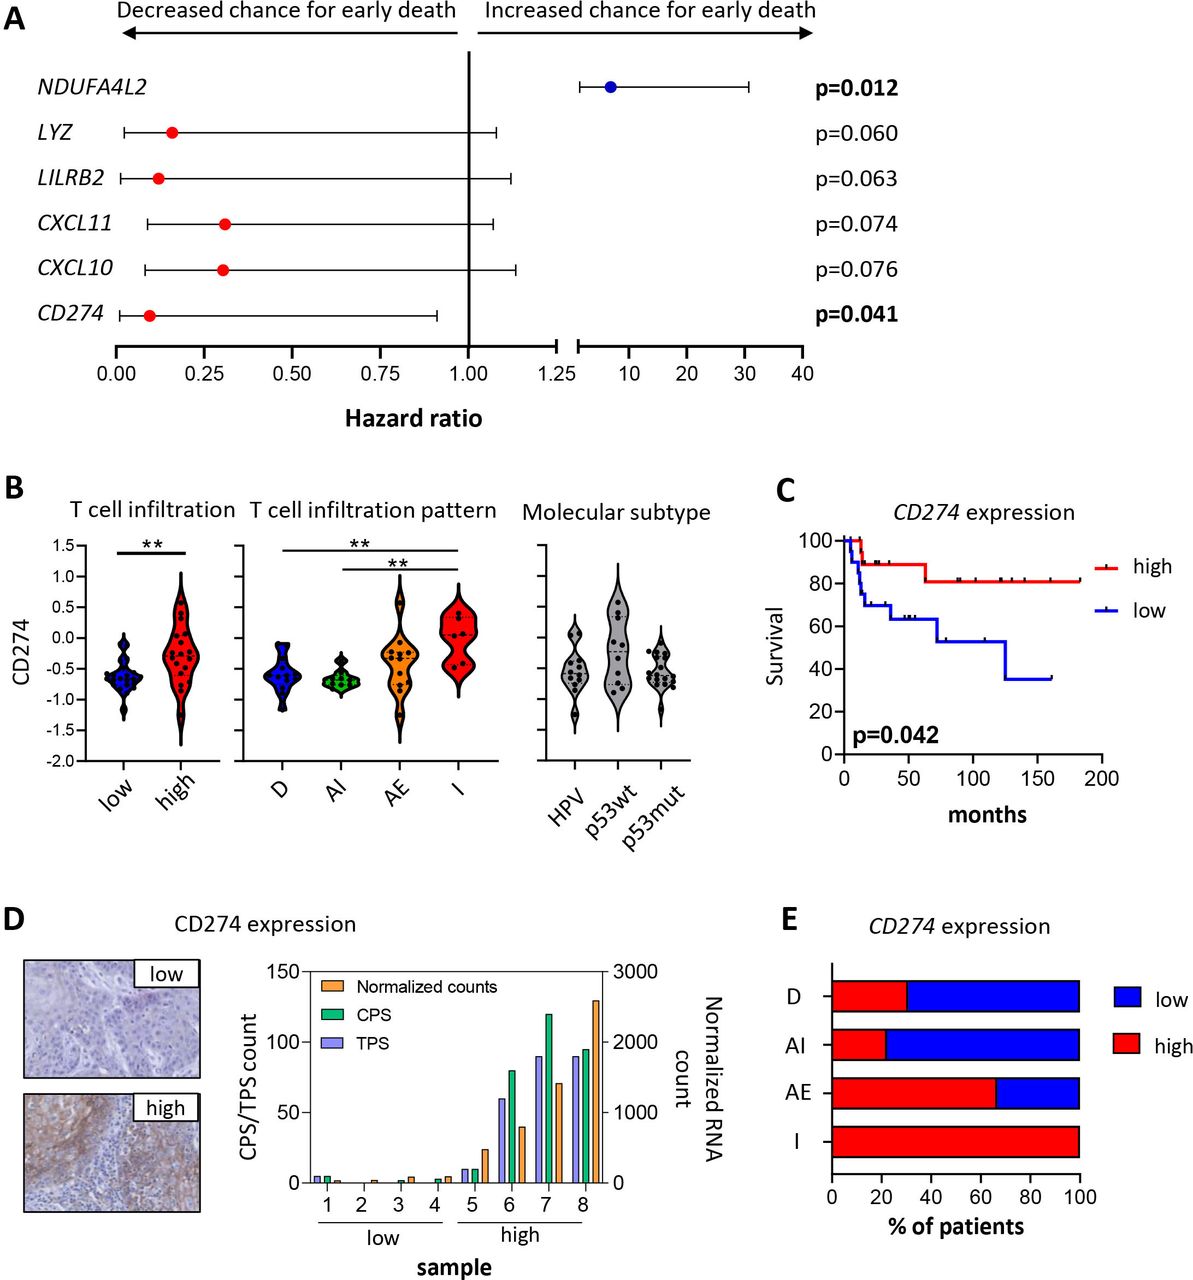
To study whether a gene expression signature could be found that was related to the T cell infiltration pattern, we tested the potential predictive value for survival of the DEG between low-infiltrated and high-infiltrated VSCC using Cox regression analysis. Of the 79 DEGs tested, six genes (CD274, CXCL10, CXCL11, LILRB2, LYZ, and NDUFA4LG2) showed a (near) significant association between the variable and survival time of the patient (figure 6A). Of these, the association between high T cell infiltration and T cell infiltration pattern and high expression levels of CD274, CXCL10, CXCL11, LILRB2 and LYZ, and low expression level of NDUFA4LG2 was confirmed (figure 6B and online supplemental figure 6). Interestingly, the discriminatory ability and clinical usefulness of these individual genes was only observed for CD274 (figure 6C and online supplemental figure 6). Therefore, we confirmed the expression of CD274 at the protein level in a subset of patients (figure 6D). These data suggest that in particular the patients with an inflamed and two-third of altered-excluded VSCC (figure 6E) may be responsive to treatment with PD-1/PD-L1 checkpoint therapy.
High infiltrated tumors are associated with a higher VSCC-inflamed gene expression profile (GEP) score. Forty early-stage and late-stage VSCC samples were analyzed by the Nanostring IO360 PanCancer panel, and log10 transformed expression values for all 79 DEGs between low-infiltrated and high-infiltrated VSCC were calculated. (A) Graph depicting HR with 95% CI of differentially expressed genes (DEG) between low-infiltrated and high-infiltrated VSCC that are (near) significant by Cox regression analysis. Red: genes up in high-infiltrated VSCC and blue: gene up in low-infiltrated VSCC. (B) Violin plots displaying the log10-transformed expression values of CD274 for T cell infiltration (left; cold vs hot tumors), T cell infiltration pattern (middle; deserted (D), altered-immunosuppressed (AI), altered-excluded (AE) and inflamed (I) VSCC) and tumor molecular subtype (right; HPVpos, HPVneg/p53wt, and HPVneg/p53mut VSCC). (C) Kaplan-Meier survival curve showing the survival of 40 VSCC patients with high (red; above the median) and low (blue; below the median) expression of CD274. (D) Representative pictures of low (top left) and high (bottom left) CD274 protein expression in patients with low and high normalized CD274 RNA counts, respectively. The graph (right) depicts CD274 combined positive score (CPS) and tumor positive score (TPS; both left y-axis) score in four patients with low and four patients with high normalized CD274 RNA counts (right y-axis). (E) Bar graph displaying the percentage of patients with high or low expression of CD274 in respect to the T cell infiltration pattern. *P<0.05, **p<0.01, ***p<0.001, and ****p<0.0001. VSCC, vulvar squamous cell carcinoma.
Discussion
This study showed that the extent of T cell infiltration, in particular that of CD3+CD8−Foxp3− T cells, is associated with a longer recurrence free and OS of patients treated for early-stage and late-stage VSCC. T cell infiltration formed an independent prognostic factor, irrespective of molecular subtype9 or stage of the disease. Interrogation of the immune contexture and cancer-associated canonical signaling based on RNA expression levels revealed only minor differences when patients were grouped according to their molecular subtypes. In contrast, the grouping of patients based on T cell infiltration revealed 79 DEGs, which provided a profound insight into the immunological make-up of VSCC. Infiltration of VSCC by T cells was accompanied by the coinfiltration of multiple immune cell types and the activation of several immune pathways, indicative of a coordinated immune response in these VSCC. Especially inflamed and part of the altered-excluded VSCC displayed an increased expression of immune checkpoints for T cells and myeloid cells. Importantly, these VSCC had a high T cell inflamed GEP score, predicting the response to PD-1/PD-L1 checkpoint therapy in other tumors12 19 and the high expression of PD-L1 (CD274) was directly linked to survival, confirming a previous report on PD-L1 expression.29 In addition, a report studying genomic alterations and PD-L1 expression in matched primary and metastatic VSCC showed that 6/10 primary VSCC express PD-L1 compared with no expression in the metastasis.30 This suggests that patients with such immune active primary VSCC are eligible candidates for PD-1/PD-L1 blockade therapy.
To date, only a limited number of patients (n=26) with unresectable and/or metastatic advanced VSCC has been treated with PD-1/PD-L1 blockade.11–14 One complete and four partial remissions were reported,11–14 indicating that there is much room for improvement. The low response rate in these studies can be explained by the selection of patients. All patients were diagnosed with unresectable and/or metastatic advanced VSCC, and the median progression-free survival was 2 months and the median OS 3.8 months.12 These results indicated that the tumors of these patients are likely to contain low numbers of intratumoral T cells (this study and ref 9) and consequently are less likely to respond to checkpoint inhibition.23 In case that these VSCCs were infiltrated with T cells, other intrinsic and extrinsic resistance mechanisms may have played a role.15 For instance, the inflamed tumors in our study cohort showed not only higher expression of PD-1 but also that of the other T cell related checkpoints TIGIT, HAVCR2 (TIM-3), LAG-3, and KLRB1. Therefore, a combination of antibodies to these T cell checkpoints may be more successful.31 32 Based on our results, LAG-3 and TIM-3 inhibitors would be interesting for VSCC treatment because those checkpoint inhibitors affect CD4+ TILs,33–35 which displayed the strongest positive association with better RFP and OS (this study and ref 9). Anti-TIGIT therapy is relatively new, and the efficacy of blocking these checkpoint molecules is now tested combined with anti-PD-1/PD-L1 (NCT02794571, NCT02913313, and NCT03628677).36 We showed that VSCC patients with a strong T cell infiltration perform much better after standard surgery and/or (chemo)radiotherapy, hence they are less likely to end up in current ongoing checkpoint inhibition studies.
Primary FIGO I-III VSCC is treated by surgery and includes radical resection of the primary vulvar tumor, excision of inguinal lymph nodes and sometimes (chemo)radiotherapy. Treatment is associated with impressive and long-lasting morbidity, sexual and psychological dysfunction and wound healing disorders.37 In view of the checkpoints expressed, there is a good chance that these primary VSCC respond to checkpoint therapy when treated in a neoadjuvant setting. This could lead to complete or partial shrinkage of the primary tumor and as such to less invasive surgery without compromizing clinical outcome. Furthermore, this may reduce the postoperative complications and impressive comorbidity of current therapy. This also found in other tumors treated with checkpoint inhibition in the neoadjuvant setting.38 39 We are currently initiating such a study.
Several studies indicated the requirement of myeloid effector cells for the success of T cell based immunotherapies in murine tumor models40–45 and patients with precancerous vulvar lesions.5 This is underlined by the better clinical outcome of tumors that are well infiltrated by type 1 T cells, myeloid cells,46 and the coordinated immune response in VSCC found here. In this view, the increased expression of myeloid cell expressed checkpoints LILRB247 and LILRB448 may provide alternative actionable targets for immunotherapy of inflamed VSCC. Similar to our observation, the expression of LILRB4 was found to be highly correlated to the expression of checkpoints by T cells.49 Blockade of LILRB2 or LILRB4 reprogrammed the intratumoral myeloid cell infiltrate from a suppressive phenotype toward an inflammatory immune-supporting phenotype49 50 and increased tumor infiltration with CD4+ type 1 T cells and less exhausted CD8+ T cells.50 Moreover, antibody-mediated blockade of these receptors resulted in tumor growth control49 50 and increased the efficacy of T cell based ICI.50 Currently, there is one clinical trial ongoing to study the effect of LIRB2 blockade as a single agent or in combination with anti-PD-1 (NCT04669899). Based on our data, a similar combination would be highly desired in the treatment of VSCC. More studies are needed to confirm our findings since we mainly focused on RNA expression levels. We were limited by the number and size of fresh tissue samples that made it impossible to perform in-depth flowcytometry analysis for these patients. While we confirmed the expression level of PD-L1 on the protein level, the expression of multiple interesting checkpoint molecules described in this manuscript still awaits further confirmation.
Low T cell infiltrated tumors are a therapeutic challenge for immunotherapy.23 The lack of immune cell infiltration is most likely due to tumor-intrinsic factors, as for instance therapeutic vaccination did not increase T cell infiltration of precancerous lesions of the vulva displaying a low T cell infiltrated environment prior to treatment.5 Our data showed no clues why some tumors are well infiltrated with T cells and others not.
In conclusion, we showed that there is a strong correlation between T cell infiltration patterns and coordinated immune response in VSCC. In particular, inflamed VSCC and two-third of the altered-excluded VSCC expressed the checkpoint molecule PD-L1, which was associated with clinical outcome. This suggested that patients with inflamed and to some extent altered-excluded VSCC might benefit from checkpoint therapy such as PD-1/PD-L1.
Data availability statement
Data are available in a public, open access repository. Data are available on reasonable request. All data relevant to the study are included in the article or uploaded as supplementary information.
Ethics statements
Patient consent for publication
Ethics approval
The study was conducted in accordance with the Declaration of Helsinki and approved by the local medical ethical committee of the Leiden University Medical Center (P08.197, B16.024, B19.035) and Erasmus Medical Center (MEC-2019-0404), and in agreement with the Dutch law. The materials were used according to the Dutch Federation of Medical Research Association guidelines.
Acknowledgments
We would like to thank Jasper Dumas for the Bioanalyzer results and processing the samples through the Nanostring platform, and Dr Tjalling Bosse for annotating the tumor area suitable for RNA isolation. We express our gratitude to the patients who participated in our study.
References
Supplementary materials
Supplementary Data
This web only file has been produced by the BMJ Publishing Group from an electronic file supplied by the author(s) and has not been edited for content.
Footnotes
Contributors Conception and design: SHvdB, SJS, and KEK. Development of methodology: KEK, SJS, DAMM, IE, and LT. Acquisition of data: KEK, SJS, IE, and LT. Analysis and interpretation of data: KEK, SJS, LT, PC, MIEvP, and SHvdB. Writing, review, and/or revision of the manuscript: KEK, SJS, PC, DAMM, HCvD, MIEvP, and SHvdB. Patient management: HCvD and MIEvP. Study supervision: MIEvP, DAMM and SHvdB. SHvdB is the guarantor of the study and accepts full responsibility for the work and/or the conduct of the study, had access to the data, and controlled the decision to publish. All authors read and approved the final manuscript.
Funding This study was financially supported by a grant from the Dutch Cancer Society 2016-10168 to MIEvP and SHvdB.
Competing interests The authors (KEK, SJS, MIEvP and SHvdB) have filed a patent relating to the treatment of vulvar squamous cell carcinoma (VSCC) and methods for identifying subjects with VSCC who are likely to benefit from such therapy.
Provenance and peer review Not commissioned; externally peer reviewed.
Supplemental material This content has been supplied by the author(s). It has not been vetted by BMJ Publishing Group Limited (BMJ) and may not have been peer-reviewed. Any opinions or recommendations discussed are solely those of the author(s) and are not endorsed by BMJ. BMJ disclaims all liability and responsibility arising from any reliance placed on the content. Where the content includes any translated material, BMJ does not warrant the accuracy and reliability of the translations (including but not limited to local regulations, clinical guidelines, terminology, drug names and drug dosages), and is not responsible for any error and/or omissions arising from translation and adaptation or otherwise.