Article Text

Abstract
Background Pancreatic ductal adenocarcinoma (PDAC) is projected to be the second leading cause of cancer death in the USA by 2030. Immune checkpoint inhibitors fail to control most PDAC tumors because of PDAC’s extensive immunosuppressive microenvironment and poor immune infiltration, a phenotype also seen in other non-inflamed (ie, ‘cold’) tumors. Identifying novel ways to enhance immunotherapy efficacy in PDAC is critical. Dipeptidyl peptidase (DPP) inhibition can enhance immunotherapy efficacy in other cancer types; however, the impact of DPP inhibition on PDAC tumors remains unexplored.
Methods We examined the effects of an oral small molecule DPP inhibitor (BXCL701) on PDAC tumor growth using mT3-2D and Pan02 subcutaneous syngeneic murine models in C57BL/6 mice. We explored the effects of DPP inhibition on the tumor immune landscape using RNAseq, immunohistochemistry, cytokine evaluation and flow cytometry. We then tested if BXCL701 enhanced anti-programmed cell death protein 1 (anti-PD1) efficacy and performed immune cell depletion and rechallenged studies to explore the relevance of cytotoxic immune cells to combination treatment efficacy.
Results In both murine models of PDAC, DPP inhibition enhanced NK and T cell immune infiltration and reduced tumor growth. DPP inhibition also enhanced the efficacy of anti-PD1. The efficacy of dual anti-PD1 and BXCL701 therapy was dependent on both CD8+ T cells and NK cells. Mice treated with this combination therapy developed antitumor immune memory that cleared some tumors after re-exposure. Lastly, we used The Cancer Genome Atlas (TCGA) to demonstrate that increased NK cell content, but not T cell content, in human PDAC tumors is correlated with longer overall survival. We propose that broad DPP inhibition enhances antitumor immune response via two mechanisms: (1) DPP4 inhibition increases tumor content of CXCL9/10, which recruits CXCR3+ NK and T cells, and (2) DPP8/9 inhibition activates the inflammasome, resulting in proinflammatory cytokine release and Th1 response, further enhancing the CXCL9/10-CXCR3 axis.
Conclusions These findings show that DPP inhibition with BXCL701 represents a pharmacologic strategy to increase the tumor microenvironment immune cell content to improve anti-PD1 efficacy in PDAC, suggesting BXCL701 can enhance immunotherapy efficacy in ‘cold’ tumor types. These findings also highlight the potential importance of NK cells along with T cells in regulating PDAC tumor growth.
- immunotherapy
- drug therapy
- combination
- drug evaluation
- preclinical
- programmed cell death 1 receptor
- th1-th2 balance
Data availability statement
Data are available in a public, open access repository. RNAseq dataset files are available at Gene Expression Omnibus (GEO) (http://www.ncbi.nlm.nih.gov/geo/) GSE173441. All additional data relevant to the study are included in the article or uploaded as supplementary information. All data are presented in the main and supplemental results.
This is an open access article distributed in accordance with the Creative Commons Attribution Non Commercial (CC BY-NC 4.0) license, which permits others to distribute, remix, adapt, build upon this work non-commercially, and license their derivative works on different terms, provided the original work is properly cited, appropriate credit is given, any changes made indicated, and the use is non-commercial. See http://creativecommons.org/licenses/by-nc/4.0/.
Statistics from Altmetric.com
- immunotherapy
- drug therapy
- combination
- drug evaluation
- preclinical
- programmed cell death 1 receptor
- th1-th2 balance
Background
Pancreatic ductal adenocarcinoma (PDAC) accounts for 90% of pancreatic cancers. In the USA, PDAC is the fourth leading cause of cancer death despite being the 11th leading cause of cancer. PDAC causes a disproportionately large percentage of cancer deaths because it is often detected late and has few effective treatment options.1 Only 10% of newly diagnosed patients will live longer than 5 years.2 Excluding mismatch repair deficient tumors,3 immune checkpoint inhibitors (eg, anti-PD1 and anti-CTLA-4) inadequately regulate PDAC tumor growth, in part because of PDAC’s immunosuppressive microenvironment and sparse immune cell infiltrate.4 5 Recent studies have shown that dipeptidyl peptidase (DPP) inhibition can activate the immune system and improve immunotherapy efficacy in other cancer types.6 7 We therefore hypothesized that DPP inhibition may be beneficial for PDAC treatment.
The DPPIV gene family is a family of serine peptidases grouped by their shared, unique catalytic triad consisting of serine, aspartate and histidine. Currently, this family consists of six proteins: four enzymes that possess N-terminal post-proline DPP activity (DPP4, DPP8, DPP9 and fibroblast activation protein (FAP)), and two non-enzymes (DPP6 and DPP10). In addition to its DPP activity, FAP also has endopeptidase activity, enabling it to cleave collagen. The enzymatic DPPs have been extensively studied because they impact physiologic and pathologic processes such as fibrosis, metabolism and cancer.8–10
DPP4 can be membrane bound or soluble and was first described for its role in regulating insulinotropic hormones (incretins). DPP4 inhibitors (ie, ‘gliptins’) represent a large class of FDA-approved therapies used to treat type 2 diabetes.11 In murine models of melanoma and colorectal cancer, DPP4 inhibitors increase levels of the chemoattractant CXCL10 by preventing DPP4-mediated CXCL10 truncation and inactivation.6 The resulting increase in CXCL10 recruits CXCR3 + NK and T cells into tumors, reduces tumor growth and enhances the therapeutic efficacy of anti-CTLA4. Unlike membrane-bound DPP4, DPP8/9 are cytosolic proteases. DPP8/9 inhibition activates the NLRP1 inflammasome, which induces pyroptosis and the release of interleukin (IL)-1β and IL-18.12 13 FAP, similar to DPP4, can be membrane bound or soluble. While FAP may be the most well-researched DPP family member in cancer biology, the effects of FAP inhibition on the tumor immune landscape remain controversial.14
Here, we test if DPP inhibition can enhance naturally occurring antitumor immunity and immunotherapy in PDAC. Using murine models, we found that a DPP inhibitor, BXCL701 (ie, Talabostat, Val-boroPro, PT-100), reduced PDAC tumor growth and enhanced the efficacy of anti-PD1. We propose that inhibition of both DPP4 and DPP8/9 favorably remodels the PDAC immune microenvironment to promote antitumor activity and anti-PD1 efficacy.
Methods
TCGA Analysis
RNAseq data from human PDAC tumors was obtained from The Cancer Genome Atlas (TCGA)15 using gene counts from recount2,16 filtering out any non-PDAC specimens classified as PAAD prior to analysis.17 Computational estimates of cellular abundance from CIBERSORT were obtained from Thorsson et al.18 Kaplan-Meir analysis was performed for overall survival comparing sample groups defined from median gene expression values.
Cell lines
The mT3-2D murine pancreatic cancer cell line was a gift from David Tuveson, Cold Spring Harbor Laboratory, Laurel Hollow, New York, USA.19 Pan02 and Wehi-164 studies were performed at Crown Bioscience. All cell lines were tested and determined to be free of Mycoplasma and other rodent pathogens.
Drug preparation
In 0.1 N HCl, 20 mg of BXCL701 was diluted to obtain a final concentration of 20 mg/mL. BXCL701 was then diluted 1:100 in dH2O.
Animal studies
Cells were injected into the right flank of C57BL/6 or Balb/c wild-type mice. Mice were randomized into treatment groups so that each group would have an approximately equivalent starting tumor volume. All mice in the same experiment were housed in the same room and the order of treated groups was changed weekly. Mice were given 20 µg BXCL701 daily by oral gavage or 200 µg of anti-PD1 (clone: RMP1-14, BioXCell) twice per week by intraperitoneal injection or both. Cell inoculation amount, tumor size and treatment length were experiment dependent and designated in figure schematics. Mice were euthanized with CO2 inhalation at the end of treatment, when tumors reached 1–2 cm3 for mT3-2D tumors or 3 cm3 for other tumors or when mice showed signs of pain or distress. Volume was calculated using the formula (length × width2)/2. All mice used in this study were 6–8 weeks of age and purchased from The Jackson Laboratory (Bar Harbor, Maine, USA). All parties were aware of treatment conditions during treatment, tumor measurement and data analysis.
For immune cell depletion studies, depletion started 1 day prior to treatment initiation. CD8+ T cells, NK1.1+ NK cells or both were depleted using 200 µg of anti-CD8 antibody (BioXCell, cat#BE0061) and/or 200 µg anti-NK1.1 antibody (BioXCell, cat#BE0036) two times per week for the first 2 weeks then one time per week until the end of the experiment. After euthanizing, murine splenocytes were collected to evaluate efficacy of depletion using PE anti-NK1.1 (BioLegend, cat#108707) and PE/Cy7 anti-CD8 (eBioscience, cat# 25-0083). For the rechallenge experiment, tumor-free mice that had rejected mT3-2D tumor after treatment were rechallenged 6 months after the first challenge by injecting the opposite flank with fivefold higher dose than the initial challenge mT3-2D tumor cells, without further treatment. Mice were examined two times per week to detect tumor growth, and the percentage of tumor-free mice was recorded.
RNAseq analysis
Subcutaneous Pan02 tumors were collected in RNAlater after 1, 7 or 14 days of BXCL701 or phosphate-buffered saline (PBS) treatment. RNA was extracted from each sample using RNeasy mini kit (QAIGEN, Cat. 74106). Samples were run using Illumina HiSeq platform. Reads were mapped to the ESEMBL GRCm38.84 reference with Bowtie and gene expression was calculated with MMSEQ. Differential expression analysis was performed to compare treatment and control mice at day 14 based on log2 FPKM values with LIMMA,20 and genes with false discovery rate (FDR)-adjusted p values below 0.05 and absolute log fold change greater than 1 were called statistically significant. Pathway analysis is performed on differentially expressed genes with an over-representation test through the investigate gene set function in MsigDB21 for Biocarta, KEGG, Reactome and Hallmark pathways.22 Protein–protein networks are determined from STRING23 analysis of the differentially expressed genes.
DPP activity assay
One hundred millimolar stock of DPP substrate (Acetyl-Aka-Gly-Pro-AFC) (AnaSpec, cat#AS-24126) was made by resuspending lyophilized substrate in dimethyl sulfoxide (DMSO). Substrate stock was then diluted 1:1000 in activity assay buffer (50 mM Tris, 1 M NaCl, 1 mg/mL BSA, pH 7.5). A standard curve was generated using rFAP (R&D Systems, cat#3715-SE-010) or rDPP4 (R&D Systems, cat#9168-SE) and 50 µL of recombinant protein plus 50 µL of substrate was added to each well of a 96 Well Flat Clear Bottom White Polystyrene TC-Treated Microplates (Corning, cat#3903). The plate was incubated for 30 min at 37°C then read on a PerkinElmer EnVision Multimode Plate Reader with 390–400 nm excitation and 580–510 nm emission wavelengths. To test tumor lysates, 50–100 mg of snap-frozen tumors were homogenized in 100–300 µL activity assay buffer using a Kimble Biomasher II Closed System Tissue Grinder (DWK Life Sciences, cat#749625-0020). Protein concentration was determined using Bio-Rad Protein Concentration DC Protein Assay Kit II (Bio-Rad, cat#5000112). All samples were diluted to equal protein concentrations using activity assay buffer then added at 50 µL plus 50 µL substrate per well. Final concentration of FAP per well was calculated using the standard curve. Data were compiled and assessed for significance using GraphPad Prism 9.
Immunohistochemistry
For solid tumors, tissues were fixed in 10% formalin overnight at room temperature and then stored in 70% ethanol until paraffin embedding. mT3-2D tumor embedding, sectioning and staining were done by Georgetown University Histopathology and Tissue Shared Resource. ImageJ (V.1.48) and FIJI (V.2.0.0-rc-69/1.52n) were used for the analysis. Antibodies used were: anti-mouse CD8 (Cell Signaling, cat#98941), anti-mouse CD4 (Cell Signaling,cat#25229), anti-mouse CD335/NKp46 (R&D Systems, cat#AF2225), anti-mouse CXCR3 (Bioss, cat#BS-2209R). Like mT3-2D samples, Pan02 samples were embedded and sectioned by Crown Bioscience. Sections were dewaxed, washed and then stained. All stained sections were scanned with NanoZoomer-HT 2.0 Image system for 40× magnification (Hamamatsu Photonics) and images were quantified with HALO platform. Antibodies used were the same as those for mT3-2D tumors, with the addition of anti-mouse CD3 (Thermo Fisher, cat#MA5-14524).
Cytokine panel
Blood was collected into EDTA-coated tubes via submandibular bleeding or cardiac puncture and sera was isolated by centrifugation and immediately stored at −80°C. Tumors were harvested and homogenized in PBS+0.5% Tween-20 with protease inhibitors (Roche; Penzberg, Bavaria, Germany). Homogenates were centrifuged and the supernatant was immediately stored at −80°C. mT3-2D samples were processed by Eve Technologies using the Mouse Cytokine 31-Plex Discovery Assay plus IL-18 (cat# MD13). Pan02 and Wehi-164 samples were processed by Crown Bioscience using the Millipore MILLIPLEX MAP Mouse Cytokine/Chemokine 32-Plex panel (cat# MCYTMAG 70K PX32). Samples were run according to manufacturer protocol, as follows: serum was thawed and diluted to one-part serum to one-part assay butter the day of the assay. Twenty-five microliters of samples or standards were plated with 25 µL assay buffer, 25 µL matrix solution, 25 µL beads in each well, sealed and agitated for 2 hours at room temperature. The plate was washed three times, then 25 µL of detection antibodies were added to each well and the plate was sealed, covered with foil and agitated at for 1 hour at room temperature. Twenty-five microliters of streptavidin-phycoerythrin was added to each well. The plate was sealed, covered with foil and agitated for 30 min at room temperature. Plate was washed two times, then 150 µL of sheath fluid was added to all wells and beads were resuspended on a plate shaker for 5 min. Plates were read on a Luminex 200. Final concentrations were calculated by comparing to kit-provided mouse cytokine standards. IL-18 was analyzed separately using ELISA (R&D Systems, cat# 7625), as per manufacturer’s protocol. In brief, prior to assay IL-18 standard was reconstituted to a final concentration of 1000 pg/mL. One hundred microliters of serum samples were transferred to IL-18 antibody-coated microwells and incubated for 1 hour at room temperature. The plate was washed four times with room temperature wash solution. One hundred microliters of conjugate solution was added to each well and the plate was incubated for 1 hour at room temperature. The plate was washed four times. One hundred microliters of substrate reagent was added to each well and the plate was incubated for 30 min at room temperature. One hundred microliters of stop solution was added to each well and the plate was read on a molecular devices SpectraMax PLUS 384 multifunctional plate reader at 450 nm.
Flow cytometry
Tumors were chopped into small pieces that were then transferred into gentleMACS Tubes (MACS Miltenyi Biotec), containing 10 mL of DMEM media and 1 mg/mL collagenase D (Sigma-Aldrich, COLLD-RO Roche, #11088866001). The tubes were placed on a gentleMACS Dissociator (MACS Miltenyi Biotec, #130-095-937) using the program 37_m_TDK2. After incubation, cells were filtered using 70 µm cell strainer and recovered by centrifugation. Cells were stained for live/dead with either LIVE/DEAD Fixable Violet Dead Cell Stain Kit, for 405 nm excitation (Thermo Fisher, cat#L34963) or Zombie NIR (BioLegend, cat#423105) then stained with a cocktail of surface mAbs Panel 1: BV711 anti-CD45 (BioLegend, cat#103147), PE anti-NK1.1 (BioLegend, cat#108707) and PE/Cy7 anti-CD8 (eBioscience, cat# 25-0083), APC anti-CD4 (eBioscience, cat#14-0042-81), BV421 anti-F4/80 (BioLegend, cat#123137) and PE/Dazzle 594 anti-CD183 (CXCR3) (BioLegend, cat#155914); Panel 2: BV711 anti-CD45 (BioLegend, cat#103147), APC anti-IFNg (BioLegend, cat#505810) and PE/Dazzle 594 anti-T-bet (BioLegend, cat#644828), PE/Cy7 anti-CD4 (BioLegend, cat#100422). After 30 min of staining, cells were washed and samples were run on FACS Symphony Cytometer (BD Biosciences). FlowJo V.10 was used for the analysis, cells were manually gated on size and granularity. Dead cells and doublets were excluded, and CD45 + cells were selected.
Statistics
All statistical analyses were done in GraphPad Prism 9 or R V.4.0.3. Unless stated otherwise in the figure legends, data is represented as mean±SD. All statistical comparisons between two groups were performed using unpaired two-tailed t-test unless stated otherwise. All statistical comparisons between three or more groups were done using one-way analysis of variance followed by Tukey’s multiple comparison tests. Any outliers identified were identified by Rout’s method for multiple outliers or Grubb’s method for one outlier. If any outliers were removed, it will be stated in the figure legend.
Results
DPP inhibitor, BXCL701, reduces mT3-2D tumor growth and prolongs overall survival
To determine the impact of DPP inhibition on PDAC tumor growth, we tested an oral small molecule DPP inhibitor (BXCL701)—which inhibits DPP4, DPP8, DPP9 and FAP24 —for antitumor activity against mT3-2D PDAC tumors. mT3-2D cells are murine pancreatic cancer cells that are derived from organoids of tumors from ‘KPC’ C57BL/6 mice, which spontaneously form PDAC lesions due to KRAS and p53 mutations.19 By having KRAS and p53 mutations, which are critical in human pancreatic cancer development,25 this model closely mimics human pathophysiology. We confirmed that BXCL701 inhibited the DPP activity of both rFAP and rDPP4 in a dose-dependent manner using a fluorescent peptide substrate DPP activity assay (online supplemental figure 1A).
Supplemental material
Despite previous reports that DPP4 knockdown reduces human PDAC cell line proliferation in vitro,26 we found that BXCL701 had no effect on mT3-2D proliferation or viability in vitro (online supplemental figure 1B–D). To test BXCL701’s impact on PDAC tumor growth in vivo, we injected C57BL/6 mice subcutaneously with 1×10⁵ mT3-2D cells, waited for the tumors to reach 40–50 mm3, then began BXCL701 treatment. After 4 weeks, treatment was stopped and tumor growth was monitored (figure 1A). We found that BXCL701 significantly reduced tumor growth in vivo. The reduction in tumor volume was maintained even after treatment had ended (figure 1B, online supplemental figure 1E,F). By the end of the experiment, after 8 weeks, BXCL701 treatment had significantly improved overall survival (figure 1C).

DPP inhibition reduces murine PDAC tumor growth. (A) Schematic representation of in vivo experimental design testing BXCL701 treatment vs PBS controls in mT3-2D PDAC tumors. (B) Average mT3-2D tumor growth curves in C57BL/6 mice (n=10 per group) treated with PBS control or BXCL701 for 4 weeks. Dashed line represents the end of treatment. Tumor growth was monitored weekly. (Data represented as mean±SEM. *p<0.05 as determined by two-tailed unpaired t-test). (C) Survival curves of C57BL/6 mice (n=10 per group) treated with PBS control or BXCL701 for 4 weeks. Dashed line represents the end of treatment. (**p<0.01 as determined by log-rank (Mantel-Cox) test). (D) Schematic representation of in vivo experimental design testing BXCL701 treatment vs PBS controls in Pan02 PDAC tumors. (E) Average Pan02 tumor growth curves in C57BL/6 mice (n=10 per group) treated with PBS control or BXCL701. Tumor growth was monitored twice weekly. (Data represented as mean±SEM. *p<0.05, **p<0.01, ***p<0.001, ****p<0.0001 as determined by two-tailed unpaired t-test). (F) Survival curves of C57BL/6 mice (n=10 per group) treated with PBS control or BXCL701 for 4 weeks. Dashed line represents the end of treatment. (ns=nonsignificant as determined by log-rank (Mantel-Cox) test). DPP, dipeptidyl peptidase; PBS, phosphate-buffered saline; PDAC, pancreatic ductal adenocarcinoma.
To confirm that BXCL701’s efficacy was not specific to a single tumor model, we repeated this experiment using the Pan02 PDAC murine model. The Pan02 model is a highly aggressive and tumorigenic model of chemically induced pancreatic cancer that is also syngeneic in C57BL/6 mice.27 Mice were injected subcutaneously with 2.5×10⁶ Pan02 cells. Once tumors reached 80–120 mm3, the mice were treated daily with 20 µg of BXCL701 for 28 days (figure 1D). In the Pan02 model, BXCL701 again significantly reduced PDAC tumor growth in vivo (figure 1E, online supplemental figure 1G,H) but had no effect on overall survival (figure 1F).
BXCL701 treatment increases circulating inflammasome-related and Th1-related cytokines
The persistent reduction in tumor growth elicited by BXCL701 in the mT3-2D model even after treatment termination suggests that BXCL701’s effects are immunologic. It is well known that BXCL701 is a potent cytokine inducer.28–30 To determine how BXCL701 altered circulating cytokines in pancreatic cancer, we performed cytokine panels on sera from mice bearing Pan02 tumors after 1 and 2 weeks of BXCL701 treatment and from mice bearing mT3-2D tumors after 4 weeks and 5 weeks of BXCL701 treatment (figure 2A). In both tumor models, cytokines that result from pyroptosis, IL-1β and IL-18, were upregulated by BXCL701 treatment. This is consistent with reports that DPP8/9 inhibition by BXCL701 activates the inflammasome in macrophages and dendritic cells, leading to pyroptosis.12 13 24 Additionally, we observed an upregulation of many cytokines associated with the Th1 response (eg, IFNγ, IL-2, IL-12 and others), which is consistent with reports that inflammasome activation drives Th1 differentiation.31
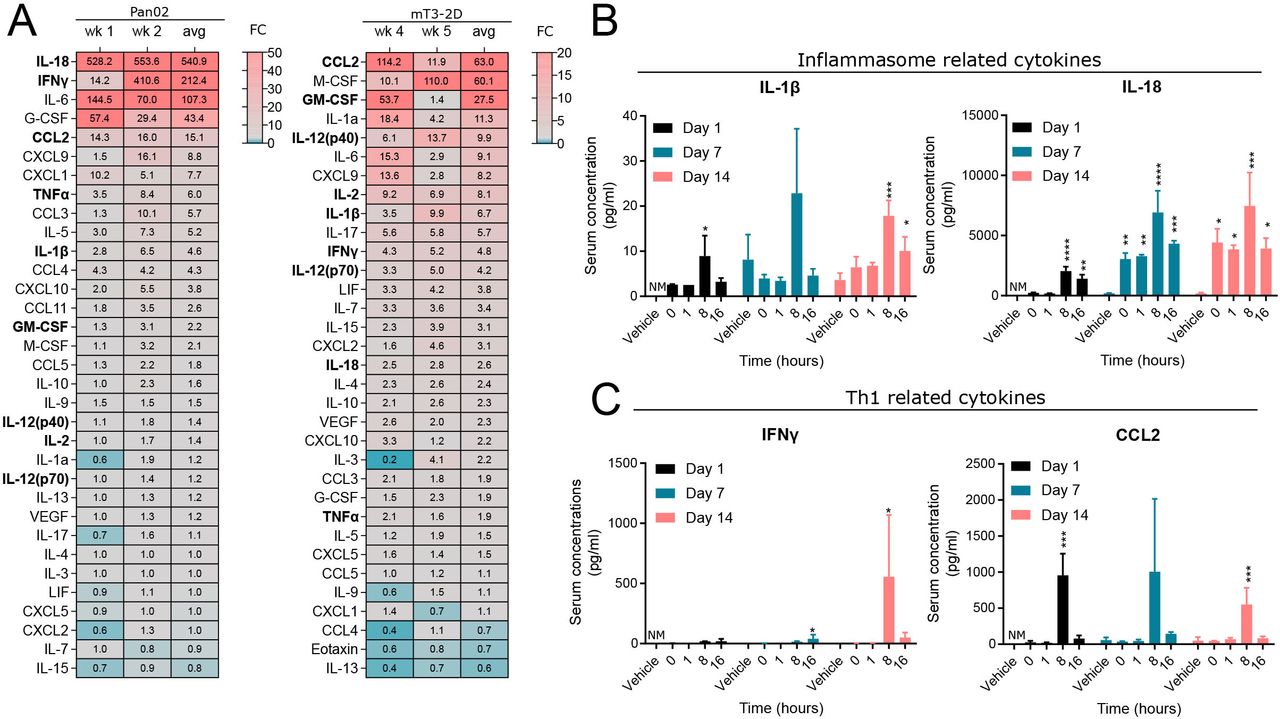
BXCL701 increases circulating inflammasome and Th1-related cytokines. (A) Heatmap showing average fold change of serum cytokine concentration of BXCL701-treated mice bearing Pan02 or mT3-2D tumors compared with PBS-treated controls. For the Pan02 sera, each value is the average of three triplicates. For the mT3-2D sera, each value is a single measurement of sera pooled from three to four mice. Th1 and inflammasome-related cytokines are bolded. (B) Serum concentration of inflammasome-related cytokines in mice bearing Pan02 tumors. Day 1 concentrations were compared with 0 timepoint. Day 7 and 14 concentrations were compared with vehicle. (n=3 mice/group, *p<0.05, **p<0.01, ***p<0.001, ****p<0.0001 calculated by ANOVA then Dunnett’s multiple comparison test, NM=not measured). (C) Serum concentration of Th1-related cytokines in mice bearing Pan02 tumors. Day 1 concentrations were compared with 0 timepoint. Day 7 and 14 concentrations were compared with vehicle. (n=3 mice/group, *p<0.05, ***p<0.001 calculated by ANOVA then Dunnett’s multiple comparison test, NM=not measured). ANOVA, analysis of variance; PBS, phosphate-buffered saline.
To further explore the dynamics of cytokine induction, we assessed serum concentrations of pyroptosis-related and Th1-related cytokines in mice bearing Pan02 tumors. Blood was collected over several hours after a single dose of 20 µg of BXCL701 or after 7 or 14 days of treatment (figure 2B). BXCL701 significantly upregulated IL-1β 8 hours after the first dose. BXCL701’s effects on IL-1β were maintained throughout the course of treatment; after 14 days of treatment, BXCL701 still upregulated IL-1β 8 and 16 hours after administration. Even more pronounced, BXCL701 significantly upregulated IL-18 concentrations at nearly every time point assessed. To investigate Th1-related cytokines, we assessed IFNγ, the principal Th1 effector cytokine, and CCL2, a major chemoattractant for Th1 T cells32 (figure 2C). Similar to IL-1β, BXCL701 significantly increased CCL2 8 hours after the first dose and 8 hours after the dose on day 14. Changes in IFNγ, however, were more delayed. BXCL701 did not significantly alter IFNγ levels after the first dose, but by day 7 BXCL701 therapy increased IFNγ 16 hours after administration and on day 14 BXCL701 increased IFNγ 8 hours after administration. We further confirmed that a single 20 µg dose of BXCL701 increased serum concentrations of IL-18, IL-1β, IFNγ and CCL2 using Balb/c mice bearing Wehi164 fibrosarcoma tumors (online supplemental figure 2), another model of immunologically ‘cold’ tumors.33
BXCL701 treatment increases tumor expression of CXCL9, Th1 response genes and NK and CD8+ T cell markers
We next examined local changes in the tumor. To determine how BXCL701 altered the transcriptional profile of pancreatic tumors, we performed bulk RNAseq on Pan02 tumors treated with BXCL701 or vehicle for 7 days or 14 days (figure 3A). To better understand the pathways most upregulated by BXCL701 treatment, we performed pathway analysis of differential expression statistics for BXCL701 and vehicle at 14 days (figure 3B, all significant pathways are shown in online supplemental table 1). The most significantly upregulated pathway was the Hallmark IFNγ response. Since IFNγ is the main effector cytokine for the Th1 response, this finding supports our hypothesis that BXCL701 induces Th1 responses in PDAC tumors. The majority of the remaining upregulated pathways were immune related, including Hallmark inflammatory response and Reactome cytokine signaling pathways in the immune system. Taken together, these data broadly suggest that BXCL701 treatment leads to increased immune activation within historically cold pancreatic tumors.
Supplemental material

RNAseq analysis shows that BXCL701 treatment upregulates CXCL9, Th1 response and NK and CD8 + T cell genes in Pan02 tumors. (A) Heatmap showing genes that are differentially expressed between BXCL701 and vehicle control at 14 days for all treatment groups and times (false discovery rate (FDR)-adjusted p value <0.05, absolute log fold change greater than 1). (B) Pathways with statistically significant over-representation between by BXCL701 treatment and vehicle control at 14 days. (C) Functional protein network from genes differentially expressed between BXCL701 and vehicle control at 14 days, created by STRING analysis.
We also visualized the significantly differentially expressed genes between BXCL701 treatment and vehicle control at 14 days by performing a functional protein network analysis using STRING (figure 3C). This type of analysis allows for visualization of significantly differentially expressed genes and their predicted interactions with one another. Using this visualization, two clusters emerged. One cluster was centered around Tbx21, the gene that encodes t-bet, the main transcription factor that directs Th1 lineage commitment.34 The other differentially expressed genes in this cluster were related to CD8+ T cell and NK cell activation, including IL-2rb, Perf1, Zap70, Llrk1, Icam, Cd226, Cd3e and Cd8a. The second cluster was centered around Cxcl9. CXCL9 is involved in a Th1-positive feedback loop; it is expressed by macrophages in response to IFNγ and then attracts CXCR3+ cells, including Th1 T cells, CD8+ T cells and NK cells, which produce IFNγ.35 Other relevant genes that were significantly differentially expressed in response to BXCL701 treatment included Nlrp1, Pdcd1 and IL18bp. Nlrp1 regulates inflammasome activation and overexpression results in pyroptosis. DPP8/9 inhibition activates the Nlrp1 inflammasome, leading to pyroptosis. Pdcd1 encodes the immune checkpoint PD-1, which could be expected to be upregulated in response to increased T cell attack. Finally, IL18bp encodes IL-18 binding protein, which becomes elevated in response to IL-18-mediated anti-tumor immunity.
BXCL701 treatment increases tumor levels of the chemoattractants CXCL9/10 and CXCR3+ cells
To confirm our RNAseq findings, we assessed tumors using a cytokine panel and immunohistochemistry (IHC). In mT3-2D tumors, BXCL701 treatment elevated CXCL9 and CXCL10 (figure 4A). This confirms and extends the RNAseq data that showed CXCL9 was one of the most upregulated genes after BXCL701 treatment. CXCL9 and CXCL10 are chemoattractants for CXCR3+ cells, so we assessed CXCR3+ cell content in mT3-2D tumors following BXCL701 treatment. mT3-2D tumors treated with BXCL701 for 4 weeks had significantly more CXCR3+ content than PBS-treated control tumors (figure 4B). Many immune cells express CXCR3, including CD4+ T cells, CD8+ T cells and NK cells. We collected splenocytes from C57BL/6 mice and confirmed that the CXCR3+ cell population consisted of approximately one-third CD4+ T cells, one-third CD8+ T cells and one-third NK cells (online supplemental figure 3A). Since we saw increased CXCR3+ cell content in BXCL701-treated tumors, we assessed tumors for changes in CD4+ T, CD8+ T and NK cell content by IHC. One week of BXCL701 treatment significantly increased CD4+ T cells, CD8+ T cells and NK cells (figure 4C,D). After 4 weeks of treatment, there was still a trend toward increased immune cell infiltration in the BXCL701-treated tumors, but the difference was no longer significant. We also assessed BXCL701-induced changes in the Pan02 model and saw similar results; 1 week of BXCL701 treatment significantly increased CD4+ T and CD8+ T cells, and there was a non-significant increase in NK cells (online supplemental figure 3B). After 2 weeks of treatment, the statistically significant differences were no longer identified. These data show that BXCL701 treatment increases T and NK cells in tumors early in treatment course.

BXCL701 increases tumor levels of chemoattractants CXCL9/10 and CXCR3 + cells. (A) Heatmap showing average fold change of cytokine concentration in mT3-2D tumors treated with BXCL701. Each value is the average from two timepoints: week 4 and week 5 of treatment. Each timepoint consisted of three to four pooled tumors. (B) Representative IHC images and quantification of CXCR3+ staining in tumors treated with PBS or BXCL701 for 4 weeks. Each point represents the average value from one tumor. (*p<0.05 as determined by unpaired two-tailed t-test). (C) Representative IHC images of CD4+, CD8+ and NKp46+ staining in tumors treated with PBS or BXCL701. (D) Quantification of CD4+, CD8+ and NKp46+ staining in tumors treated with PBS or BXCL701 for 7 days and 28 days. Each point represents one tumor/mouse. (ns=nonsignificant, *p<0.05, **p<0.01, ***p<0.001, ****p<0.0001 as determined by unpaired two-tailed t-test). IHC, immunohistochemistry; PBS, phosphate-buffered saline.
BXCL701 treatment enhances anti-PD1 efficacy in PDAC
Previous studies have shown that anti-PD1 efficacy is dependent on the CXCR3 axis.36–38 Since our RNAseq analysis showed anti-PD1 was one of the genes significantly upregulated by BXCL701 in Pan02-treated tumors and that BXCL701 increased CXCR3+ cells in mT3-2D tumors, we hypothesized that BXCL701 may enhance the therapeutic efficacy of anti-PD1. To test this hypothesis, we treated C57BL/6 mice bearing mT3-2D tumors with BXCL701, anti-PD1 or both (figure 5A). We confirmed that BXCL701 treatment reduced circulating DPP activity (figure 5B) and tumor DPP activity (figure 5C). We found that combination-treated (referred to as ‘combo’) mT3-2D tumors were significantly smaller than either monotherapy or untreated controls (figure 5D,E, online supplemental figure 4A). Initial studies in other models such as the Pan02 C57BL/6 PDAC model and the Wehi164 Balb/c fibrosarcoma model showed similar trends in benefit (online supplemental figure 4B–I). Although the reduction in tumor growth by the addition of anti-PD1 to BXCL701 did not reach significance, the evaluation of combination treatment efficacy is limited by the tremendous efficacy of BXCL701 monotherapy in these models.

BXCL701 treatment enhances anti-PD1 efficacy in mT3-2D tumors. (A) Schematic representation of in vivo experimental design testing combination treatment of BXCL701 and anti-PD1 vs single agents alone and PBS controls in mT3-2D tumors. (B) DPP activity measured in the serum of PBS, anti-PD1, BXCL701 or anti-PD1 and BXCL701 (‘Combo’) treated mice (n=5 per group, each dot representing pooled serum from three mice, **p<0.01, ***p<0.001, ****p<0.0001 as determined by ANOVA followed by Tukey’s multiple comparison’s test, any pairwise comparisons not shown were not significant). (C) DPP activity measured in the tumor lysates of PBS, anti-PD1, BXCL701 and combo-treated mice (n=3 per group,*p<0,05 as determined by ANOVA followed by Tukey’s multiple comparison’s test, any pairwise comparisons not shown were not significant). (D) Average mT3-2D tumor growth curves in C57BL/6 mice (n=15 per group) treated with PBS, anti-PD1, BXCL701 and combo. Tumor growth was monitored weekly. (E) Tumor volumes for PBS, anti-PD1, BXCL701 and combo-treated mT3-2D tumors at the end of treatment (week 4). (***p<0.001, ns=nonsignificant as determined by ANOVA followed by Tukey’s multiple comparison’s test). (F) Flow cytometry data representing CD4+, CD8+ and NK1.1+ cells as percent of live cells in tumors collected from PBS andcombo-treated mice (n=3 per group, each dot representing three to four tumors from individual mice, *p<0.05, **p<0.01, as determined by unpaired two-tailed t-test). (G) Flow cytometry data representing percentage of live cells that are CXCR3+CD4+, CXCR3+CD8+ and CXCR3+NK1.1+ cells in tumors from PBS, anti-PD-1, BXCL701 and combo treated mice (n=3 per group, each dot representing three to four tumors from individual mice, *p<0.05, **p<0.01, ***p<0.001, ns=nonsignificant as determined by one-way ANOVA followed by Tukey’s multiple comparison test). (H) Flow cytometry data representing percentage of live cells that are CD4 +IFNγ+Tbet+ Th1 cells in tumors from PBS, anti-PD-1, BXCL701 and combo treated mice (n=3 per group, each dot representing three to four tumors from individual mice, *p<0.05, **p<0.01, ***p<0.001, ****p<0.0001, ns=nonsignificant as determined by one-way ANOVA followed by Tukey’s multiple comparison test). ANOVA, analysis of variance; DPP, dipeptidyl peptidase; PBS, phosphate-buffered saline.
We next assessed alterations in intratumoral mT3-2D immune cell content after 4 weeks of combo treatment using flow cytometry. Combo treatment significantly increased tumor CD4+ T cells, CD8+ T cells and NK cells (figure 5F and online supplemental figure 5A). The IHC data shown in figure 4 suggests that these recruited immune cells are CXCR3+. In agreement with this, combination treatment increased the percentage of CXCR3+ CD4+ T, CXCR3+CD8+ T and CXCR3+ NK cells in mT3-2D tumors (figure 5G and online supplemental figure 5B). We also found combination treatment significantly increased the percetnage of CXCR3+ F4/80+ macrophages (online supplemental figure 5C). We also wanted to interrogate the percentage of Th1 cells in tumors to verify our RNAseq and cytokine data that shows BXCL701 treatment increases Th1 response. To do so, we gated for CD4+INFγ+Tbet+ T cells (online supplemental figure 5D) and found that anti-PD1 and BXCL701 monotherapy increased the percentage of Th1 cells in mT3-2D tumors and that combo treatment further increased the percentage of Th1-positive tumors in comparison with monotherapy alone and untreated controls (figure 5H).
BXCL701+anti-PD1 combination treatment is dependent on both CD8+ T cells and NK cells
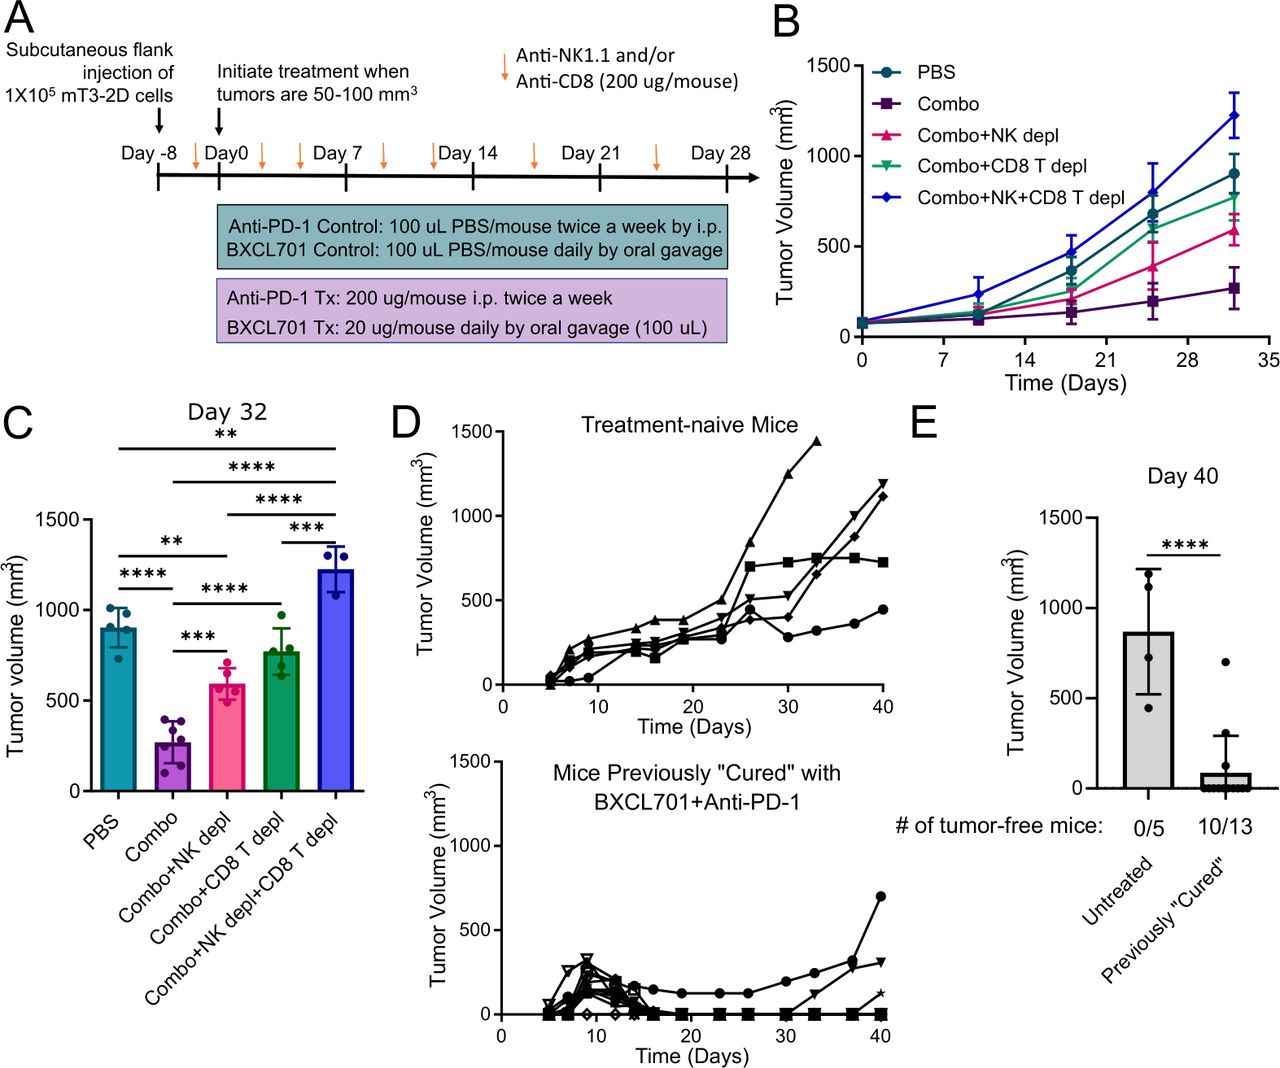
To determine if CD8+ T and/or NK cells were involved in mediating the efficacy of BXCL701+anti-PD1 combination treatment, we tested the impact of NK depleting (anti-NK1.1) and CD8+ T cell depleting (anti-CD8) antibodies on the efficacy of combination-treated mice bearing subcutaneous mT3-2D tumors (figure 6A). We confirmed that anti-CD8 antibodies and anti-NK1.1 antibodies successfully depleted CD8 + T cells and NK, respectively, from C57BL/6 splenocytes (online supplemental figure 6A). As before, combination treatment significantly reduced mT3-2D tumor growth (figure 6B,C, and online supplemental figure 6B). Unsurprisingly, CD8+ T cell depletion reduced combination treatment efficacy. NK cell depletion also significantly reduced combination treatment efficacy, although the residual tumors were still significantly smaller than PBS-treated controls. Depletion of both CD8+ T and NK cells resulted in tumors that were significantly larger than PBS-treated tumors despite receiving combination treatment. This demonstrates that both NK cells and CD8+ T cells contribute to combination treatment efficacy and highlights that both CD8+ T and NK cells mediate PDAC tumor regression.

BXCL701 +anti-PD1 combination treatment is dependent on both CD8+ T cells and NK cells. (A) Schematic representation of in vivo experiment design testing effect of CD8+ T cell and NK cell depletion on combination treatment (BXCL701 +anti-PD1) efficacy in mT3-2D tumors. (B) Average mT3-2D tumor growth curves in C57BL/6 mice treated with PBS (n=10), BXCL701 +anti-PD1 combination (n=10), combination with NK1.1+ NK cell depletion (n=5), combination with CD8+ T cell depletion (n=5), or combination with NK1.1+ NK cell depletion and CD8+ T cell depletion (n=5). Tumor growth was monitored weekly. (C) Tumor volumes after 4 weeks of treatment (day 32) for mT3-2D tumors treated with PBS, BXCL701+anti-PD1 combination (‘Combo’), combo with NK1.1+cell depletion, combo with CD8 + T cell depletion or combo with both NK1.1+ and CD8+ T cell depletion. (ns=non-significant, **p<0.01,***p<0.001, ****p<0.0001 as determined by analysis of variance followed by Tukey’s multiple comparison’s test). (D) Individual tumor growth curves for treatment-naive C57BL/6 mice (n=5) and previously ‘cured’ C57BL/6 mice (n=13) injected with 5×10⁵ mT3-2D cells. Tumor growth was monitored three times a week. (E) mT3-2D tumor volumes in treatment-naive C57BL/6 mice and previously ‘cured’ C57BL/6 mice 40 days after injection of 5×10⁵ mT3-2D cells. (****p<0.0001 by unpaired two-tailed t-test). PBS, phosphate-buffered saline.
BXCL701+anti-PD-1 combination treatment induces memory response against rechallenge
To assess memory response, we rechallenged ‘cured’ mice with mT3-2D cells. A schematic representation of the rechallenge experiment design is shown in online supplemental figure 6C. To generate ‘cured’ mice, we injected 20 C57BL6 mice with 1×10⁵ mT3-2D cells. When tumors reached 20–30 mm3 (smaller than previous experiments), we began treatment with 20 µg BXCL701 daily and 200 µg anti-PD1 twice per week. At the end of this experiment (40 days), 13 mice were tumor-free, that is, ‘cured’. Six months later, we rechallenged these ‘cured’ mice by injecting five times the number of mT3-2D cells (5×10⁵). As controls, we also injected five treatment-naive mice with 5×10⁵ mT3-2D cells. We then monitored tumor growth without administering any additional treatment. All five treatment-naive mice had predictable, rapid tumor growth (figure 6D). Of the 13 ‘cured’ mice, 12 mice had initial tumor growth, which was promptly followed by tumor regression (figure 6D). By the end of the experiment, 40 days after rechallenge, 10 out of the 13 mice remained tumor-free (figure 6E).
NK cell marker expression in human PDAC tumor samples correlates with PDAC patient outcomes
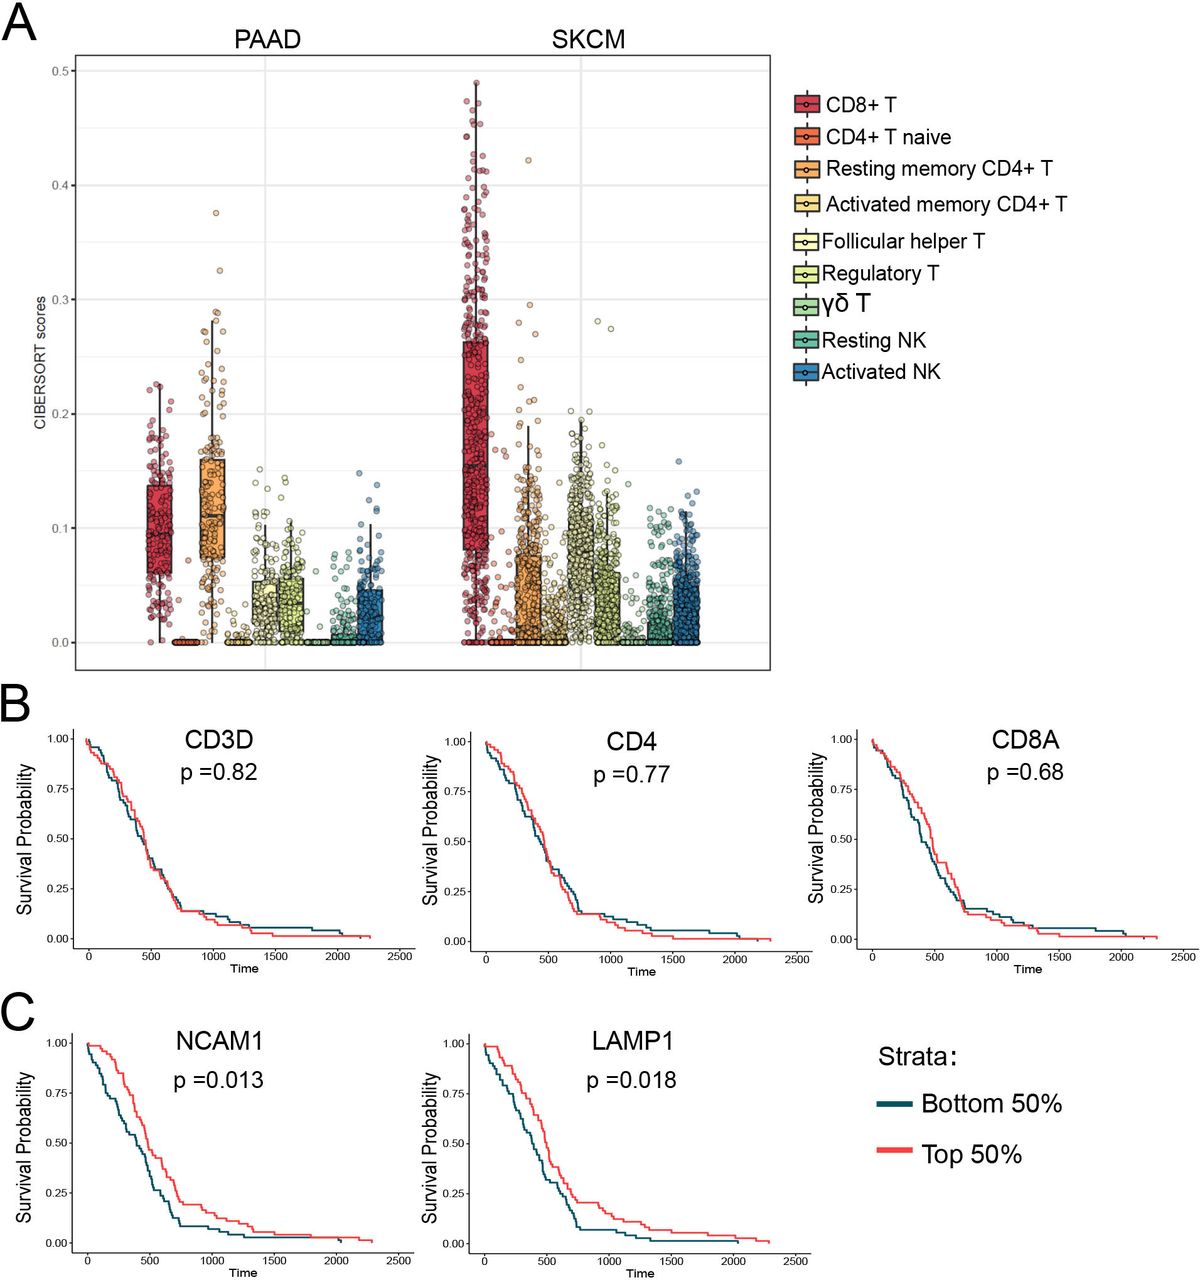
Despite the long-standing perception that anticancer immunity was inconsequential to PDAC biology, several studies have highlighted the potential importance of CD8+ T cells in regulating PDAC tumor growth.39 40 However, there is little research into the roles of NK cells in PDAC tumor biology. Our results suggest that both CD8+ T cells and NK cells are capable of regulating PDAC tumor growth. Interestingly, PDAC cells frequently lose MHC expression to evade CD8+ T cell attack.41 As NK cells are the primary immune cell type capable of clearing MHC-deficient cells, we hypothesized that NK cells may play a larger role in PDAC tumor biology than previously appreciated. To assess the relevance of NK cell biology to human PDAC tumors, we explored TCGA RNAseq data. We first used CIBERSORT—a computational tool that can use gene expression data to estimate cell type abundances in a mixed cell population.42 We compared the relative abundance of immune cells in PDAC tumors to melanoma tumors (skin cutaneous melanoma) because melanomas are considered ‘hot’ or highly infiltrated by immune cells. Using this comparison, we observed that, while PDAC tumors have much lower infiltration of CD8+ T cells than melanoma, they have comparable levels of both resting and activated NK cells (figure 7A). This supports findings that NK cells are present in human PDAC tumors and thus provides the opportunity for therapeutic manipulation.

NK cell marker mRNA levels are increased in human pancreatic cancer tumors and predictive of survival. (A) CIBERSORT scores representing the relative abundance of various immune cell types derived from RNAseq data from TCGA for pancreatic adenocarcinoma (PAAD) and skin cutaneous melanoma (SKCM). (B) Overall survival curves demonstrating there is no significant difference in survival in TCGA PDAC patients with high (top 50%) vs low (bottom 50%) mRNA expression levels of T cell markers (CD3, CD4 and CD8A). (C) Overall survival curves demonstrating TCGA PDAC patients with high levels (top 50%) of NK cell marker CD56 and NK cell activation marker LAMP1 have significantly longer overall survival compared with PDAC patients with low expression (bottom 50%) of CD56 or LAMP1. PDAC, pancreatic ductal adenocarcinoma; TCGA, The Cancer Genome Atlas.
We wanted to further explore the relationship between NK cells and human PDAC tumors by assessing the correlation of immune cell marker expression with PDAC patient overall survival. Patients with gene expression in the top 50% were considered ‘high’ and patients in the bottom 50% were considered ‘low’. We found that elevated expression of T cell markers, CD3, CD4 and CD8A, were not significantly correlated with overall survival (figure 7B). In contrast to the T cell marker data, patients with higher tumorous expression of the NK cell marker NCAM1 (CD56) and NK cell activation marker LAMP1 (CD107a) had significantly longer overall survival than patients with low expression of CD56 and LAMP1 (figure 7C). These data suggest that for PDAC patients, increased NK cell infiltration and activation are associated with better clinical outcomes.
Discussion
Pancreatic cancer is considered an immunologically cold tumor resistant to immunotherapy. Because of its immunosuppressive microenvironment and immune escape mechanisms, targeting PD1/PD-L1 in PDAC is ineffective.4 Here, we show that DPP inhibition using BXCL701 reduces PDAC tumor growth and improves anti-PD1 efficacy in murine models of PDAC. Combination treatment is dependent on both NK and CD8+ T cells. We propose that BXCL701 enhances NK and CD8+ T cell recruitment by altering the CXCL9/10-CXCR3 axis in two ways: (1) DPP4 inhibition blocks DPP4-mediated CXCL9/10 inactivation, and (2) DPP8/9 inhibition activates the inflammasome, increasing IL-1β and IL-18, driving Th1 response and increasing CXCL9/10 expression.
A plethora of chemokines have putative DPP4 truncation sites, so DPP4 inhibition may induce broad changes in tumor immunity.43 Proost et al44 confirmed some of these putative truncation sites by demonstrating that all three conventional CXCR3 ligands (CXCL9, CXCL10 and CXCL11) can be cleaved and inactivated by DPP4 in vitro. In 2015, Barreira da Silva et al6 confirmed that DPP4 inhibitors block truncation and increase tumor levels of full-length active CXCL10 in vivo. This has subsequently been confirmed in additional cancer models.7 Although all these studies have been in mice, it is reasonable to hypothesize that DPP inhibition would have a similar effect in humans; a 2016 study showed that DPP4 inhibitors reduce circulating levels of truncated CXCL10 and increase circulating levels of full-length active CXCL10.45 DPP8 and potentially DPP9 are also capable of cleaving CXCL10 and CXCL11 in vitro.46–48 Since we used a broad DPP inhibitor that inhibited DPP4 and DPP8/9, it is possible that the elevation of tumorous CXCL9 and CXCL10 we observed was due to inhibition of all these proteins rather than just DPP4. In fact, Barreira da Silva et al found that DPP4 inhibitors prevented in vivo truncation of CXCL10 but not CXCL9,6 suggesting that the increased concentrations of CXCL9 we observe in BXCL701 treated tumors may be attributed to DPP8/9 inhibition by BXCL701.
Previous studies of the effects of DPP4 specific inhibition in murine cancer models showed that DPP4 inhibition not only increases tumor CXCL10 concentrations but also increases CXCR3+ NK and CD8+ T cell trafficking into tumors.6 7 Interestingly, DPP4-specific inhibition improved anti-CTLA4 and anti-CTLA4 +anti-PD1 combination treatment but did not improve anti-PD1 alone.6 This is rather unexpected given that the CXCR3 axis is critical for anti-PD1 response.36 49 However, the finding that DPP4 inhibition does not enhance anti-PD1 efficacy despite increasing CXCR3+ cells may be explained by the chemokines involved. Chow et al36 showed that CXCR3 and CXCL9, but not CXCL10, were required for anti-PD1 response in murine models of colorectal cancer. Since DPP4 inhibition did not alter CXCL9 in vivo,6 it would not be expected to enhance anti-PD1 based on the findings of Chow et al. Because BXCL701 increases both CXCL9 and CXCL10, we believe it may be better at enhancing anti-PD1 efficacy than DPP4 inhibition alone.
It is well established that DPP8/9 inhibition by BXCL701 activates the Nlrp1 inflammasome, resulting in pyroptosis and the production of IL-1β and IL-18.12 13 24 50 51 The inflammasome is becoming a widely recognized regulator of anticancer immunity and immunotherapy response.52 While there is little research on the impact of the Nlrp1 inflammasome on cancer biology, reports are inconsistent with respect to the impact of the Nlrp3 inflammasome, the most studied and characterized inflammasome, on cancer biology.53 However, in murine models of colorectal cancer, the Nlrp3 inflammasome reduces tumor growth by increasing IL-18, which in turn increases IFNγ and STAT1 expression, similar to what we observed (figure 2).
Although the impact of inflammasome activation and IL-1β on cancer progression remain controversial, IL-18 itself is a promising immunotherapeutic agent. Ma et al38 showed that IL-18 enhances the therapeutic efficacy of anti-PD1 in murine models of melanoma metastasis. IL-18 +anti-PD1 combination treatment efficacy was dependent on NK cells. IL-18 enhances NK cell IFNγ production54 and migratory capabilities.55 Additionally, IL-18 ‘primed’ NK cells recruit CXCL9/10-producing dendritic cells into tumors.56 57 While we did demonstrate NK cells contribute to BXCL701 +anti-PD1 efficacy (figure 6), these effects could be caused by altering tumor growth directly (ie, through tumor cell lysis) or indirectly (ie, by altering dendritic cell content), or potentially a combination of both. In support of the indirect hypothesis, Walsh et al58 showed that BXCL701 efficacy was dependent on dendritic cells, since BXCL701 enhanced dendritic cell trafficking, resulting in acceleration of T-cell priming. It is plausible that the increase in IL-18 resulting from BXCL701 treatment primed NK cells, which in turn recruited CXCL9/10-expressing dendritic cells. Regardless, this study highlights the importance of NK cells in regulating PDAC tumor growth and suggests that pharmacologic modulation of NK cell content or phenotype with BXCL701 can enhance immunotherapy efficacy in PDAC.
Previous studies have pointed to the importance of NK cells in PDAC biology. Davis et al59 showed that PDAC patients with higher total number of circulating NK cells, but not T cells, experienced a longer overall survival. Similarly, our analysis of TCGA RNAseq data suggests that PDAC patients with higher tumorous contents of NK cells, but not T cells, experience longer overall survival (figure 7). Additionally, Hsu et al60 demonstrated that NK cells contribute directly to PD-1/PD-L1 blockade efficacy. While Hsu et al showed that NK cells express PD-1 and become activated in response to anti-PD1 treatment, subsequent studies have questioned if NK cells express PD-1 at high enough levels to be directly altered by anti-PD1 treatment.61 Either way, our results demonstrate that enhancing NK cells improved the efficacy of BXCL701 plus anti-PD1 in murine models of PDAC.
CD4+ T helper (Th) cells are prolific cytokine producers and major coordinators of the immune response. The two predominant Th cell subtypes are Th1 and Th2. In most cancer types, increased Th1 cells and their associated cytokines correlate with improved antitumor immunity.62–67 PDAC patients’ local (ie, within tumor) and systemic (ie, in serum) immune responses are shifted toward Th2.68 69 Elevated Th2 immune responses correlate with shorter overall PDAC patient survival.70 It has been hypothesized that therapeutic strategies to shift PDAC tumors to Th1 would reverse the immunosuppressive microenvironment and improve immunotherapy.71 Here, we show that BXCL701 successfully increases circulating and tumor levels of Th1-related cytokines (figures 2 and 3 and increases tumor levels of Th1 cells (figure 5H). Inflammasome activation as well as IL-1β and IL-18 expression can drive Th1 responses.31 72–74 We therefore propose that BXCL701 enhances Th1 responses in PDAC models through DPP8/9 inhibition and inflammasome activation.
Previous preclinical work showed that oral administration of BXCL701 slowed growth of syngeneic tumors derived from fibrosarcoma, lymphoma, melanoma, mastocytoma, rhabdomyosarcoma and bladder cancer cell lines in mice28 58 and enhanced chemotherapy efficacy in murine models of colon carcinoma.75 Unfortunately, subsequent clinical trials failed to replicate BXCL701’s success as a monotherapy76 77 or in combination with chemotherapy.78 79 We propose that BXCL701 may be more effective clinically if used in combination with immunotherapy, particularly with anti-PD1, and especially in poorly immunogenic tumors such as PDAC. Recent clinical data suggest that this may indeed be feasible for both non-inflamed, checkpoint naive cancers and those resistant/refractory to prior checkpoint treatment.30 51 80–83
In summary, this work highlights the relevance of DPPs to PDAC tumor biology and shows that DPP inhibition by BXCL701 enhances naturally occurring antitumor immunity and anti-PD1 efficacy in PDAC models. These findings support further studies and clinical development of BXCL701 in combination with anti-PD1 antibody therapy.
Supplemental material
Data availability statement
Data are available in a public, open access repository. RNAseq dataset files are available at Gene Expression Omnibus (GEO) (http://www.ncbi.nlm.nih.gov/geo/) GSE173441. All additional data relevant to the study are included in the article or uploaded as supplementary information. All data are presented in the main and supplemental results.
Ethics statements
Patient consent for publication
Ethics approval
All mT3-2D animal studies were reviewed and approved by the Georgetown University Institutional Animal Care and Use Committee (GU IACUC). Pano2 and Wehi164 studies were conducted following an approved IACUC protocol at Crown Bioscience.
Acknowledgments
We would also like to acknowledge Rita Ren (in life support of animal studies), Xiaolong Tu (IHC and Cytokines evaluation), Bonnie Chen (mRNA isolation and RNAseq experiments) and all of the team members at Crown Bioscience at San Diego, California, USA, and Beijing PR China 102200 for running the studies. We would also like to acknowledge the Georgetown Lombardi Comprehensive Cancer Center Animal Models Rodent Shared Resource (AMSR), Flow Cytometry and Cell Sorting Shared Resource (FCSR), Histopathology and Tissue Shared Resource (HTSR). Graphical abstract created with Biorender.com.
References
Supplementary materials
Supplementary Data
This web only file has been produced by the BMJ Publishing Group from an electronic file supplied by the author(s) and has not been edited for content.
Footnotes
Twitter @allisonoconn, @efaithd, @FertigLab
Contributors AF wrote the manuscript, generated figures, designed experiments and analyzed data; SW designed experiments, generated and analyzed data and edited the manuscript; EFM, ML, EJF analyzed RNAseq data; SAJ, JM, VA, VO, AZ, EZ designed experiments and coordinated data curation, VA, DB, ST analyzed data; LMW designed experiments, edited the manuscript and is the guarantor of this manuscript. All co-authors read, edited and approved the manuscript.
Funding CA50633 (LMW), F30 CA239441(AF), Lustgarten Foundation (EJF) and Emerson Collective (EJF), CA51008 (LMW). The Georgetown Lombardi Comprehensive Cancer Center Shared Resources are supported by P30-CA051008 (LMW) and S10OD016213.
Competing interests LMW received research funding from BioXcel Therapeutics.
Provenance and peer review Not commissioned; externally peer reviewed.
Supplemental material This content has been supplied by the author(s). It has not been vetted by BMJ Publishing Group Limited (BMJ) and may not have been peer-reviewed. Any opinions or recommendations discussed are solely those of the author(s) and are not endorsed by BMJ. BMJ disclaims all liability and responsibility arising from any reliance placed on the content. Where the content includes any translated material, BMJ does not warrant the accuracy and reliability of the translations (including but not limited to local regulations, clinical guidelines, terminology, drug names and drug dosages), and is not responsible for any error and/or omissions arising from translation and adaptation or otherwise.