Article Text

Abstract
Background Treatment-free survival (TFS) characterizes disease control after discontinuation of immune checkpoint inhibitors (ICIs) until subsequent therapy or death. We previously evaluated TFS in a pooled analysis of the CheckMate 067 and CheckMate 069 trials of the ICIs nivolumab and ipilimumab, alone or in combination, in patients with advanced melanoma after minimum follow-up of 36 months. This analysis investigated TFS differences between treatments in CheckMate 067 after a minimum follow-up of 60 months, and their relation to overall survival (OS) differences.
Methods Data were from 937 patients who initiated treatment (nivolumab plus ipilimumab, nivolumab, or ipilimumab) in CheckMate 067 (NCT01844505). TFS was defined as the area between the Kaplan-Meier curves for time to protocol therapy cessation and time to subsequent systemic therapy initiation or death, each measured from randomization. TFS was partitioned as time with and without toxicity. Toxicity included persistent and late-onset grade ≥2 select treatment-related adverse events (ie, those of potential immunologic etiology). The area between Kaplan-Meier curves was estimated by the difference in 60-month restricted-mean times of the endpoints. Between-group differences were estimated with bootstrapped 95% CIs.
Results At 60 months from randomization, 39%, 24%, and 11% of patients assigned to treatment with nivolumab plus ipilimumab, nivolumab, and ipilimumab, respectively, had survived and were treatment-free. The 60-month mean TFS was approximately twice as long with the combination (19.7 months) than with nivolumab (9.9 months; absolute difference, 9.8 (95% CI 6.7 to 12.8)) or ipilimumab (11.9 months; absolute difference, 7.8 (95% CI 4.6 to 11.0)). In the respective groups, mean TFS represented 33% (8% with and 25% without toxicity), 17% (2% and 14%), and 20% (3% and 17%) of the 60-month period. Compared with 36-month estimates, mean TFS over the 60-month period represented slightly greater percentages of time in the nivolumab-containing regimen groups and a lesser percentage in the ipilimumab group. TFS differences between the combination and either monotherapy increased with longer follow-up.
Conclusions Along with improved long-term OS with the nivolumab-containing regimens versus ipilimumab, TFS without toxicity was sustained with nivolumab plus ipilimumab versus either monotherapy, demonstrating larger between-group differences with extended follow-up.
- melanoma
- immunotherapy
- programmed cell death 1 receptor
- clinical trials
- phase III as topic
- CTLA-4 antigen
Data availability statement
Data are available on reasonable request. BMS policy on data sharing may be found at https://www.bms.com/researchers-and-partners/independent-research/data-sharing-request-process.html.
This is an open access article distributed in accordance with the Creative Commons Attribution Non Commercial (CC BY-NC 4.0) license, which permits others to distribute, remix, adapt, build upon this work non-commercially, and license their derivative works on different terms, provided the original work is properly cited, appropriate credit is given, any changes made indicated, and the use is non-commercial. See http://creativecommons.org/licenses/by-nc/4.0/.
Statistics from Altmetric.com
- melanoma
- immunotherapy
- programmed cell death 1 receptor
- clinical trials
- phase III as topic
- CTLA-4 antigen
Introduction
Immune checkpoint inhibitors (ICIs) are recommended first-line treatments for advanced melanoma,1 and their benefits are typified by unique patterns of antitumor response.2 For instance, patients with advanced melanoma who discontinue ICIs may experience periods of remission or durable disease control without the need for subsequent systemic therapy. Consequently, the classical clinical trial endpoints of overall survival (OS) and progression-free survival (PFS) may not optimally capture all treatment benefits with ICIs. To better characterize periods in which patients are off ICI treatment, we proposed treatment-free survival (TFS) as a novel outcome measure, defined by the time between cessation of first-line ICI therapy and subsequent systemic anticancer therapy initiation or death.3 To include all patients from the initiation of therapy, TFS was estimated by using the area between two Kaplan-Meier curves for conventional time-to-event endpoints, each defined from randomization: time to ICI protocol therapy cessation and time to subsequent systemic anticancer therapy initiation or death. The resulting quantity is an estimated mean duration over a fixed period of time (ie, a restricted-mean time). Because adverse events (AEs) with ICIs may persist beyond or emerge after treatment discontinuation, TFS was subdivided into times with and without toxicity.3 Evaluation of TFS is part of an integrated analysis inspired by the Quality-adjusted Time Without Symptoms or Toxicity approach4 5 that comprehensively describes how patients spend survival time, which is prolonged with the use of ICIs.
We initially reported TFS and other survival states for patients with advanced melanoma who were treated with the ICIs nivolumab (an antiprogrammed death-1 antibody) and ipilimumab (an anticytotoxic T lymphocyte antigen-4 antibody) alone or in combination, using pooled data from the phase 3 CheckMate 067 trial6 and the phase 2 CheckMate 069 trial7 over the 36-month period from randomization.3 The 5-year update of CheckMate 067 reported sustained long-term OS benefit, with no apparent loss of health-related quality of life (HRQoL) or late toxic effects in patients who received nivolumab-containing regimens (nivolumab plus ipilimumab or nivolumab alone) compared with ipilimumab alone.8 Five-year OS rates were 52% and 44% with nivolumab plus ipilimumab and nivolumab alone, compared with 26% with ipilimumab.6 Given this updated information, we aimed to investigate the durability of TFS over a 5-year period from initiation of first-line ICI therapy in CheckMate 067 and to comprehensively characterize how patients with advanced melanoma treated with these regimens spent the 5 years from initiation of therapy on and off treatment, as well as with and without treatment toxicity.
We previously recommended that TFS be analyzed in future clinical trials involving ICIs.3 In the current analysis, we also systematically estimated mean TFS at sequential follow-up milestones from treatment initiation to imitate the maturation of trial results with accumulating follow-up time. The objectives of this analysis were to evaluate the magnitude of between-group differences in TFS that may be observed between the three ICI treatments in CheckMate 067 and their relation to differences in OS over longer follow-up duration.
Methods
The study population consisted of previously untreated patients with unresectable stage III or stage IV advanced melanoma who enrolled in CheckMate 067 (NCT01844505).8 In that trial, 945 patients were randomly assigned to receive nivolumab 1 mg/kg plus ipilimumab 3 mg/kg every 3 weeks (Q3W) for four doses, followed by nivolumab 3 mg/kg every 2 weeks (Q2W) thereafter; nivolumab 3 mg/kg Q2W (plus ipilimumab-matched placebo); or ipilimumab 3 mg/kg Q3W for four doses (plus nivolumab-matched placebo) followed by placebo infusion Q2W thereafter. The assigned protocol treatment (or placebo) was continued until disease progression, the occurrence of unacceptable toxicity, or patient withdrawal of consent. Information on subsequent therapy use was collected, except in cases of withdrawal of consent. AEs were graded according to National Cancer Institute Common Terminology Criteria for Adverse Events V.4. The minimum follow-up from randomization was 60 months.8
The current analysis included 937 randomized patients who initiated therapy, including 313 with nivolumab plus ipilimumab, 313 with nivolumab, and 311 with ipilimumab. Distributions of time-to-event endpoints, each defined from randomization, were estimated using the Kaplan-Meier method. Follow-up was restricted at 60 months to estimate restricted-mean times for endpoints. The restricted-mean time is a measure of average survival from time 0 to a specified time point and may be estimated as the area under the Kaplan-Meier curve up to that time point.9 As previously described,3 TFS was defined by the area between Kaplan-Meier curves for two time-to-event endpoints: time to protocol therapy cessation and time to subsequent therapy initiation or death (online supplemental table S1). More comprehensively, the two endpoints were used to partition the area under the OS curve into three survival states (figure 1): time on protocol therapy, TFS, and survival after subsequent therapy initiation. Each survival state was characterized as an area between the Kaplan-Meier curves and was estimated as differences between 60-month restricted-mean times.
Supplemental material

Characterization of how patients spent OS time: schematic illustration defining endpoints that partition area under the OS curve into TFS and other survival states. Areas equal restricted-mean times. aTime after cessation of protocol therapy without toxicity, before initiation of subsequent systemic anticancer therapy or death. bTime after cessation of protocol therapy with toxicity while treatment-free. cIncludes toxicity persisting from protocol therapy and toxicity newly presenting after protocol therapy cessation. OS, overall survival; TFS, treatment-free survival.
TFS was further partitioned into survival states with and without toxicity. Similarly, time on protocol therapy was partitioned with and without toxicity.4 5 10 Five definitions of toxicity were used in the analysis. The primary definitions were based on treatment-related select AEs (ie, those of potential immunologic etiology), either of grade ≥2 or of grade ≥3, as recently described for the trial population8 (hereafter termed ‘select treatment-related AEs (TRAEs)’). Consistent with the previous analysis,3 toxicity was also defined based on any-grade TRAEs, grade ≥2 TRAEs, and grade ≥3 TRAEs, as well as on the use of systemic immunomodulatory medication (IMM) for any-grade TRAEs, which included corticosteroids (with the exclusion of oral corticosteroids used as hormone replacement for pituitary and adrenal insufficiency) and other immunosuppressive agents (eg, infliximab and mycophenolate mofetil). At this point in the trial follow-up, any-grade select TRAEs and grade ≥3 TRAEs ongoing after protocol treatment cessation continued to be queried for resolution; however, the resolution of ongoing grade 2 TRAEs (non-select) may not have been captured, which would tend to result in an overestimation of TFS with toxicity defined based on grade ≥2 TRAEs.
Relevant reported AEs (or IMMs) occurring between randomization and the start of subsequent therapy (including those newly reported after cessation of protocol therapy) were considered, and the number of unique days with one or more AEs reported during the relevant period were counted. If an AE began during protocol therapy and persisted after cessation, then the total number of days was attributed to the relevant period. If an AE was unresolved at subsequent therapy initiation, then the number of days was truncated at that point. Without double-counting AEs occurring on the same day, the number of unique days during each period was summed together; these were summarized and graphically represented as contiguous days, although they did not occur in this manner.4 5 Two additional endpoints were calculated for partitioning and illustration, time to cessation of both protocol therapy and toxicity and time to cessation of protocol therapy without toxicity, by adding and subtracting toxicity days from the time to protocol therapy cessation endpoint (figure 1).
Between-group comparisons were based on the between-group absolute differences in 60-month restricted-mean times, with bootstrapped 95% CIs, and were also expressed as relative differences (between nivolumab plus ipilimumab, nivolumab monotherapy, and ipilimumab monotherapy) in mean times. The 60-month restricted-mean times were also reported as percentages of the 60-month period. The probability of surviving treatment-free (ie, in TFS) at 60 months from randomization was estimated by the difference in Kaplan-Meier estimates of 60 months of the two defining endpoints.11
To investigate the patterns of outcomes and their between-group differences according to duration of follow-up time, the between-group differences in mean TFS and survival states were also re-estimated by sequentially restricting follow-up to 24, 36, 48, or 60 months. The between-group differences were plotted in restricted-mean time curves.9
Results
TFS after 60 months of follow-up
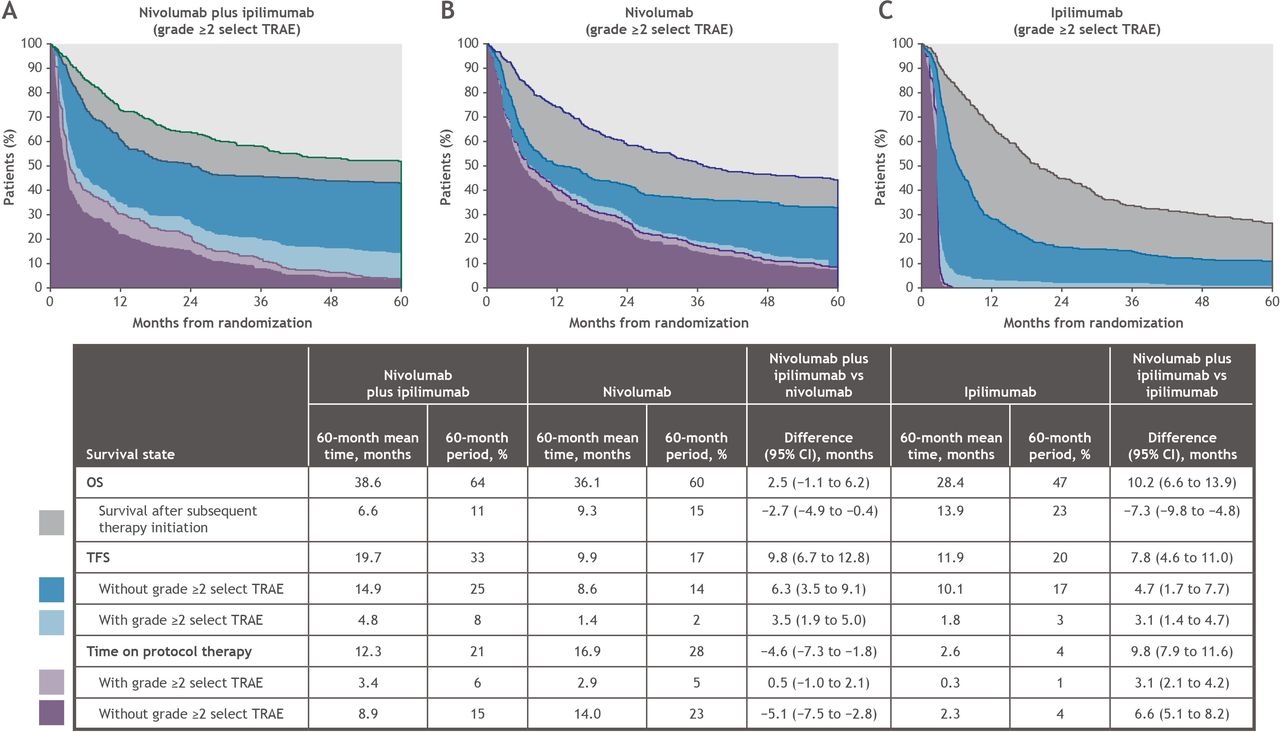
At 60 months from randomization, Kaplan-Meier estimates of OS were 52%, 44%, and 27% of patients in the nivolumab plus ipilimumab, nivolumab, and ipilimumab groups, respectively, and 43%, 33%, and 11% of patients in these respective groups were free of subsequent systemic therapy (online supplemental table S1). A total of 36 patients continued protocol-assigned treatment (12 patients (4%) in the nivolumab plus ipilimumab group and 24 patients (9%) in the nivolumab group); therefore, 39%, 24%, and 11% of patients had survived and were treatment-free at 60 months in the nivolumab plus ipilimumab, nivolumab, and ipilimumab groups, respectively (online supplemental table S2).
Mean TFS over the 60-month period was twice as long in patients treated with nivolumab plus ipilimumab than in those treated with nivolumab (19.7 and 9.9 months, respectively; absolute difference, 9.8 months; 95% CI 6.7 to 12.8; figure 2). The longer mean TFS resulted from both a shorter mean time on protocol therapy and a longer mean time to subsequent therapy in the nivolumab plus ipilimumab group. Mean TFS represented 33% and 17% of the 60-month period after initiating nivolumab plus ipilimumab and nivolumab alone, respectively (figure 3). With extended follow-up, the 60-month mean TFS represented a slightly greater percentage of the follow-up period than initially estimated after 36 months of follow-up (30% and 13% of the 36-month period after initiating nivolumab plus ipilimumab and nivolumab alone, respectively).

Kaplan-Meier estimates of endpoints, TFS and survival states characterizing how OS time was spent over the 60-month follow-up period since randomization. Toxicity was defined as grade ≥2 select TRAEs (ie, those of potential immunologic etiology). OS, overall survival; TFS, treatment-free survival; TRAE, treatment-related adverse event.
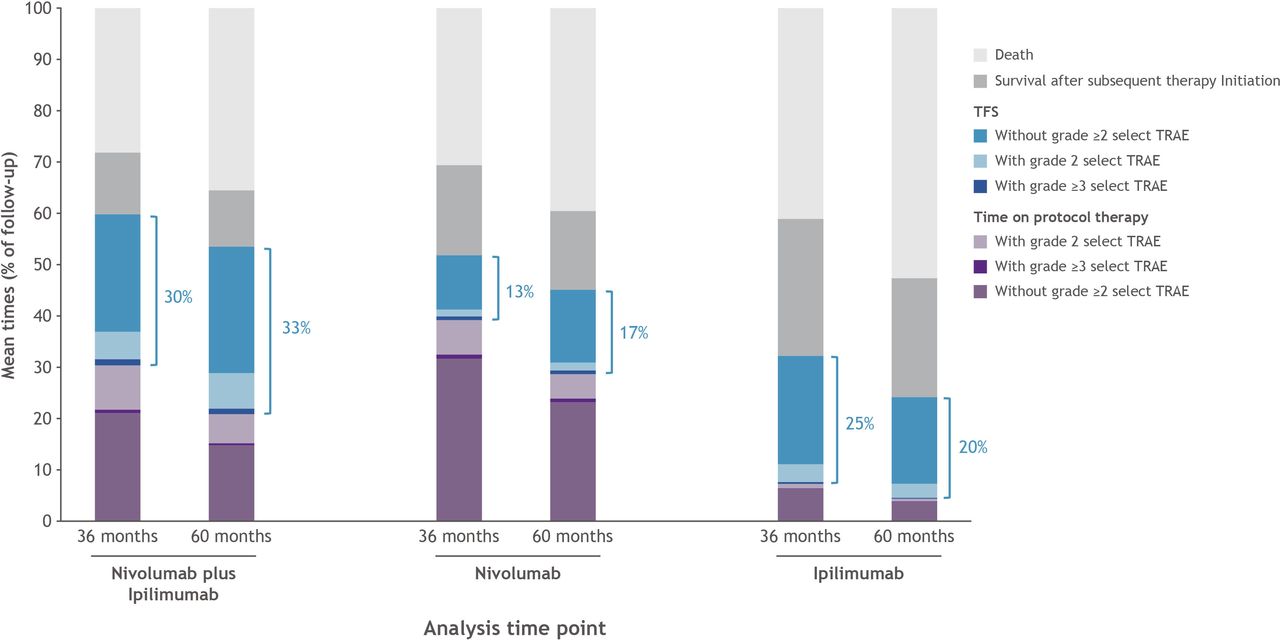
Percentage of mean times in survival states by time point of analysis: 60 vs 36 months of follow-up. Toxicity was defined as select TRAEs. Total mean TFS as a percentage of follow-up is annotated. TFS, treatment-free survival; TRAE, treatment-related adverse event.
Mean TFS spent with grade ≥2 select TRAEs was a larger proportion of the 60-month period after initiating nivolumab plus ipilimumab than after initiating nivolumab alone (4.8 months (8%) vs 1.4 months (2%), respectively, of the 60-month period; figure 2). The resultant difference in mean TFS without toxicity was 6.3 months (95% CI 3.5 to 9.1; 14.9 vs 8.6 months, representing 25% vs 14% of the 60-month period). Mean TFS spent with grade ≥3 select TRAEs was approximately 1% of the 60-month period after nivolumab plus ipilimumab and nivolumab alone (0.7 vs 0.4 months, respectively; online supplemental figure S1). When including all grade ≥2 TRAEs, mean TFS with grade ≥2 TRAEs was also greater after treatment with nivolumab plus ipilimumab than after treatment with nivolumab (8.4 months (14%) vs 3.0 months (5%), respectively, of the 60-month period; figure 4 and online supplemental figure S2).
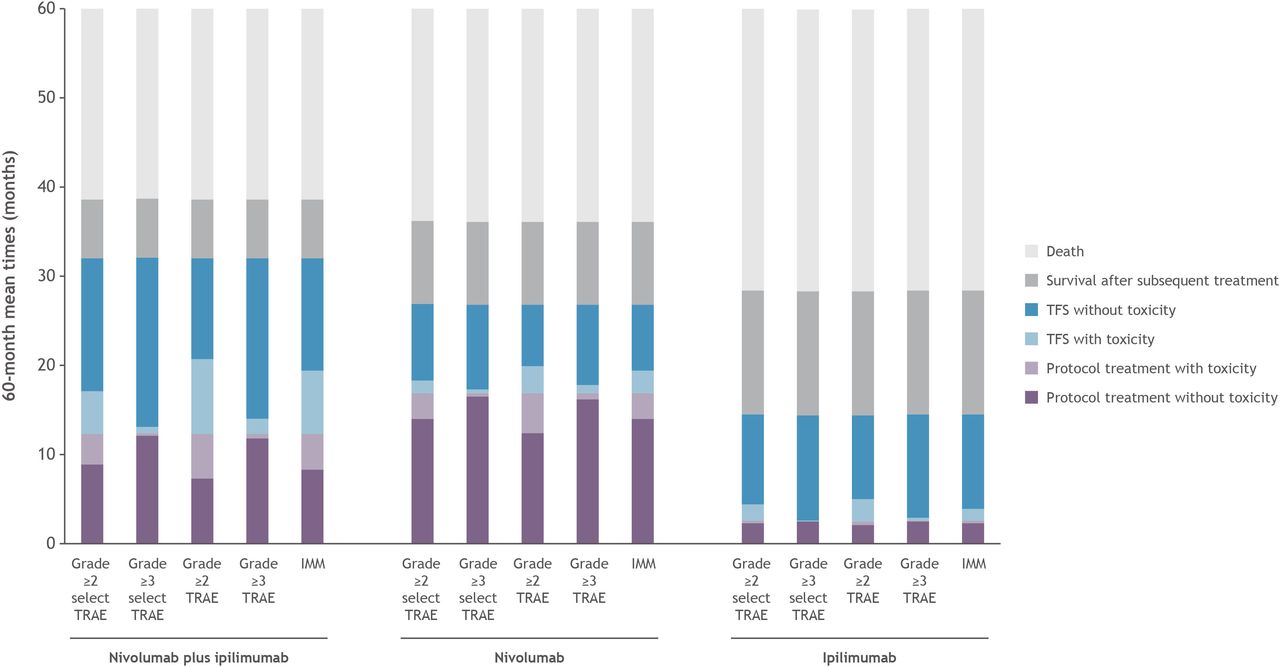
Sixty-month mean times in survival states with various definitions of toxicity during TFS and during protocol therapy. IMM, immunomodulatory medication; TFS, treatment-free survival, TRAE, treatment-related adverse event.
Patients in the nivolumab plus ipilimumab and nivolumab monotherapy groups had similar mean times on protocol therapy with grade ≥2 select TRAEs (3.4 and 2.9 months, respectively; absolute difference, 0.5 (95% CI −1.0 to 2.1) months of the 60-month period; figure 2). Thus, the longer treatment duration in the nivolumab group on average was time on protocol therapy without grade ≥2 select TRAEs (mean 8.9 months with nivolumab plus ipilimumab and 14.0 months with nivolumab alone). Mean times on protocol therapy with any grade ≥2 TRAEs were longer than with grade ≥2 select TRAEs in both groups (5.0 and 4.5 months, respectively, over the 60-month period; figure 4 and online supplemental figure S2) but resulted in a similar between-group difference. Mean therapy durations with grade ≥3 select TRAEs were 0.3 and 0.4 months, respectively, representing ≤1% of the 60-month period (figure 4 and online supplemental figure S1).
When measuring toxicity by use of systemic or topical IMMs for any-grade TRAEs, mean TFS with use of IMMs was greater in the nivolumab plus ipilimumab group than in the nivolumab group (7.1 vs 2.5 months, which was 12% vs 4% of the 60-month period, respectively; figure 4). On average, patients in the nivolumab plus ipilimumab and nivolumab groups had means of TFS without IMMs that were 21% and 12% of the 60-month period, respectively.
Among patients treated with ipilimumab, 60-month mean TFS was 11.9 months, which was 7.8 months shorter (95% CI 4.6 to 11.0) than among patients treated with nivolumab plus ipilimumab (figure 2). In contrast to nivolumab-containing regimens, mean TFS represented a smaller proportion (20%) of the 60-month period from randomization than that initially estimated after 36 months of follow-up (25% of the 36-month period; figure 3). This result followed in parallel with the observed decline in the percentage of patients surviving treatment-free at 60 vs 36 months since randomization (15% vs 11% of patients; online supplemental table S2). As with the nivolumab-containing regimens, mean TFS with grade ≥3 select TRAEs after ipilimumab was a small proportion of follow-up (60-month mean, 0.1 months (<1%); figure 4 and online supplemental figure S1). The 60-month mean TFS with grade ≥2 select TRAEs was 3% of follow-up (60-month mean, 1.8 months; figure 2).
TFS and survival states estimated at sequential follow-up milestones
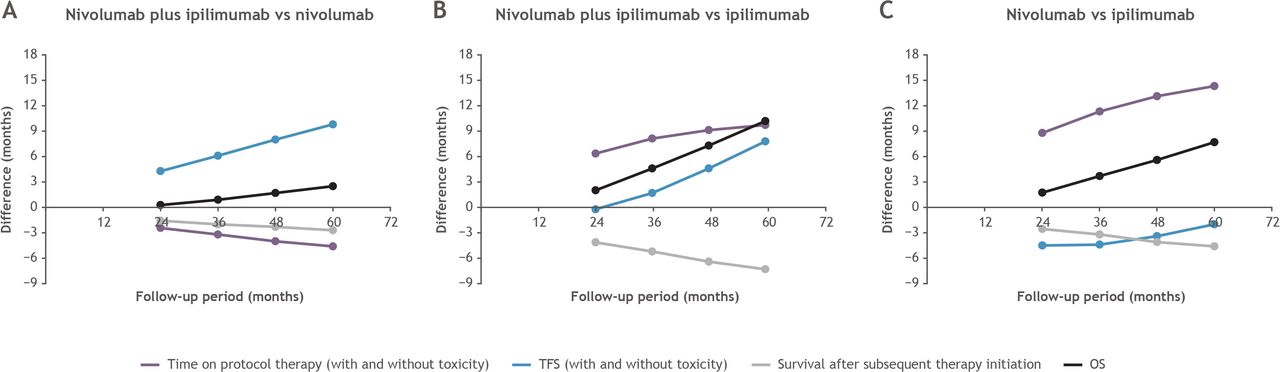
Estimates of the between-group difference in mean TFS after nivolumab plus ipilimumab versus nivolumab alone increased as the follow-up duration increased from 24 to 60 months (figure 5A). In contrast, the between-group difference in mean OS showed more modest increases with longer follow-up. Mean differences in TFS after nivolumab plus ipilimumab versus ipilimumab alone also increased when estimated over longer follow-up periods and tracked in parallel with OS differences (figure 5B). A plateauing of the differences in mean time on protocol therapy between the treatment groups occurred after most patients in the nivolumab plus ipilimumab group had discontinued on therapy without initiation of subsequent therapy, resulting in growing (negative) mean differences in the post-TFS state of survival after subsequent therapy initiation (figure 5B). In the comparison of nivolumab vs ipilimumab, differences in mean TFS continued to favor ipilimumab but narrowed over longer follow-up as more patients ceased nivolumab treatment, many without initiation of subsequent therapy (figure 5C).

Differences in TFS, OS, and survival state mean times by analysis time point at 24, 36, 48, and 60 months of follow-up from randomization. OS, overall survival; TFS, treatment-free survival.
Discussion
This analysis demonstrated that the sustained long-term OS benefit observed with nivolumab-containing regimens (nivolumab plus ipilimumab or nivolumab alone) compared with ipilimumab alone administered as first-line treatment of advanced melanoma in CheckMate 0678 was accompanied by sustained TFS. As follow-up increased, TFS represented an increasing percentage of time from initiation of the nivolumab-containing regimens, but a decreasing percentage of time from initiation of ipilimumab, despite a small subset of patients remaining treatment-free after 60 months. On average, patients in the nivolumab plus ipilimumab group had been treatment-free for one-third of the 5-year period from treatment initiation. TFS time was twice as long in the nivolumab plus ipilimumab group as in the nivolumab group, because of both the earlier therapy cessation for toxicity and the longer maintenance of disease control after therapy cessation. Most of the toxicities that led to discontinuation subsequently resolved, with the vast majority of TFS time being spent without grade ≥3 TRAEs for all three treatments. The average TFS with persistent and/or newly reported toxicity was greater after treatment with nivolumab plus ipilimumab than after treatment with either monotherapy, regardless of the toxicity definition. However, TFS without toxicity remained greater in all cases with nivolumab plus ipilimumab, as most toxicity, particularly grade ≥3 TRAEs, resolved within a relatively short period of time. Endocrine and skin TRAEs were the most frequent type to remain unresolved at the time of the analysis (60 months of minimum follow-up).8 Across all three treatment groups during TFS with toxicity, gastrointestinal TRAEs of potential immunological etiology affected more patients, but these AEs were of much shorter duration on average than endocrine or skin TRAEs.8
The trial design and extended follow-up of CheckMate 067 provided an opportunity to better appraise TFS as an outcome measure over time, considering the duration, tolerability, and efficacy of the three treatments at various landmarks from initiation. Compared with the nivolumab-containing regimens, ipilimumab had a shorter treatment duration (fixed in the protocol) and inferior efficacy, and mean TFS with ipilimumab decreased as a percentage of longer follow-up time. Although the early TFS estimate with ipilimumab may have reflected the shorter treatment duration, later TFS estimates may have been affected by the initiation of subsequent therapy and/or the occurrence of death, which were both attributed to inferior efficacy for ipilimumab compared with the nivolumab-containing regimens.
OS benefit with nivolumab plus ipilimumab compared with ipilimumab alone reported after a minimum follow-up of 36 months6 was only emerging as a TFS benefit at that time; thereafter, the trajectories of increasing between-group differences with longer follow-up were similar for OS and TFS. Over the initial 36 months, TFS benefit, measured by time to subsequent therapy initiation or death, was offset by the increased time spent on maintenance nivolumab therapy. By 36 months, only 11% of patients in the nivolumab plus ipilimumab group were continuing maintenance therapy; with longer follow-up, the TFS treatment effect increased primarily because many of the patients who had ceased therapy remained alive without need for subsequent therapy. On the other hand, mean TFS remained longer in the ipilimumab group than in the nivolumab group. OS benefit with nivolumab alone was not reflected by TFS because many patients continued nivolumab treatment for an extended time period; in contrast, the protocol-defined, short duration of ipilimumab therapy enabled durable response without subsequent therapy, although only a small proportion of patients had durable benefit. This comparison highlights the potential impact of limiting therapy duration in responding patients on TFS.
CheckMate 067 was not powered to compare the traditional efficacy endpoints of OS, PFS, or objective response rate between the nivolumab plus ipilimumab and nivolumab groups. In these respective groups, the Kaplan-Meier OS estimates were 58% and 52% at 36 months,6 and 52% and 44% at 60 months,8 with 39% and 24% of patients surviving treatment-free. Between-group differences in TFS were detected at 36 months and sustained during the additional 2 years of follow-up. As a result, TFS may detect additional efficacy benefits not captured by traditional endpoints and that may be of value in planning trials that seek to optimize induction and maintenance ICI combination therapy and in determining when to cease treatment after a clinical milestone (eg, 2 years or achieving complete response).
The analysis with sequential restriction of follow-up from 24 to 60 months showed that estimation of TFS at an early time point was dominated initially by the treatment duration and later by durable efficacy, enabling delay of subsequent systemic therapy. Thus, the timing of a comparative TFS analysis should consider expected efficacy and toxicity, as well as how the protocol prescribes treatment administration, both in terms of duration and rules for dosing delays and modifications for toxicity. For example, in CheckMate 067, the 74 patients (24%) who discontinued nivolumab plus ipilimumab during the induction phase because of TRAEs were not allowed to continue maintenance nivolumab therapy.8
It should also be reinforced that mean TFS times are restricted by the defined follow-up period and should be interpreted with knowledge of that follow-up duration. The estimated mean time increases with longer follow-up, and it should be noted that a 24-month mean TFS of 3 months is not equivalent to a 60-month mean TFS of 3 months, which represent 12.5% and 5% of the follow-up periods, respectively. Reporting mean TFS as a proportion of follow-up as well would be critical to interpretation of TFS over time and between studies with different follow-up times.
There are limitations to this analysis that also provide lessons for future studies. To reliably estimate TFS with toxicity, information on resolution of toxicity and newly emergent toxicity after treatment discontinuation until initiation of subsequent therapy or death should be collected. In CheckMate 067, ongoing any-grade select TRAEs and grade ≥3 TRAEs were systematically queried over long-term follow-up for resolution dates. However, the resolution of some grade 2 TRAEs may not have been completely captured; therefore, mean TFS with grade ≥2 TRAEs may have been overestimated.
The goal of characterizing overall TFS as mean times with and without toxicity was to represent the quality of the TFS time. Several definitions of toxicity were used, providing a sensitivity analysis. A direct estimation of HRQoL during TFS time is elusive, as CheckMate 067 collected only a limited amount of HRQoL data after treatment discontinuation.8 12 In CheckMate 067, data for the European Quality of Life 5-Dimensions 3-Level questionnaire13 14 continued to be collected at survival follow-up visits every 3 or 6 months in the first or subsequent years and did not demonstrate clinically meaningful changes, either deterioration nor improvement.8 Future trials should continue to collect patient-reported outcomes (PROs) for HRQoL until initiation of subsequent therapy, in order to document HRQoL while treatment-free between first-line and second-line therapy or death. Selected PRO instruments should capture information on disease symptoms, TRAEs, and treatment burden with novel therapies during an off-treatment period. Collecting PRO results will allow validation of the hypothesis that TFS leads to favorable HRQoL, including reduced burden and economic toxicity that accompanies prolonged cancer treatment, and will improve on our model by directly incorporating HRQoL measures.
In summary, this analysis using data from CheckMate 067 demonstrated a sustained benefit in overall TFS and TFS without toxicity with nivolumab plus ipilimumab relative to either nivolumab or ipilimumab alone in patients with advanced melanoma, in addition to the reported improvement in long-term OS with the nivolumab-containing regimens versus ipilimumab alone.8 A novel outcome measure, TFS reflects the durability of treatment benefit without prolonged maintenance therapy or subsequent systemic therapy initiation, and without persistent AEs of initial therapy. The between-group difference in TFS with nivolumab plus ipilimumab compared with either monotherapy increased with longer follow-up. Future trial designs will need to systematically collect information on AEs, resolution of toxicity, and HRQoL beyond discontinuation of index treatment, while considering timing of a TFS analysis that depends on treatment duration, tolerability, and efficacy.
Supplemental material
Data availability statement
Data are available on reasonable request. BMS policy on data sharing may be found at https://www.bms.com/researchers-and-partners/independent-research/data-sharing-request-process.html.
Ethics statements
Patient consent for publication
Acknowledgments
Editorial assistance was provided by Mark Palangio and Michele Salernitano at Ashfield MedComms, an Ashfield Health company, funded by Bristol Myers Squibb. MAP acknowledges support to his institution from the National Institutes of Health/National Cancer Institute (cancer center support grant P30 CA008748).
Supplementary materials
Supplementary Data
This web only file has been produced by the BMJ Publishing Group from an electronic file supplied by the author(s) and has not been edited for content.
Footnotes
Twitter @CharleneMantia
Presented at Presented at the 2020 ASCO Annual Meeting I, May 29–31, 2020
Contributors Responsible for the overall content as guarantor: MMR. Conception or design of the study: MMR, CM, LW, AAT, JL, FSH, JW, MP, BS, AM, CR, DM, and MBA. Data acquisition: AAT, JL, FSH, JW, MP, DM, and MBA. Data analysis: MMR, CM, LW, SR, and WvD. Data interpretation: all authors. Writing and revision and final approval of the manuscript: all authors.
Funding This research was funded by a grant from Bristol Myers Squibb (MMR, DM and LW) and funded in part by NIH/NCI Cancer Center Support Grant P30 CA006516 (MMR, CM, LW and DM) and NIH/NCI SPORE Grant P50 CA101942 (DM).
Competing interests MMR reports receiving grants and non-financial support from Bristol Myers Squibb for the work in this publication; grants and non-financial support (to her institution) for clinical trials from AstraZeneca, Ferring, Ipsen, Merck, Novartis, Pfizer, Pierre Fabre, Roche, and TerSera; grants from Bayer and Bristol Myers Squibb; consulting/advisory fees from Ipsen/Debiopharm; personal fees from Bristol Myers Squibb and Tolmar Pharmaceuticals; and non-financial support from Bristol Myers Squibb. CMM reports institutional support for statistical analysis and writing assistance from Bristol Myers Squibb for the work in this publication. LW reports receiving grants from Bristol Myers Squibb for the work in this publication. AAT reports receiving institutional grants from Bristol Myers Squibb, Genentech-Roche, Merck, and OncoSec; personal fees for advisory/consulting roles from Array Biopharma, BioNTech, Bristol Myers Squibb, Clinigen, EMD Serono, Genentech-Roche, Immunocore, Merck, NewLink Genetics, Novartis, Partner Therapeutics, Pfizer, and Sanofi-Genzyme/Regeneron. JL reports receiving personal fees from AIM, AstraZeneca, Bioevents, Bristol Myers Squibb, BUG, ESMO, EUSA Pharma, Incyte, KCA, MedConcept, Merck, NCRI, Novartis, Pfizer, Pierre Fabre, Roche, RVMais, and Syneos Health; consultancy fees from Aptitude, Bristol Myers Squibb, Calithera, Ervaxx, Immunocore, Ipsen, Merck Sharp & Dohme, Novartis, Pfizer, Roche, Seagen, and Ultimovacs; and research support from Achilles, Aveo, Bristol Myers Squibb, Convance, Immunocore, Merck Sharp & Dohme, Nektar, Novartis, Pfizer, Pharmacyclics, and Roche. FSH reports receiving non-financial support from Bristol Myers Squibb for the work in this publication; receiving grants/royalties to his institution from Novartis; personal fees for consultant/advisory roles from Aduro, Apricity, Bicara, Bioentre, Checkpoint Therapeutics, Compass Therapeutics, Eisai, Genentech/Roche, Idera, Immunocore, Iovance, Novartis, Pionyr, Psioxus Therapeutics, Sanofi, Surface, Takeda, and Trillium; receiving equity from Apricity, Bicara, and Pionyr; receiving other fees from Gossamer; having pending patents and receiving royalties for methods for treating MICA-related disorders (#20100111973); having pending patents for angiopoiten-2 biomarkers predictive of anti-immune checkpoint response (#20170248603), compositions and methods for identification, assessment, prevention, and treatment of melanoma using PD-L1 isoforms (#20160340407), therapeutic peptides (#20160046716; #20140004112; #20170022275; #20170008962), and anti-galectin antibody biomarkers predictive of anti-immune checkpoint and anti-angiogenesis responses (#20170343552); and holding issued patents for tumor antigens and uses thereof (#7250291), therapeutic peptides (#9402905), vaccine compositions and methods for restoring NKG2D pathway function against cancers (#10279021), antibodies that bind to MHC class I polypeptide-related sequence A (#10106611). JDW reports receiving grants and consultancy fees from Bristol Myers Squibb for the work in this publication; consultancy fees from Adaptive Biotech, Amgen, Apricity, Ascentage Pharma, Astellas, AstraZeneca, Bayer, Beigene, Boehringer Ingelheim, Chugai, Daiichi Sankyo, Dragonfly, Eli Lilly, Elucida, F Star, Georgiamune, Idera, Imvaq, Kyowa Hakko Kirin, Linneaus, Merck, Polynoma, Psioxus, Recepta, Sellas, Serametrix, Surface Oncology, Syndax, Syntalogic, Takara Bio, Trieza, Trishula, Truvax, and Werewolf Therapeutics; equity from Adaptive Biotech, Apricity, Arsenal IO, Beigene, Georgiamune, Imvaq, Linneaus, Serametrix, and Tizona Pharmaceuticals; patents pending for anti-CD40 agonist monoclonal antibody fused to monophosphoryl lipid A for cancer therapy, CAR+ T cells targeting differentiation antigens as means to treat cancer, engineered vaccinia viruses for cancer immunotherapy, heteroclitic cancer vaccines, identifying and treating subjects at risk for checkpoint blockade therapy associated colitis, immunosuppressive follicular helper-like T cells modulated by immune checkpoint blockade, phosphatidylserine targeting agents and uses thereof for adoptive T-cell therapies, and recombinant poxviruses for cancer immunotherapy; patents issued for alphavirus replicon particles expressing TRP2, anti-CTLA4 antibodies, anti-GITR antibodies and methods of use thereof, anti-PD1 antibody, myeloid-derived suppressor cell assay, Newcastle disease viruses for cancer therapy, and xenogeneic DNA vaccines; patents licensed for anti-CTLA-4 antibodies (licensee: Agenus), anti-GITR antibodies and methods of use thereof (licensee: Agenus/Incyte), anti-PD1 antibody (licensee: Agenus), myeloid-derived suppressor cell assay (licensee: Serametrix), and xenogeneic DNA vaccines (licensee: Meriel); patent royalties for myeloid-derived suppressor cell assay and xenogeneic DNA vaccines. MAP reports receiving personal fees from Aduro, Array BioPharma, Bristol Myers Squibb, Eisai, Incyte, Merck, NewLink Genetics, Novartis, and Pfizer; grants from Array BioPharma, AstraZeneca, Bristol Myers Squibb, Infinity, Merck, Novartis, and RGenix. BS, AM, and SR report being an employee of and holding shares in Bristol Myers Squibb. CR and WvD report being an employee of Bristol Myers Squibb. DFM reports receiving honoraria for consulting from Bristol Myers Squibb, Alkermes, Calithera Biosciences, Eisai, Eli Lilly, EMD Serono, Iovance, Merck, Pfizer, and Werewolf Therapeutics; and research support from Alkermes, Bristol Myers Squibb, Exelixis, Genentech, Merck, Pfizer, and X4 Pharma. MBA reports receiving grants from Bristol Myers Squibb and Merck; personal fees for consulting/advisory roles from Adagene, Agenus, Apexigen, Arrowhead, Asher Bio, AstraZeneca, Aveo, Bristol Myers Squibb, Calithera, Eisai, Elpis, Exelixis, Genetech-Roche, Idera, Iovance, Leads Bio, Merck, Neoleukin, Novartis, Pfizer, Pyxis Oncology, Scholar Rock, Surface, and Werewolf; and equity from Pyxis Oncology and Werewolf Therapeutics.
Provenance and peer review Not commissioned; externally peer reviewed.
Supplemental material This content has been supplied by the author(s). It has not been vetted by BMJ Publishing Group Limited (BMJ) and may not have been peer-reviewed. Any opinions or recommendations discussed are solely those of the author(s) and are not endorsed by BMJ. BMJ disclaims all liability and responsibility arising from any reliance placed on the content. Where the content includes any translated material, BMJ does not warrant the accuracy and reliability of the translations (including but not limited to local regulations, clinical guidelines, terminology, drug names and drug dosages), and is not responsible for any error and/or omissions arising from translation and adaptation or otherwise.