Article Text

Abstract
Background Colorectal cancers (CRCs) with microsatellite instability-high (MSI-H) are hypermutated tumors and are generally regarded as immunogenic. However, their heterogeneous immune responses and underlying molecular characteristics remain largely unexplained.
Methods We conducted a retrospective analysis of 73 primary MSI-H CRC tissues to characterize heterogeneous immune subgroups. Based on combined tumor-infiltrating lymphocyte (TIL) immunoscore and tertiary lymphoid structure (TLS) activity, MSI-H CRCs were classified into immune-high, immune-intermediate, and immune-low subgroups. Of these, the immune-high and immune-low subgroups were further analyzed using whole-exome and transcriptome sequencing.
Results We found considerable variations in immune parameters between MSI-H CRCs, and immune subgrouping of MSI-H CRCs was performed accordingly. The TIL densities and TLS activities of immune-low MSI-H CRCs were comparable to those of an immune-low or immune-intermediate subgroup of microsatellite-stable CRCs. There were remarkable differences between immune-high and immune-low MSI-H CRCs, including their pathological features (medullary vs mucinous), genomic alterations (tyrosine kinase fusions vs KRAS mutations), and activated signaling pathways (immune-related vs Wnt and Notch signaling), whereas no significant differences were found in tumor mutational burden (TMB) and neoantigen load. The immune-low MSI-H CRCs were subdivided by the consensus molecular subtype (CMS1 vs CMS3) with different gene expression signatures (mesenchymal/stem-like vs epithelial/goblet-like), suggesting distinct immune evasion mechanisms. Angiogenesis and CD200 were identified as potential therapeutic targets in immune-low CMS1 and CMS3 MSI-H CRCs, respectively.
Conclusions MSI-H CRCs are immunologically heterogeneous, regardless of TMB. The unusual immune-low MSI-H CRCs are characterized by mucinous histology, KRAS mutations, and Wnt/Notch activation, and can be further divided into distinct gene expression subtypes, including CMS4-like CMS1 and CMS3. Our data provide novel insights into precise immunotherapeutic strategies for subtypes of MSI-H tumors.
- gastrointestinal neoplasms
- lymphocytes
- tumor-infiltrating
- tumor microenvironment
- immunohistochemistry
- gene expression profiling
Data availability statement
Data are available in a public, open access repository. Data are available upon reasonable request. The whole exome and transcriptome data sets generated during the current study are available in the NCBI Sequence Read Archive (SRA)/BioProject repository (accession number: PRJNA727917; URL: https://www.ncbi.nlm.nih.gov/bioproject/PRJNA727917). All other data are available from the corresponding author on reasonable request.
This is an open access article distributed in accordance with the Creative Commons Attribution Non Commercial (CC BY-NC 4.0) license, which permits others to distribute, remix, adapt, build upon this work non-commercially, and license their derivative works on different terms, provided the original work is properly cited, appropriate credit is given, any changes made indicated, and the use is non-commercial. See http://creativecommons.org/licenses/by-nc/4.0/.
Statistics from Altmetric.com
- gastrointestinal neoplasms
- lymphocytes
- tumor-infiltrating
- tumor microenvironment
- immunohistochemistry
- gene expression profiling
Background
Over the past decade, there have been remarkable advances in our understanding of tumor immunology and clinical application of immunotherapy in human cancers, including colorectal cancer (CRC). While early detection improves the chances of survival of patients with CRC, the development of more effective treatment is required for late and metastatic cancer, which has increased the interest of researchers in immunotherapy.1
Similar to that in other types of cancer, patients’ responses to immunotherapy, specifically immune checkpoint blockades (ICBs), are heterogeneous in CRCs. The most distinctive feature of responsiveness is the microsatellite instability-high (MSI-H) status, which is caused by DNA mismatch repair deficiency (dMMR) and comprises approximately 15% of CRCs. Cancers with MSI-H harbor higher neoantigen loads, originating from an elevated genome-wide mutation rate.2 Compared with CRCs with microsatellite-stable (MSS)/mismatch repair proficiency, MSI-H CRCs show increased lymphocytic infiltration and upregulation of immune checkpoint molecules such as programmed cell death protein 1 (PD-1), programmed death-ligand 1 (PD-L1), cytotoxic T-lymphocyte associated protein 4 (CTLA-4), lymphocyte-activation gene 3 (LAG-3), and indoleamine 2,3-dioxygenase (IDO).3 Therefore, MSI-H CRCs are commonly regarded as immunogenic and primarily targeted for ICBs.2 4–6
Despite active clinical applications, the response rate to ICBs remains limited (approximately 30%–50% towards PD-1 blockade) in MSI-H CRCs.7–9 Thus, there is a demand for more markers that explain the variability in immunogenicity and responsiveness. Recent studies have identified intertumoral variations in immune infiltration and activation in MSI-H CRCs,10 11 including heterogeneous lymphoid reaction and PD-L1 expression status among MSI-H CRCs reported by our group.12 As the differences in immunogenic potentials and the tumor immune microenvironment are considered the cause of the varied efficacy in ICBs,13–15 further stratification of MSI-H CRCs is urgently needed. However, the underlying molecular factors remain poorly characterized.
Here, we present a comprehensive clinicopathological and molecular profile of MSI-H CRCs to identify the factors underlying their heterogeneous immunogenicity. Using immunohistochemistry (IHC) and histomorphometry, we quantitatively analyzed the tumor immune microenvironmental parameters of 73 MSI-H CRCs, including tumor-infiltrating lymphocytes (TILs), tumor-associated macrophages (TAMs), and tertiary lymphoid structures (TLSs), to classify tumors into immune-low, intermediate, and high subgroups. We then conducted whole-exome and transcriptomic analyses of the immune-low and immune-high subgroups. We anticipate that the integrative profile will lead to a better understanding of immune heterogeneity within MSI-H CRCs and its underlying molecular mechanisms and provide a basis for further stratification for precision immunotherapy.
Materials and methods
Sample collection
We designed a tissue-based retrospective study to characterize immuno-molecular profiles of MSI-H CRCs. In total, 2386 consecutive series of fresh frozen or formalin-fixed paraffin-embedded (FFPE) primary tissues were initially collected from patients who had undergone surgical resection for primary CRC at Seoul National University Hospital between 2015 and 2017. All 2,386 CRCs were subjected to MSI testing with fluorescence capillary electrophoresis-based DNA fragment analysis using the five Bethesda microsatellite markers (BAT-25, BAT-26, D5S346, D17S250, and D2S123),16 159 and 2216 of which were identified as MSI-H and MSS, respectively (11 cases failed). Among the samples, 86 MSI-H and 1681 MSS CRCs were excluded based on the following criteria: (1) neoadjuvant chemotherapy and/or radiotherapy, (2) discrepant or equivocal MMR expression using IHC with antiMLH1/MSH2/MSH6/PMS2 antibodies, (3) insufficient number of residual FFPE tissues after diagnostic pathologic processes, and (4) inadequate quantity or quality of either tumor or normal fresh tissue (figure 1A). Finally, 73 MSI-H (as a test group) and 535 MSS (as a control group) CRCs were included in the study cohort and subjected to further analyses.

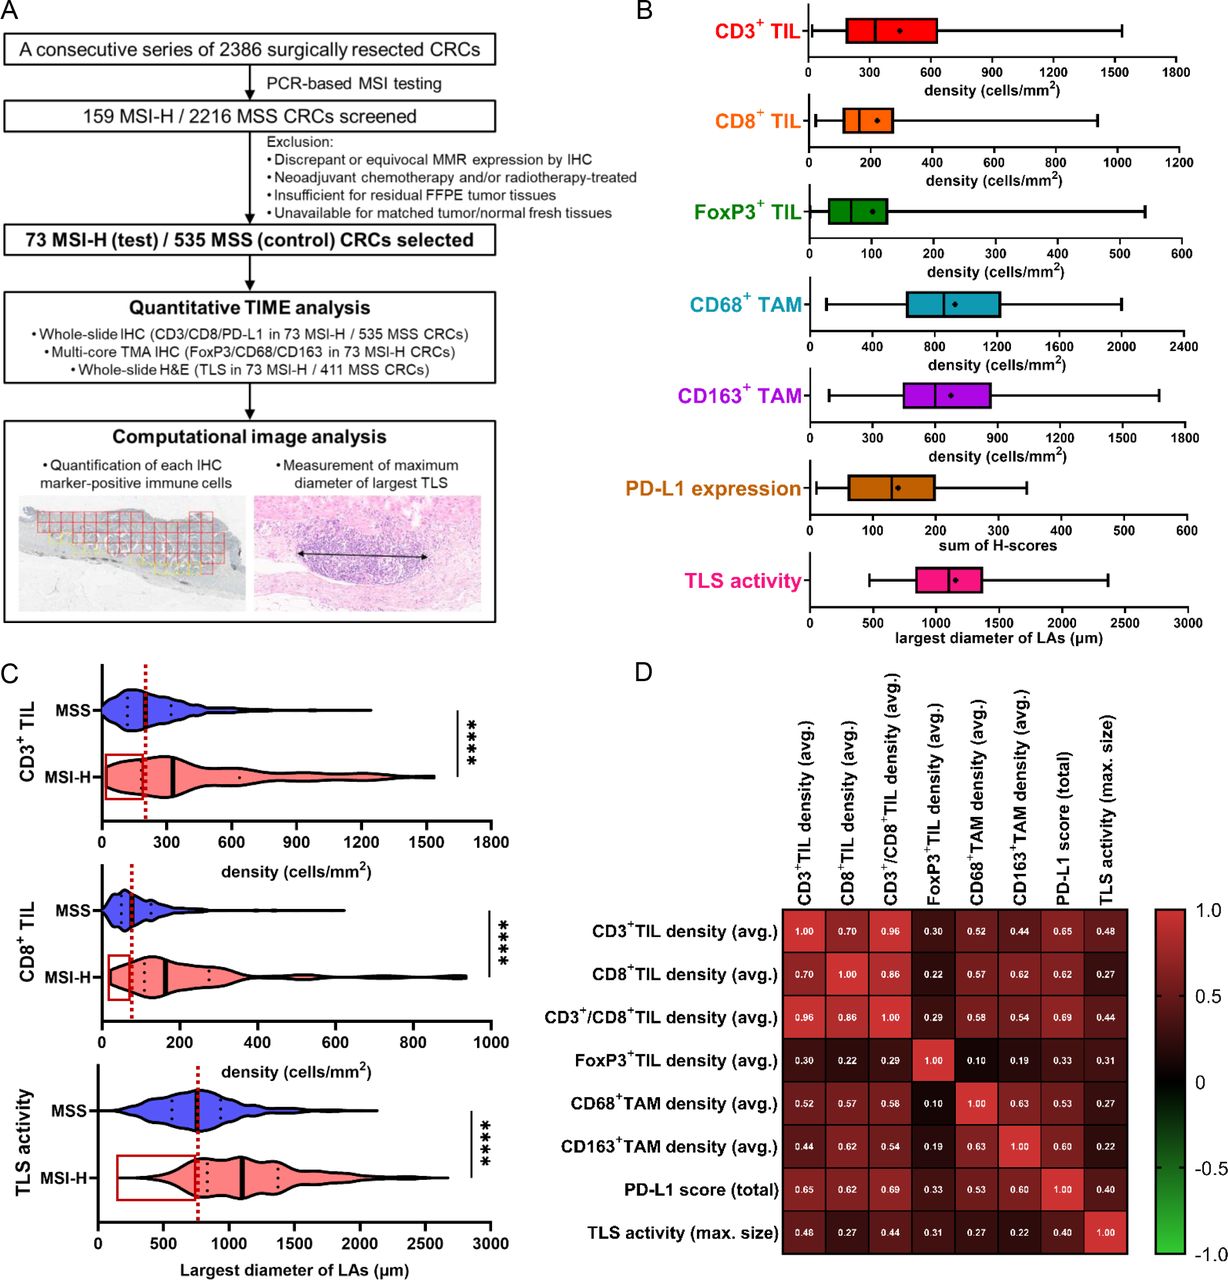
Heterogeneity and correlations of immune microenvironmental parameters in MSI-H CRCs. (A) First scheme of this study: from sample selection to quantitative tumor immune microenvironment analysis. (B) Wide ranges of quantified immune parameters in the 73 MSI-H CRCs. The density of CD3+, CD8+, FoxP3+, CD68+, or CD163+ cells is an average value throughout the invasive margin and center of tumor areas in an MSI-H CRC. PD-L1 expression score is the sum of two PD-L1 H-scores from immune cells and tumor cells in an MSI-H CRC. Bilateral whiskers, a central box, a cross line within the box, and a small dot within the box indicate a minimum to maximum range, an IQR, a median value, and a mean value, respectively. (C) Comparison of major antitumor immune parameters (CD3+ TIL, CD8+ TIL, and TLS) between MSI-H (n=73) and MSS (n=535 for TIL and n=411 for TLS) CRCs. Note the wider ranges of immune parameters in MSI-H CRCs than in MSS CRCs and the presence of MSI-H CRCs showing a lower value (red-lined boxes) than the median value (vertical red dot lines) in MSS CRCs. (D) Correlation heatmap between various immune parameters of the 73 MSI-H CRCs. (****, p<0.0001). CRCs, colorectal cancers; IHC, immunohistochemistry; MSI-H, microsatellite instability-high; MSS, microsatellite-stable; PD-L1, programmed death-ligand 1; TAM, tumor-associated macrophages; TIL, tumor-infiltrating lymphocyte; TLS, tertiary lymphoid structure; TMA, tissue microarray.
Patient and public involvement
This was a retrospective, tissue-based observational study that neither interacted nor intervened with patients. Thus, neither patients nor the public was directly involved in this study.
Clinical data collection and histopathological assessment
Detailed methods are described in online supplemental methods.
Supplemental material
IHC
IHC was conducted on a representative whole slide section or on a tissue microarray (TMA) section of each of the 73 MSI-H and 535 MSS CRCs. For TMA construction of each case, two 2 mm cores were extracted from the invasive margin (IM) and center of tumor (CT) areas of a representative FFPE tissue block. Thus, a total of four cores (two IM and two CT cores) were obtained from each of the 73 MSI-H CRCs. The antigens detected using IHC of whole slide sections included CD3, CD8, and PD-L1, whereas those using TMA sections included CD68, CD163, FoxP3, MLH1, MSH2, MSH6, PMS2, HLA class I (HLA-I), β -2-microglobulin (B2M), and CD200. All IHC procedures were performed using automated immunostainers (Ventana BenchMark XT, Roche, Basel, Switzerland; or Bond-III, Leica Biosystems, Wetzlar, Germany). Information on the primary antibodies used for IHC in this study is listed in online supplemental table 1.
Supplemental material
Quantification of tumor-infiltrating immune cells
The density of tumor-infiltrating immune cells was measured based on computational quantification of immunohistochemically stained slides (for CD3+ and CD8+ T cells) and multicore TMA (for FoxP3+ T cells and CD68+, CD163+ macrophages). For whole slide-based quantification, immunohistochemically stained slides were scanned using an Aperio AT2 slide scanner (Leica Biosystems, Buffalo Grove, Illinois, USA) for computational quantification using QuPath, validated open-source software for digital pathology analysis,17 18 and each virtual slide was retrieved. The region of interest (ROI) was manually delineated in such a way that it encompassed the entire tumor and peritumoral stroma within a 1 mm distance, while excluding the area of extracellular mucin pool, necrosis, abscess, mucosa-associated lymphoid tissue, and TLS. The ROI was segmented into 1 mm×1 mm tiles, and the frontmost tiles were designated as invasive margins; the definition of the ‘frontness’ resulted from the consensus of three pathologists (JHK, JAL, and S-YY). The tiles that were not annotated as the IM were termed as the CT, as recommended by the consensus statement on assessing TILs.19 Lymphocytes were identified by using the positive cell detection functionality of QuPath, and TILs at the IM and CT were quantified in terms of the average number of lymphocytes per tile (cells/mm2) (online supplemental figure 1A).
Supplemental material
For TMA-based quantification, tumor-infiltrating CD68+ cells (regarded as pan-macrophages), CD163+ cells (regarded as M2 macrophages), and FoxP3+ cells (regarded as regulatory T cells) at the IM and CT were quantified in four different tumor microarrays (TMAs; two from IM and two from CT) (online supplemental figure 1B). In contrast to CD3+/CD8+ cells, the single-cell staining patterns of CD68+/CD163+/FoxP3+ cells were occasionally irregular and variable, and the precise identification of each single cell from CD68+/CD163+/FoxP3+ cells can prove difficult through image analysis. Thus, we used the conversion method of the total stained area for cell counts. Using QuPath, the area occupied by positively stained cells was obtained for each TMA core. The tumor area in each TMA core was also retrieved to compute the proportion of the area occupied by the cells. Subsequently, to obtain cell counts, the stained area was divided by the average area of one cell from each cell type. The calculated cell numbers per TMA core were finally converted into a standard density unit (cells/mm2) by dividing with the tumor area of each TMA core. Averaging the values of two IM and two CT cores resulted in six metrics per case, as follows: CD68+ cell density at the IM, CD68+ cell density at the CT, CD163+ cell density at the IM, CD163+ cell density at the CT, FoxP3+ cell density at the IM, and FoxP3+ cell density at the CT.
PD-L1 expression scoring
Detailed methods are described in online supplemental methods.
Histomorphometric assessment of TLS activity
Detailed methods are described in online supplemental methods.
Analyses of KRAS/BRAF mutations and CpG island methylator phenotype
Detailed methods are described in online supplemental methods.
Immune subgroup classification
Each of the 73 MSI-H CRCs was classified into one of the three immune subgroups (immune-low, immune-intermediate, and immune-high) based on the combined status of TIL density and TLS activity. To rate TIL density, we employed Galon’s Immunoscore (I0–I4),14 20 21 (online supplemental figure 2) based on measured CD3+ and CD8+ TIL densities in the IM and CT areas. These area-specific TIL densities produced four parameters: CD3+ TIL at IM, CD3+ TIL at CT, CD8+ TIL at IM, and CD8+ TIL at CT. Immunoscore was assigned as I0 (low densities in all four parameters), I1 (low densities in three of the four parameters), I2 (low densities in two of the four parameters), I3 (high densities in three of the four parameters), or I4 (high densities in all four parameters) (online supplemental figure 2). The final subgroup was determined based on the following criteria: immune-low=I0 and TLS-inactive; immune-high=I4 and TLS-active; otherwise, cases were classified as immune-intermediate.
Whole-exome sequencing
Approximately 0.1–0.5 µg of fragmented DNA was prepared to construct libraries with the SureSelect Human All Exon Kit V5 (Agilent Technologies, Santa Clara, California, USA) according to the manufacturer’s protocol. Briefly, the qualified genomic DNA sample was randomly fragmented using the Covaris focused-ultrasonicator system (Covaris, Woburn, Massachusetts, USA), followed by adapter ligation, purification, hybridization, and PCR. Captured libraries were subjected to an Agilent 2100 Bioanalyzer (Agilent Technologies) to estimate the quality and were loaded onto the NovaSeq 6000 sequencing system (Illumina, San Diego, California, USA) according to the manufacturer’s recommendations. The average depth ranged from 85× (range, 71 to 107) and 167× (135 to 212) paired-end reads (2×101 bp) for matched normal and tumors, respectively. After sequencing, the quality of the sequencing read was assessed using FastQC (http:// www.bioinformatics.babraham.ac.uk/projects/fastqc).
RNA-sequencing
We used 100 ng total RNA from all subjects to prepare sequencing libraries using the TruSeq stranded total RNA sample preparation kit (Illumina), which combines RiboZero ribosomal RNA depletion with a strand-specific method similar to the dUDP method. The quality of these complementary DNA libraries was evaluated with the Agilent 2100 Bioanalyzer (Agilent Technologies) and quantified using the KAPA library quantification kit (Kapa Biosystems, Massachusetts, USA) according to the manufacturer’s library quantification protocol. Following cluster amplification of denatured templates, sequencing was performed as paired-end (2×101 bp) using the Illumina NovaSeq 6000 platform.
Exome and transcriptome data analysis
Detailed methods are described in online supplemental methods.
Prediction of neoantigen load
Detailed methods are described in online supplemental methods.
Next-generation sequencing-based classification of MSI status and molecular subtypes
The MSI status of all samples was verified using the MANTIS22 and MSIsensor23 algorithms using whole-exome sequencing (WES) data. In the MSIsensor, a score of 3.5, which was the cut-off score provided in the original paper, or higher was classified as MSI; otherwise, the score was classified as MSS. The sample was determined as MSI when either of the two algorithms predicted MSI.
CRC subtypes were classified using four different conventional classifiers: consensus molecular subtype (CMS),24 colorectal cancer assigner (CRCA),25 colon cancer molecular subtype (CCMS),26 and colorectal cancer intrinsic subtype (CRIS).27 CMS classification was performed using the CMSclassifier R package, and the nearest single sample predictor was determined.24 CRIS classification was carried out using the CMScaller R package with CRIS template genes28 and determined using the nearest template predictor algorithm and a false discovery rate) of <0.05. For CRCA classification, each sample was assigned to one of the five CRC subtypes with the highest correlation with the prediction analysis of microarrays (PAM) centroids using the published 786-gene CRCassigner signature and script downloaded from Github (https://github.com/syspremed/correlation_CRCassigner). The CCMS assignment was carried out using the Citccmst R package. The pan-cancer immune subtype classification proposed by Thorsson et al. was performed.29
Next-generation sequencing-based analyses of molecular signatures and tumor microenvironment composition
Enriched molecular signatures were analyzed using single-sample gene-set enrichment analysis (ssGSEA) with MSigDB hallmark gene sets30 and CRC signatures used in the CRC subtyping consortium (CRCSC).24 To identify differentially enriched signatures, each gene set was compared using the Mann-Whitney U test. The immune cytolytic activity (CYT) score was calculated as the mean of GZMA and PRF1 expression as proposed by Rooney et al.31 We constructed a gene set using LM22 (the leukocyte gene signature matrix) gene list from CIBERSORT,32 and subsequently performed ssGSEA on normalized expression data (vst). The microenvironment cell population (MCP)-counter was used to validate the infiltration scores.33 The consensus tumor microenvironment (consensusTME) cell estimation method was also applied to accurately and robustly infer immune cell abundance.34 Fifty-three immune cycle-related gene sets were curated (online supplemental table 2) from gene set signatures related to immune cycle, immune predictive signatures, and immune-related pathways. Functional enrichment analysis using gene-set enrichment analysis (GSEA) and ssGSEA was performed for one subtype versus the other groups. Pairwise subtype-specific differentially expressed genes (DEGs) were performed to identify genes that could drive immune evasion for each subtype with criteria of p<0.05 and |log2 fold change|>2.
Supplemental material
Exploration of immuno-oncological targets
Detailed methods are described in online supplemental methods.
Statistical analyses
All statistical analyses were conducted using GraphPad Prism V.9.0.0 (GraphPad Software, San Diego, California, USA, www.graphpad.com) or R V.4.0.2 (The R Foundation for Statistical Computing, www.R-project.org). Categorical variables were compared using the χ2 test or Fisher’s exact test. Continuous variables were compared using the Mann-Whitney U test (for two groups) or Kruskal-Wallis test (for ≥3 groups). All p values were two-sided, and results were determined to be significant at p<0.05.
Results
Variability of tumor immune microenvironment features in MSI-H CRCs
To investigate the tumor immune microenvironment features of primary MSI-H CRCs, major immune parameters, including CD3+ TILs, CD8+ TILs, FoxP3+ TILs, CD68+ TAMs, CD163+ TAMs, PD-L1 expression, and TLS activity, were quantitatively assessed by image analysis of IHC or H&E-stained tissue slides of 73 MSI-H (test cohort) and 535 MSS (control cohort) CRCs (figure 1A). In contrast to the generally accepted immunogenic characteristics of MSI-H CRCs, we found that their immune parameters were highly disparate within the cohort (figure 1B). The densities of CD3+ TILs ranged from 18.7 to 1536.0 cells/mm2 with an average of 447.1, showing up to an 82-fold difference between samples. Similarly, the densities of CD8+ TILs, FoxP3+ TILs, CD68+ TAMs, and CD163+ TAMs, PD-L1 expression scores, and TLS activity indices were distributed over dispersed ranges (figure 1B). In addition, comparison of the degrees of TIL densities and TLS activities of the 73 MSI-H CRCs with those of the 535 MSS CRCs identified a notable overlap and the presence of MSI-H tumors below the median levels of MSS tumors (figure 1C, red boxes), indicating the presence of an MSS-like immune-cold subset in MSI-H CRCs. We also found that all immune parameters in MSI-H CRCs showed weak to strong positive correlations (Pearson’s R=0.1–0.96; figure 1D). Taken together, the wide dispersion in the degrees of immune parameters in MSI-H CRCs, and their positive inter-correlations, suggest the possibility of further subgrouping of MSI-H CRCs based on a representative subset of these parameters.
Immune subgroup classification of MSI-H CRCs based on TIL/TLS heterogeneity
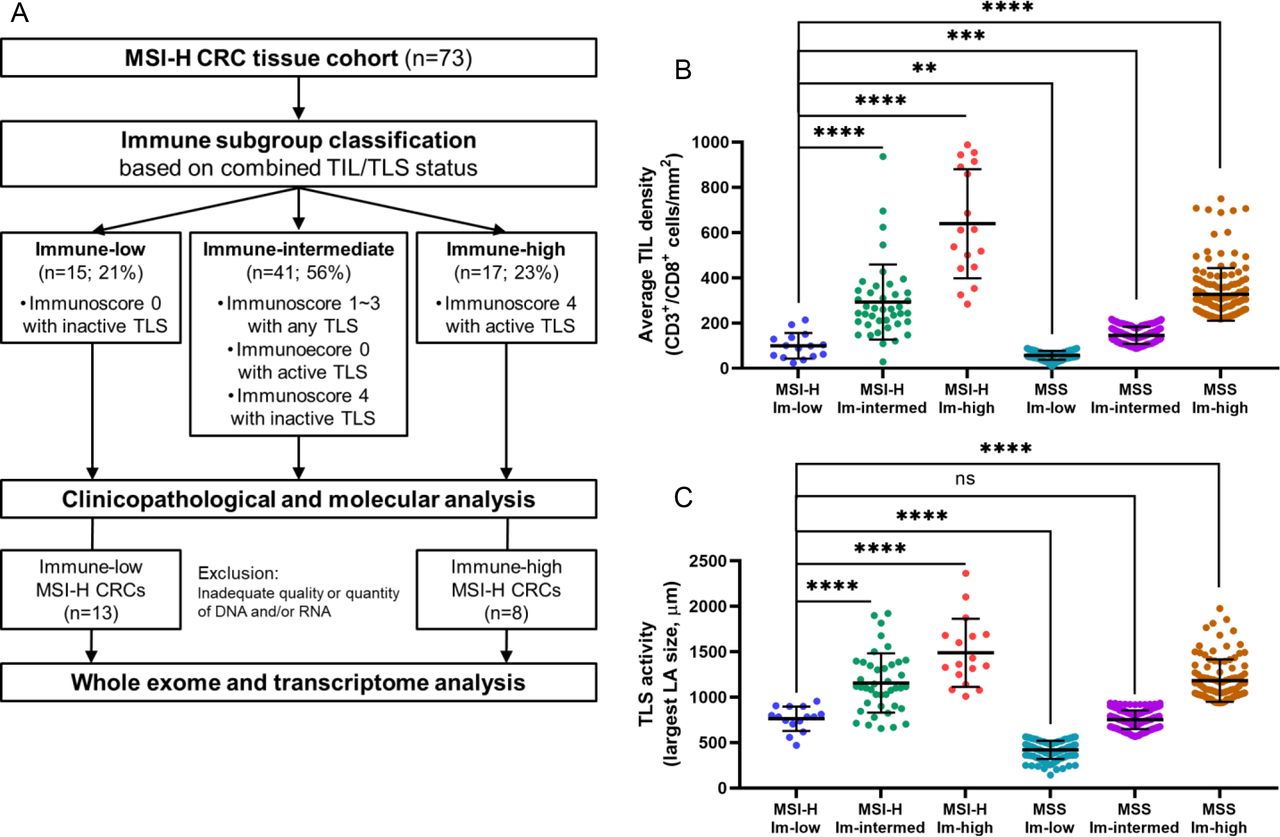
Based on our observations and the known major roles of TILs and TLSs in antitumor immunity,35 we attempted to employ both TIL Immunoscore and TLS activity values, which represent intratumoral and peritumoral lymphocytic responses, respectively, for MSI-H CRC subgroup classification. The usefulness of these two features in the immunological classification of CRCs has been described previously by Galon’s group20 (online supplemental figure 2) and Ueno’s group36 (online supplemental figure 3). We combined these two parameters to define three immunological subgroups for MSI-H CRCs: immune-low, immune-high, and immune-intermediate. The immune-low subgroup was defined as comprizing tumors with an Immunoscore of I0 and an inactive TLS score, and the immune-high subgroup was defined in terms of scores of I4 and active TLS; all others were classified as immune-intermediate. Consequently, 15 (21%), 17 (23%), and 41 (56%) of the 73 MSI-H CRCs were designated as immune-low, immune-high, and immune-intermediate, respectively (figure 2A). As expected, the three immune subgroups exhibited significantly different levels of TILs and TLSs (figure 2B–C). Moreover, we found that the levels of immune parameters not incorporated into the classification, including FoxP3+ TIL density, CD68+ TAM density, CD163+ TAM density, and PD-L1 immune cell expression, were also clearly distinct between the subgroups (online supplemental table 3). In addition, the TIL density and TLS activity of the immune-low subgroup of MSI-H CRCs were closer to those of the immune-low or immune-intermediate subgroups of MSS CRCs than to those of the immune-high MSS CRCs (figure 2B–C). Again, these results justify our immune subgrouping of MSI-H CRCs.
Supplemental material

Immune subgroup classification of MSI-H CRCs. (A) Second scheme of this study: from the immune subgroup classification to next-generation sequencing analysis. (B) Comparison of the average TIL densities (average densities of CD3+ TILs and CD8+ TILs at the invasive margin and center of tumor areas) between the three immune subgroups of the 73 MSI-H CRCs and those of the 535 MSS CRCs. (C) Comparison of TLS activities (maximum diameters of peritumoral TLS) between the three immune subgroups of the 73 MSI-H CRCs and those of the 411 MSS CRCs. (****, p<0.0001; ***, p<0.001; **, 0.001≤p < 0.01; *, 0.01≤p < 0.05; ns, not significant). Immune-low, immune-low; immune-intermed, immune-intermediate; Im-high, immune-high. CRCs, colorectal cancers; MSI-H, microsatellite instability-high; MSS, microsatellite-stable; TIL, tumor-infiltrating lymphocyte; TLS, tertiary lymphoid structure.
Clinicopathological features of MSI-H CRC immune subgroups
We assessed the differential clinicopathological and molecular features according to the immune subgroups of the 73 MSI-H CRCs. Among the clinical parameters, distant metastasis or early recurrence was more frequently represented in the immune-low subgroup (33% vs 0% in immune-low vs immune-high, p=0.015) (table 1). With regard to pathological features, greater tumor size (p=0.021), mucinous histology (73% vs 0% in immune-low vs immune-high, p<0.001), non-medullary histology (p=0.003), and signet ring cell histology (p=0.015) were significantly associated with the immune-low subgroup (table 1). Next, we assessed the associations between major molecular factors and immune subgroups and found that KRAS mutations were highly enriched in the immune-low subgroup (73% vs 29% in immune-low vs immune-high, p=0.013) (online supplemental table 4).
Comparison of clinicopathological features between immune subgroups of 73 microsatellite instability-high colorectal cancers
Genomic features of MSI-H CRC immune subgroups
Next, we conducted whole-exome and RNA-sequencing analysis on 21 MSI-H CRCs (8 immune-high and 13 immune-low), wherein high-quality matched tumor and normal tissues were available (figure 2A).
First, we assessed whether there were distinct genomic characteristics between the immune-low and high subgroups (figure 3A). From the WES data, we calculated and compared tumor mutational burden (TMB; non-synonymous mutations per megabase); no difference was observed between the immune-low and immune-high subgroups (p=0.66; figure 3B left). Similarly, no significant differences were found in neoantigen loads (p=0.54; figure 3B middle) and copy number variation (CNV) loads (p=0.91; figure 3B right). Analysis of mutational signatures (COSMIC v3) also showed that signatures related to dMMR (SBS6, SBS14, SBS15, SBS20, SBS21, SBS26, and SBS44) and deamination of 5-methylcytosine (SBS1) were universally present in both the immune-low and immune-high samples, without subgroup-specific signatures (figure 3C and online supplemental figure 4). These results collectively show that the degree of TMB, neoantigen load, and CNV load are not key factors of immune heterogeneity within MSI-H CRCs, and that dMMR-mediated hypermutated characteristics are maintained in immune-low MSI-H CRCs.
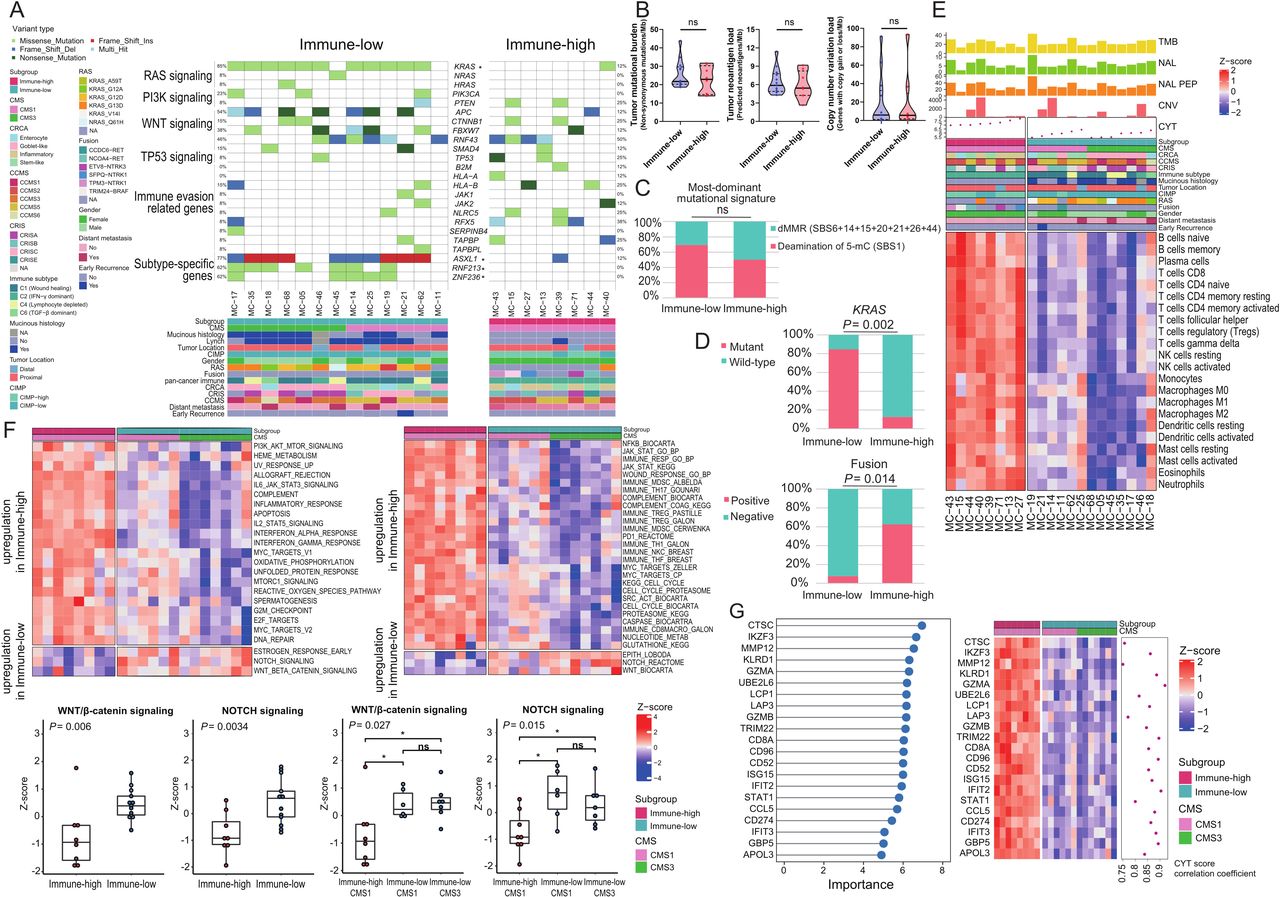
Differential genomic and transcriptomic profiles between immune subgroups of MSI-H CRCs. (A) An oncoplot presenting genetic alterations in major driver genes and immune evasion-related genes (top) and clinical parameters (bottom). Each row in the oncoplot represents different genes, which are clustered into six categories. Each column represents an individual case. Genes with * represent significant differences in mutation enrichment between the immune subgroups (*, p<0.005; Fisher’s exact test). (B) Comparison of TMB, neoantigen load, and CNV load between the immune-low and immune-high subgroups of MSI-H CRCs. P values were calculated using the Mann-Whitney U test (ns, not significant). (C) Comparison of the most dominant mutational signatures between the immune-low and immune-high subgroups of MSI-H CRCs. P value was calculated using the Fisher’s exact test (ns, not significant). (D) Comparison of proportions of KRAS mutations and oncogenic gene fusions between the immune-low and immune-high subgroups of MSI-H CRCs. P values were calculated using the Fisher’s exact test. (E) A heatmap showing RNA expression-based tumor immune microenvironmental profiles of the immune subgroups of MSI-H CRCs. Immune infiltration was inferred using ssGSEA z-score with the LM22 gene set of CIBERSORT. Difference of composition of cell types between immune-high and immune-low tumors was identified using false discovery rate correction of Mann-Whitney U test P values. (F) Heatmaps showing differently activated signaling pathways between the immune-high and immune-low subgroups of MSI-H CRCs. Gene sets were adopted from ssGSEA gene sets cancer Hallmark (upper left) and CRC subtyping consortium (upper right). The two lower-left boxplots represent expression differences in the Wnt/β-catenin and Notch signaling pathways between the immune-high and immune-low subgroups. The two lower-right boxplots represent expression differences in the Wnt/β-catenin and Notch signaling pathways between the immune-high CMS1, immune-low CMS1, and immune-low CMS3 subgroups. P values were calculated using the Mann-Whitney U test (for two groups) or Kruskal-Wallis test (for three groups). (G) Top DEGs identified by using the RF-RFE model are used to classify the two immune subgroups of MSI-H CRCs. Left: top DEGs by the degree of importance. Right: heatmap and correlation coefficient of CYT score and DEGs. Correlation coefficient was calculated using the Spearman correlation analysis. CCMS, colon cancer molecular subtype; CMS, consensus molecular subtype; CNV, copy number variation; CRC, colorectal cancers; CRCA, colorectal cancer assigner; CRIS, colorectal cancer intrinsic subtype; CYT, cytolytic activity; DEG, differentially expressed genes; dMMR, mismatch repair deficiency; MSI-H, microsatellite instability-high; ssGSEA, single-sample gene-set enrichment analysis; TMB, tumor mutational burden.
We further investigated the subgroup-associated genetic mutations. As shown in the preceding analysis, enrichment of KRAS mutations in the immune-low subgroup was reproduced in the next-generation sequencing-based analysis (p=0.002; figure 3D upper). Similarly, RNF213 (p=0.007), ZNF236 (p=0.007), and ASXL1 (p=0.008) were more frequently mutated in immune-low tumors (figure 3A and online supplemental figure 5). Further analysis of structural variations in MSI-H CRCs revealed that tyrosine kinase domain-preserving gene fusions, including NCOA4-RET, ETV6-NTRK3, TPM3-NTRK1, SFPQ-NTRK1, and TRIM24-BRAF, were significantly enriched in the immune-high subgroup (p=0.014; figure 3D lower and online supplemental figure 6). Except for KRAS mutations, other major driver mutations, including APC, TP53, NRAS, HRAS, PIK3CA, PTEN, SMAD4, CTNNB1, RNF43, and FBXW7, were not associated with a specific immune subgroup (figure 3A). Mutations in genes involved in immune evasion pathways, including B2M, HLA-A/-B, JAK1/2, NLRC5, RFX5, SERPINB4, TAP1/2, TAPBP, and TAPBPL, were relatively enriched in the immune-high subgroup (figure 3A).
Gene expression signatures of MSI-H CRC immune subgroups
RNA-sequencing data were used to confirm the distinct immune features of the immune subgroups. We applied three independent computational algorithms (ssGSEA, MCP-counter, and consensusTME) to profile the abundance of tumor-infiltrating immune cells using transcriptome data. These analyses clearly showed the depletion of most immune cell types in the immune-low subgroup (figure 3E and online supplemental figure 7).
We also investigated the association between signaling pathways and the immune subgroups. Both ssGSEA on molecular signatures from MSigDB Hallmark (figure 3F upper left) and the CRCSC (figure 3F upper right) showed significant downregulation of immune-associated pathways such as interferon α/γ, interleukin 2-STAT5, and interleukin 6-JAK-STAT3 in the immune-low subgroup (all, p<0.05). In contrast, Wnt/β-catenin and Notch signaling pathways were significantly activated in the immune-low subgroup (all p<0.05; figure 3F lower).
Next, we attempted to extract a minimal subset of DEGs that could classify the immune subgroups. Using random forest recursive feature elimination, we identified 21 genes that were downregulated in the immune-low subgroup and confirmed that the expression of these 21 genes was sufficient to distinguish the 2 immune subgroups (figure 3G left). The majority of the 21 DEGs were interferon/cytolysis-related genes and their expression strongly correlated with CYT score (figure 3G right, all, Spearman R>0.75 and p<8.21×10⁻⁵), indicating that different antitumor immune responses are the most distinctive feature between the immune-high and immune-low MSI-H CRCs.
Inter-relation of immune subgroups with CRC molecular subtypes
To determine the interconnectivity between MSI-H CRC immune subgroups and various gene expression-based CRC molecular classifications, including the CMS, CRCA, CCMS, CRIS, and pan-cancer immune subtype (C1–C6),24–27 29 we applied each of the molecular subtyping methods to the 21 MSI-H CRCs and analyzed how their subtype statuses were interrelated with the immune subgroups (figure 4A).

Combined immune CMS subtyping of MSI-H CRCs and its immuno-oncological implications. (A) Molecular subclassification of the immune subgroups of MSI-H CRCs using various molecular subtyping systems. Each column cluster is the representative CRC molecular classification, including the CMS, CRCA, CCMS, CRIS, or pan-cancer immune subtype classification. The upper row represents the distribution pattern of each classification in the immune-high and immune-low subgroups. The lower row represents distribution pattern of each classification in the immune-high CMS1, immune-low CMS1, and immune-low CMS3 subtypes. (B) An expression heatmap of stem-like and goblet-like genes according to the immune CMS subtypes. Each column cluster represents the immune-high CMS1, immune-low CMS1, and immune-low CMS3 subtypes. Each row represents the gene expression pattern of stem-like and goblet-like genes. (C) A heatmap of immune cycle and immune response predictive signature scores using single-sample gene-set enrichment analysis, according to the immune CMS subtypes. Each column cluster represents the immune-high CMS1, immune-low CMS1, and immune-low CMS3 subtypes. Each row represents the expression pattern of a curated gene-set, clustered into six immune cycles and one predictive signature. (D) GSEA results of immune cycle and immune response predictive signatures according to the immune CMS subtypes. Each column cluster represents the immune-high CMS1, immune-low CMS1, and immune-low CMS3 subtypes. Each row represents the expression pattern of the curated gene-set. Each GSEA was performed between one subtype vs two other subtypes. (E) Comparison of POSTN expression between the three immune CMS subtypes. (**, 0.001≤p < 0.01; *, 0.01≤p < 0.05; Mann-Whitney U test) (F) Comparison of DEG expression between the three immune CMS subtypes. DEGs were selected from the immuno-oncological target list. (***, p<0.001; **, 0.001≤p < 0.01; *, 0.01≤p < 0.05; ns, not significant; Mann-Whitney U test). (G) Representative photomicrographs of CD200 IHC of immune-high CMS1 and immune-low CMS3 tumors (left; scale bar, 200 µm). Comparison of proportions of the CD200-high subgroup between the three immune subtypes (right). CD200-high or CD200-low subgroups were classified using a cut-off value of an average of CD200 IHC H-scores. CCMS, colon cancer molecular subtype; CMS, consensus molecular subtype; CRC, colorectal cancers; CRCA, colorectal cancer assigner; CRIS, colorectal cancer intrinsic subtype; DEG, differentially expressed genes; IFN, interferon; IHC, immunohistochemistry; MSI-H, microsatellite instability-high; GSEA, gene-set enrichment analysis; TGF, transforming growth factor.
Among the CRC molecular subtyping systems, CMS classification conferred the most explicit and explainable secondary stratification. All immune-high tumors were assigned to CMS1 (MSI-immune type), which is concordant with the expected characteristics of MSI-H CRCs. In contrast, the immune-low subgroup was subdivided into two subtypes: CMS1 (46%) and CMS3 (metabolic type) (54%) (figure 4A). Consequently, the 21 MSI-H CRCs could be reclassified into three subtypes: immune-high-CMS1 (n=8), immune-low-CMS1 (n=6), and immune-low-CMS3 (n=7).
The different molecular bases of immune-CMS subtypes were further investigated. We found that stem-like and goblet-like CRCA subtypes were enriched in immune-low CMS1 (67%) and immune-low-CMS3 (86%), respectively, while the major CRCA subtype in immune-high CMS1 was inflammatory type (63%) (figure 4A lower). Differential expression of stem-like genes (ZEB1 and SFRP2) and goblet-like genes (TFF2, TFF3, and MUC2) in immune-low CMS1 and CMS3 tumors was also confirmed (figure 4B). In addition, predominance of C1 ‘would healing’ immune subtype and depletion of C2 ‘IFN-γ dominant’ subtype were the key signatures of immune-low CMS1 that were distinct from the immune-high CMS1 (figure 4A lower).
Integrative stratification of MSI-H CRCs for precision immunotherapy
Based on the immune subgrouping and integrative stratification, we assessed whether the heterogeneous response to ICB-based immunotherapy in patients with MSI-H CRC could be explained by the variable molecular mechanisms and levels of immune evasion among MSI-H CRCs.
We conducted ssGSEA and GSEA using 53 gene signatures (online supplemental table 2) related to the immune cycle, including antigen presentation, priming and activation of antigen-presenting cells and T-cells, trafficking of T-cells to tumors, T-cell infiltration, recognition of cancer cells, tumor killing, and immune predictive signatures (figure 4C–D). Immune repressive signatures that affect the early stages of the immune cycle were observed in immune-low tumors. Hence, potential immune evasion mechanisms were observed throughout the entire immune cycle for immune-low tumors (all, p<0.005 and |log2 fold change|>0.5). Moreover, activation of mesenchymal signatures, including endothelial cells, fibroblasts, angiogenesis, and cancer-associated extracellular matrix (C-ECM), was observed in the immune-low CMS1 tumors (figure 4C–D and online supplemental figure 8); these are characteristics of the CMS4 subtype.24 On the other hand, strong epithelial signatures were observed in the immune-low CMS3 (figure 4C–D). Further analysis of the subtype-specific DEGs (p<0.05, |log2 fold change|>2) identified genes that potentially drive immune evasion for each subtype (online supplemental figure 9). Notably, POSTN, which is known to mediate transforming growth factor-β (TGF-β)-induced epithelial-mesenchymal transition in cancer cells,37 was specifically activated in immune-low CMS1 tumors (figure 4E).
Finally, we investigated potential immuno-oncological targets in each subtype to determine their suitability for combinational or alternative treatments. Immune-high CMS1 exhibited higher levels of TIM-3, TIGIT, and KLRC1 immune checkpoints. In contrast, FLT1 (VEGFR1) and CD200 were activated in immune-low CMS1 and immune-low CMS3 tumors, respectively (figure 4F), and CD200 protein was significantly overexpressed in immune-low CMS3 tumor tissues (figure 4G), suggesting the possibility of combinatorial antiangiogenesis or anti-CD200 treatment in immune-low MSI-H CRC subtypes.
Discussion
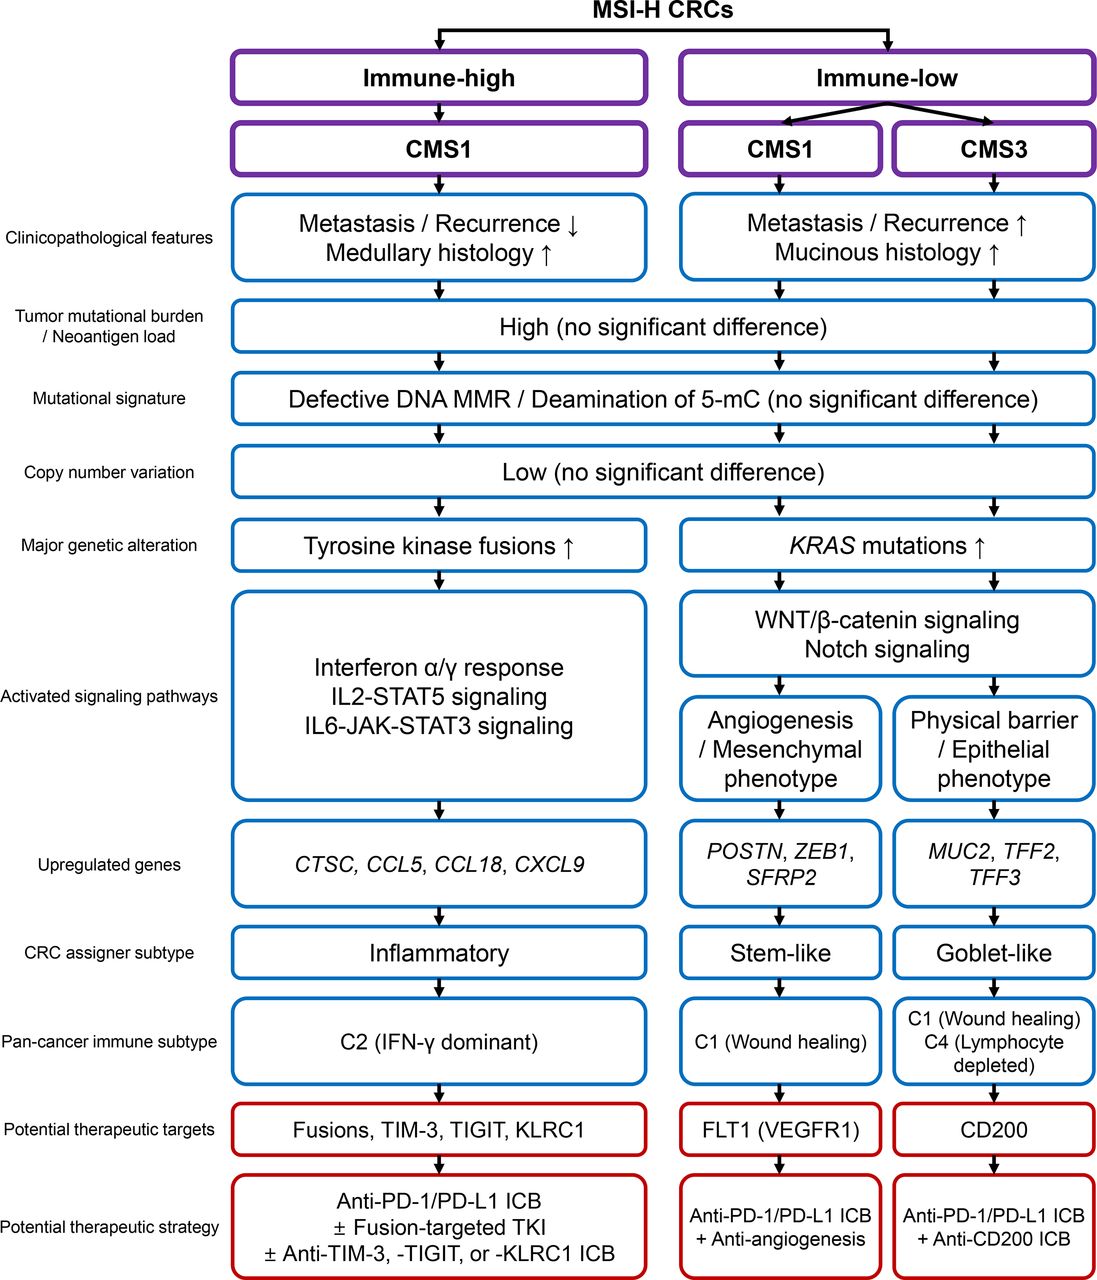
In this study, we conducted a comprehensive and quantitative analysis of MSI-H CRCs to explore the clinicopathological and genomic basis of heterogeneous immune responses. A wide variety in the tumor immune microenvironment, including TILs, TAMs, and TLS, their intercorrelation, and their regional homogeneity, justified immunological subgrouping of MSI-H CRCs. Subgrouping was executed using combinatorial assessment of CD3+ and CD8+ TIL densities and TLS activity. We showed that the three subgroups (immune-high, immune-intermediate, and immune-low) were successfully distinguished in terms of clinical parameters, histology, and genetic factors. Finally, we showed that immune-low MSI-H CRCs were heterogeneous in terms of transcriptomic features. The MSI-H CRCs were further divided into CMS1 and CMS3, forming three immune subgroups: immune-high CMS1, immune-low CMS1, and immune-low CMS3. The total clinicopathological and genomic/transcriptomic features of the subgroups are summarized in figure 5.

Schematic summary of this study. CMS, consensus molecular subtype; CRC, colorectal cancers; ICB, immune checkpoint blockade; IFN, interferon; IL, interleukin; MMR, mismatch repair; MSI-H, microsatellite instability-high; PD-1, programmed cell death protein 1; PD-L1, programmed death-ligand 1; TKI, tyrosine kinase inhibitor; 5-mC, 5-methylcytosine.
In general, the source of the immunogenic heterogeneity in MSI-H CRCs is presumed to fall within one of the two areas: (1) differences in TMB and/or neoantigens that initiate T cell immunity, and (2) genetic alterations that affect the machinery and signaling pathways that mediate early to late immune responses. For instance, the association between TMB and the response to ICBs in MSI-H patients has been reported in a previous study.38 Nevertheless, in this study, no factors that evidently predetermined the overall behaviors were observed. Instead, our findings indicate that the immunogenic heterogeneity of MSI-H CRCs is formed by a complex interplay of genetic, transcriptomic, and microenvironmental factors, thereby presenting multiple intrinsic subtypes. Similar to the generally accepted subtypes in other cancers, immune subgroups of MSI-H CRCs would be determined by multiple parameters, such as gene signatures, rather than a single discriminating factor.6 39 This is in line with recent evidence of inconsistency and tumor-type dependency of TMB in immunotherapy responses.40–42
Interestingly, the Wnt/β-catenin and Notch signaling pathways were significantly activated in the immune-low subtype of MSI-H CRCs (figure 3F). Previous investigations have suggested that specific oncogenic signaling pathways are closely associated with immune evasion in various cancers, and consistent with our findings, Wnt or Notch pathway activation has been identified as a cancer type-agnostic factor correlated with poor immune responses.43 44 Our finding is important because the suppression of tumor immunity due to specific oncogenic pathway activation may overcome the beneficial effect of high TMB on antitumor immune responses. Therefore, efforts to predict tumor responses to immunotherapy must consider the status of major oncogenic pathways in addition to TMB.
The clinical application of immune subtypes of MSI-H CRCs is clearly the next important step in this field, which can be achieved by accurate subgroup classification and assignment of precise treatments. Among the three subgroups, immune-high CMS1 is expected to show a good response rate to current ICBs, as shown by its dense lymphocytic infiltration and high PD-L1 expression. Moreover, enriched targetable fusions and upregulation of immune checkpoint molecules (ie, TIM-3, TIGIT, and KLRC1) would confer more therapeutic options such as tyrosine kinase inhibitors and combination immunotherapies (figure 5).45 46 On the other hand, immune-low CMS1 shows poor prognosis and immune desert-like features, manifesting the opposite characteristics to those expected in typical MSI-H CRCs. These characteristics pose substantial risks for imprecise treatment. From this perspective, accurate identification of immune-low CMS1 would be of the highest priority in clinical application and is crucial to the successful stratification of MSI-H CRCs. In addition, screening of immune-low subtypes would provide additional opportunities for the development of new therapeutic strategies by identifying novel, subgroup-specific targets. For example, inhibition of FLT1 and CD200, which are specifically upregulated in immune-low CMS1 and CMS3 tumors, can lead to improved responses, as shown in the cases of bevacizumab (angiogenesis inhibitor) in CRCs47 48 and CD200-inhibitor in multiple tumors (figure 5).49 50
Developing clinical-level diagnostic procedures is one of the goals of this study. Building a standard operating protocol requires robust measurement parameters, including sample collection, defining the region of interest, and setting up classification criteria. In this regard, our multiregional quantitative analysis of in situ immune infiltrates provides promising evidence for the robustness of the method, including regional homogeneity of major immune responses (such as CD3+ and CD8+ TILs) throughout intratumoral regions and the high correlation of TIL and TAM densities between the IM and CT areas. In addition, the intercorrelation of immune parameters supports the stability of the measurements obtained in this study. Moreover, constructing a classification model should be conducted using larger cohorts to combine immune parameters and genetic features. As the genetic features cover both mutations (eg, KRAS mutation) and gene expression signatures, we expect that more sophisticated bioinformatics analysis will be required to resolve issues with multidimensionality and normalization to finalize the classification model, especially in the form of single sample predictors.
The frequency of MSI-H CRCs is known to be low (approximately 15% or less in overall CRCs), which affected the relatively small number of our study samples. Furthermore, the samples to be included in this study were selected using strict criteria (figures 1A and 2A) because both exome and transcriptome sequencing analyses had to be performed, contributing to the small number of final sequenced samples. Although our study has limitations in study size, we successfully identified key findings that are important clues to understanding the molecular basis of immune heterogeneity in MSI-H tumors. The genomic and transcriptional features of immune subgroups of MSI-H CRCs identified in our study need to be validated in multi-institutional larger cohorts.
In conclusion, although most MSI-H CRCs are immunogenic hypermutated tumors, their immunological features are heterogeneous. According to our data, differences in TMB or neoantigen load cannot elucidate intertumoral immune heterogeneity in MSI-H CRCs. Instead, mucinous histology, KRAS mutations, and Wnt/Notch pathways activation characterize an immune-low subgroup of MSI-H CRCs. Immune-low MSI-H CRCs are further divided into different gene expression subtypes, including (CMS4-like) CMS1 and CMS3. Our results suggest that tailored immunotherapeutic strategies for each immune-CMS subtype will be potentially effective for the treatment of MSI-H CRCs.
Data availability statement
Data are available in a public, open access repository. Data are available upon reasonable request. The whole exome and transcriptome data sets generated during the current study are available in the NCBI Sequence Read Archive (SRA)/BioProject repository (accession number: PRJNA727917; URL: https://www.ncbi.nlm.nih.gov/bioproject/PRJNA727917). All other data are available from the corresponding author on reasonable request.
Ethics statements
Patient consent for publication
Ethics approval
This study was conducted in compliance with the ethical guidelines of the 2013 Declaration of Helsinki. All tumor and normal tissues included in this study were previously deposited in the Seoul National University Hospital Cancer Tissue Bank with informed consents obtained from all patients. This study was approved by the Institutional Review Board of Seoul National University Hospital (IRB No. 1804-036-935).
Acknowledgments
All the fresh frozen tissues used in this study were provided by the Seoul National University Hospital Cancer Tissue Bank. All samples deposited in the tissue bank were obtained with informed consents from patients under institutional review board-approved protocols.
References
Supplementary materials
Supplementary Data
This web only file has been produced by the BMJ Publishing Group from an electronic file supplied by the author(s) and has not been edited for content.
Footnotes
Contributors JHK and SK conceived the study. JHK, JAL, S-YY, HJO and JMB collected tissue samples and clinical data and performed histopathological examination. JAL and S-YY conducted the digital pathology analyses. JHK, M-KS, JAL and N-YC carried out the experiments. M-KS, HK and SK performed the bioinformatics analyses. JHK and M-KS conducted the statistical analyses and wrote the draft. JHK, M-KS, GHK and SK revised the manuscript. JHK, GHK and SK supervised the study. JHK and SK are responsible for the overall content as the guarantor. All authors reviewed and approved the final version of the manuscript.
Funding This work was supported by grants from the National Research Foundation of Korea funded by the Korea government (Ministry of Science and ICT) (NRF-2016R1C1B2010627 to JHK, NRF-2019R1F1A1059535 to JHK, NRF-2019R1A2C2008050 to SK); and the Korea Health Technology R&D Project through the Korea Health Industry Development Institute funded by the Korea government (Ministry of Health and Welfare) (HI14C1277 to GHK).
Competing interests None declared.
Provenance and peer review Not commissioned; externally peer reviewed.
Supplemental material This content has been supplied by the author(s). It has not been vetted by BMJ Publishing Group Limited (BMJ) and may not have been peer-reviewed. Any opinions or recommendations discussed are solely those of the author(s) and are not endorsed by BMJ. BMJ disclaims all liability and responsibility arising from any reliance placed on the content. Where the content includes any translated material, BMJ does not warrant the accuracy and reliability of the translations (including but not limited to local regulations, clinical guidelines, terminology, drug names and drug dosages), and is not responsible for any error and/or omissions arising from translation and adaptation or otherwise.