Article Text

Abstract
Background Matrix metalloproteinase-9 (MMP9) selectively cleaves extracellular matrix proteins contributing to tumor growth and an immunosuppressive microenvironment. This study evaluated andecaliximab (ADX), an inhibitor of MMP9, in combination with nivolumab (NIVO), for the treatment of advanced gastric cancer.
Methods Phase 2, open-label, randomized multicenter study evaluating the efficacy, safety, and pharmacodynamics of ADX+NIVO versus NIVO in patients with pretreated metastatic gastric or gastroesophageal junction (GEJ) adenocarcinoma. The primary endpoint was objective response rate (ORR). Secondary endpoints included progression-free survival (PFS), overall survival (OS), and adverse events (AEs). We explored the correlation of efficacy outcomes with biomarkers.
Results 144 patients were randomized; 141 were treated: 81% white, 69% male, median age was 61 years in the ADX+NIVO group and 62 years in the NIVO-alone group. The ORR was 10% (95% CI 4 to 19) in the ADX+NIVO group and 7% (95% CI 2 to 16) in the NIVO-alone group (OR: 1.5 (95% CI 0.4 to 6.1; p=0.8)). There was no response or survival benefit associated with adding ADX. AE rates were comparable in both treatment groups; the most common AEs were fatigue, decreased appetite, nausea, and vomiting. Programmed cell death ligand 1, interferon-γ (IFN), and intratumoral CD8+ cell density were not associated with treatment response or survival. The gene signature most correlated with shorter survival was the epithelial-to-mesenchymal gene signature; high transforming growth factor (TGF)-β fibrosis score was negatively associated with OS (p=0.036). Gene expression analysis of baseline tumors comparing long-(1+ years) and short-term (<1 year) survivors showed that GRB7 was associated with survival beyond 1 year. Human epidermal growth factor receptor 2 (HER2)-positive disease was associated with significantly longer survival (p=0.0077). Median tumor mutation burden (TMB) was 2.01; patients with TMB ≥median had longer survival (p=0.0025) and improved PFS (p=0.016). Based on a model accounting for TMB, TGF-β fibrosis, and HER2, TMB was the main driver of survival in this patient population.
Conclusion Combination of ADX+NIVO had a favorable safety profile but did not improve efficacy compared with NIVO alone in patients with pretreated metastatic gastric or GEJ adenocarcinoma. HER2 positivity, higher TMB or GRB7, and lower TGF-β were associated with improved outcomes.
Trial registration number NCT02864381 or GS-US-296–-2013.
- antibodies
- neoplasm
- Biomarkers
- Tumor
- Clinical Trials
- Phase II as Topic
Data availability statement
Data are available on reasonable request.
This is an open access article distributed in accordance with the Creative Commons Attribution Non Commercial (CC BY-NC 4.0) license, which permits others to distribute, remix, adapt, build upon this work non-commercially, and license their derivative works on different terms, provided the original work is properly cited, appropriate credit is given, any changes made indicated, and the use is non-commercial. See http://creativecommons.org/licenses/by-nc/4.0/.
Statistics from Altmetric.com
INTRODUCTION
The majority of patients with advanced gastric cancer experience disease progression and will die of their disease.1–4 This underscores the unmet need for novel therapies, and novel biological profiles or companion tests, in order to improve survival for patients with relapsed/refractory disease. Andecaliximab (ADX) is a recombinant monoclonal antibody that targets the zinc-dependent matrix metalloproteinase-9 (MMP9).5 MMP9 may regulate tumor invasion and metastasis and promote angiogenesis.6 7 MMP9 overexpression has been observed in a variety of solid tumor diseases, and has been shown to be associated with poor prognosis.8–14 ADX showed encouraging clinical activity in combination with oxaliplatin plus leucovorin and 5-fluorouracil (mFOLFOX6) in patients with advanced human epidermal growth factor (EGF) receptor 2 (HER2)-negative gastric/gastroesophageal junction (GEJ) adenocarcinoma in a single-arm phase 1/1b trial.15 Further evaluation of this treatment regimen in a phase 3 trial demonstrated that the addition of ADX to chemotherapy did not improve patient survival relative to chemotherapy alone.16
In addition to its established role of promoting wound healing, which in the setting of cancer is associated with fibrillar collagen deposition and desmoplasia, MMP9 can locally activate cytokines and growth factors.6 17 18 Tumor growth is promoted by MMP9-mediated cleavage of cytokines such as interleukin (IL)-8 and IL-1β,19–21 as well as through MMP9-mediated increase in bioavailability of extracellular matrix-sequestered growth factors such as vascular endothelial growth factor, fibroblast growth factor-2, and membrane-tethered EGF.22 23 MMP9 supports the development of a protumor immune tumor microenvironment (TME) by increasing the recruitment and/or activation of myeloid-derived suppressor cells and reducing trafficking of T cells to tumors through inactivation of key chemoattractants CXCL9, CXCL10, and CXCL11.24–26 Additionally, MMP9 cleaves and activates transforming growth factor (TGF)-β, a key mediator of immune suppression in the TME. These impacts of MMP9 on tumor immunity prompted evaluation of the combination of anti-MMP9 and anti-programmed death ligand 1 (anti-PD-L1) antibodies in a preclinical model.27 MMP9 inhibition improved T-cell responses to the immune checkpoint inhibitor (ICI), as evidenced by reduced T-cell receptor (TCR) clonality and increased TCR diversity as well as increased intratumoral memory and effector CD4 and CD8 T cells.27
Inhibition of the programmed cell death 1 (PD-1)/PD-L1 immune checkpoint allows effector TCR within the tumor which leads to improved T cell-mediated tumor cell (TC) killing. ICIs have demonstrated durable clinical benefit in multiple solid tumors, but efficacy as monotherapy in gastric cancer has been quite limited.28–31 In this random-assignment, multicenter, phase 2 study, we examined the hypothesis, based on preclinical evidence, that targeting MMP9 in combination with ICI could lead to an improved antitumor immune response in patients with advanced gastric cancer. We also examined numerous biomarker hypotheses on the impact of MMP9 inhibition on the TME, as well as exploratory analyses on biomarkers associated with efficacy to immunotherapy.
Methods
Study design and conduct
This was a phase 2, open-label, randomized multicenter study comparing ADX combined with nivolumab (NIVO) versus NIVO alone in patients with recurrent gastric or GEJ adenocarcinoma. The study was conducted at 34 sites across the USA, Europe, and Australia. Eligible patients were randomized 1:1 (stratified by PD-L1 status (≥1% vs <1% TC staining by immunohistochemistry (IHC) using the 28-8 pharmDx Agilent Assay in a central laboratory)) via interactive web response system to ADX+NIVO or NIVO alone, and treated for up to 2 years until disease progression, unacceptable toxicity, or consent withdrawal (online supplemental figure 1). Following completion of treatment, patients were followed for safety at 30 days after the last dose of ADX, and at 5 months after the last dose of NIVO. Follow-up for survival status was approximately every 3 months for up to 5 years.
Supplemental material
The primary endpoint of the study was overall response rate (ORR) by the investigator assessment, defined by Response Evaluation Criteria in Solid Tumors (RECIST) V.1.1 as the proportion of patients with best overall response of complete response (CR) or partial response (PR) after starting study drug and before starting any new anticancer therapy.
Secondary endpoints were overall survival (OS), progression-free survival (PFS), duration of response, and the occurrence of adverse events (AEs) and laboratory abnormalities during treatment. Blood-based and tissue-based biomarkers were assessed as exploratory endpoints, including baseline and change from baseline values.
Eligibility
Eligible patients were age ≥18 years; had adequate hematological and hepatic function, creatinine clearance ≥60 mL/min, and histologically confirmed inoperable locally advanced or metastatic stomach or GEJ adenocarcinoma; and progressed on ≥1 prior systemic therapies or lines of treatment for unresectable/metastatic disease. Patients had Eastern Cooperative Oncology Group (ECOG) performance status ≤1, and all toxicities attributed to prior anticancer therapy (other than alopecia and fatigue) must have resolved to baseline or grade 1 (National Cancer Institute Common Terminology Criteria for Adverse Events V.4). It was required that patients had measurable disease according to RECIST V.1.1, that tumor sites were accessible for repeat biopsies, and that adequate archival tumor tissue was available for the central pathology PD-L1 stratification test.
Patients were not eligible if they had previously received only neoadjuvant or adjuvant therapy for gastric adenocarcinoma or had received radiotherapy within 28 days of randomization; exceptions were allowed if patients had recovered from any acute, reversible effects of radiotherapy and the radiated sites did not contain lesions that could be used to evaluate response. Patients with uncontrolled intercurrent illness (including active uncontrolled infection, active gastrointestinal bleeding, or uncontrolled cardiac arrhythmia) were not eligible.
Study treatment
Patients randomized to NIVO alone received 3 mg/kg NIVO via intravenous infusion over approximately 60 min on day 1, and every 2 weeks thereafter. Patients randomized to ADX+NIVO received 800 mg ADX on day 1 (and every 2 weeks thereafter) administered via ntravenous infusion over approximately 30 min, given prior to NIVO (3 mg/kg) administered via intravenous infusion over approximately 60 min.
Clinical assessments
Contrast-enhanced (or without contrast if use of contrast was contraindicated) CT or gadolinium-enhanced MRI of the chest, abdomen, and pelvis were performed at screening, every 8 weeks during the study, and at the end of study visit if one had not been performed within the last 8 weeks. RECIST V.1.1 was used for assessment of tumor responses, with some modifications to account for atypical responses that might have occurred with immune-based therapies.
Biomarker assessments
Archival biological specimens of formalin-fixed paraffin-embedded (FFPE) gastric tumor tissue were obtained in this study and used for stratification (PD-L1) and to evaluate the association of exploratory systemic and/or tissue-specific biomarkers with response. On-treatment biopsies were obtained between weeks 5 and 9 of treatment, formalin-fixed, and embedded in paraffin. PD-L1 was assessed centrally by IHC using the 28-8 pharmDx assay (Agilent, Santa Clara, California, USA). PD-L1 scoring was performed by a board-certified licensed anatomic pathologist based on a visual estimate of the whole slide. Only tissue samples with at least 100 TC were scored. Tumors were scored as ≥1% TC-positive if at least 1% of the tumor was tumor membrane PD-L1-positive (1+ or greater). Tumors were scored as ≥1% tumor and associated immune cell (IC)-positive (TC+IC) if at least 1% of the tumor-associated ICs were PD-L1-positive and/or at least 1% of the tumor was tumor membrane PD-L1-positive (1+ or greater). The TC +IC score is similar to the combined positive score used in the KEYNOTE-059 study.32 Mismatch repair deficiency (dMMR) was evaluated in archival specimens by MSH2, MSH6, MLH1, and PMS2 IHC using standard procedures, and ICs served as positive controls. Loss of one or more was scored as dMMR, and dMMR data were available for 140 patients. Hematoxylin and eosin–stained samples were evaluated by a licensed anatomic pathologist for desmoplasia. Intratumoral CD8 was assessed in archival and on-treatment tissues by IHC, followed by quantitative image analysis in tumor areas as defined by a pathologist, and findings were reported as the density of CD8+ cells (# of positive cells/mm2). Baseline CD8 IHC data were available for 126 treated patients. RNA extracted from FFPE tissues (archival and on-treatment specimens) was sequenced (TruSeq RNA Access; Illumina, San Diego, California, USA) from samples with at least 20% tumor (a small number of samples required macrodissection). Liver, lymph node, and samples with <30% tumor (assessed using the ESTIMATE algorithm33 on RNAseq data) were removed from biomarker analyses. Tumor mutation burden (TMB) was measured in FFPE tumor specimens using whole-exome sequencing for 52 patients with sufficient sample.
Statistical analyses
Sample size was determined based on the assumption of an ORR of 12% in patients treated with NIVO alone34; 120 subjects in total were estimated to be required in order to detect an improvement of 20% in ORR in the ADX+NIVO treatment group, with approximately 83% power at the one-sided significance level of 10% using the Cochran-Mantel-Haenszel (CMH) method (assuming common OR for all strata).
The primary endpoint of ORR was tested at a two-sided alpha level of 0.2. ORR is presented with corresponding two-sided 95% exact CIs calculated using the Clopper-Pearson method. OR is presented with corresponding 95% CI and was calculated using the exact CMH Χ² test stratified by screening PD-L1 status. Subjects who did not have sufficient baseline or on-study tumor assessments to characterize response were counted as nonresponders and included in the denominator only.
Survival analyses for both OS and PFS were performed using Cox-proportional hazards models, adjusting for age and sex. Though age and sex were not independent predictors of response in the overall population, this parsimonious model was selected to account for potential residual confounding in various subgroups and to maintain the same covariate list in all analyses, regardless of sample size reduction. PFS was defined as the interval from the date of randomization to death (any cause) or the first definitive progressive disease (PD). Definitive PD was either clinical PD, imaging PD, or radiation therapy. OS was defined as the interval from the date of randomization to death from any cause. Due to the exploratory nature of the current study, p values were not corrected for multiple testing. Data reported here are through November 6, 2019.
The centralized randomization was stratified by PD-L1-positive (≥1% TC) vs PD-L1-negative (<1% TC).
Transcriptome sequencing
RNA-Seq libraries from each tissue sample were prepared using the Illumina TruSeq RNA-access Library Prep Kit from 100 ng of input total RNA. All libraries were sequenced using the Illumina HiSeq2500 sequencing system to generate 50 bp paired-end reads. RNA-Seq protocols were performed based on manufacturer specifications.
Reads were aligned to the human genome ensemble GRCh38 (hg38) using STAR (V.2.3.0e). Quality assessment on alignment results was performed using FastQC (V.0.10.1)35 and Qualimap2.36
After quality-control assessment determined that no samples needed to be removed based on the proportion of mapped reads to total reads and exonic rate, alignment-free methods were employed for quantification of gene expression using Salmon (V.0.8.2).37 38 Count data were converted for downstream analyses to transcripts per million reads and were log2 transformed.39 40
Differential expression analysis for samples from long-term versus short-term survivors (<1 year) was an exploratory—not prespecified—analysis, carried out on count data that were normalized by weighted trimmed mean of M-values and subsequently analyzed using limma-voom41 in R. Results were corrected for multiple comparisons using a false discovery rate. Gene set enrichment analysis (GSEA) was performed using the GO, BIOCARTA, and HALLMARK collections in the MSigDB Molecular Signatures Database.42
Additionally, the current study examined gene expression signatures for IFN-ɣ,43 Teff,44 and activated T cells,45 as well as other biologically relevant signatures for immuno-oncology.46–48 These gene expression signatures were calculated using single-sample GSEA.49
Whole-exome sequencing
GATK (V.4.1.0.0)50 and BWA-MEM (V.0.7.17)51 were used for preprocessing sample fastq files to bam files, using GRCh38(hg38) as reference genome to align the reads.
For somatic variant detection, Mutect2 was used with matched normal (blood) samples to generate the VCF files. VCF files were then converted to mutation annotation format and processed to generate the final variant count for each tumor sample.
TMB was then calculated by dividing the total variant count by 38 (approximate exome length, in megabases) as previously described by Chalmers et al.52
Results
From September 1, 2016 to May 12, 2017, 144 patients were enrolled and randomized, and constitute the intent-to-treat analysis group; and 141 patients received treatment, constituting the safety data set (consort diagram, online supplemental figure 2). The median duration of follow up for OS and PFS were 28.4 and 23.0 months, respectively (OS median(range)=28.4 (0.39–34.3); PFS median(range)=23.0 (0.3–28.7)). Eighty-one per cent of the patients were white, 69% were male, and median age was 61 years in the ADX+NIVO group and 62 years in the NIVO-alone group (table 1). There was an approximate even distribution of gastric versus GEJ tumors, and poorly differentiated disease was more prevalent in the ADX+NIVO group (49%) than the NIVO-alone group (29%). Median number of prior therapies was 2.2 (range: 1–6) in the ADX+NIVO group and 2.0 (range: 1–6) in the NIVO-alone group. Overall, 18% of the total population was PD-L1-positive based on TC staining, and 72% was PD-L1-positive based on tumor and associated IC staining (TC+IC). Staining profiles were balanced between treatment arms. Only three patients had dMMR tumors, all in the NIVO-alone arm, and two of these three were treated. Testing the independent relationship between clinical outcomes and each baseline factor presented in table 1 using univariate regression models, we observed that only ECOG and number of prior therapies were associated with either OS or PFS (p<0.05). No additional covariates were associated with OS, PFS, or BOR, either in the total treated population or in the biomarker data subset (online supplemental table 1).
Baseline characteristics
Overall efficacy
Seven patients achieved a CR (n=1) or PR (n=6) to ADX+NIVO, and 5 patients (1 of whom was dMMR-positive) achieved a PR to NIVO alone. The ORRs (95% CI) in the ADX+NIVO and NIVO-alone groups were 10% (4% to 19%) and 7% (2% to 16%), respectively (table 2), OR 1.5 (95% CI 0.4 to 6.1; p=0.8). We observed no significant difference in ORR between NIVO and ADX+NIVO according to PD-L1 status (online supplemental figure 3A,B). The disease control rate (CR+PR+ stable disease) was 30.6% (95% CI 20.2% to 42.5%) in the ADX+NIVO group and 23.6% (95% CI 14.4% to 35.1%) with NIVO alone.
Best overall response
The Kaplan-Meier estimate of median OS was 7.1 months (95% CI 4.8 to NR) in the ADX+NIVO arm compared with 5.9 months (95% CI 3.5 to 10.9 months) with NIVO alone, HR 1.24 (95% CI 0.49 to 1.26), p=0.23. Similarly, there was no improvement in PFS with the addition of ADX to NIVO (HR 1.33, 95% CI 0.94 to 1.88), p=0.10 (figure 1A,B). Subgroup analysis did not identify any subgroup that benefitted from ADX+NIVO compared with NIVO alone (online supplemental figure 3C,D).
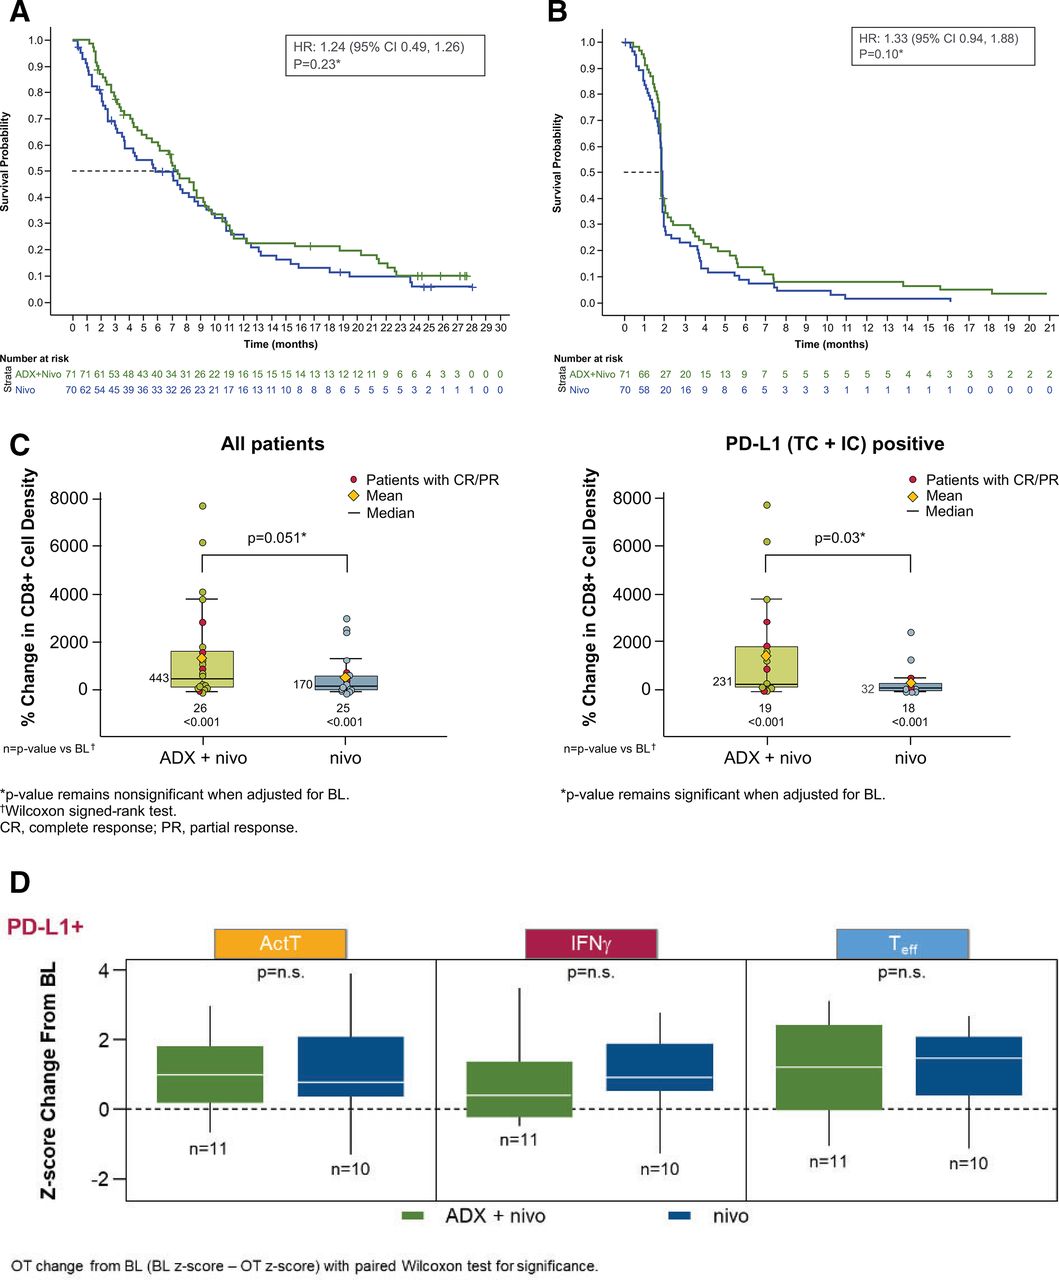
OS (A) and PFS (B) by treatment arm and change from baseline in CD8+ cell density (Wilcoxon signed-rank test) (C) and gene signature scores (D). (A)*Since the primary endpoint was not met, OS was not analyzed per protocol but for exploratory purposes. (B)*Since the primary endpoint was not met, PFS was not analyzed per protocol but for exploratory purposes. BL, baseline; CR, complete response; IFN, interferon; n.s., not significant; OS, overall survival; PD-L1, programmed death ligand 1; PFS, progression-free survival; PR, partial response; TC+IC, tumor and associated immune cell-positive.
Safety
Overall and treatment-related AEs were comparable in patients receiving ADX+NIVO and NIVO alone (table 3). The most common AEs were fatigue (~20% G2 or higher in each arm), decreased appetite (18.3% G2 or higher ADX+NIVO, 14.3% NIVO), nausea (19.7%, 14.3%), and vomiting (18.4%, 7.2%). Grade ≥3 AEs occurred in 66% of patients overall; the most common were anemia and abdominal pain (table 3). Serious AEs occurred in 59% and 54% of patients in the ADX+NIVO and NIVO-alone groups, respectively, and most were infrequent and similar between the two groups.
Adverse events
Effect of treatment on CD8+ cell density
In a preclinical model, inhibition of MMP9 and PD-L1 resulted in increased T-cell infiltrate in tumors (tumor-infiltrating lymphocytes (TILs)) relative to either treatment alone.27 CD8+ TILs were evaluated by IHC in baseline tumor tissue and on-treatment biopsies for the 51 patients with paired tissue. In both treatment groups, there was a significant increase in intratumoral CD8+ cell density compared with baseline (figure 1C) that was numerically greater in the ADX+NIVO arm versus NIVO-alone (443% vs 170%; p=0.051). In the smaller subset of 37 PD-L1 (TC+IC)–positive tumors, treatment with ADX+NIVO was associated with a greater increase in CD8+ cell density versus NIVO alone (231% vs 32%; p=0.03). RNA sequencing data was available for 21 paired PD-L1 (TC+IC)-positive tumors. IFN-ɣ, Teff, and activated T-cell gene signatures were relatively increased from baseline in each arm; only IFN-ɣ (p=0.037) and activated T-cell (p=0.037) signatures in the ADX+NIVO arm were significantly increased on-treatment. However, no significant difference was observed between arms for each on-treatment change (figure 1D).
Taken together, these data demonstrate that anti-PD-1 antibody immunotherapy in gastric cancer is associated with increased CD8+ TILs and an upregulation of gene signatures related to T-cell inflammation. Although we observed a greater increase in CD8+ cells with the addition of ADX, supportive of the preclinical model,27 this was not accompanied by increased gene signatures of T-cell inflammation and was not associated with an improvement in the NIVO antitumor activity.
Exploratory biomarkers (pooled analysis)
Given the lack of efficacy of the addition of ADX to NIVO, we pooled the two cohorts to strengthen the power to identify biomarkers associated with improved efficacy of checkpoint inhibition. The median OS in the pooled treated population was 7.10 months, and median PFS was 1.8 months (figure 2A,B). Compared with PD-L1-negative patients, PD-L1-positive patients had prolonged median OS (TC+IC: 8.1 months vs 4.5 months; TC: 10.1 months vs 6.9 months) and no difference in median PFS (TC+IC: 1.9 months vs 1.8 months; TC: 1.8 months vs 1.9 months). Age-adjusted and sex-adjusted Cox models showed that OS (TC+IC HR: 0.77 95% CI (0.51 to 1.17), p=0.217; TC HR: 0.71 95% CI (0.44 to 1.16), p=0.175) and PFS (TC+IC HR: 0.77 95% CI (0.52 to 1.15) p=0.205; TC HR: 0.75 95% CI (0.48 to 1.19) p=0.219) were not significantly different between PD-L1-positive and PD-L1-negative patients. As expected, the response rate was higher in both PD-L1-positive subsets relative to PD-L1-negative (figure 2C,D; online supplemental figure 4).32 Other biomarkers were explored in the pooled dataset, including baseline demographics, CD8+ TILs, % change in CD8+ TILs, inflammation gene signatures, and IC signatures for association with response to treatment, PFS, or OS. Data for a portion of these related to OS are shown in figure 2E; online supplemental figure 4. We observed poor survival with anti-PD-1 antibody therapy in patients with two or more prior lines of therapy and high baseline tumor-infiltrated TH17 T-helper cells.

OS (A) and PFS (B) of total treated population, overall survival in all treated patients with PD-L1 (TC+IC)-positive tumors (C) and PD-L1 (TC-only)-positive tumors (D), OS analyses in select subgroups (E). Gray shading denotes probability of survival between upper and lower 95% CI. ADX, andecaliximab; IFN, interferon; OS, overall survival; PBO, placebo; PD-L1, programmed death ligand 1; PFS, progression-free survival; TC+IC, tumor and associated immune cell-positive.
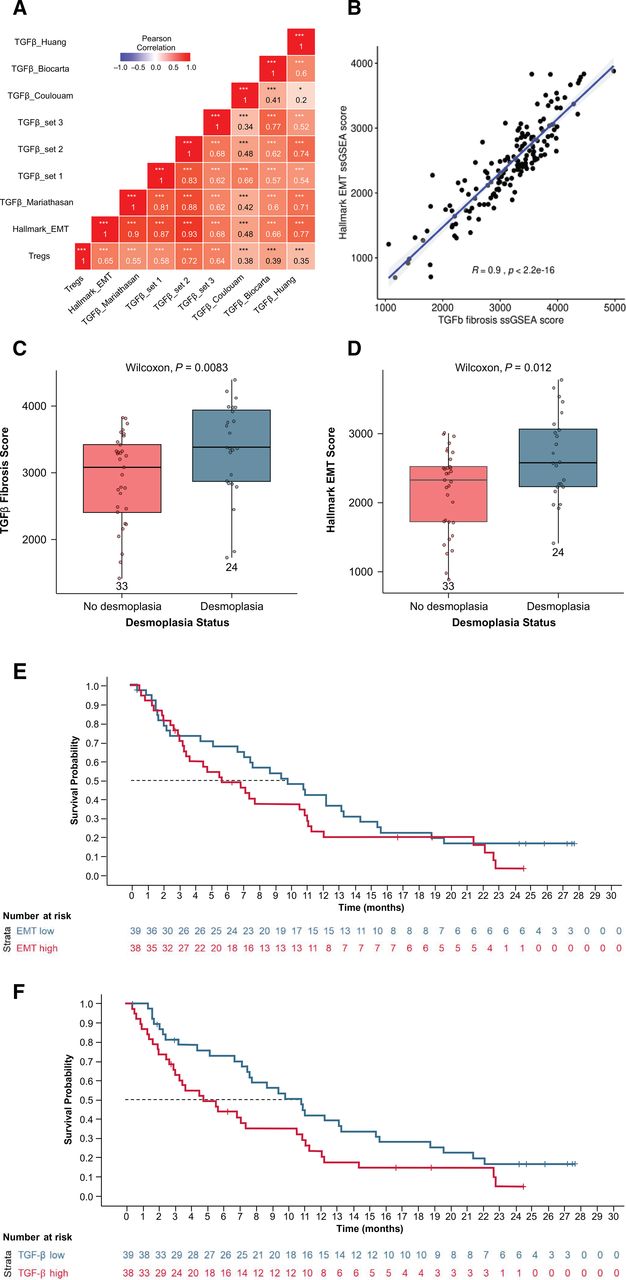
To identify other tissue-based biomarker pathways significantly associated with survival, GSEA was performed comparing long-term (>1 year; ~25% of patients) and short-term (≤1 year) survivors. Survival less than 1 year was associated with epithelial-to-mesenchymal transition (EMT), angiogenesis, hypoxia, cell motility factors, immune signaling, proliferative signaling, and complement pathways. Survival longer than 1 year was associated with transcription, translation, replication, and DNA repair pathways (false discovery rate <0.05; online supplemental table 2). The gene signature with the strongest correlation with shorter survival was the EMT gene signature. Because TGF-β can promote EMT in tumor epithelium,53 the EMT gene signature was tested for correlation with several TGF-β gene signatures. The EMT gene signature was significantly correlated (r=0.9; p<0.0001) with the fibrotic TGF-β gene signature (online supplemental figure 4). To evaluate fibrosis, baseline tumor tissues were assessed for desmoplasia by a pathologist. Both the fibrotic TGF-β and EMT gene signatures were significantly elevated in desmoplastic tumors (Wilcoxon p=0.0083 and 0.012, respectively; figure 3A,B). Although the EMT hallmark gene signature was not associated with OS based on Cox modeling (p=0.19) (figure 3C), the high TGF-β fibrosis gene signature was negatively associated with OS (p=0.036) (figure 3F) and PFS (online supplemental figure 5).

Associations between hallmark EMT ssGSEA score and TGF-β gene signatures in all archival tumors with gene expression (n=80) (A), and between TGF-β fibrosis gene signature scores and Hallmark EMT ssGSEA score (B). Correlation between desmoplasia and TGF-β (C), between desmoplasia and EMT (D). OS for EMT ssGSEA score high versus low (median cut) patients (E), and OS for TGF-β ssGSEA score high versus low (median cut) patients (F). (A)* In all archival tumors with gene expression data (n=80). EMT, epithelial-to-mesenchymal transition; OS, overall survival; ssGSEA, single-sample gene set enrichment analysis; TGF, transforming growth factor.
Differential gene expression analysis identified only two genes that were significant (with false discovery rate of <0.1), comparing patients surviving ≥1 year versus <1 year; these were GRB7 and ZNF248 (figure 4A). GRB7 is part of the ERBB2 amplicon, and expressions of the other genes in the amplicon were highly correlated (online supplemental figure 6). Of the 141 patients treated in the study, HER2 status was available in baseline medical records for 132; 43 were HER2-positive and 89 were HER2-negative. GRB7 and ERBB2 expression were elevated in HER2-positive patients (figure 4B,C),54 55 and both HER2 status and ERBB2 mRNA expression were associated with significantly longer OS (p=0.0077) (figure 4D, online supplemental figure 7A). In support, high expression of genes in the ERBB2 amplicon, (GRB7, PGAP3, and MIEN1) was also associated with longer OS (p=0.0018, 0.019, and 0.061, respectively) (online supplemental figure 7C–E).
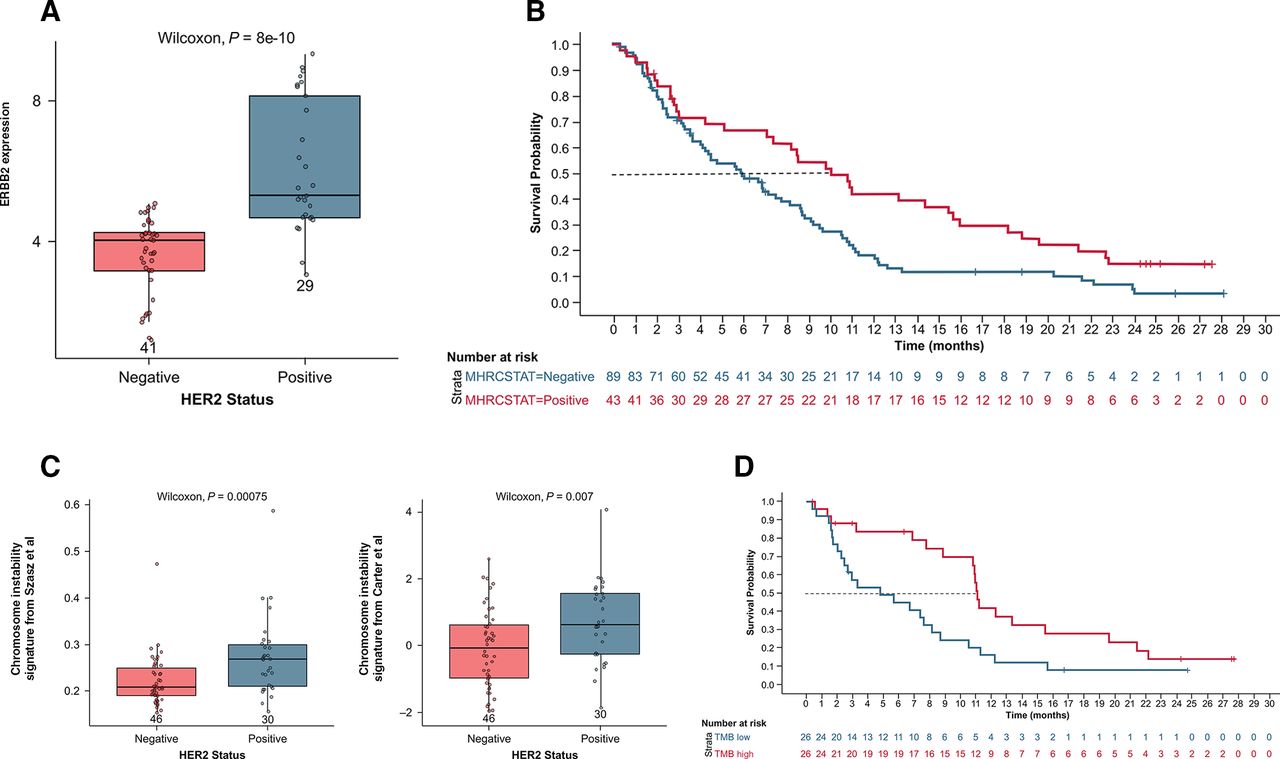
Plot analysis of gene signatures associated with survival in ERBB2 expression according to documented HER2 status (A), OS by HER2 status (B), chromosome instability signature (almac) according to HER2 status (C)57 58, and OS by TMB high versus low (median cut) (D). HER2, human epidermal growth factor receptor 2; OS, overall survival; TMB, tumor mutation burden.
The majority (93%, n=43) of HER2-positive patients had been previously treated with trastuzumab, as were 3 HER2-negative patients. None of those with unknown (unk) HER2 status were treated with trastuzumab, and no other HER2-targeted therapies were recorded for any patients. There was no significant association between prior response (PR vs SD+PD+unk; p=0.4) or best response (PR vs SD+PD+unk; p=0.4) to trastuzumab and 1-year survival in this study. Patients who had previously been treated with trastuzumab had longer median survival (8.7 months) compared with trastuzumab-naive patients (6.0 months, HR=0.7; p=0.04; online supplemental figures 4,8). Tumors with a higher degree of genetic instability respond better to immunotherapy.56 To assess potential relationships between HER2 status and genetic stability, 9 signatures curated from literature48 56–62 were evaluated, encompassing chromosome instability, homologous recombination, and BRCA-ness, among others. HER2-positive patient tumors had significantly higher CIN4 and CIN25 chromosome instability signatures (figure 4E).
Association of HER2 positivity with CIN is consistent with the earlier observation that longer survival is associated with DNA replication and repair. However, CIN has not been previously demonstrated to predict better survival with immunotherapy.63 64 Therefore, other measures of genomic instability, dMMR, and TMB were considered. Two dMMR patients were treated in this study; one responded, and both survived longer than 1 year. Neither was HER2-positive. Tumor TMB was evaluable for a limited set of 52 patients with sufficient tissue. The median TMB was 2.01 mutations per megabase (muts/Mb). Patients with TMB at median or higher in the whole-exome sequencing subset had median OS and PFS rates of 11.1 months (HR 0.40 (95% CI 0.20 to 0.79), p<0.01) and 1.9 months (HR 0.43 (95% CI 0.22 to 0.83), p=0.013) (figure 4F, online supplemental figure 9), respectively, which were significantly longer compared with patients who had TMB less than the median (4.8 and 1.8 months; p=0.0025 and p=0.016, respectively). The highest TMB score observed in this patient population was in a patient with dMMR.
The pairwise association between the survival biomarkers identified in this study (TGF-β fibrosis, TMB, and HER2) was evaluated. The TGF-β fibrosis signature (figure 5A) was not different in HER2-positive versus HER2-negative patients. Additionally, TMB (figure 5B) was slightly higher in HER2-positive patients, although this trend did not reach statistical significance (p=0.053). Evaluating the multivariate effect of these biomarkers on OS, TMB was directionally consistent but not powered to detect a survival benefit when adjusted for TGF-β and HER2 together (figure 5D). There was no significant correlation between ERBB2 gene expression (a continuous variable proxy of HER2 positivity) and TGF-β fibrosis score (figure 5C).

Association between documented HER2 status and TGF-β fibrosis signature according to HER2 status (A), TMB according to HER2 status (B), correlation between ERBB2 gene expression and TGF-β fibrosis ssGSEA score (C), and a Cox model of OS incorporating TMB, TGF-β fibrosis, and HER2 (D). (C)*All HRs refer to biomarker level above median versus below median. HER2, human epidermal growth factor receptor 2; OS, overall survival; ssGSEA, single-sample gene set enrichment analysis; TGF, transforming growth factor; TMB, tumor mutation burden.
Discussion
MMP9 promotes tumorigenesis via multiple mechanisms, including modulation of growth factors and cytokines, and extracellular remodeling.6 17–24 27 It is frequently dysregulated in various cancer types, including gastric cancer, making it a potential target for therapeutic intervention.8–14 ADX is a novel, highly selective antibody inhibitor of MMP9 that has shown encouraging antitumor activity in small, early-stage clinical trials in patients with gastric/gastroesophageal carcinoma.5 15 Based on preclinical evidence suggesting that the combination of ADX with an ICI may result in a promising antitumor response, this phase 2 study was undertaken to evaluate the efficacy, safety, and predictive biomarker analysis of ADX+NIVO compared with NIVO monotherapy in patients with gastric cancer.
Although the addition of ADX to NIVO had a favorable safety and tolerability profile, it did not improve ORR, PFS, or OS compared with NIVO alone in an unselected patient population. Previous reports have shown that PD-L1-positive patients (TC ≥1) treated with NIVO trended toward a prolonged median OS and PFS.29 In the current study, PD-L1-positive patients also trended toward a prolonged median OS (TC+IC, or TC; figure 2C,D; online supplemental figure 4). These studies, however, were not powered to test PD-L1 positivity based on TC ≥1. Of note, the ORR in the NIVO monotherapy arm in this study was lower relative to historical control.29
Based on preclinical data,27 the hypothesis that ADX would increase T-cell infiltrate when combined with NIVO was tested. CD8+ T cells increased in on-treatment biopsies for patients treated with NIVO monotherapy, and the addition of ADX only marginally impacted this. In the PD-L1-positive subset, CD8+ T cell density increased significantly greater in the ADX+NIVO arm versus NIVO alone; however, the number of patients in the PD-L1-positive subset of patients with paired tissue was small, driven by a few patients with a greater response, and therefore, the data may not provide a reliable measure. The nature and character of the infiltrating CD8+ T cells has been critical to understanding immune-mediated anticancer therapy. CD8+ TILs have been previously associated with improved survival in patients with resected gastric cancer,65 but the dynamic nature of CD8+ TILs in gastric cancer in response to checkpoint inhibition has not been demonstrated thus far. One explanation for why the increase in CD8+ TILs was not associated with improved response to checkpoint inhibition is the increase in TGF-β and regulatory T-cell signaling that was also observed. Notably, in the combined analysis, baseline CD8+ TILs, gene signatures of IFN-ɣ, Teff, and activated CD8+ T cell TILs did not predict response or survival to checkpoint inhibition; however, the current study was not powered to detect these effects.
Our analysis builds on the observation in ATTRACTION 266 that prior trastuzumab was positively associated with survival by demonstrating that HER2-positivity and ERBB2 expression (figure 4D; online supplemental figures 4C,7A) were associated with significantly longer survival. The majority of patients with HER2-positive disease were treated with trastuzumab. There was no relationship between prior response or best response to trastuzumab with benefit from NIVO, and one-third of patients who did not receive trastuzumab benefitted from NIVO. Our analysis cannot distinguish whether response to ICI was driven by HER2 or prior trastuzumab treatment. Ultimately, most HER2-positive patients who benefitted from NIVO died due to their disease. This would be expected for an antitumor response specific to HER2 expression, based on intratumoral heterogeneity of HER2 overexpression in gastric cancer.67 The development of novel treatments targeting HER2 and including immunotherapy have shown preliminary promising activity.68–70 Our data support this ongoing development and suggest that HER2-positive tumors may be uniquely primed for an antitumor immune response. While PD-L1 status is a significant predictive biomarker of anti-PD-1/anti-PD-L1 therapeutic benefit for HER2-negative tumors, whether this holds true for HER2-positive tumors in the setting of concurrent anti-HER2 and anti-PD-1 therapy remains to be seen. The results of the ongoing Keynote MK-811 trial comparing trastuzumab plus chemo plus placebo versus trastuzumab plus chemo plus pembrolizumab in first-line could provide additional results to confirm our observation.70
The TGF-β signaling pathway regulates cell proliferation, differentiation, apoptosis, interaction with the microenvironment, and immune reactivity.71 72 It is also a key inducer and regulator of EMT, an essential process for cancer progression and metastatic spread.53 73 TGF-β expression is an independent predictor of outcomes in urothelial cancer,74 but this association had not been demonstrated thus far in gastric cancer. Our study demonstrated that a high TGF-β fibrosis gene signature is negatively associated with survival in gastric cancer. To further understand TGF-β fibrosis, the tissues were scored for presence/absence of desmoplasia. Desmoplasia was associated with higher TGF-β and EMT scores. There was no association between ERBB2 and TGF-β fibrosis signature (figure 5F), nor was there a difference between HER2-positive and HER2-negative patients with respect to TGF-β fibrosis score, indicating that longer survival in HER2-positive patients is not related to reduced fibrosis.
Higher somatic TMB has previously been associated with better survival for patients treated with ICI.75 In this study, median tumor TMB was low for gastric cancer relative to that reported for gastric cancer in the Cancer Genome Atlas data (National Cancer Institute),76 but it remained associated with survival. The patient with the highest TMB was 1 of 2 patients with dMMR. High TMB (TMB-H) (≥10 muts/Mb) solid tumors, as determined by an FDA-approved test, is now an approved indication for pembrolizumab in patients who have progressed following prior treatment and who have no satisfactory alternative treatment options.77 In a multivariable model incorporating TGF-β fibrosis, HER2, and TMB, only TMB remained significant, suggesting that TMB is the main driver of survival (figure 5D). It is important to note that the subset of patients with TMB data is roughly one-third of the treated population and may not be representative. Additionally, since this study has no comparator arm that lacked NIVO treatment, it is not possible to differentiate between whether the longer survival observed relates to the biology of TMB-H disease or to its response to checkpoint blockade.
Despite promising early data, ADX did not improve antitumor immune responses in combination with NIVO in patients with gastric cancer/GEJ cancer, and there was no consistent evidence of pharmacodynamic activity from the biomarkers evaluated. These results are consistent with those from GAMMA-1, a phase 3 study examining the addition of ADX to mFOLFOX6 for first-line treatment of metastatic gastric cancer, which did not meet its primary endpoint.16 Our data support evaluation of ICIs in HER2-positive advanced gastric cancer in a future, controlled clinical trial. The biomarker associations with critical process identified in this study warrant further investigation.
Data availability statement
Data are available on reasonable request.
Ethics statements
Patient consent for publication
Ethics approval
Institutional review boards at each of the study sites approved the protocols. All patients provided written informed consent. This study was conducted in accordance with the Declaration of Helsinki.
Acknowledgments
We extend our gratitude to the patients and their families. Writing and editorial support were provided by Impact Communication Partners, Inc.
References
Supplementary materials
Supplementary Data
This web only file has been produced by the BMJ Publishing Group from an electronic file supplied by the author(s) and has not been edited for content.
Footnotes
Twitter @mdmanishshah
Contributors DT and CBB contributed to the study concept. MAS, DCu, MZ, DT, and CBB designed the study. MAS, DCu, J-PM, EVC, ST, MZ, and CBB acquired the data. MAS, DCu, EE, EVC, K-WL, ST, JZ, JH, DT, PB, CBB, and DCa analyzed the data. MAS, DCu, J-PM, EVC, EE, K-WL, ST, DI, JL, SDP, JH, DT, PB, and CBB interpreted the data. All authors drafted the manuscript. All authors approved the content of the final version of manuscript. MAS is the guarantor of this study and accepts full responsibility for the work and/or the conduct of the study, had access to data, and controlled the decision to publish.
Funding This study was funded by Gilead Sciences, Inc.
Competing interests MAS has received institutional funding from Bristol Meyers Squibb, Oncolys Biopharma, and Merck, DCu has received grants from MedImmune, Clovis, Eli Lilly, 4SC, Bayer, Celgene, Leap, and Roche, and has participated in a scientific advisory board for OVIBIO. J-PM has received honoraria from Merck Sharp & Dohme. J-PM, reports honoraria from MSD, EVC reports grants from Amgen, Bayer, Boehringer Ingelheim, Bristol-Meyers Squibb, Celgene, Ipsen, Lily, Merck Sharp & Dohme, Merck KGaA, Novartis, Roche, and Servier, and has served as a consultant for Array, Astellas, AstraZeneca, Bayer, Beigene, Biocartis, Boehringer Ingelheim, Bristol-Myers Squibb, Celgene, Daiichi, Halozyme, GSK, Incyte, Ipsen, Lilly, Merck Sharp & Dohme, Merck KGaA, Novartis, Pierre Fabre, Roche, Servier, Sirtex, Taiho. ZW reports research support from BMS, Gilead Sciences, Novartis, Plexxikon, and has served as a consultant for AstraZeneca, Bayer, Daiichi, Five Prime, Gilead, Lily, Macrogenic, and Merck. MZ has nothing to disclose. DI has nothing to disclose. JL is an employee of Gilead Sciences, and owns stock in Gilead Sciences, and Roche. SDP is an employee of Gilead Sciences, Inc., and owns stock in Gilead Science, and Amgen. CBB, DT, EE, JH, JZ, K-WL, PB, ST are employees of and own stock in Gilead Sciences. DCa has received consulting fees from Genentech, Roche, Eli Lilly, Merck, Daiichi Sankyo, BMS, Ono Pharma USA, Five Prime, Seattle Genetics, Amgen, Taiho Pharmaceutical, Astellas Pharma, Gritstone Bio, Pieris Pharmaceutical, Zymeworks, Basilea Pharmaceutica, QED Group, Arcus Biosciences, Foundation Medicine, Pierian Biosciences, Silverback Therapeutics, Servier Pharmaceuticals, Blueprint Medicines, Tempus, Guardant Health, Archer Biosciences, and Natera, and has received honoraria from Genentech, Roche, Eli Lilly, Merck, Daiichi Sankyo, AstraZeneca, Tempus, and Guardant Health.
Provenance and peer review Not commissioned; externally peer reviewed.
Supplemental material This content has been supplied by the author(s). It has not been vetted by BMJ Publishing Group Limited (BMJ) and may not have been peer-reviewed. Any opinions or recommendations discussed are solely those of the author(s) and are not endorsed by BMJ. BMJ disclaims all liability and responsibility arising from any reliance placed on the content. Where the content includes any translated material, BMJ does not warrant the accuracy and reliability of the translations (including but not limited to local regulations, clinical guidelines, terminology, drug names and drug dosages), and is not responsible for any error and/or omissions arising from translation and adaptation or otherwise.