Article Text

Abstract
Background Programmed death (ligand) 1 (PD-(L)1) blockade and OX40/4-1BB costimulation have been separately evaluated in the clinic to elicit potent antitumor T cell responses. The precise mechanisms underlying single agent activity are incompletely understood. It also remains unclear if combining individual therapies leads to synergism, elicits novel immune mechanisms, or invokes additive effects.
Methods We performed high-dimensional flow cytometry and single-cell RNA sequencing-based immunoprofiling of murine tumor-infiltrating lymphocytes (TILs) isolated from hosts bearing B16 or MC38 syngeneic tumors. This baseline infiltrate was compared to TILs after treatment with either anti-PD-(L)1, anti-OX40, or anti-4-1BB as single agents or as double and triple combinatorial therapies. Fingolimod treatment and CXCR3 blockade were used to evaluate the contribution of intratumoral versus peripheral CD8+ T cells to therapeutic efficacy.
Results We identified CD8+ T cell subtypes with distinct functional and migratory signatures highly predictive of tumor rejection upon treatment with single agent versus combination therapies. Rather than reinvigorating terminally exhausted CD8+ T cells, OX40/4-1BB agonism expanded a stem-like PD-1loKLRG-1+Ki-67+CD8+ T cell subpopulation, which PD-(L)1 blockade alone did not. However, PD-(L)1 blockade synergized with OX40/4-1BB costimulation by dramatically enhancing stem-like TIL presence via a CXCR3-dependent mechanism.
Conclusions Our findings provide new mechanistic insights into the interplay between components of combinatorial immunotherapy, where agonism of select costimulatory pathways seeds a pool of stem-like CD8+ T cells more responsive to immune checkpoint blockade (ICB).
- CD8-positive T-lymphocytes
- adaptive immunity
- costimulatory and inhibitory T-cell receptors
- gene expression profiling
- lymphocytes
- tumor-infiltrating
Data availability statement
Data are available in a public, open access repository. All data presented in the study are included as part of the manuscript or uploaded as supplementary information. Sequencing data are deposited in NCBI Gene Expression Omnibus with the primary accession code GSE181152.
This is an open access article distributed in accordance with the Creative Commons Attribution Non Commercial (CC BY-NC 4.0) license, which permits others to distribute, remix, adapt, build upon this work non-commercially, and license their derivative works on different terms, provided the original work is properly cited, appropriate credit is given, any changes made indicated, and the use is non-commercial. See http://creativecommons.org/licenses/by-nc/4.0/.
Statistics from Altmetric.com
- CD8-positive T-lymphocytes
- adaptive immunity
- costimulatory and inhibitory T-cell receptors
- gene expression profiling
- lymphocytes
- tumor-infiltrating
Background
Antigen-specific CD8+ T cell receptor (TCR) ligation is well known to be directly regulated by coinhibitory receptors, including but not limited to programmed death 1 (PD-1).1 2 Induction of the inhibitory signal downstream of PD-1 is directly mediated by Src homology region 2 domain-containing phosphatase-2 dephosphorylation of TCR signaling proteins.3 The TCR signal is also complemented by costimulatory signals critical in amplifying downstream signaling pathways, fine-tuning T cell differentiation, and shaping the specificity of the response.3 Members of the tumor necrosis factor receptor superfamily (TNFRSF) are a subset of these costimulatory molecules required to generate productive CD8+ T cell responses.4 OX40 (Tnfrsf4, CD134) and 4-1BB (Tnfrsf9, CD137) are two such family members, which are transiently induced on the surface of T cells upon TCR stimulation and play a critical role in T cell expansion, survival, acquisition of effector functions, and memory formation.5–8
The therapeutic options available in treating cancer have dramatically increased coincident with the development of immunotherapy. Among the first immunotherapies, ICB of PD-1 (and its ligand PD-L1) was aimed to increase T cell function.9 10 In contrast, agonism of OX40 and 4-1BB has also been explored as an attractive antitumor immunotherapeutic strategy due to the capacity of these molecules to elicit more potent T cell responses.11–13 Numerous preclinical studies comparing the efficacy of anti-OX40 and anti-4-1BB agonists alone or combined with an anti-PD-(L)1 antagonist have suggested synergism between the treatment components.14–17 This synergism resulted in CD8+ T cell responses of larger magnitude and durability, ultimately translating to an increased survival benefit.14–18 Thus, these studies have prompted further evaluation of ICB and costimulation in clinical trials either as single, dual, or triple agents in different therapeutic combinations.
It remains unclear how modulation of PD-(L)1 and costimulatory receptors in the context of antitumor immunity impacts the differentiation and heterogeneity of the CD8+ T cell pool within the tumor microenvironment (TME). Even though blockade of PD-(L)1 directly amplifies the TCR signal and expands a subpopulation of polyfunctional stem-like CD8+ T cells, the actual mechanism of action is poorly understood.19 20 Moreover, it is unclear how OX40/4-1BB agonism mechanistically intersects with the formation, expansion, and trafficking of these cells in the tumor.
Here, using murine melanoma and colorectal tumors, we dissect the mechanisms that control how coinhibitory and costimulatory signals reshape the differentiation, heterogeneity, and functionality of CD8+ T cells in the TME using triple combination therapy based on costimulatory agonists (anti-OX40 and anti-4-1BB) and ICB (anti-PD-1 or anti-PD-L1). High-dimensional gene expression profiling revealed that OX40/4-1BB agonism initially expands a population of PD-1loKLRG-1+Ki-67+ stem-like CD8+ T cells associated with antitumor efficacy. While PD-(L)1 blockade did not elicit a combinatorial effect with anti-OX40 or anti-4-1BB monotherapy, synergistic interaction was observed between ICB and dual OX40/4-1BB treatment. The intratumoral accumulation of CD8+ TILs induced by this therapeutic regimen was linked to trafficking from the periphery via the CXCR3 axis. This study provides new mechanistic insights into the combinatorial efficacy of OX40/4-1BB costimulatory receptor agonism and PD-(L)1 checkpoint blockade.
Materials and methods
Experimental animal models
Female C57BL/6 mice (7–8 weeks old) were purchased from the Jackson Laboratory (Bar Harbor, Maine) and housed in a pathogen-free vivarium facility at Pfizer Animal Care Unit (Pfizer, San Diego, California). Mice were housed (5 mice/cage) in individually ventilated, temperature-controlled polycarbonate cages and provided certified rodent diet (PicoLab Rodent Diet 5053, Lab Supply, Northlake, Texas) and H2O ad libitum.
MC38 and B16-F10 tumor cells lines were obtained from American Type Culture Collection (Manassas, Virginia). B16-F10 was expanded and cultured in DMEM (Gibco #11 875–085, Thermo Scientific, Rochester, New York) and MC38 in RPMI 1640 (Gibco #11 995–065), each supplemented with HyClone Laboratories 10% fetal bovine serum (Cytiva #SH30080.03, Logan, Utah), 1×penicillin/streptomycin (Corning #30–002 Cl, Corning, New York), and 1×L-glutamine (Corning #25–005 Cl) at 37°C in a humidified incubator (5% CO2).
Mice were inoculated subcutaneously in the hind flank with 5×10⁵ tumor cells suspended in 1×PBS. At 10 days post-inoculation, mice harboring ~50–70 mm3 tumors were randomized and segregated into treatment groups (10 mice/group). At days 10, 13, and 16 (or 11, 14, and 17/18 depending on tumor growth kinetics), mice received intraperitoneal (i.p.) injections of isotype control or specific treatment antibodies generated in-house including anti-4-1BB (9371), anti-OX40 (OX86), anti-PD-1 (F2), and/or anti-PD-L1. All antibody treatments were optimized, tested in-house for each experimental tumor model, and denoted in figure legends. Tumors were measured two times a week, and animals were euthanized when tumor volumes reached 2250 mm3.
Depletion of CD4+ T cells, CD8+ T cells, and natural killer (NK) cells and blocking of CXCR3 was performed by i.p. injection of three doses of 200 µg anti-CD4 (GK1.5), anti-CD8 (2.43), anti-NK1.1 (PK136), and anti-CXCR3 (CXCR3-173) antibody (BioXCell, West Lebanon, New Hampshire). For blockade of lymph node (LN) egress, 2.5 mg/kg Fingolimod (FTY720) (Sigma-Aldrich, St. Louis, Missouri) was delivered orally every 3 days. Each dose was administered 1 day (blockade/depletion antibodies) or 3–4 days (FTY720) before the appropriate therapeutic antibody treatment.
Tissue dissociation
Tumor, spleen, and tumor-draining lymph nodes (tdLNs) were harvested in cell culture medium and cut into small pieces. Tumors were further mechanically dissociated with the mouse Tumor Dissociation kit under the tough tumor protocol (Miltenyi Biotec, Auburn, California). All cell suspensions were filtered through 70 µm cell strainers (Fisher Scientific, Pittsburgh, Pennsylvania) and resuspended in 1×PBS for further processing. Viable mononuclear cells were quantified via Trypan Blue exclusion on a Vi-CELL XR cell viability analyzer (Beckman Coulter, Indianapolis, Indiana).
Flow cytometry staining and analysis
2×10⁶ cells were processed in cell suspensions and incubated for 15 min at room temperature in FACS buffer (1×PBS containing 2% fetal bovine serum and 0.1% NaN3) with Live/Dead Fixable Blue (Thermo Scientific L32105, Rochester, New York) in the presence of purified anti-mouse CD16/CD32 antibodies (BioLegend #101302, San Diego, California). Subsequently, cells were stained with fluorescently labeled antibodies specific for surface markers for 20 min at 4°C in FACS buffer. Anti-mouse antibodies used for staining of surface markers included: anti-CD45 (30-F11), anti-CD4 (GK1.5), anti-CD8 (53–6.7), anti-PD-1 (RMP1-30), anti-KLRG-1 (2F1), anti-CD90.2 (53–2.1), anti-CD44 (IM7), anti-ICOS (C398.4A), and anti-CD43 (1B11). Following staining of surface antigens, cells were incubated for 30 min at room temperature in the presence of fix/perm buffer (eBioscience #00-5223-56 and #00-5223-56, San Diego, California) and washed with permeabilization buffer (eBioscience, #00-8333-56). Antibodies used for intracellular and intranuclear staining were resuspended in permeabilization buffer and incubated with cells for 30 min at room temperature. Anti-mouse antibodies used for staining of intracellular and intranuclear markers included: anti-EOMES (Dan11mag), anti-FoxP3 (FJK-16s), and anti-Ki-67 (B56). Samples were washed in permeabilization buffer and resuspended in FACS buffer. Flow cytometry data were acquired using the BD LSRII (BD Immunocytometry Systems, San Jose, California) and analyzed using FlowJo V.10 software (Tree Star Ashland, Oregon). vi-SNE analyses were performed on Cytobank (https://cytobank.org).
RNA-sequencing of FACS-sorted CD8+ TILs
Unfixed/live PD-1lo/hiKLRG-1lo/hiCD8+ TILs were FACS-sorted into 350 µL RLT lysis buffer (Qiagen #79216, Valencia, California) using BD FACSAria ll cell sorters (BD Immunocytometry Systems) and stored at −80°C. RNA extraction was performed using the AllPrep DNA/RNA Mini kit (Qiagen, #80284). Sample quality and quantity were assessed using a 2100 Bioanalyzer and Agilent RNA 6000 Pico kit (Agilent Technologies, Santa Clara, California). The SMART-Seq V.4 Ultra-low input RNA kit (Takara #634890, Kusatsu, Shiga, Japan) was used to generate full length complementary DNA (cDNA) according to the manufacturer’s recommendation. Fragmentation was performed with 150 pg cDNA using the Nextera XT DNA Library Prep kit (Illumina #FC-131–1024, San Diego, California). Libraries were purified using Ampure XP beads (Beckman Coulter), validated in the 2100 Bioanalyzer using the Agilent High Sensitivity DNA chip, pooled, and sequenced on the Illumina NextSeq 2000 system (2×75 bp reads).
Sequencing alignment and gene expression quantification was performed using OmicSoft Array Suite software (Qiagen). Differential gene expression analysis was performed using DESeq2 (V.1.26.0), with differentially expressed (DE) genes defined as those with adjusted p value <0.2. Principal component analysis (PCA) plots were generated using the 500 most highly variable genes. Gene set enrichment analysis was performed on DE genes using topGO (V.2.34.0) and Gene Ontology Biological Process terms. For the comparison among the four sorted cell types in the triple combinatorial therapy (TCT) group, WGCNA (V.1.64.1) was used to identify co-expression modules that were assessed for function using topGO. Log2 transformed gene expression estimates (tag count per million, TPM) were used for generation of heatmaps. Here, TPM counts of selected genes were normalized by taking the mean expression level within each group and calculating z-scores across the compared groups.
scRNA-Seq of FACS-sorted intratumoral CD45+ leukocytes
CD45+ FACS-sorted, unfixed/live cells were obtained using BD FACSAria ll cell sorters (BD Immunocytometry Systems). Approximately 10×103–15×103 viable cells were loaded onto a Chromium Single Cell A chip (10×Genomics, Pleasanton, California) to aim for a target cell recovery of 5×10³–10×103 cells. Library construction was performed using 50 ng cDNA following the Chromium Single Cell 50 Library and Gel Bead kit protocol (10×Genomics). Libraries were sequenced using the NovoSeq 6000 platform (Illumina).
Raw data were processed using Cell Ranger software (V.2.1.1) for alignment to the UCSC mm10 reference genome, barcodes, and unique molecular identifier (UMI) counts. Feature-barcode count matrix was obtained for each sample for downstream analysis. The Seurat (V.2.3.3) pipeline was applied to the data set. Genes expressed in <3 cells and cells expressing <500 and >5000 genes were excluded. Cells with >5% of UMI originated from mitochondrial genes were further removed. The data were normalized and scaled using the default parameters in Seurat. For each sample, the top 2000 variable genes were selected by the FindVariableGenes function for subsequent analysis. Canonical Correlation Analysis (CCA)21 was then performed to integrate cells across different samples using the top 20 CCA components. For clustering, the FindClusters function on the aligned CCA space was used. To obtain marker genes for each cluster, the FindAllMarkers function was used, requiring genes expressed in more than 25% of the cells and with at least 0.25-fold difference. The ImmGen database was used to determine the cell types for each cluster.
RNA velocity was determined to predict cell fates and recapitulate the dynamics of CD8+ TILs as described previously.22 Genes were filtered by default parameters, and only genes that met the minimum max-cluster average in both exon and intron expressions were retained for further analysis. Velocity estimates were calculated using relative gamma fit with the top/bottom 5% cells based on spliced expression magnitude. Results were visualized on the existing single-cell RNA sequencing (scRNA-Seq) t-distributed stochastic neighbor embedding (t-SNE) to be consistent with the analysis results in the Seurat pipeline.
Immunohistochemistry and digital image analysis
Immunohistochemistry (IHC) assays were developed and optimized using standard protocols23 for 4 µm thick formalin-fixed paraffin-embedded (FFPE) sections and were run on a Leica Bond autostainer (Leica Microsystems, Wetzlar, Germany). Primary anti-mouse antibodies used in stains included anti-CD3 (145–2 C11) and anti-CD8 (53–6.7). Whole slides were scanned on a Leica Aperio AT2 scanner using a 20×/0.75 NA Plan Apo objective lens (Leica Microsystems). Digital image analysis was performed using Visiopharm software (Visiopharm, Hoersholm, Denmark). Tumor regions were annotated by executing a tissue find application that automatically detects viable tumor tissue in the images and excludes regions of necrosis and fibrosis as well as components of normal host tissue. A separate cell detection algorithm was used to detect cells positive for a given biomarker, and the cell density was then calculated as the ratio of the cell count to viable tumor area.
Statistical analyses
Statistical differences between two treatment groups were assessed using an unpaired two-tailed Student’s t-test. Statistical differences between more than two treatment groups were assessed using one-way analysis of variance with Tukey’s multiple comparison post hoc test. All statistical analyses were performed using Prism (V.9.0.0) software (GraphPad Software La Jolla, California).
Results
CD8+ TILs have an exhausted phenotype in the absence of immunotherapy
To define the composition of tumor immune infiltrates at steady-state, we generated immune profiles of untreated murine B16-F10 (B16) melanoma (classified as a ‘cold tumor’ refractory to ICB) and MC38 colorectal tumors (considered partially responsive to ICB). Tumors were resected 21 days post-implantation, and FACS-purified CD45+ leukocytes were processed for scRNA-Seq. 5675 CD45+ cells from MC38 tumors and 10 196 CD45+ cells from B16 tumors were subsequently analyzed. Unsupervised clustering partitioned immune cells into 15 and 25 distinct clusters in MC38 and B16 tumor samples based on their transcriptomes, respectively, (online supplemental figure 1A). The clusters exhibited a similar expression pattern of key lineage-defining molecules across tumor types (online supplemental figure 1B,C). While both immune landscapes were dominated by significant populations of myeloid cells denoted by Csf1r expression (>80% of the total immune infiltrate), the TIL compartments were vastly under-represented (online supplemental figure 1A–C). TILs were segregated into two CD8+ T cell clusters (clusters 7 and 8 representing ~5% of the total immune infiltrate) and a single Foxp3-expressing CD4+ T cell cluster (cluster 5) within MC38 tumors (online supplemental figure 1A,B,D). B16 TILs were comprised of eight CD8+ T cell clusters (clusters 5, 6, 7, 9, 10, 11, 13, and 14 representing ~12% of the total immune infiltrate) and a single Foxp3-expressing CD4+ T cell cluster (cluster 12) (online supplemental figure 1A,C,E).
Supplemental material
CD8+ TILs in both tumors featured a transcriptional profile consistent with functional exhaustion, exhibiting co-expression of inhibitory molecules including Pdcd1 (PD-1), Lag3 (Lag-3), Havcr2 (Tim-3), and Cd224 (2B4) coupled with a lack of Il2 (interleukin (IL)-2) and Tnf (TNF) transcripts (online supplemental figure 1F,G,I,J). Notably, CD8+ TILs exhibited high expression of Tox (TOX) and lacked Tcf7 (TCF-1), two key transcriptional features of terminal exhaustion.24 25 In addition to exhaustion-related genes, we assessed the expression of costimulatory molecules on TILs. A substantial proportion of CD8+ and CD4+ T cells in both tumors expressed several TNFRSF members (Tnfrsf4 (OX40), Tnfrsf9 (4-1BB), Tnfrsf14 (HVEM), and Tnfrsf18 (GITR)) and immunoglobulin superfamily members (Cd28 (CD28), Cd278 (ICOS), Cd266 (CD266), and Crtam (CRTAM)) (online supplemental figure 1H,K). Both tumor models thus shared a common immune landscape featuring the presence of exhausted CD8+ TILs. These cells notably coexpressed several costimulatory molecules, raising the possibility of optimizing their reinvigoration via a combination of ICB and costimulation.
Triple combinatorial therapy exhibits superior CD8+ T cell-mediated antitumor efficacy
To address how ICB (anti-PD-1 or anti-PD-L1) and costimulatory agents (anti-OX-40 and anti-4-1BB) functionally intersect as components of a combinatorial therapy, we analyzed the therapeutic efficacies of single agents and various combinations. MC38-bearing mice were treated with anti-OX40, anti-4-1BB, and anti-PD-L1 as single agents, as a dual combinatorial therapy (DCT), or as a triple combinatorial therapy (TCT) on days 10, 13, and 16 post-tumor cell inoculation (figure 1A). Only modest antitumor efficacy was observed in subgroups of animals after single agent treatments and DCT. In sharp contrast, TCT induced superior tumor growth inhibition (TGI) in all treated animals compared with controls and other treatments (figure 1A,B). Furthermore, similar efficacy was achieved with an anti-OX40, anti-4-1BB, and anti-PD-1 TCT in the highly refractory B16 melanoma model (online supplemental figure 2A). Thus, regardless of the tumor model used, therapeutic engagement of OX40 and 4-1BB costimulatory pathways with simultaneous antagonism of the PD-(L)1 axis leads to superior tumor control.
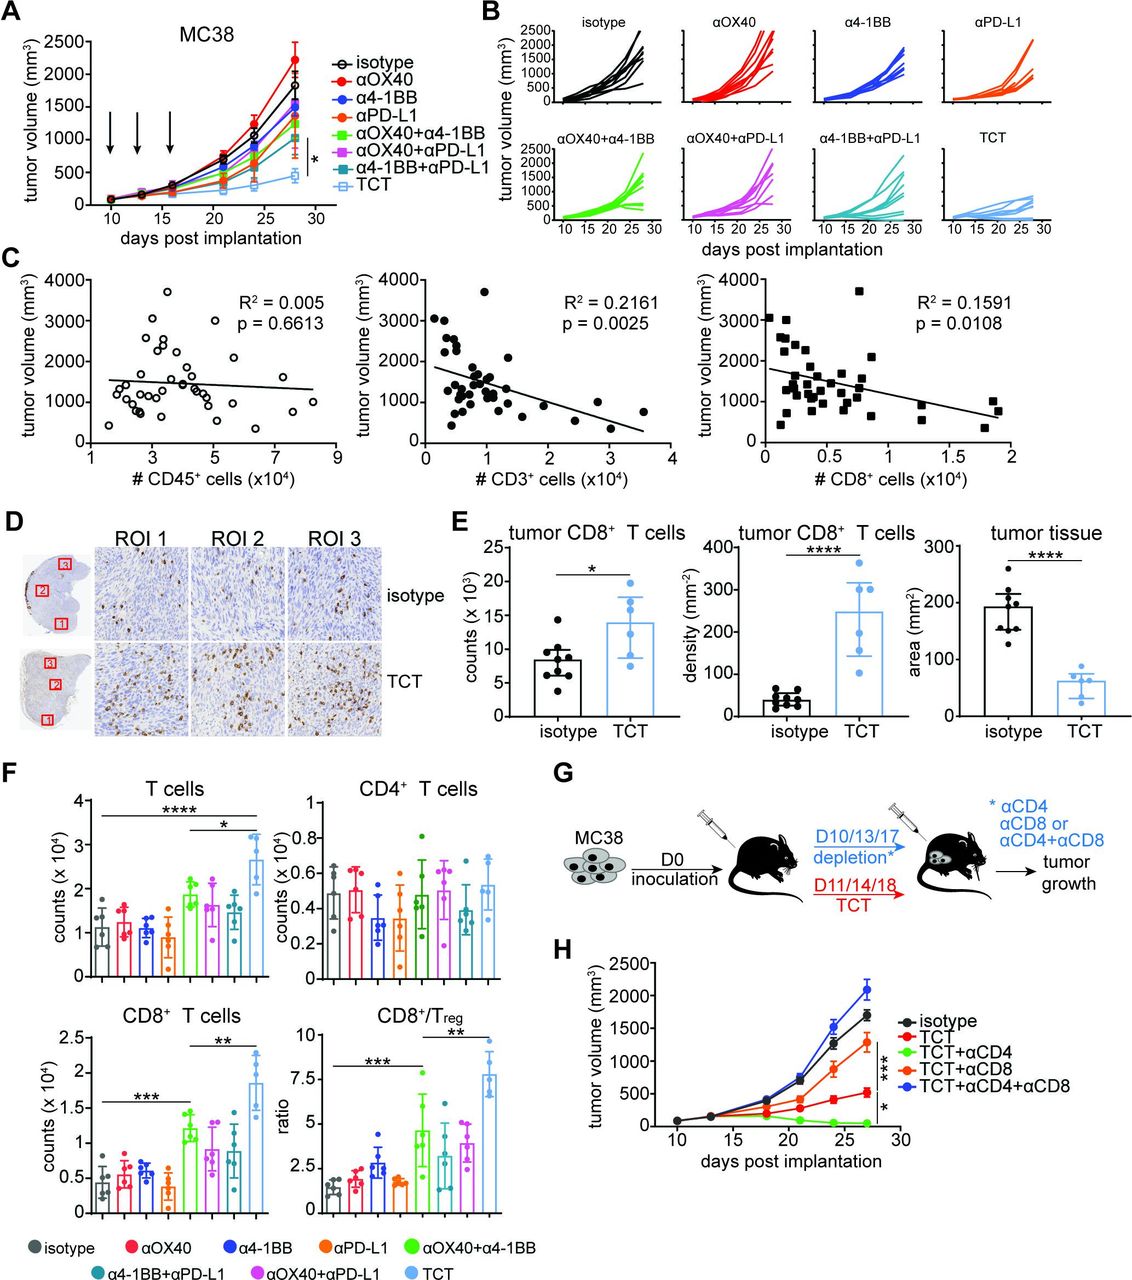
The antitumor effect of triple combinatorial therapy is mediated by CD8+ T cells. (A and B) C57BL/6 mice were inoculated with 5×10⁵ MC38 tumor cells and treated with various combinations of anti-4-1BB (1 mg/kg), anti-OX40 (1 mg/kg), and anti-PD-L1 (20 mg/kg) antibodies at days 10, 13, and 16 post-implantation. Tumor growth was assessed at the indicated days. Tumor volumes are depicted as (A) mean±SEM or as (B) an individual animal for each data point. Multiple-comparison one-way ANOVA using the final time point measurements (n=8–9 mice/group): *p=0.02. Representative of two independent studies. (C) MC38 tumors were harvested from mice treated as in (A) at day 21 post-implantation. Graphs depict correlation between tumor volumes and number of tumor-infiltrating CD45+ cells (open circles), total CD3+ T cells (closed circles), or CD8+ T cells (closed squares) isolated from individual tumors regardless of the treatment. p and R2 values were calculated using linear regression analysis (n=5 mice/treatment group, n=40 in total). (D and E) Mice were inoculated with 5×10⁵ MC38 tumor cells and treated with TCT (3 mg/kg anti-4-1BB, 5 mg/kg anti-OX40, and 20 mg/kg anti-PD-L1) at days 10, 13, and 16 post-implantation. Representative CD8 IHC staining of tumor sections at baseline (isotype) and after TCT at day 24 (n=10 mice/group). (E) Bar graphs depict tumor area (surface of viable tumor in mm2), total counts of CD8+ T cells in viable tumor tissue, and density of CD8+ T cells in viable tumor tissue (number of cells/mm2). Unpaired Student’s t-test (n=9 mice in isotype control group and n=6 in TCT group): ****p<0.0001, *p=0.02. Representative of two independent experiments. (F) Mice were inoculated with 5×10⁵ MC38 tumor cells and treated with various combinations of anti-4-1BB (1 mg/kg), anti-OX40 (1 mg/kg), and anti-PD-L1 (20 mg/kg) antibodies at days 11, 14, and 17 post-implantation. Animals were euthanized and tumor tissues harvested at day 19. Number of total T cells (upper left panel), CD4+ T cells (upper right panel), and CD8+ T cells (lower left panel) isolated from harvested tumors per 106 cells. Lower left panel depicts CD8+/Treg ratio. Bars represent mean±SEM. Multiple-comparison one-way ANOVA (n=5–6 mice/group) with T cells: ****p<0.0001, *p=0.0483; CD8+ T cells: ***p=0.0002, **p=0.0054; CD8+/Treg: ***p=0.001, **p=0.0021. Representative of two independent experiments. (G) Schematic depiction of CD4+ and CD8+ T cell depletion in MC38-bearing, TCT-treated mice. (H) Tumor growth was assessed at the indicated days. Tumor volumes are depicted as mean±SD. Multiple-comparison one-way ANOVA using the final (day 27) time point measurements (n=6–9 animals/group): *p=0.0168, ***p=0.0002. Representative of two independent experiments. ANOVA, analysis of variance; IHC, immunohistochemistry; PD-L1, programmed death ligand 1; TCT, triple combinatorial therapy.
We next investigated the immunological mechanisms underlying the superior efficacy of TCT. Linear regression analysis initially revealed that MC38 tumor size negatively correlated with the absolute number of total T cells and CD8+ T cells (p=0.0025 and p=0.0108, respectively), but not total CD45+ cells (p=0.6613) (figure 1C), directly linking the CD8+ T cell compartment to tumor control. In line with this, IHC analysis of resected tumors showed a significant TCT-induced accumulation of CD8+ T cells within MC38 and B16 tumors (figure 1D,E; online supplemental figure 2B). This increased accumulation of CD8+ T cells negatively correlated with tumor parenchymal tissue surface area (figure 1E).
Analysis of the T cell response also revealed no impact of single agent treatments on the overall frequency of CD4+ and CD8+ T cells. DCT induced only a modest increase in total T cell numbers, while TCT distinctly led to the accumulation of T cells compared with all other treatments (figure 1F, upper left panel). As with IHC, flow-based immune profiling showed that TCT mainly tracked with enhanced CD8+ T cell numbers and CD8+ T cell/regulatory T cell ratios (CD8+/Treg) (figure 1F, bottom panels), but not with the number of CD4+ T cells (figure 1F, upper right panel).
We next performed antibody-mediated depletion of T and NK cell populations in the MC38 model (figure 1G; online supplemental figure 3A). Depletion of CD8+ T cells dramatically compromised the antitumor effect of TCT, whereas CD4+ T cell and NK cell depletion did not worsen TGI (figure 1H; online supplemental figure 3B). CD4+ T cell depletion instead slightly enhanced TGI, emphasizing their possible role as Treg (figure 1H). These data collectively show that intratumoral accumulation of CD8+ T cells is positively linked with decreased tumor size and the therapeutic benefit mediated by TCT.
TCT leads to the intratumoral accumulation of activated, stem-like PD-1loCD8+ T cells
Next, we phenotypically profiled MC38 tumor-derived CD8+ T cells across different treatment regimens using flow cytometry (figure 2A–C; online supplemental figure 4A,B). As shown previously by scRNA-Seq (online supplemental figure 1G), the TIL compartment was primarily composed of PD-1hiCD8+ T cells at baseline (isotype treatment group). This PD-1hiCD8+ T cell population was not numerically affected by any single agent treatment and was only modestly increased (~2×) after DCT or TCT (figure 2A,B). In striking contrast, a population of PD-1loCD8+ T cells represented a minor fraction of the TIL compartment in untreated murine tumors, and these cells did not expand upon treatment with anti-OX-40, anti-4-1BB, or anti-PD-L1 as single agents (figure 2A,C). An increase in the size of the total PD-1loCD8+ T cell population was however apparent after dual anti-OX40/anti-4-1BB costimulation. In contrast, we did not observe a similar increase in the number of PD-1loCD8+ TILs upon the combinatorial treatment with anti-PD-L1 and either anti-OX40 or anti-4-1BB. Notably, the PD-1loCD8+ T cell population induced by anti-OX40/anti-4-1BB was further enhanced by PD-L1 blockade (figure 2A,C). Furthermore, only OX40/4-1BB DCT and TCT resulted in PD-1loCD8+ T cells upregulating the expression of KLRG-1, consistent with the acquisition of an activated effector-like profile. These results suggest that selective costimulation of OX40 and 4-1BB triggers induction of a novel PD-1loCD8+ T cell population subsequently targeted and expanded by PD-L1-based ICB.
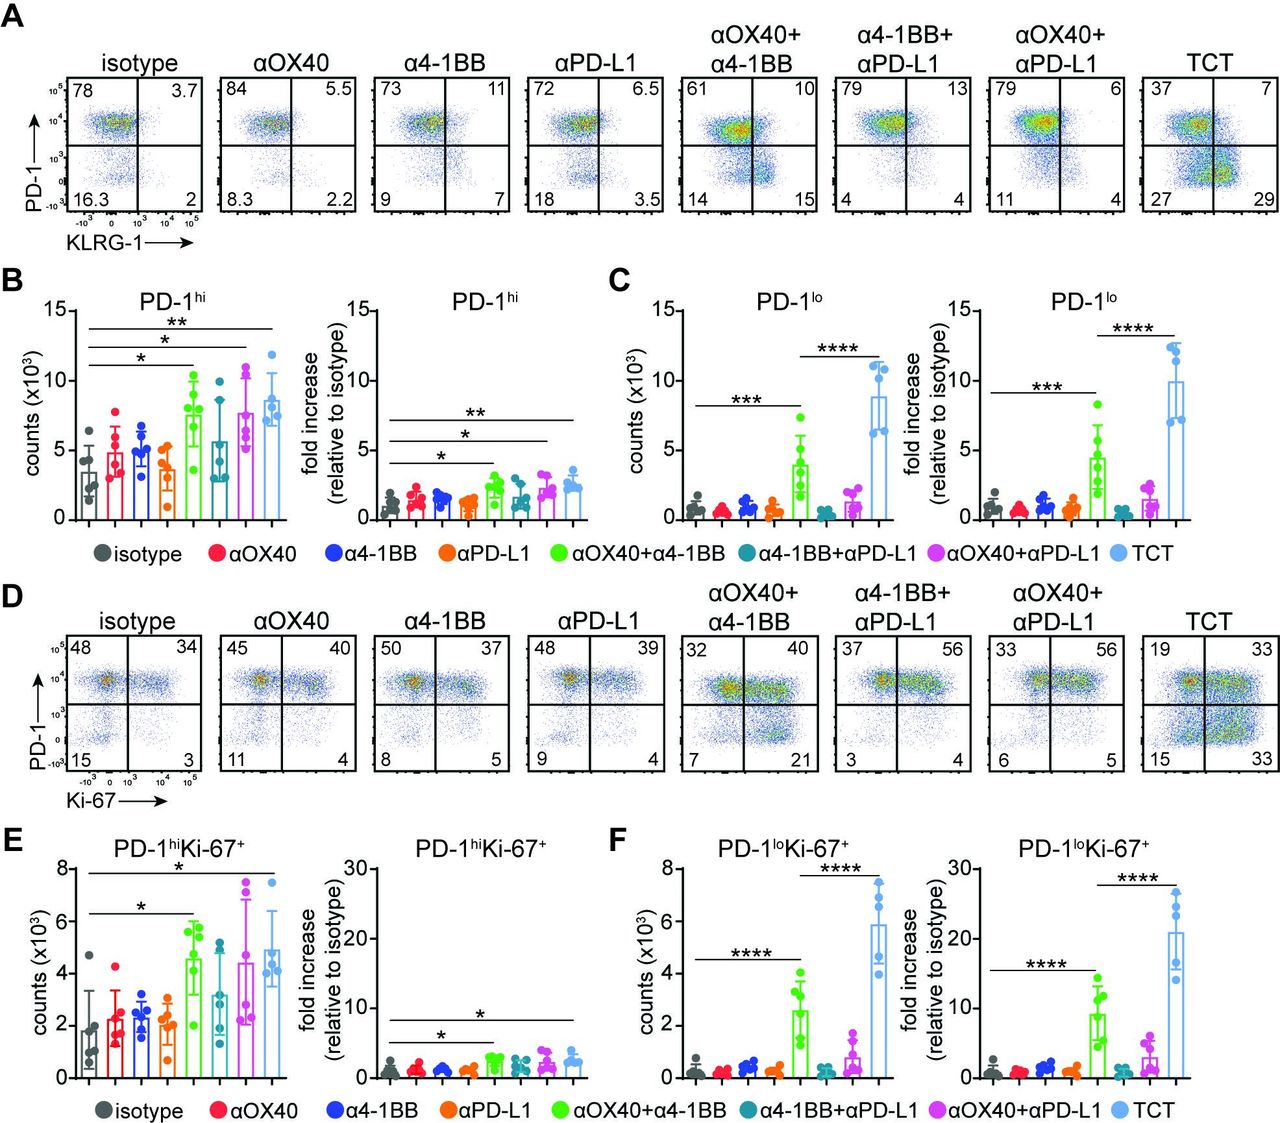
Accumulation of stem-like PD-1loCD8+ T cells after triple combinatorial therapy. (A–F) Mice were inoculated with 5×10⁵ MC38 tumor cells and treated with various combinations of anti-4-1BB (1 mg/kg), anti-OX40 (1 mg/kg), and anti-PD-L1 (20 mg/kg) antibodies at days 11, 14, and 17 post-implantation. (A) Representative FACS plots of % PD-1 and % KLRG-1 expression in CD8+ TILs at day 19 post-tumor inoculation. (B) Cumulative results depicting numbers of (B) PD-1hi and (C) PD-1lo CD8+ T cells per 106 cells (left panel) and fold increase relative to isotype control (right panel). Bar graphs represent mean±SD. Multiple-comparison one-way ANOVA (n=5–6 mice/group) with PD-1hi counts: **p=0.0045, *p=0.0219, *p=0.0283; PD-1hi fold increase: **p=0.0034, *p=0.0186, *p=0.0267; PD-1lo counts: ****p<0.0001, ***p=0.0006; PD-1hi fold increase: ***p=0.0006, ****p<0.0001. (D) Representative FACS plots of % PD-1 and % Ki-67 expression in CD8+ TILs at day 19 post-tumor inoculation. Cumulative results depicting numbers of (E) PD-1hiKi-67+ and (F) PD-1loKi-67+ CD8+ T cells per 106 cells (left panel) and fold increase relative to isotype control (right panel). Bar graphs represent mean±SD. Multiple-comparison one-way ANOVA (n=5–6 mice/group) with PD-1hiKi-67+ counts: *p=0.0357, *p=0.0203; PD-1hiKi-67+ relative increase: *p=0.0322, *p=0.0199; PD-1loKi-67+ counts: ****p<0.0001; PD-1loKi-67+ relative increase: ****p<0.0001. Representative of two independent experiments. ANOVA, analysis of variance; PD-1, programmed death 1; PD-L1, programmed death ligand 1; TCT, triple combinatorial therapy; TILs, tumor-infiltrating lymphocytes.
We also evaluated the activation status of the expanded PD-1loCD8+ T cells 11 days post-treatment initiation (21 days following tumor implantation). Phenotypic analysis of intratumoral and splenic CD8+ T cells revealed increased expression of activation markers associated with TCT in addition to KLRG-1, including CD44, CD43, and ICOS (online supplemental figure 4A,B). Moreover, most PD-1loCD8+ TILs stained positive for intranuclear Ki-67, suggesting that these cells had an enhanced potential to proliferate (figure 2D). Further analysis revealed that DCT and TCT did not induce dramatic changes in the PD-1hiKi-67+CD8+ T cell population (figure 2D,E). In sharp contrast, we observed a substantial increase in PD-1loKi-67+CD8+ T cell numbers in response to anti-OX40/anti-4-1BB DCT. Similar to prior results assessing the CD8+ T cell response using PD-1 and KLRG-1 parameters, the proliferative capacity of PD-1loKi-67+CD8+ T cells was significantly enhanced by TCT (figure 2D,F). Our findings collectively reveal the existence of synergism between costimulatory and ICB components of TCT on the magnitude of the intratumoral CD8+ T cell response. This functional synergism features a dramatic accumulation of novel, activated, and proliferating PD-1loCD8+ T cells.
Newly emergent PD-1loCD8+ TILs exhibit a gene expression profile of activated stem-like cells
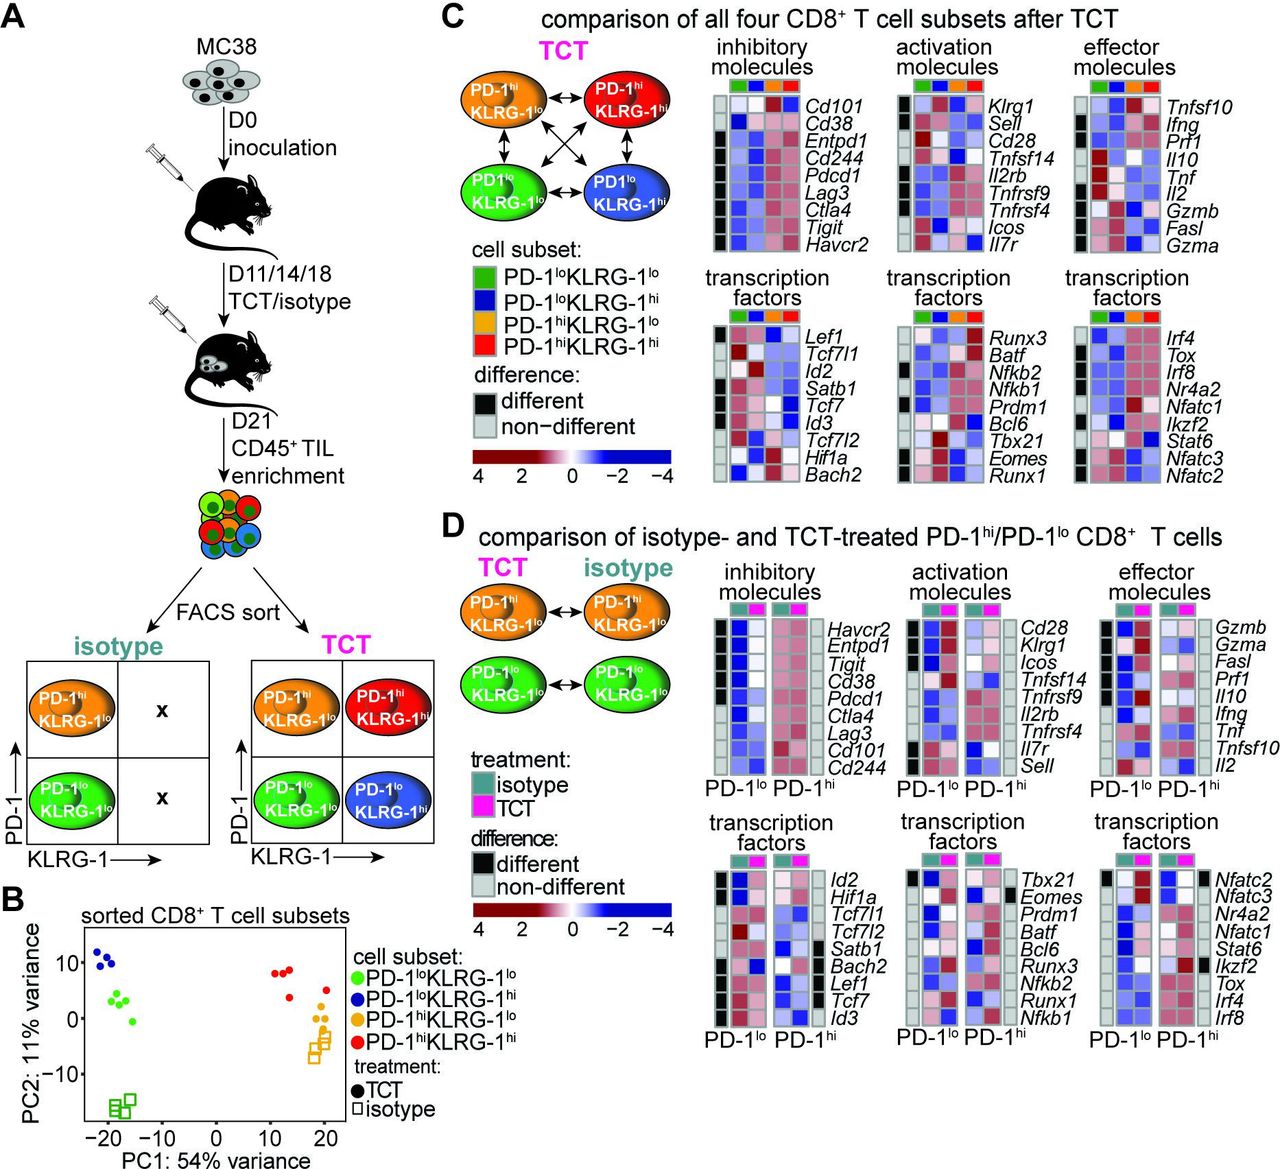
To gain insight into the properties of PD-1lo and PD-1hi CD8+ TILs that underlie the response to TCT, we performed transcriptome-wide gene expression analyses of CD8+ T cells FACS-sorted from control versus TCT-treated MC38 tumors based on the expression of PD-1 and KLRG-1 (figure 3A). PCA revealed segregation along the PC1 axis between PD-1lo and PD-1hi cells (green/blue versus red/yellow symbols, respectively) regardless of treatment, confirming significant transcriptome-wide differences between these two cell states in the presence or absence of TCT (figure 3B). Genes DE among the four sorted populations were grouped into distinct clusters (gene clusters 1–9) based on their expression profiles (online supplemental figure 5A,B). GO term enrichment of canonical pathways identified several essential functions associated with six out of the nine gene clusters. The majority of the top 10% of all pathways fell within gene cluster 1 (predominantly upregulated in PD-1loCD8+ TILs) and uniformly tracked with T cell proliferation and activation (online supplemental figure 5A,C). Interestingly, pathways associated with T cell migration and leukocyte chemotaxis were also significantly enriched in gene cluster 1, suggesting possible recruitment and trafficking of PD-1loCD8+ T cells into the tumor. Gene cluster 2 was associated with inflammatory and cytolysis-related gene signatures, consistent with PD-1hi cell maintenance of an activated phenotype (online supplemental figure 5A,C).26 Notably, gene clusters 6 and 9 were associated with KLRG-1 expression and exhibited a strong enrichment in cell proliferation, a feature typical of effector cells (online supplemental figure 5A,C).

Gene expression profiles of PD-1lo and PD-1hi CD8+ TILs. (A) Schematic depiction of the study design. Mice were inoculated with 5×10⁵ MC38 tumor cells and treated at days 11, 14, and 17 post-tumor inoculation with TCT (1 mg/kg anti-4-1BB, 1 mg/kg anti-OX40, and 10 mg/kg anti-PD-L1). Tumors were resected at day 21, enriched for CD45+ TILs, and FACS-sorted into the four depicted populations. (B) Principal component analysis plot of bulk RNA-sequencing data of FACS-sorted samples from TCT or isotype control-treated groups. TCT group: PD-1loKLRG-1lo (n=5 samples), PD-1loKLRG-1hi (n=4 samples), PD-1hiKLRG-1lo (n=5 samples), PD-1hiKLRG-1hi (n=5 samples); isotype group: PD-1loKLRG-1lo (n=4 samples), PD-1hiKLRG-1lo (n=4 samples). KLRG-1+ populations were not obtained from isotype-treated tumors due to low numbers. (C) Heatmaps of key functional modalities depicting gene expression patterns across the four sorted TCT-treated populations. Black=differentially expressed genes; gray=non-differentially expressed genes. (D) Heatmaps of key functional modalities depicting TCT-induced change in gene expression pattern from baseline (isotype treatment) in PD-1lo (left heatmaps) and PD-1hi (right heatmaps) CD8+ T cells. PD-1, programmed death 1; PD-L1, programmed death ligand 1; TCT, triple combinatorial therapy; TILs, tumor-infiltrating lymphocytes.
We next examined the effect of TCT on PD-1lo/hiKLRG-1lo/hiCD8+ TILs in light of the expression of a defined gene set linked with stem-like versus terminally exhausted cell states.20 27 PD-1hiCD8+ TILs exhibited a gene expression signature typical for terminally exhausted cells, characterized by coexpression of several inhibitory molecules (Entpd1, Cd244, Pdcd1, Lag3, Ctla4, Tigit, and Havcr2) and exhaustion-associated transcription factors (Tox, Nr4a2, Runx3, Batf3, and Prdm1) (figure 3C). We also observed downregulation of memory-associated markers (Sell and Il7r) and some activation/effector molecules (Il10, Tnf, Il2, and Fasl) (figure 3C). It is important to note that while stem-like PD-1loCD8+ T cells displayed an activated profile, they retained critical features of memory cell differentiation, maintenance, and survival, including expression of Tcf7, Id3, and Eomes despite increasing Klrg1 expression (figure 3C). These results show that TCT differentially shapes a PD-1-divergent CD8+ TIL compartment, where PD-1hiCD8+ T cells exhibit features of terminally exhausted CD8+ T cells, while PD-1loCD8+ T cells display an association with recent activation and proliferation yet still retain features of memory T cells.
PD-1loCD8+ TILs undergo transcriptional alterations associated with recent T cell activation while PD-1hiCD8+ TILs remain stable after TCT
To further characterize the impact of TCT on PD-1lo versus PD-1hi CD8+ T cells, we compared gene expression profiles of control samples to those treated with TCT within the two populations independent of KLRG-1 expression. Analysis revealed 1483 (665 up/818 down) and 843 (572 up/271 down) DE genes within PD-1lo and PD-1hi populations, respectively (online supplemental figure 5D).
Within PD-1loCD8+ T cells, TCT was found to upregulate the expression of Cd28, Klrg1, Gzmb, Prf1, Havcr2, Entpd1, Tigit, Cd38, and Pdcd1 while decreasing Sell expression (figure 3D), confirming the enhanced activated state of PD-1loCD8+ T cells in response to this treatment. Moreover, TCT also induced upregulation of transcription factors associated with CD8+ T cell activation in the PD-1lo population (Id2, Hif1a, Tbx21, and Nfatc2) (figure 3D, effector molecules and transcription factors).28–30 Importantly, PD-1lo cells exhibited expression of memory-associated transcription factors (Tcf7 and Lef1) and lacked Tox expression, suggesting their origin from stem-like precursors (figure 3D, transcription factors).31 32 In contrast, TCT did not increase the stem-like profile within the PD-1hi population. Genes linked with functional exhaustion (Havcr2, Entpd1, Cd38, Lag3, Tox, and Prdm1) within the PD-1hi population did not show changes in gene expression in response to TCT, supporting the notion that these cells exist in a stable terminally differentiated state (figure 3D, inhibitory molecules and transcription factors).
TCT induces dynamic developmental changes within tumor-infiltrating CD8+ T cells
To gain further insights into the developmental connectivity between the PD-1lo and PD-1hi CD8+ TIL populations, we first tested whether the observed TCT-induced changes were MC38-specific or could be extended to more ICB-resistant tumor models. To this end, we extended the scRNA-Seq analysis to CD8+ TILs isolated from control and TCT-treated mice bearing B16 melanoma. Like the immune remodeling observed in MC38 tumors, we detected significant changes in the CD8+ T cell populations of TCT-treated B16 tumors (figure 4A,B). Although eight CD8+ T cell clusters were annotated in pretreatment and post-treatment B16 tumors, only six were numerically appreciable at baseline (clusters 5, 7, 9, 11, 13, and 14). All clusters notably expanded in response to TCT, although to differing degrees (except for cluster 5, which decreased) (figure 4C). Clusters were segregated into two groups based on TCT-induced expansion: those that underwent moderate (<3×) expansion (clusters 7, 11, and 13) and those that expanded dramatically (>10×) after TCT (clusters 6, 9, 10, and 14) (figure 4C). In addition to the differential accumulation rate, the identified CD8+ T cell clusters exhibited substantial phenotypic and functional heterogeneity, as captured by GO pathway enrichment analysis. We identified a naive population (cluster 5), two clusters of actively dividing cells (clusters 13 and 14), an inflammation sensing cluster (cluster 9), and a highly cytolytic cluster (cluster 7) (figure 4A,D; online supplemental figure 6A). Thus, like MC38 tumors, TCT induces changes in the B16 CD8+ TIL compartment featuring the accumulation of functionally and phenotypically specialized cell subsets.
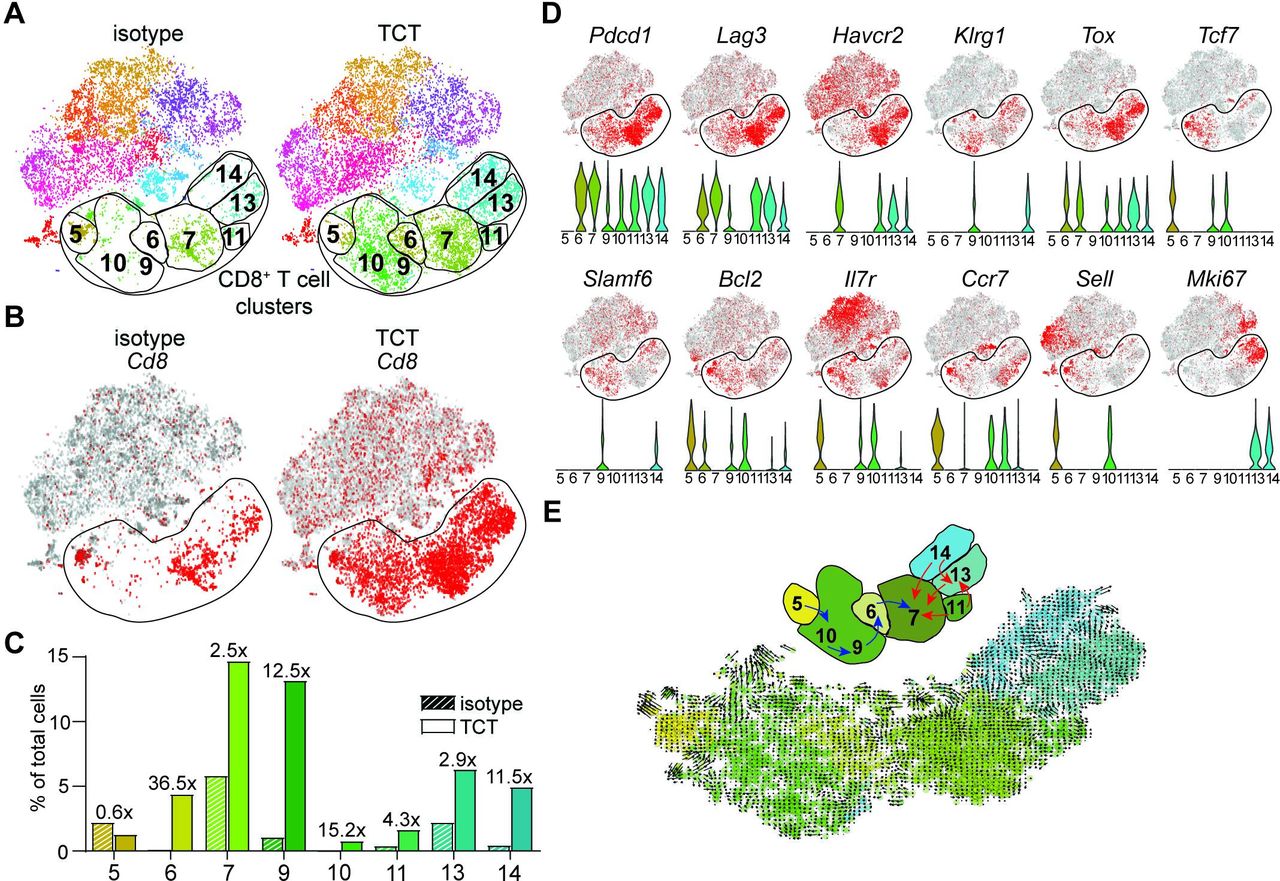
Changes in composition of CD8+ T cell populations in response to triple combination therapy. (A–F) C57BL/6 mice were inoculated with 5×10⁵ B16 tumor cells and treated with TCT (3 mg/kg anti-4-1BB, 5 mg/kg anti-OX40, and 15 mg/kg anti-PD-1) or isotype control antibody at days 10, 13 and 16 post-implantation. Mice were euthanized at day 21, and tumors were resected and processed for scRNA-Seq analysis. scRNA-Seq characterization of intratumoral CD45+ cells isolated from B16 tumors. Isotype (baseline)=isotype antibody treatment only; TCT=concatenated isotype and TCT. (A) t-SNE maps depicting clustering of immune cell populations at baseline (left panel) and after TCT (right panel). (B) CD8+ T cell clusters at baseline (left panel) or after TCT (right panel). (C) Abundance of identified CD8+ T cell clusters relative to the total cell number at baseline (striped bars) and after TCT (non-striped bars). (D) t-SNE maps (top panels) and corresponding violin plots (bottom panels) depicting expression of select genes associated with activation, memory/stem-like, and/or exhaustion status of CD8+ T cells upon TCT in eight selected CD8+ T cell clusters. (E) RNA velocity field projected onto the t-SNE plot depicting the eight identified CD8+ T cell clusters (bottom panel). Arrows show the local average RNA velocity evaluated on a regular grid. Summary schematic depiction of the RNA velocity field (top panel). PD-1,programmed death 1; scRNA-Seq, single-cell RNA sequencing; TCT, triple combinatorial therapy; t-SNE, t-distributed stochastic neighbor embedding.
We hypothesized that the distinct CD8+ T cell clusters present before and after response to TCT reflect a developmental continuum rather than a group of isolated, developmentally unrelated states. To test this, we compared the gene expression signatures of our CD8+ T cell clusters against signatures published by Beltra et al who recently characterized transcriptional phenotypes associated with stem-like progenitor (Prog1 and Prog2), intermediate (Int), and terminally exhausted (Term) CD8+ T cell subsets during chronic viral infection and cancer.26 This analysis revealed that the identified CD8+ T cell clusters corresponded to Prog1 (clusters 10 and 11), Prog2 (clusters 13 and 14), Int (cluster 9) and Term (clusters 6 and 7) substates (online supplemental figure 6B). Although the relative enrichment of the established CD8+ T cell state-specific core signatures does not itself solely define cell subsets, these results support the notion that the distinct CD8+ T cell clusters within TCT-treated tumors represent a developmental hierarchy.
To further understand whether the Prog1/2 (clusters 10, 11, 13 and 14), Int (cluster 9), and Term clusters (clusters 6 and 7) within the CD8+ TIL compartment are part of an interconnected developmental pathway, we applied the RNA velocity algorithm to our data set. This technique takes advantage of differences in the ratio of unspliced (nascent) to spliced (mature) messenger RNA during developmental cell state transitions to predict the future fate of cells undergoing differentiation.22 When applied to CD8+ TILs from TCT-treated B16 tumors, the predicted differentiation trajectories identified two separate developmental lineages (figure 4E, denoted by blue and red arrows). The first lineage (blue) originates from the naive CD8+ T cell cluster 5 and transitions towards Term (exhausted) clusters 6 and 7 via the Prog1 and Int clusters 10 and 9, respectively. The second lineage originates from Prog1/2 clusters 11 and 14 and connects to Term cluster 7 via Int cluster 13 (figure 4E). RNA velocity did not provide any evidence of movement out from cluster 7, consistent with its terminally differentiated status. Therefore, TCT is defined by the accumulation of CD8+ T cell subsets reminiscent of the characterized T cell exhaustion lineage cells observed by others.26
Intratumoral infiltration of stem-like PD-1loCD8+ T cells from secondary lymphoid tissue after TCT
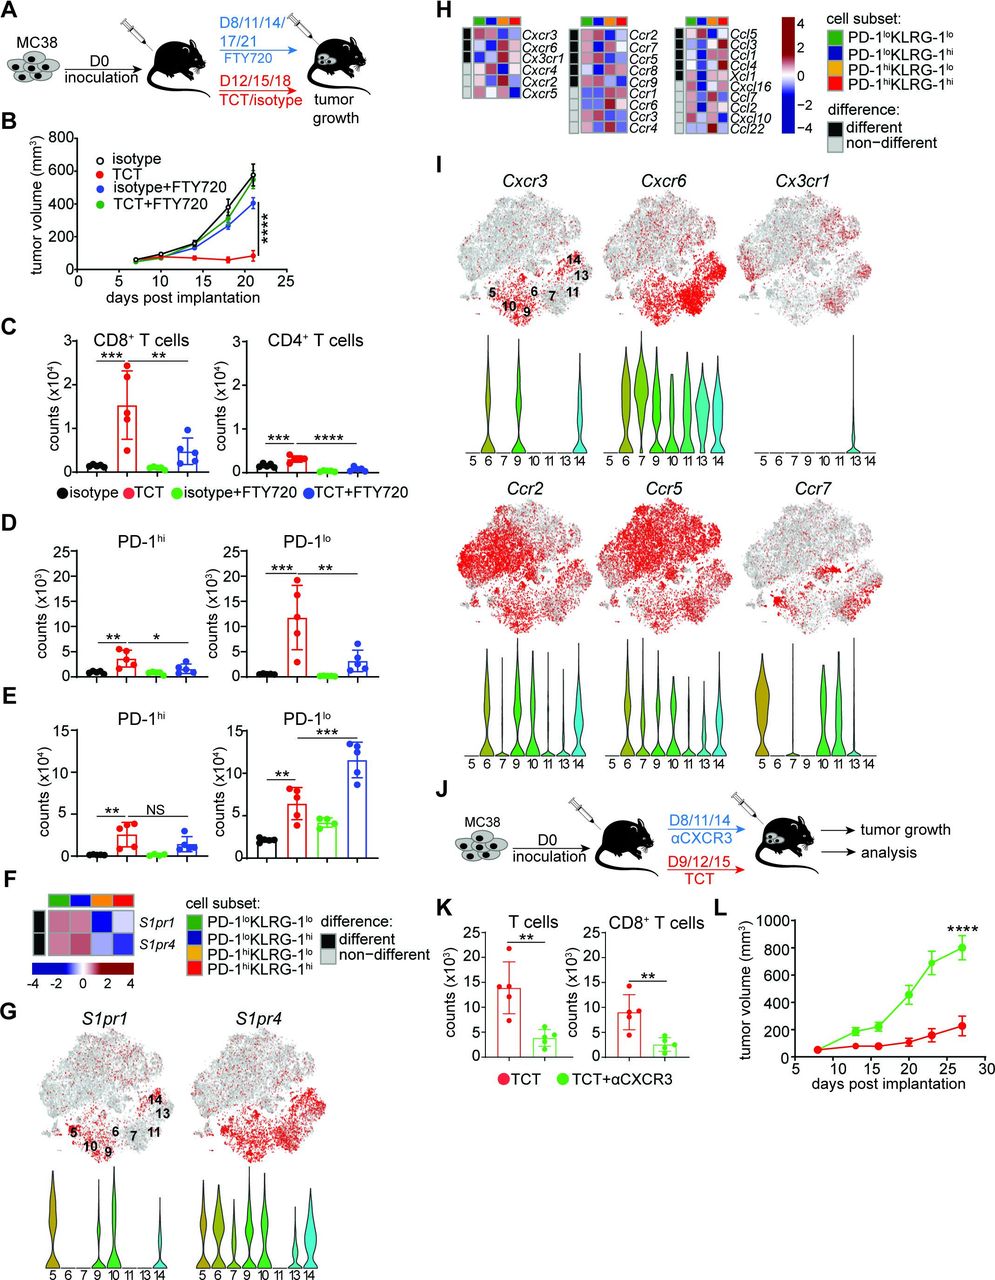
The tissue origin of CD8+ T cells induced by TCT was next determined. The potential sources of PD-1loCD8+ T cells include local expansion within the TME versus de novo priming in regional tdLNs. To clarify whether stem-like PD-1loCD8+ T cells originate from immune niches inside or outside the tumor, we used FTY720 to block the egress of T cells from lymphoid tissues in MC38-bearing TCT-treated mice (figure 5A). Treatment with FTY720 severely compromised TCT-induced TGI, implying that cell trafficking played a significant role in the efficacy of this treatment (figure 5B). Moreover, we observed that FTY720 treatment compromised intratumoral accumulation of CD8+ T cells and, to a lesser extent but statistically significant (p<0.0001), CD4+ T cells (figure 5C). Further, there was a statistically significant decrease in the number of PD-1hiCD8+ TILs (p=0.0235) and a more dramatic decline in the PD-1loCD8+ TIL population (p=0.0047) after FTY720 treatment (figure 5D). PD-1lo, but not PD-1hi, CD8+ T cells at the same time were retained in tdLNs after treatment (figure 5E; online supplemental figure 7). Consistent with the biased TCT-induced egress of PD-1loCD8+ T cells from secondary lymphoid tissues, we observed an increased expression of two T cell-specific members of the sphingosine-1-phosphate receptor family (S1pr1 and S1pr4) in PD-1loCD8+ T cells relative to PD-1hiCD8+ T cells (figure 5F,G).33 34 While the accumulation of PD-1lo and PD-1hi CD8+ T cells in the tumor was highly dependent on migration from tdLNs, only PD-1loCD8+ T cells migrated out of the tdLNs and trafficked to tumors after TCT. This is in line with a developmental relationship between PD-1lo and PD-1hi CD8+ T cells, where stem-like PD-1loCD8+ T cells differentiate into exhausted PD-1hiCD8+ T cells after TME entry. Thus, our results reveal that TCT seems to act mainly through induction and recruitment of activated, stem-like PD-1loCD8+ T cells from secondary lymphoid niches outside the tumor.
Role of peripheral trafficking in intratumoral accumulation of stem-like PD-1loCD8+ T cells. (A–E) C57BL/6 mice were inoculated with 5×10⁵ MC38 tumor cells and treated with TCT (1 mg/kg anti-4-1BB, 1 mg/kg anti-OX40, and 20 mg/kg anti-PD-L1) or isotype control antibody as schematically depicted in (A). In addition to TCT, mice were administered per os with 2.5 mg/kg FTY720 every 3 days starting from day 8. (B) Tumor growth assessed at the indicated days. Tumor volumes are depicted as mean±SEM. Multiple-comparison one-way ANOVA using the final time point measurements (n=10 mice/group): *p<0.0001. Representative of two independent experiments. (C–E) MC38 tumor-bearing mice were euthanized at day 24 post-implantation, and tumor tissue and tdLNs were harvested for T cell analysis. Bar graphs depicting numbers of (C) CD8+ TILs (left panel) and CD4+ TILs (right panel), (D) PD-1hi (left panel) and PD-1lo (right panel) CD8+ TILs, and (E) PD-1hi (left panel) and PD-1lo (right panel) CD8+ T cells isolated from tdLNs per 106 cells. Error bars present mean±SD. Multiple-comparison one-way ANOVA (n=4–5 mice/group) with CD8+ TILs: ***p=0.0004, **p=0.0054; CD4+ TILs: ***p=0.0009, ****p<0.0001; PD-1hiCD8+ TILs: **p=0.0025, *p=0.0235; PD-1loCD8+ TILs: ***p=0.0004, **p=0.0047; tdLN PD-1hiCD8+ T cells: **p=0.0031; tdLN PD-1loCD8+ T cells: **p=0.0018, ***p=0.0003. Representative of two independent experiments. (F) Heatmaps depicting gene expression of S1pr1 and S1pr4 across the four CD8+ T cell populations FACS-sorted from TCT-treated MC38 tumors, as described in figure 3A. (G) t-SNE maps (top panel) and corresponding violin plots (bottom panel) depicting S1pr1 and S1pr4 gene expression from scRNA-Seq of CD45+ cells FACS-sorted from TCT-treated B16 tumors, as described in figure 4A. (H) Heatmaps depicting expression patterns of genes encoding major chemokines and chemokine receptors across the four CD8+ T cell populations FACS-sorted from TCT-treated MC38 tumors, as described in figure 3A. (I) t-SNE maps (top panels) and corresponding violin plots (bottom panels) depicting expression patterns of selected chemokine receptors evaluated by scRNA-Seq of CD45+ cells FACS-sorted from TCT-treated B16 tumors, as described in figure 4A. (J) Schematic depiction of CXCR3 blocking in MC38-bearing, TCT-treated mice. (K) Numbers of total T cells (left panel) and CD8+ T cells (right panel) isolated from MC38 tumors at day 30 post-inoculation treated as in (J) per 106 cells. Error bars present mean±SD. Multiple-comparison one-way ANOVA (n=5 mice/group) with T cells: **p=0.0034; CD8+ T cells: **p=0.0050. Representative of two independent experiments. (L) Tumor growth assessed at the indicated days under the treatment described in (J). Tumor volumes are depicted as mean±SEM. Unpaired Student’s t-test using the final (day 27) time point measurement (n=10 mice/group): ***p=0.0001. Representative of two independent experiments. ANOVA, analysis of variance; FTY720, Fingolimod; PD-1, programmed death 1; PD-L1, programmed death ligand 1; S1pr1 and S1pr4, sphingosine-1-phosphate receptor; scRNA-Seq, single-cell RNA sequencing; TCT, triple combinatorial therapy; tdLN, tumor-draining lymph node; TILs, tumor-infiltrating lymphocytes; t-SNE, t-distributed stochastic neighbor embedding.
Role of CXCR3 in intratumoral accumulation of stem-like PD-1loCD8+ T cells
Finally, we investigated mechanisms driving the trafficking of stem-like PD-1loCD8+ T cells from secondary lymphoid organs to the tumor. To this end, we assessed the expression of several genes encoding a broad range of chemokine receptor/ligand pairs implicated in the recruitment of activated T cells.35 36 Although numerous chemokine receptor-encoding genes were DE in PD-1lo relative to PD-1hi CD8+ T cell populations derived from TCT-treated MC38 tumors, we identified a significant enhancement in the expression of Cxcr3, Ccr2, Ccr5, and Ccr9 in PD-1lo cells (figure 5H). Similarly, scRNA-Seq analysis of cells isolated from TCT-treated B16 tumors revealed enrichment in select chemokine receptor-encoding genes in PD-1lo cell clusters (figure 5I).
Prior work has suggested that CXCR3 is mainly expressed by stem-like PD-1loCD8+ T cells, whereas CCR5 is elevated on terminally exhausted PD-1hiCD8+ T cells.26 37 38 In addition, CXCR3 has been identified as a limiting factor for ICB efficacy in preclinical models and was implicated in CD8+ T cell trafficking and positioning within tumors.36 37 39–41 As Cxcr3 expression was specifically elevated in stem-like PD-1loCD8+ T cells, we tested its role in the TCT-induced accumulation of CD8+ T cell subsets into tumors. To this end, MC38-bearing mice were treated with TCT alongside anti-CXCR3 neutralizing or control antibodies (figure 5J). Consistent with its described role in intratumoral T cell trafficking, neutralization of CXCR3 substantially compromised TCT-induced accumulation of both total T cells and CD8+ T cells in the TME (figure 5K). The impairment of CXCR3-signaling also led to a significant decrease in TGI after treatment (figure 5L). Overall, these data support that the efficacy of TCT largely depends on CXCR3-mediated intratumoral recruitment and trafficking of stem-like CD8+ T cells from the periphery.
Discussion
The mechanisms by which T cell dysfunction arise in cancer are poorly understood, as is the precise mode of action deployed by agonistic and antagonistic immune modulators. In this study, we report that TCT, which combines OX-40 and 4-1BB agonists with anti-PD-(L)1 blockade, leads to a synergistic control of tumor growth. We sought to understand how TCT influences CD8+ T cell activation and differentiation within the TME and were specifically interested to know if TCT-induced responses could reveal new insights into CD8+ T cell-mediated antitumor immunity. We observed that TCT enhanced the accumulation of stem-like PD-1loTCF-1hiCD8+ T cells within the TME. Recent preclinical and clinical studies have shown that anti-PD-(L)1 ICB effects are mediated via the PD-1loTim-3−TCF-1hi stem-like CD8+ T cell population. These cells expand and differentiate into antitumor effector cells that eventually exhaust in response to ICB.20 26 38 In this work, we discovered that costimulatory agonists and ICB act at different stages of the antitumor CD8+ T cell response. Treatment with the combination of OX40 and 4-1BB agonists led to the emergence of a robust stem-like PD-1loKLRG-1hiKi-67+CD8+ TIL population within the TME. Only when this population was present in ICB-refractory murine B16 melanoma and MC38 colorectal tumor models did PD-(L)1 blockade lead to superior TGI. However, PD-(L)1 blockade further caused stem-like CD8+ TILs to differentiate towards a PD-1hi terminally exhausted state, suggesting that this immunotherapy does not prevent eventual exhaustion. Thus, our results reveal a novel approach to amplify therapeutic responsiveness in the ICB refractory patient cohort by first increasing the presence of stem-like CD8+ T cells using a dual costimulatory receptor agonist strategy. Notably, Emerson and colleagues have recently reported similar findings, showing that triple combination therapy based on anti-OX40, anti-CTLA-4, and ibrutinib (a Food and Drug Administration (FDA) approved tyrosine kinase inhibitor) exhibits superior antitumor activity compared with anti-OX40 and anti-CTLA-4 combination.42 Mechanistically, the authors showed that ibrutinib synergizes with ICB and costimulatory therapy components by enhancing the presence of an EOMEShiCD8+ T cell population with decreased inhibitory receptor expression and superior functional features (eg, cytokine production).42
An essential point for consideration is whether the OX40/4-1BB DCT-induced stem-like CD8+ T cell expansion occurs within the TME or periphery. Our studies using FTY720 to prevent LN egress showed that a significant component of TCT efficacy arises from LNs. Notably, FTY720 prevented the accumulation of both PD-1hi and PD-1lo CD8+ T cell populations within the tumor. However, only the PD-1lo population was actively retained in the tdLNs after FTY720 treatment, while we did not observe any increase in retention of PD-1hi cells. Thus, we propose that the costimulatory component of TCT enhances de novo priming of PD-1lo stem-like CD8+ T cells within tdLNs, which subsequently expand and traffic to the TME as ICB exerts its synergistic effect. These findings are consistent with recent studies showing that secondary lymphoid organs are important sites of action of ICB agents.43–45 In a study by Yost et al, paired scRNA-Seq/TCR-Seq analysis of patients with advanced or metastatic basal/squamous cell carcinomas treated with anti-PD-1 revealed that most terminally exhausted CD8+ T cells present in the tumor before treatment neither underwent phenotypic instability nor expanded. Instead, clonal replacement dominated the response to ICB; up to 84% of the CD8+ T cell clones present after treatment were novel (ie, from the periphery).46 Additionally, the presence of identical CD8+ TCR clonotypes in blood, tumor, and adjacent healthy tissues of patients responding to ICB supports the peripheral origin of anti-PD-1-induced T cell clones.47
In this study, we found that CXCR3 expression was restricted to the TCT-induced stem-like PD-1loCD8+ T cell population. Blockade of CXCR3 substantially diminished the efficacy of the treatment, highlighting the importance of stem-like CXCR3+CD8+ T cells for the response to TCT. This is substantiated by recently published findings showing that expression of CXCR3 ligand, CXCL9, positively correlates with CD8+ TIL frequency across various human cancers and the response rate of patients with melanoma to anti-PD-1.37 48–51 Furthermore, the intratumoral CXCL9/10-CXCR3 chemokine axis has been shown to play an essential role for the antitumor response mediated by ICB.41 These data suggest that the anti-PD-(L)1 component of TCT induces CXCR3-mediated intratumoral accumulation of stem-like PD-1loCD8+ T cells. Although CXCR3 seems to play a dominant role in the recruitment and trafficking of stem-like CD8+ T cells from immune niches outside the TME, we cannot exclude other potential mechanisms through which CXCR3 can contribute to the efficacy of TCT. For example, it has been shown that in human tumors, stem-like CXCR3+CD8+ T cells colocalize with CXCL9/10-expressing antigen-presenting cells (APCs) within the TME.52 Although the functional role of these microniches in supporting antitumor immunity is not fully understood, it is hypothesized that CXCL9/10-expressing APCs deliver costimulatory signals to CXCR3-expressing stem-like CD8+ T cells.52 Thus, CXCR3 can potentially play a role in positioning stem-like CD8+ T cells within the microenvironment where they can receive appropriate activation stimuli and acquire effector-like functions. Finally, CXCR3 ligands could directly induce activation of stem-like CD8+ T cells, as suggested by a recent study of muscle-invasive bladder cancers where these cells acquired effector-like properties upon treatment with CXCL11.53
Although our results suggest that TCT primarily mobilizes T cells from immune niches outside the tumor, the contribution of TILs residing within the tumor before TCT cannot be disregarded. For example, Miller et al showed that small populations of stem-like PD-1loTim-3−TCF-1+CD8+ T cells naturally reside within the parenchyma of B16 and D4M.3A murine melanoma tumors and display effector cytokine polyfunctionality, divide more extensively, and give rise to the terminally differentiated CD8+ T cell pool.20 Importantly, PD-1 blockade mobilized these tumor-residing PD-1loCD8+ T cells, triggered their differentiation towards an effector state, and enhanced the overall number of ‘short-lived’ cytotoxic PD-1hiCD8+ T cells.20 Further supporting this possibility, Yost et al demonstrate that, in addition to the TCR clonal replacement described above, ICB elicits expansion of Tcf7-expressing TCR clones locally within tumors.46 Thus, it is possible that a small fraction of stem-like CD8+ T cells residing within an intact tumor responds to ICB, complements the peripherally derived component, and contributes to overall therapeutic efficacy. In support of this, our lineage tracing analysis revealed two separate developmental trajectories within TCT-treated B16 tumors. One could therefore speculate that the first developmental lineage originates from stem-like progenitor CD8+ T cells present in the tumor before the treatment, while the second stems from tdLN-derived cells induced by OX40/4-1BB-mediated costimulation.
In conclusion, our results demonstrate functional synergism between the components of TCT, which leads to superior treatment efficacy compared with single agents or combinations of treatment pairs. We propose that the observed synergism results from de novo OX40/4-1BB-mediated priming of stem-like progenitor PD-1loCD8+ T cells and their subsequent ICB-induced expansion and intratumoral trafficking. Our findings present a compelling argument to rationally pair costimulatory receptor agonists with checkpoint blockade therapy as a treatment modality for ICB-refractive cancers. The promise of approaches such as TCT described herein lies in the ability of the anti-OX40/anti-4-1BB component to enable the supply of stem-like PD-1loCD8+ T cells, this way providing an increased frequency of target cells on which anti-PD-(L)1 ICB can act.
Data availability statement
Data are available in a public, open access repository. All data presented in the study are included as part of the manuscript or uploaded as supplementary information. Sequencing data are deposited in NCBI Gene Expression Omnibus with the primary accession code GSE181152.
Ethics statements
Patient consent for publication
Ethics approval
All animal procedures were approved by the Pfizer Institutional Animal Care and Use Committee.
Acknowledgments
The authors thank Robert Rickert, Premal Patel, and Barbara Sasu for useful discussions. The authors also thank Cindy Li, Breanna Jung, Sophanna Kong, Sherman M. Chin, German Vergara for technical assistance and material support.
References
Supplementary materials
Supplementary Data
This web only file has been produced by the BMJ Publishing Group from an electronic file supplied by the author(s) and has not been edited for content.
Footnotes
Twitter @SripadRam
NVB-B, JSD and JW contributed equally.
Contributors Research conceptualization: NB, JSD, JW, SPf, HL, and SS-A. Designed experiments: JW, S-HC, PSa, LM, AAA, SPf, HL, SPo, and SS-A. Performed the research: JW, S-HC, PSa, GTu, LM, AAA, SPf, SR, PSu, and HL. RNA-Seq processing: XW, PSu, WY, and SPo. Analyzed data: NB, JSD, JW, XW, S-HC, GTu, LM, AAA, SPf, PSu, HL, WY, and SS-A. Statistical analysis: NB and JSD. Writing: NB, JSD, GTh, and SS-A. Guarantor: SS-A.
Funding This study was funded by Pfizer. The funder held no part in the study design, data collection, and analysis, decision to publish, or preparation of the manuscript.
Competing interests Authors are present and former Pfizer employees and may hold stock/stock options in the company. Pfizer plans to file a patent application related to this work.
Provenance and peer review Not commissioned; externally peer reviewed.
Supplemental material This content has been supplied by the author(s). It has not been vetted by BMJ Publishing Group Limited (BMJ) and may not have been peer-reviewed. Any opinions or recommendations discussed are solely those of the author(s) and are not endorsed by BMJ. BMJ disclaims all liability and responsibility arising from any reliance placed on the content. Where the content includes any translated material, BMJ does not warrant the accuracy and reliability of the translations (including but not limited to local regulations, clinical guidelines, terminology, drug names and drug dosages), and is not responsible for any error and/or omissions arising from translation and adaptation or otherwise.