Article Text

Abstract
Background We explored whether the effectiveness of immune checkpoint inhibitors (ICIs) can be characterized by incorporating a composite of duration of response (DOR) to complement traditional Response Evaluation Criteria in Solid Tumors (RECIST) criteria for objective response rate (ORR) in an intent-to-treat (ITT) population. Furthermore, the correlation of this novel endpoint, characterized by the restricted mean time in response (RMTR), with overall survival (OS) will be examined.
Methods We analyzed ORR alone or in combination with DOR (RMTR) in available phase I, II, and III trials evaluating nivolumab monotherapy or in combination with ipilimumab across solid tumor types. ORR was evaluated per RECIST V.1.1. DOR was estimated using individual patient data in ITT populations regardless of RECIST response, with non-responders imputed as zero. Associations between ORR alone or RMTR and OS were evaluated in the ITT population. DOR curves were generated using the Kaplan-Meier product limit method, and 6-month RMTR, a measure of response durability, was derived from the area under the curves. For ORR and RMTR in the ITT population, the strength of association with OS was analyzed using Pearson correlation coefficients (r).
Results Nivolumab treatment was associated with longer response durations than active control in responder and ITT populations. Similarly, ORR and RMTR were both significantly correlated with OS (ORR vs OS: r=0.684, p=0.02; RMTR vs OS: r=0.695, p=0.018).
Conclusions Combining ORR and DOR (RMTR) to objectively characterize tumor shrinkage in an ITT patient population is a novel approach that appears to correlate well with OS in patients treated with nivolumab monotherapy or in combination with ipilimumab. This endpoint may provide a more complete characterization of tumor shrinkage to incorporate into the design of future ICI clinical trials. However, confirmation of this approach will require further research.
- immunotherapy
- programmed cell death 1 receptor
- CTLA-4 antigen
- clinical trials
- phase III as topic
This is an open access article distributed in accordance with the Creative Commons Attribution Non Commercial (CC BY-NC 4.0) license, which permits others to distribute, remix, adapt, build upon this work non-commercially, and license their derivative works on different terms, provided the original work is properly cited, appropriate credit is given, any changes made indicated, and the use is non-commercial. See http://creativecommons.org/licenses/by-nc/4.0/.
Statistics from Altmetric.com
Background
Immune checkpoint inhibitors (ICIs) have transformed the cancer treatment paradigm.1 2 ICIs can display different response patterns from molecularly targeted and cytotoxic agents.2–4 To address potential differences in response patterns, it may be important to select clinical trial designs, endpoints, and statistical methods that are appropriate for ICIs.1 While overall survival (OS) is the gold standard for defining clinical benefit, the required long follow-up may delay approval of effective treatments for patients with urgent unmet needs.2 5 6 Therefore, there is interest in identifying alternative endpoints that would help predict ICI response and survival benefits earlier, potentially expediting drug approval and patient access.7 Additionally, methods to more effectively capture and characterize tumor shrinkage as a suitable indicator of clinical outcome are needed.8 9
Objective response rate (ORR) is sometimes accepted as an endpoint supporting accelerated drug approvals.1 10 Reduction in tumor size is captured by ORR and considered by the US Food and Drug Administration (FDA) to be a predictor of clinical benefit, potentially allowing for earlier drug approvals than OS.11 Between March 2011 and August 2017, the FDA approved 25 ICI indications in advanced solid cancers, 15 (60%) of which were approved using ORR as the primary endpoint.1 ORR, however, has limitations associated with the categorical nature of Response Evaluation Criteria in Solid Tumors (RECIST) and does not completely characterize the duration (DOR) or depth (DepOR) of a response. While ORR is a direct measure of antitumor activity that can also be used to track changes in tumor burden status over time and provide a comprehensive assessment of disease status,12 ORR alone may not fully characterize ICI responses and benefits.13 DepOR is a more quantitative measure of tumor burden over time.14 Additionally, DepOR only measures the change in the sum of target lesions, but not non-target lesions, from baseline.15 The clinical significance and adequacy of ORR as a surrogate for marketing approval (accelerated and regular) are dependent on other factors, including the DOR, DepOR, and complete response (CR) rates.16 17
The FDA recommends DOR as a key factor when considering the adequacy of ORR to support approval.10 16 As relationships between endpoints may vary based on tumor type and ICI treatment,7 DOR can be tailored for milestone analyses appropriate to the natural history of the tumor type and ICI efficacy. DOR is described using median estimated rates with associated 95% CIs that are compared at the trial level using Kaplan-Meier (KM) plots.18 For patient-level representations, spider plots display individual tumor changes over time relative to baseline burden.19 Traditionally, these data representations of DOR have been based on the subset of responding patients, defined post randomization, and are thus prone to analysis-by-responder bias.20 New approaches to visually and statistically describe DOR in all randomized patients (ITT) are needed to avoid this bias.
Although DOR alone has not been validated as an endpoint supporting drug approval, several ICIs received accelerated approval based on its combination with ORR.21–24 A phase III trial of patients with melanoma receiving an oncolytic virus showed that durable responses (≥6 months) were associated with clinical benefits, including significant OS improvements and clinically meaningful quality of life improvements.25 However, associations between ORR and DOR with OS for immunotherapy have not been established, and DOR neither as an independent measure of clinical benefit nor in combination with ORR has been fully evaluated.
We assessed DOR with nivolumab monotherapy or in combination with ipilimumab in responder and ITT populations using data from phase I, II, and III studies across solid tumors. To explore effective ways to visually represent and statistically analyze DOR, we evaluated the relationship between the combination of ORR and DOR (characterized by the restricted mean time in response (RMTR)) or ORR alone with OS in the ITT population.
We propose a novel approach combining ORR and DOR (RMTR) to objectively and visually characterize tumor shrinkage in the ITT population, which our results suggest correlates with OS and helps capture clinical responses to immunotherapy.
Methods
We retrospectively analyzed available patient-level data from completed, large, phase III, active-control, registrational trials conducted by Bristol Myers Squibb (BMS) of nivolumab as monotherapy or in combination with ipilimumab using chemotherapy as a comparator for approved indications in non-small-cell lung cancer (NSCLC), melanoma, renal cell carcinoma (RCC), and squamous cell carcinoma of the head and neck (SCCHN). For further illustration, the DOR analyses also included phase I and II, single-arm, BMS trials from NSCLC (CheckMate 012) and melanoma (CheckMate 069) that were supportive for regulatory submissions and contained the necessary endpoints. Analyses of potential differences in DOR were performed in ITT and responder populations using data from select NSCLC and melanoma trials. We evaluated associations of OS with ORR alone and in combination with DOR, measured by the RMTR, using individual patient data from randomized phase III trials across NSCLC, melanoma, RCC, and SCCHN.
Definitions
Tumor responses were evaluated per RECIST V.1.1 by local investigators and/or blinded, independent, central review (BICR) (as appropriate for each study). DOR was the time between first CR or partial response (PR) and first documented tumor progression or death due to any cause.26 27 Patients starting subsequent anticancer therapy without prior reported progression were censored for DOR at the last evaluable tumor assessment prior to initiating subsequent therapy. ORR was the proportion of patients who achieved a CR or PR. OS was the time from randomization to death from any cause; patients alive at data cut-off were censored at the last known alive date. The responder population only included patients with a CR or PR. The ITT analysis population included patients regardless of RECIST response (ie, CR, PR, stable disease, progressive disease, non-evaluable disease, or missing response), and non-responders were imputed with a value of zero.
DOR analyses
DOR was estimated using individual patient-level data in responder and ITT populations. DOR curves were generated using the KM product limit method for each treatment arm for the investigator-assessed and/or BICR-assessed responder population and the ITT population. Median DOR along with two-sided 95% CIs, based on log–log transformed CIs for the survivor function, were calculated. Treatment effects were estimated using the Cox-proportional hazards model to calculate HRs as has been done previously.28–30 Statistical testing for differences in KM curves utilized the log-rank test. RMTR is the same as the area under the DOR curve, which is how it represents a robust measure of the average time in response for all randomized patients. Differences in RMTR can be used as a measure of treatment effect. Estimates of response rates at specific time points (0, 6, 12, 18, and 24 months) were calculated based on KM plots. The primary time point analyzed was RMTR through 6 months unless otherwise noted, as other time points provided similar results.
Analyses of associations between ORR and OS and the combination of ORR with DOR and OS
RMTR was calculated through 6 months using the area under DOR KM curves. Associations between OS HRs and the differences in ORR and RMTR were summarized by Pearson correlation coefficients (r) computed using the linear regression model, with r values close to 1 indicating strong associations.
Results
Nine completed phase I, II, and III trials (n=3551) of nivolumab monotherapy or combination therapy with ipilimumab for NSCLC (CheckMate 012, 017, 026, 057, and 063) or melanoma (CheckMate 037, 066, 067, and 069) were selected to study DOR differences in patients treated with ICI therapy compared with chemotherapy (table 1). Associations between ORR and RMTR with OS were evaluated using individual patient data from nine randomized phase III studies (n=5323; table 1) across multiple indications (melanoma: CheckMate 037, 066, and 067; NSCLC: CheckMate 017, 026, and 057; RCC: CheckMate 025 and 214; SCCHN: CheckMate 141).
Monotherapy and combination studies of nivolumab in NSCLC and melanoma included in DOR analyses
DOR analyses in patient responders from NSCLC and melanoma studies
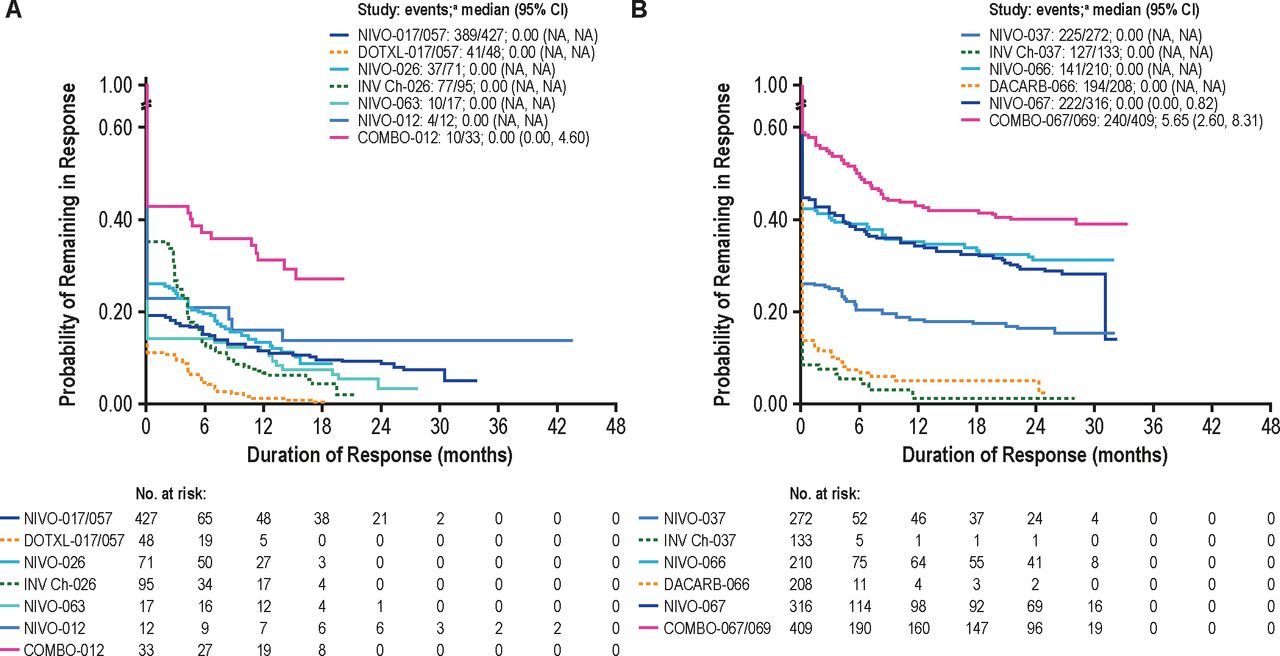
Five completed NSCLC studies (CheckMate 012, 017, 026, 057, and 063) were included in DOR analyses of investigator-assessed and/or BICR-assessed responders (n=359).4 31–34 Patients treated with nivolumab alone or combined with ipilimumab showed more durable responses than patients treated with available chemotherapy across all NSCLC studies (figure 1A).

Kaplan-Meier plots of DOR in all responders in (A) NSCLC and (B) melanomab studies. COMBO, combination NIVO+IPI therapy; DACARB, dacarbazine; DOR, duration of response; DOTXL, docetaxel; INV Ch, investigator’s choice chemotherapy; IPI, ipilimumab; MONO, NIVO monotherapy; NA, not applicable; NIVO, nivolumab; NSCLC, non-small-cell lung cancer. aAn event stands for non-responder or initial responder subsequently having lost response (eg, disease progression). bEach pairwise comparison from study 067 was included.
DOR KM curves for all patient responders were also calculated for patients from four melanoma studies (n=585; CheckMate 037, 066, 067, and 069; figure 1B).35–38 Similar to DOR analyses in NSCLC, nivolumab regimens produced durable responses in patients with melanoma, with prolonged DOR (>30 months) observed across all studies.
DOR analyses of the ITT population in NSCLC and melanoma studies
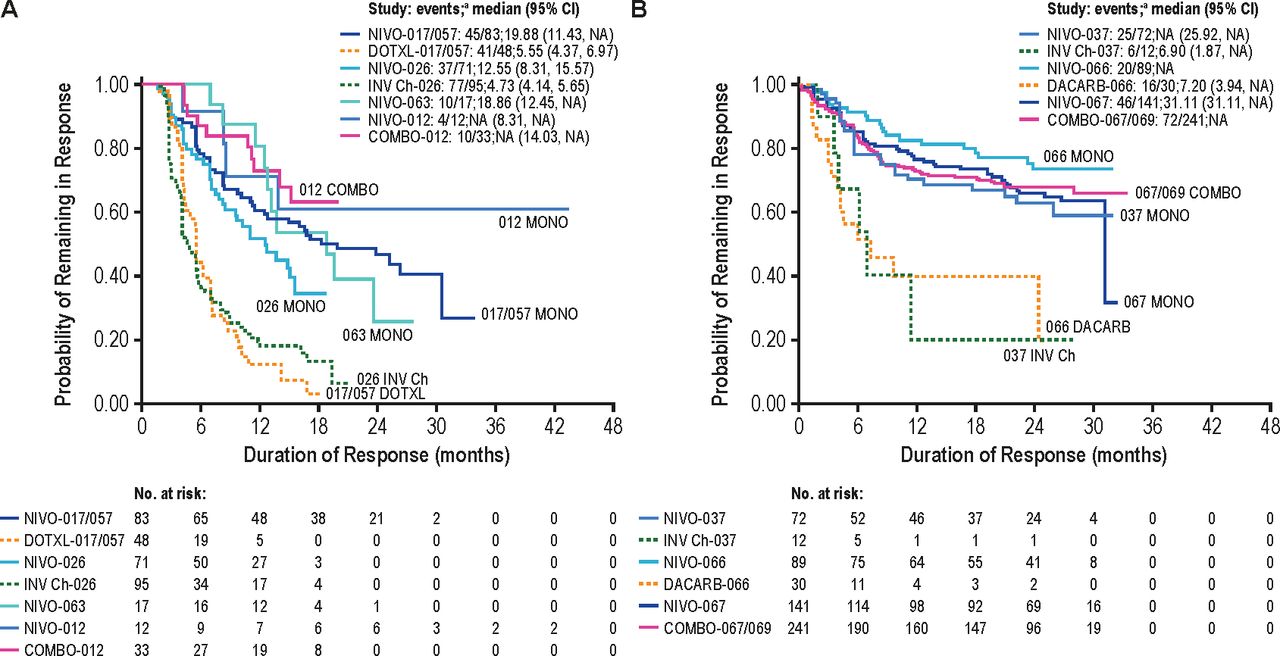
DOR was further analyzed in the ITT population (n=1641) from five NSCLC studies, which included all patients regardless of RECIST response with non-responders imputed as zero.4 31–34 Nivolumab monotherapy or in combination with ipilimumab was associated with prolonged DOR in the NSCLC ITT population (figure 2A). This figure further illustrates how combining ORR with DOR can be presented visually and in a way that is more clinically informative than either endpoint alone. For example, the initial drop in the KM curve and the estimate at 0 months is the estimate of the ORR, while DOR is illustrated by the remainder of the KM curve; the visual representation tells more about the course of treatment over time (eg, altering natural history of the tumor). For example, KM curves that are flat over time represent patients with a longer DOR, while KM curves with many step-downs represent declining DOR over time. Therapeutic response can be assessed by both magnitude (ORR) and duration (DOR).17 Combining ORR analyses with DOR can provide a comprehensive measure of tumor responses that is more clinically informative than either endpoint alone. For example, in figure 2B, the line for NIVO-037 crosses the 0-month x-axis at 26.5%, which represents the ORR (table 1), while the percentage of responders still in response at different time points (6, 12, and 30 months) is presented by the remainder of the DOR KM plot. Figure 2B further shows that nivolumab monotherapy and combination therapy with ipilimumab produced greater response rates with longer DOR (>30 months) observed across all studies versus active control.
Kaplan-Meier plots of DOR analyses in the ITT population for all randomized patients with (A) NSCLC and (B) melanomab. COMBO, combination NIVO+IPI therapy; DACARB, dacarbazine; DOR, duration of response; DOTXL, docetaxel; INV Ch, investigator’s choice chemotherapy; IPI, ipilimumab; ITT, intent-to-treat; NA, not applicable; NIVO, nivolumab; NSCLC, non-small-cell lung cancer. aAn event stands for non-responder or initial responder subsequently having lost response (eg, disease progression). bStudy 069 did not contain a NIVO monotherapy arm.
Similar to results from NSCLC studies, DOR analyses of the ITT population (n=1548) from melanoma studies (figure 2B) showed that both nivolumab monotherapy and combination therapy with ipilimumab produced greater response rates with longer DOR (>30 months) observed across all studies versus active control.35–38
Combining ORR with DOR analyses in the ITT population
Estimates of RMTR were investigated in ITT populations from CheckMate 026, an NSCLC study that did not meet its primary endpoint of progression-free survival (PFS), and CheckMate 066, a melanoma study that met its primary endpoint of OS.32 CheckMate 026 was used to demonstrate different ways that the combination of ORR with DOR can be summarized and compared in the ITT population for a negative study and to summarize RMTR estimates in the NSCLC population (figure 3A). Curves for nivolumab can be compared with chemotherapy using traditional log-rank tests (p=0.175) and treatment effects estimated with typical HRs and 95% CIs (0.98 (0.82 to 1.18)). Additionally, milestone ‘survival’ rates can be reported as KM estimates at specific time points (eg, 6, 12, and 18 months (20.1% vs 13.3%, 13.6% vs 7.0% and 9.2% vs 4.8%, respectively)). RMTR can also be assessed through certain time points; here, a 12-month time point was chosen to represent RMTR as the average time in response for the first year. Finally, treatment benefits can be estimated as differences in RMTR between groups and represent the difference in average time in response over the first year. At 12 months, RMTR (95% CI) was 2.4 (1.87 to 2.93) months for nivolumab and 2.2 (1.76 to 2.64) months for investigator’s choice chemotherapy; a difference of 0.2 months in the first year (figure 3A).
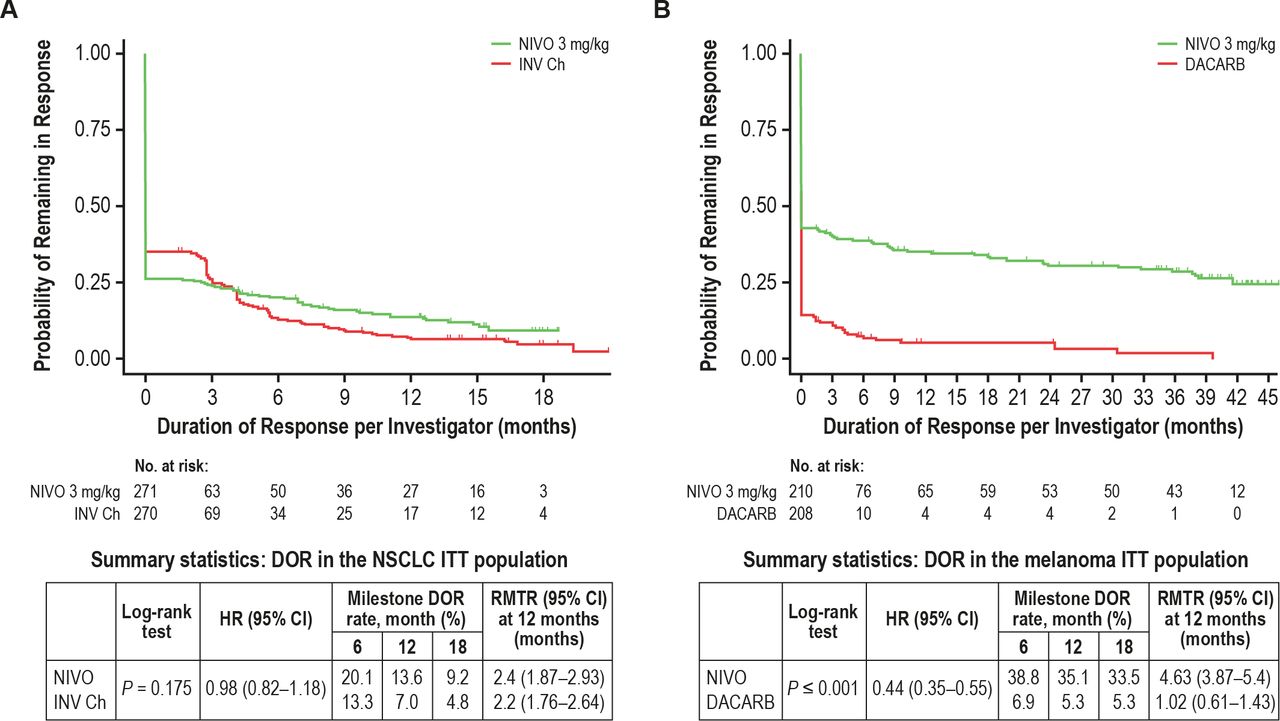
(A) DOR for the NSCLC ITT population treated with nivolumab (green curve) compared with investigator’s choice chemotherapy (red curve) in the CheckMate 026 trial. (B) DOR for the melanoma ITT population treated with nivolumab (green curve) or dacarbazine (red curve) in the CheckMate 066 trial. DACARB, dacarbazine; DOR, duration of response; INV Ch, investigator’s choice chemotherapy; ITT, intent-to-treat; NIVO, nivolumab; NSCLC, non-small-cell lung cancer; RMTR, restricted mean time in response.
CheckMate 066 was used to demonstrate combining ORR with DOR in the ITT population for a positive study and to summarize RMTR estimates in the melanoma population.36 DOR curves for nivolumab versus dacarbazine were compared using traditional log-rank tests (p≤0.001), and treatment effects were estimated with a HR (95% CI) of 0.44 (0.35 to 0.55). Milestone survival rates were 38.8 versus 6.9 at 6 months, 35.1 versus 5.3 at 12 months, and 33.5 versus 5.3 at 18 months, respectively. At 12 months, the RMTR (95% CI) was 4.63 (3.87 to 5.4) months for nivolumab and 1.02 (0.61 to 1.43) months for dacarbazine, a difference of 3.6 months in the first year (figure 3B).
These two examples illustrate the value of RMTR. Figure 3A provides a scenario where RMTR (at time point 0), by incorporating DOR, shows a change in direction of the treatment comparison between nivolumab and investigator’s choice chemotherapy relative to response rates. While RMTR shows an average time in response of 2.4 months over the first 12 months for nivolumab, compared with an RMTR of only 2.2 months for investigator’s choice chemotherapy, response rates were ~25% and ~33% for nivolumab versus investigator’s choice chemotherapy, respectively, as seen from at time point 0 in the figure. In contrast to this first example, figure 3B provides an example of more consistent treatment comparisons when analyzing ORR and RMTR. Response rates of ~40% and ~14% were observed for nivolumab and dacarbazine, respectively, while RMTRs were 4.63 and 1.02 months over the first 12 months for nivolumab and dacarbazine, respectively.
Associations between OS and RMTR and between ORR and OS in the ITT population across different tumor types
A total of 5323 patients in 9 phase III randomized studies across tumor types (NSCLC, melanoma, RCC, and SCCHN) were evaluated for OS, ORR, and RMTR.4 32 35–42 Table 1 summarizes the objectives, study designs, treatment regimens, and previously reported ORR and OS results from these studies.
The relationships between treatment-related differences in RMTR and ORR, separately, with OS were assessed in the ITT population (figure 4). A significant correlation between 6-month treatment differences in ORR and HRs for OS was observed (r=0.684; p=0.02; figure 4A). Similarly, a comparable significant correlation was observed between OS HRs and RMTR treatment differences at the 6-month cut-off (r=0.695; p=0.018; figure 4B). Correlations between RMTRs and HRs for OS at other cutoffs (3, 12, 18, and 24 months) were similar (figure 5).
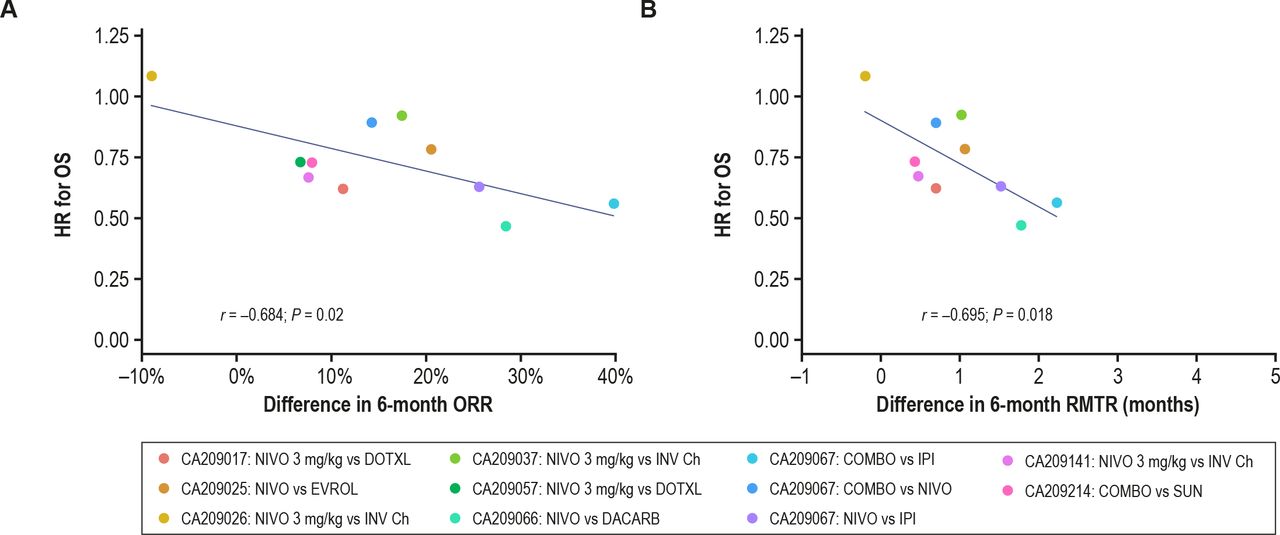
OS HR relationships between treatment arms at 6 months. Blue lines indicate a line of best fit from a linear regression model. (A) Relationship between the differences in ORR treatment differences and OS HRs. Each data point corresponds to an individual trial. (B) Correlation of the RMTR differences for combined ORR and DOR (RMTR) with the OS HRs. COMBO, combination NIVO+IPI therapy; DACARB, dacarbazine; DOR, duration of response; DOTXL, docetaxel; EVROL, everolimus; INV Ch, investigator’s choice chemotherapy; IPI, ipilimumab; NIVO, nivolumab; ORR, objective response rate; OS, overall survival; RMTR, restricted mean time in response; SUN, sunitinib.

OS HR relationships between treatment arms at various time points. Blue lines indicate a line of the best fit from a linear regression model. Correlation of the RMTR differences for combined ORR and DOR (RMTR) with the OS HRs at (A) 3 months, (B) 12 months, (C) 18 months, and (D) 24 months. COMBO, combination NIVO+IPI therapy; DACARB, dacarbazine; DOR, duration of response; DOTXL, docetaxel; EVROL, everolimus; INV Ch, investigator’s choice chemotherapy; IPI, ipilimumab; NIVO, nivolumab; OS, overall survival; RMTR, restricted mean time in response; SUN, sunitinib.
Discussion
These results demonstrate how tumor shrinkage can be characterized using DOR or a combination of DOR and ORR (RMTR) in the ITT populations of patients treated with ICIs across multiple tumor types. Combining ORR analyses with DOR can provide a comprehensive measure of tumor responses that cannot be obtained from ORR analyses alone. Nivolumab monotherapy or combination therapy with ipilimumab appears to be associated with a longer DOR versus active control in both responder and ITT populations. To our knowledge, this is the first report of an association between RMTR and OS in patients from an ITT population treated with ICIs. The novel endpoint RMTR may influence clinical trial design and complement traditional endpoints such as OS to capture responses to immunotherapy.
RMTR is a robust, clinically interpretable measure of the average time in response that can be applied to an ITT patient population and used as an alternative measure of treatment effect.43 As an endpoint, RMTR may be an earlier efficacy readout and may capture unique aspects of ICI treatment benefits compared with traditional endpoints. This may impact patient care, as earlier treatment decisions could be made about continuing or switching treatments. Response durability is often measured by comparing DOR between treatment arms among responders.28 Longer maintenance of response associates with lack of disease progression; a reasonable indication that OS should be extended as well. Thus, a novel composite of ORR and DOR could provide more comprehensive information on clinical responses with ICIs than ORR alone.
Advantages of tumor-based endpoints, such as DOR and ORR, compared with time-to-event endpoints, such as OS and PFS, are that the former can be directly attributed to the therapy and might provide an earlier readout of drug activity.13 44 In our study, RMTR and OS were correlated at 6, 12, 18, and 24 months, with similar levels of significance observed at all time points. These preliminary findings suggest that a 6-month cut-off is a reasonable duration of follow-up for DOR/RMTR analyses of ICIs.
ICIs can pose unique challenges for clinical trial design in part related to their mechanisms of action, including heterogeneous mechanisms of primary and acquired resistance, potentially delayed onset of immunologic responses, and optimization of dosing and duration.45 ORR and response duration are important for evaluating efficacy of oncology therapeutics. A measure characterizing both of these responses, such as RMTR, is likely to be a reliable predictor of long-term clinical benefits.
We provide preliminary evidence that RMTR appears to be comparable to ORR alone in its association with survival outcomes across multiple tumor types. However, prospective studies and analyses comparing DOR and RMTR with other endpoints (eg, PFS, durable response rate25) are needed to learn about their potential utility in clinical trials and how these novel endpoints compare with traditional RECIST measures of tumor response. Higher-level evidence is required to extensively establish surrogacy for OS.
In recent years, several approved immunotherapies have demonstrated durable responses,28 46 47 and accelerated approvals have been granted based on ORR.10 However, strong associations between ORR and OS for ICIs have yet to be established. Our identification of a significant association between ORR and OS is novel, and differs from recent meta-analyses, which reported only weak associations in studies of both immunotherapies and targeted therapies.7 44 48–50 Weak correlations in these analyses were likely related to multiple factors, including a crossover study design, patients continuing on additional therapies, long postprogression survival, study heterogeneity (involving sample sizes, disease types and settings, lines of therapy and follow-up durations), and antitumor mechanisms of action associated with ICIs that may contribute to delayed responses or pseudoprogression, which may lead to premature treatment cessation.7 44 48 49
An FDA-sponsored meta-analysis of 14 randomized, active-controlled trials of targeted and standard therapies including 12 567 patients with advanced NSCLC found no association between ORR and OS (R2=0.09; 95% CI 0 to 0.33).44 The authors suggested that ORR alone may not be the optimal endpoint for the expedited approval of cytotoxic therapies or immunotherapies.44 Another meta-analysis of 13 randomized, multicentre, active-controlled trials of immunotherapies submitted for FDA approval found that the association between ORR and OS was weak (R2=0.1277).48 Unlike the data presented here, which used differences in response rates to assess the relative effects of ORR, this previous study used ORs. An inherent challenge with ORs is the potential exaggeration of small differences, a significant issue when response rates are low. In contrast, our approach utilized differences in ORR that have a simpler interpretation based on absolute numbers rather than ratios. Unlike the previously reported study-level meta-analyses, individual patient-level data in this study were analyzed, providing more precision to the association analyses between ORR and DOR with OS. Another possible reason for different results could be that both meta-analyses only included trials submitted for regulatory approval which were positive and thus subject to selection bias, whereas our study included both positive and negative trials.44 48
Advantages and limitations of DOR in the ITT population
DOR analyses have traditionally been based on the subset of responding patients, defined post randomization, and thus subject to analysis-by-responder bias, which may cause overestimation of treatment effects.28 However, assessing DOR in the ITT population could reduce the potential bias caused by exclusion of non-responder patients. The value of the ITT approach versus a responder subgroup analysis is that it could increase accuracy of predicting outcomes. Here, we show that DOR and DOR in combination with ORR (RMTR) can be analyzed in the ITT population to help define clinically meaningful responses with ICIs.
Our results from trials of nivolumab monotherapy and nivolumab in combination with ipilimumab across multiple tumor types demonstrated that treatment differences for both ORR and RMTR in the ITT population appeared to be significantly associated with OS. Importantly, DOR together with ORR could potentially be a reliable endpoint for characterizing tumor shrinkage in an overall ITT patient population that also associates with survival benefit. DOR combined with ORR can be characterized in multiple ways, including KM curves, RMTR, medians and milestone analyzes. Furthermore, visual representations like KM curves may allow prescribers to easily observe both response rates and duration.
Our novel approach using a composite endpoint of ORR and DOR in the ITT population may be particularly important in the immunotherapy era, in part because it may account for some of the nuances of responses that occur with ICIs. Our analysis of the area under the DOR curves to estimate RMTR in the ITT population is also an innovative approach for characterizing responses with ICIs.
Our study is limited by potential bias associated with retrospective analyses.51 However, we have provided data that establish a rationale for prospective studies of associations between DOR/RMTR and OS. RMTR in the ITT population as a potential endpoint has limitations. First, HR estimates are not readily interpretable because of ‘non-proportional hazards’. When the proportional hazard assumption is violated, it limits the interpretation of HR, as it is not clear with which estimate the HR is associated.52 Second, RMTR estimates require a time-point cut-off and benefits associated with an extended duration may be missed. In addition to response bias, DOR assessment can be influenced by varied frequencies of follow-up and tumor re-evaluation.53 Larger prospective studies are needed to determine whether the combined ORR and DOR strategy may be a reliable and earlier indicator of survival benefit.
Another study limitation was that in our pooled analysis of patients receiving either first-line or subsequent lines of nivolumab, the potential impact of treatment line on our results is uncertain. In addition, our study did not assess responses by tumor type; however, there are visual differences between the NSCLC and melanoma graphs (figures 1, 2 and 5). The potential impact of treatment line and tumor type on RMTR should be studied further.
Overall, our results suggest that the association between OS and the combination of higher ORR with prolonged DOR is consistent with that of ORR alone. DOR in conjunction with ORR has the potential to both characterize tumor shrinkage and potentially predict OS benefit. This endpoint combination may be useful in early-stage clinical development to characterize a drug candidate’s potential for survival benefit early on during a clinical study or to accelerate approval in late-stage ICI development.
Conclusions
ORR and RMTR appear to be associated with survival in patients treated with nivolumab monotherapy or with nivolumab plus ipilimumab combination therapy across multiple tumor types. Combining ORR and DOR to evaluate ICI therapy provides a visual, less biased and more informative analysis of the ITT population. Results showed similar associations of this combined endpoint to OS as ORR alone. The novel combination of ORR and DOR (RMTR) is a potentially useful and reliable endpoint for characterizing tumor shrinkage and clinical benefit, that is associated with OS. Our findings provide a strong rationale for further studies needed to establish the potential clinical utility of this endpoint. Further exploration of DOR and RMTR endpoints is warranted, particularly with new therapeutic modalities that have novel mechanisms of action or that involve novel drug combinations involving immunotherapy.
Acknowledgments
The authors would like to thank the patients, their families, and all investigators involved in this study. Computational and analytical support was provided by David Paulucci. Professional medical writing and editorial assistance were provided by Katherine Groschwitz, PhD, and Jay Rathi, MA, of Spark Medica, funded by Bristol Myers Squibb, according to Good Publication Practice 3 guidelines. The sponsor was involved in the study design, collection, analysis, and interpretation of data and information provided in the manuscript. However, the ultimate responsibility for opinions, conclusions, and data interpretation lies with the authors.
References
Footnotes
Contributors All authors contributed to the development of this primary manuscript, wrote, edited, and reviewed the drafts, and approved the final manuscript.
Funding This study was supported by Bristol Myers Squibb.
Competing interests All authors are employees/former employees and hold stock and/or other ownership interests in Bristol Myers Squibb, which funded the study.
Patient consent for publication Not required.
Provenance and peer review Not commissioned; externally peer reviewed.
Data availability statement Data are available upon reasonable request. Bristol Myers Squibb’s (BMS’) policy on data sharing can be found at: https://www.bms.com/researchers-and-partners/independent-research/data-sharing-request-process.html. All data requests/proposals are reviewed internally by a qualified panel of BMS experts that are familiar with the data. The BMS team ensures the proposal is complete, the scientific request is valid, and the data are available, consistent with safeguarding patient privacy and informed consent. In-scope proposals are sent to an Independent Review Committee (IRC) to review and provide the final decision on the requests. BMS has established a relationship with Duke University through the Duke Clinical Research Institute (DCRI) to act as that IRC. The IRC ensures that qualifying requests for patient-level data have a complete, consistent, and fair assessment. They also review the proposal with the research team and discuss any clarifying questions that would better support the decision on the proposal. The IRC membership represents three broadly defined areas of expertise: clinical, statistical and bioethical/protection of human subjects. They also contract with additional experts depending on the request, therapeutic area, or other relevant factors.