Article Text

Abstract
Background The interplay of immune and cancer cells takes place in the tumor microenvironment where multiple signals are exchanged. The transforming growth factor beta (TGFB) pathway is known to be dysregulated in lung cancer and can impede an effective immune response. However, the exact mechanisms are yet to be determined. Especially which cells respond and where does this signaling take place with respect to the local microenvironment.
Methods Human non-small cell lung cancer samples were retrospectively analyzed by multiplexed immunohistochemistry for SMAD3 phosphorylation and programmed death ligand 1 expression in different immune cells with respect to their localization within the tumor tissue. Spatial relationships were studied to examine possible cell-cell interactions and analyzed in conjunction with clinical data.
Results TGFB pathway activation in CD3, CD8, Foxp3 and CD68 cells, as indicated by SMAD3 phosphorylation, negatively impacts overall and partially disease-free survival of patients with lung cancerindependent of histological subtype. A high frequency of Foxp3 regulatory T cells positive for SMAD3 phosphorylation in close vicinity of CD8 T cells within the tumor discriminate a rapidly progressing group of patients with lung cancer.
Conclusions TGFB pathway activation of local immune cells within the tumor microenvironment impacts survival of early stage lung cancer. This might benefit patients not eligible for targeted therapies or immune checkpoint therapy as a therapeutic option to re-activate the local immune response.
- lung neoplasms
- tumor microenvironment
This is an open access article distributed in accordance with the Creative Commons Attribution Non Commercial (CC BY-NC 4.0) license, which permits others to distribute, remix, adapt, build upon this work non-commercially, and license their derivative works on different terms, provided the original work is properly cited, appropriate credit is given, any changes made indicated, and the use is non-commercial. See http://creativecommons.org/licenses/by-nc/4.0/.
Statistics from Altmetric.com
Background
The tumor microenvironment (TME) is a complex niche of cancer cells and mesenchymal progenitor cells, cancer-associated fibroblasts (CAFs), various immune cells, blood vessels and the extracellular matrix (ECM). Cell-cell contacts as well as paracrine signals are regarded as important for the immunosuppressive environment that facilitates cancer growth and invasion on multiple levels.1–3 The dynamic interplay of local immune cells and tumor cells are the basis of the cancer immune-editing concept4 5 and the cancer-immunity cycle.6–9 Despite the remarkable results observed in the clinics, immune checkpoint therapies encounter challenges mediated by primary, adaptive and acquired resistances.10 Improved knowledge about the TME and immune contexture11 may lead to therapies focusing on TME normalization.12 Cancer-intrinsic oncogenic pathways might constitute a promising target to prevent primary resistances as it has been observed for β-catenin inhibited T cell infiltration in melanoma.13 Therefore, combination treatments focusing on damaging cancer cells or inhibiting immune-checkpoint interaction, and aiming at multiple factors and pathways bear the potential to enhance anticancer therapy.14
Transforming growth factor beta (TGFB) is a pleiotropic cytokine involved in suppressive and inflammatory immune responses,15 exerts a tumor-progressive or tumor-suppressive role16 17 and has become a promising target for enhancing anticancer therapies.18–23 The TGFB cytokine is usually found in the extracellular matrix in an inactivated state or secreted by various cell types. On binding to the transforming growth factor beta receptor II (TGFBRII), a heterodimer is formed together with the transforming growth factor beta receptor I (TGFBRI) that leads to the activation of the TGFBRI serine-threonine kinase and subsequent downstream phosphorylation of the signal mediators SMAD2 and SMAD3. SMAD2/3 translocate into the nucleus together with SMAD4 and regulate the transcriptional responses in combination with various co-factors which lead to context-dependent responses.17 Non-small cell lung cancer (NSCLC) as identified by histology is a leading cause of death worldwide, accounting for 1.6 million fatal outcomes annually,24 and exhibits elevated tumor-intrinsic TGFB signaling.25 NSCLC is known to induce immunosuppression via increased Foxp3 abundance,26 increased B7-H3 expression on dendritic cells27 and a epithelial-mesenchymal-transition (EMT) phenotype.28 Little is known about direct influence of the TGFB downstream signaling mediator SMAD3 aside from binding to promotor regions of T cell effector genes granzymes and perforin29 or programmed cell death protein 1.30 We therefore made use of spatially resolved, multiplexed immunohistochemistry (mIHC) to allow simultaneous targeting of different markers within formalin-fixed, paraffin-embedded (FFPE) tissues. Spatial analysis of cells within the TME has recently attracted attention,31–34 as it has been shown for oral squamous cell carcinomas that the amount of Foxp3 cells in the vicinity of CD8 cells35 allowed prognostic risk stratification. We therefore aimed to analyze the TGFB pathway activity as indicated by phosphorylation of SMAD3 (pSMAD3) in various immune cell populations with special emphasis on their spatial relationships in the TME.
Methods
Patient cohort
A cohort of 197 patients diagnosed between 2012 and 2016 with NSCLC and submitted with curative intent for surgery at the LungenClinic Großhansdorf was assembled retrospectively from material stored at the local biobank at the Research Center Borstel. Please see online supplemental table 1 for cohort details. During the follow-up phase (until September 2018), 33 events (deaths) were observed.
Supplemental material
Tissue microarray
Tissue microarrays (TMAs) were constructed from FFPE material based on individual review of each sample by an expert histologist (SM) to annotate regions without necrosis at the center and the margin of each tumor. Four punches (1.0 mm diameter) were extracted from every sample to obtain two technical replicates from each location (margin/center) per patient’s tumor.
Multiplexed immunohistochemistry
TMA blocks were cut on a microtome, mounted on SuperFrost+slides (Menzel Gläser, Braunschweig, Germany) and left to adhere on a heating plate at 37°C. Deparaffinization was conducted according to standard procedures and re-hydrated slides transferred to Milli-Q grade water. A circle was drawn around the tissue area using a Pap pen and the slides placed in a cuvette with either AR6 or AR9 antigen-retrieval buffer (Akoya Biosciences, Menlo Park, California, USA) and transferred into a microwave (Panasonic Genius Sensor 1250W). Heat-induced antigen-retrieval was conducted for 1 min at 1250 W followed by 10 min at 125 W. Finally, the slides were allowed to cool down under running tap water until transfer into 1× Tris-Buffered Saline - Tween20 (TBS-T). In general, all incubations were conducted in a dark moisture chamber and at 300 rpm on an orbital shaker. Applied liquids were removed and washed three times with TBS-T after each step. One cycle of the mIHC protocol consisted of 15 min of quenching of endogenous peroxidases using 150 µL Perox Abolish (Biocare Medical, Pacheco, California, USA) followed by incubation with the primary antibody diluted in Renaissance Background Reducing Diluent (Biocare Medical) for 45 min and subsequent incubation with antimouse/antirabbit HRP polymer (Akoya Biosciences) for 10 min. Tyramide-signal amplification (TSA) reaction with OPAL fluorochromes was performed with each OPAL-TSA conjugate diluted 1/150 in TSA plus reaction buffer with 10 min of enzyme reaction time or 15 min for pSMAD3, respectively, followed by washing in 1× TBS-T. The following antibodies were used: rabbit antiphospho SMAD3 (clone C25A9, Cell Signaling Technologies; 1–100, pH6), rabbit anti-Ki67 (clone D2H10, Cell Signaling Technologies; 1–50, pH6), rabbit anti-programmed death ligand 1 (anti-PD-L1) (clone E1L3N, Cell Signaling Technologies, 1–250, pH6), rabbit anti-CD3 (clone SP7, Abcam, 1–50, pH6), mouse anti-pan-cytokeratin (anti-panCK) (clone AE1/AE3, Dako, 1–300, pH6), mouse anti-Foxp3 (clone 23A/E7, Abcam; 1–100, pH9), rabbit anti-CD8 (clone SP16, Abcam; 1–300, pH6) and mouse anti-CD68 (clone KP1, Ventana, ready-to-use; pH6). Finally, spectral DAPI (1/500 in phosphate-buffered saline) was applied and incubated for 10 min followed by three times washing with TBS-T and one washing step with Milli-Q grade water. Hard-set Vectashield mounting medium (Vector Laboratories, Burlingame, California, USA) was used to apply cover slips (1 mm thickness) and mounted slides were allowed to harden prior to scanning. Staining of each marker in a multiplex panel was validated with IF monoplex stains to result in comparable staining patterns (data not shown). Positions and combination of fluorochromes in multiplex-panels were as following: 4-plex panel: (1) Ki67 (OPAL 520), (2) CD3 (OPAL 620), (3) pSMAD3 (OPAL 690) and (4) panCK (OPAL 540); 6-plex panel: (1) Foxp3 (OPAL 520), (2) PD-L1 (OPAL 540), (3) CD8 (OPAL 570), (4) pSMAD3 (OPAL 620), (5) CD68 (OPAL 650) and (6) panCK (OPAL 690). The 6-plex panel was run on an automated staining system (Bond RX, Leica Biosystems, Nussloch, Germany).
Image acquisition mIHC stained slides were scanned on a Vectra Polaris (Akoya Biosciences) as a .qptiff file at 0.5 µm pixel resolution using the 20× objective with saturation protection as a whole-slide overview. MSI high-power regions of complete TMA cores were annotated using the TMA function of the Phenochart software (Akoya Biosciences) by placing a grid with 1.2 mm punch diameter. A spectral library was constructed by using single-plex panCK stains with each OPAL-fluorochrome. The same spectral library was used for all analyzed mIHC panels throughout the experiments.
Image selection and analysis
InForm V.2.4.1 as well as multiband V.0.8.65 and the PhenoptR R package were used for subsequent image analysis. In general, slides which were stained together were also incorporated into the same inForm project. Multiple representative .im3 images showing the observed variability for each protein marker with regard to abundance and intensity were selected for training purposes within inForm software. In general, user-guided training for tissue segmentation or phenotyping was conducted in an iterative manner: in case batch analysis of the complete dataset for each panel resulted in false negative/false positive annotated tissue regions or cellular phenotypes, the images with questionable results were imported into each project and added to the training dataset to improve classification accuracy of each machine learning algorithm. Once segmentation accuracy, cell segmentation results and phenotyping accuracy reached satisfactory level, the algorithm was locked down and used for batch analysis among all images. Consistently misclassified images and results were omitted rigorously.
Tissue segmentation
Machine learning-based trainable tissue segmentation was conducted using inForm software (Akoya Biosciences) with three different tissue categories to be trained on: ‘Tumor’, ‘Stroma’ and ‘Other’. User-annotated training regions for tumor identification included pan-CKlow expressing regions and different histological entities (adenocarcinoma and squamous cell carcinoma) to account for the histological variability. Overall tissue segmentation accuracy among the different staining panels was at least 95%.
Cell segmentation
Adaptive cell segmentation or object-based algorithm from the inForm software V.2.4.1 were used.
Phenotyping
Machine learning-based classification and counting of cellular phenotypes was performed by the use of inForm software on cell lineage markers (CD3, CD8, Foxp3, pan-CK and CD68) and binary markers (Ki67 positive or negative) to result in single positive events or double positive events. Selection of representative cellular phenotypes was done by manual annotation of respective segmented cells within inForm software and on multiple images from different samples. For each cellular phenotype in a given panel, annotation was conducted by manual selection of cells which exhibit the whole range of observed variability. Final analysis of machine learning-based classification was conducted in an iterative manner based on results from batch analysis of the complete dataset for each panel. Identification of continuous markers (pSMAD3, PD-L1) was conducted using the PhenoptR R package and intensity thresholding for each marker. These individual intensity thresholds values were used as cut-offs within the PhenoptR R package to compute combination of markers using the ‘phenotype_rules’ function. Enumeration of all possible phenotypes was performed using the ‘count_within_batch’ function on all samples of a panel and parsing the ‘categories’ function the desired tissue category (Tumor and Stroma) to be investigated for the defined phenotypes.
Spatial analysis of mIHC
The PhenoptR R package was used for analysis of spatial relationships among certain cellular phenotypes within the ‘cell_seg_data’ files exported from inForm software. For this, the ‘count_within_batch’ function was applied. Multiple pairings were subjected as a list and ‘radii’ were defined as the area (µm) around a given phenotype that was to be interrogated for the mean number of another phenotype: the argument ‘base cell (ie, CD8)’,’target cell (ie, Foxp3)’ used as a ‘pair’ will result in the mean number of Foxp3 cells in a given distance around one CD8. To account for unequal distribution within a tissue category and sample, the resulting mean number of target cells (ie, Foxp3) was divided by the overall number of base cells (ie, CD8) in the respective tissue category.
Data normalization
The data from enumeration of cellular phenotypes were further annotated with the results from tissue segmentation to allow downstream normalization of cell counts to the area of each tissue category (Tumor/Stroma) resulting in quantitative cell counts/mm2 for each category. Normalized cell counts of each TMA core were then used to compute the mean value among the two technical replicates from each patient to result in mean normalized cell counts/mm2 of a given tissue category and sample location (tumor center vs tumor margin). In case of positivity for multiple markers for a given cell lineage marker that are related hierarchically (ie, amount of pSMAD3+ pan-CK+ cells among all pan-CK+ cells), the mean normalized cell counts/mm2 of a phenotype were further normalized to the overall mean normalized cell counts/mm2 of the parent cellular phenotype, resulting in a relative proportion: that is, pSMAD3+ panCK+/total panCK+.
Statistical analysis and presentation of data
Data are displayed as scatter plots displaying normalized data from individual patients with each single dot corresponding to one independent patient block as well as the mean value of all samples±SD. Comparison between two experimental groups for significant differences was conducted using two-tailed Student’s t-test with *p<0.05; **p<0.01; ***p<0.001; ****p<0.0001. Analysis of overall survival (OS) and disease-free survival (DFS) were calculated using the Log-Rank method and displayed as Kaplan-Meier curves with the x-axis denoting the time-to-event (month). The R packages ggpubr (https://rpkgs.datanovia.com/ggpubr/) and survminer (https://rpkgs.datanovia.com/survminer/index.html) were used for displaying data and computing statistical tests. The R package Boruta36 was used for feature selection to reduce the number of variables and identify variables having an impact on the outcome (death/alive) in an unbiased manner. Missing variables for machine learning-based feature selection were imputed using the knnImpute function of the R package caret. The impact of a given variable on OS and DFS was calculated as ORs using GraphPad Prism V.7.05 (GraphPad Software, San Diego, California, USA) with 95% CIs according to Baptista-Pike based on the same cut-off values for categorization as used in survival analysis. Multiple testing correction was applied to computed statistical comparisons using the R stats package with the Benjamini-Hochberg method.
Results
To investigate the abundance of TGFB pathway activation and relation to clinicopathological data in NSCLC, we made use of two mIHC panels. One 6-plex panel was derived from a well-described mIHC panel investigating the suppressive effects in oral squamous cell cancer,35 where pSMAD3 was exchanged for CD3 for and CD68 for CD163, thereby favoring detection of alveolar macrophages. The second 4-plex panel focused on CD3 T cells and their proliferative capability by using Ki67. Furthermore, each mIHC panel incorporated the pSMAD3 status. panCK was included to target epithelial cells and serve as guidance for tissue segmentation and detection of tumor areas. Immune checkpoint activity, as indicated by expression of PD-L1, was assessed on tumor cells and immune cells within the first panel (figure 1A). Both mIHC panels were applied to a cohort of 196 patients with NSCLC (see online supplemental table 1), assembled into TMAs containing four punches per patient. Two of these punches were each sampled from the core area of the tumor block and the other from the margin area of the tumor block (figure 1B). Image analysis of stained TMAs comprised segmentation of tissues into their morphological components (tumor area vs stromal area) and assessment of cell densities within the segmented tissues. The differential co-occurrence of accessory markers Ki67, pSMAD3 and PD-L1 on the different immune cells resulted in a variety of combinations within the tumor and stromal components. Hence, a feature selection approach was chosen to select variables which impact the clinical outcome (dead/alive) for downstream analysis (figure 1C).
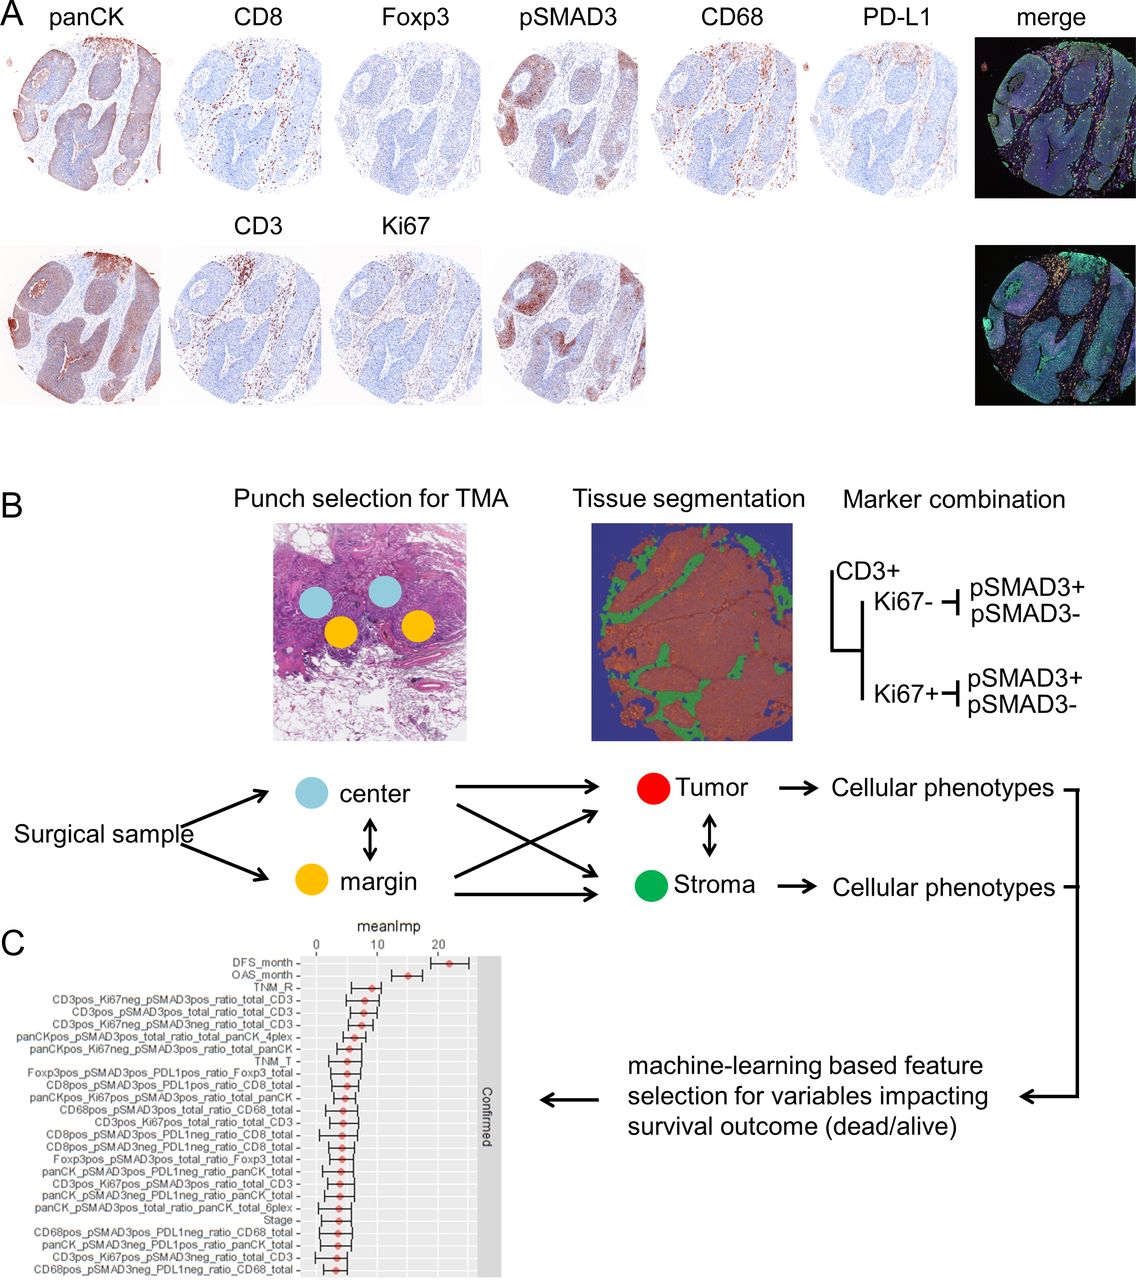
(A) Transforming growth factor beta (TGFB) pathway activation of different immune cell phenotypes in non-small cell lung cancer (NSCLC) tissues. Formalin-fixed, paraffin-embedded (FFPE) material from patients with NSCLC was assembled into tissue microarrays (TMAs) and subjected to two different panels of multiplexed immunohistochemistry (IHC). Panel 1 targets pan-cytokeratin (panCK), CD8, Foxp3, phosphorylation of SMAD3 (pSMAD3), CD68 and programmed death ligand 1 (PD-L1). Panel 2 targets panCK, CD3, Ki67 and pSMAD3. Both panels display false color, spectrally unmixed, single channel images and the merged multiplexed image as the pseudo-brightfield IHC image to resemble chromogenic IHC for ease of pattern recognition. (B) Schematic drawing on workflow of data analysis and data structure. Punch diameter and area only for exemplary highlighting and not true to scale and microscopic location. (C) Results from feature selection algorithm displaying variables which impact survival status (alive/dead) with their mean importance and their range.
Since punches were taken from center and margin parts of each tumor block, we first analyzed how similar the expression of cellular phenotypes was by correlation analysis within the stroma and tumor areas (online supplemental figure 1). The overall correlation coefficient within the cellular phenotypes of the stroma was 0.52±0.16 and for the tumor 0.47±0.18. As an example, CD3+ pSMAD3+ cells correlated well within the stroma between center and margin punches and exhibited more variance within the tumor parts. As this was true for most of the variables, we did not join the data from center and margin punches into one single value. We further analyzed by correlation analysis how cell counts in between the two independent panels (online supplemental figure 2) differed. panCK and panCK+pSMAD3+ cell counts in the tumor correlated significantly among both panels (online supplemental figure 2), although to different degrees.
Supplemental material
Supplemental material
SMAD3 phosphorylated CD3+ and CD8+ cells are differentially enriched between stroma and tumor
We next analyzed the abundances of immune cells with respect to their location within the tumor tissues. Here, we compared the immune cells that resided in the stromal part (Stroma) with those cells that successfully invaded the tumor nests (Tumor). We focused primarily on pSMAD3 in CD3, CD8, Foxp3 and CD68 cells irrespective of Ki67 or PD-L1 expression as the results from figure 1C suggested most impact on survival was mediated by pSMAD3. Here, a significant increase of pSMAD3+ CD3 cells was observed in the stroma compared with tumor compartment in punches from the margin, but not from the center (figure 2). CD8 cells with pSMAD3+ in contrast were significantly increased within the tumor areas in punches from the center and the margin compared with the adjacent stroma areas, while Foxp3+ pSMAD3+ were only significantly increased in the tumor areas of the punches from the center. No significant differences were observed for CD68+ pSMAD3+. Online supplemental figure 3 depicts the other combinations with Ki67, PD-L1 and pSMAD3 with the most notable observation that Ki67+ pSMAD3− CD3 cells are significantly increased within the tumor areas of punches from the center and margin regions (online supplemental figure 3A).
Supplemental material
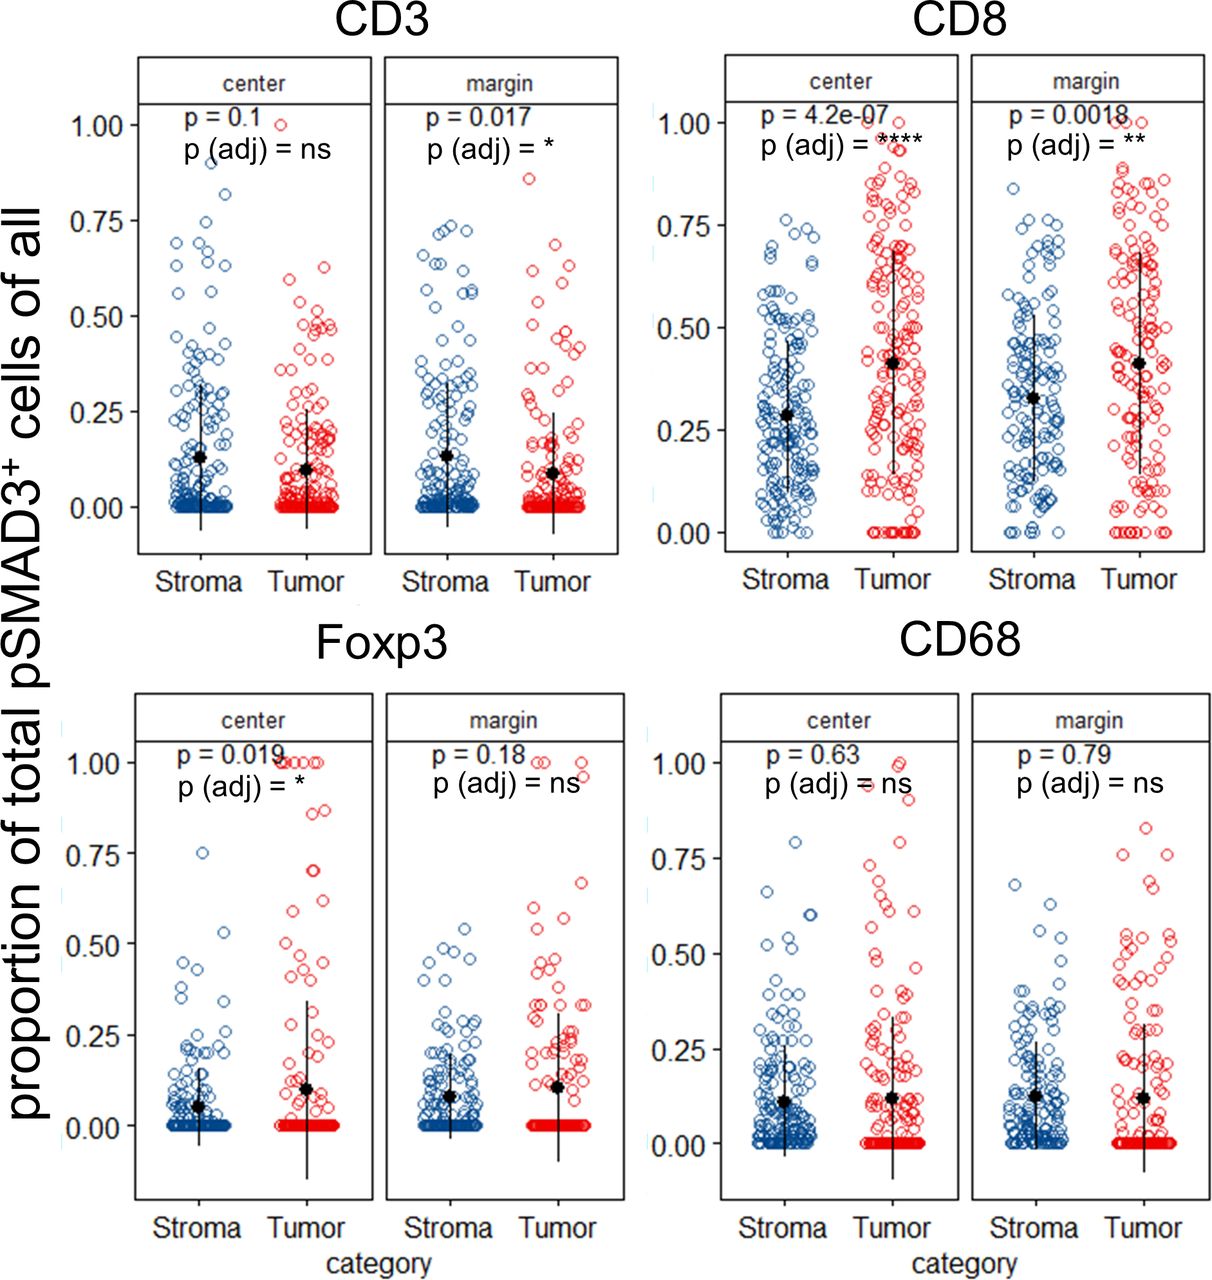
Non-small cell lung cancer (NSCLC) exhibits differential abundances of immune cell subpopulations between stromal and tumor areas. NSCLC tumors were analyzed with respect to the proportion of phosphorylation of SMAD3 (pSMAD3)-positive cells among all CD3, CD8, Foxp3 and CD68 cells. Data are stratified according to the location the sample was taken from the patient’s formalin-fixed, paraffin-embedded (FFPE) block (center or margin) and compared between tumor and stroma areas. Each dot in scatter plot represents the mean value of the respective parameter of up to two punches per patient. P values from individual T-test comparing tumor versus stroma scatter plots displayed as values and Benjamini-Hochberg adjusted p values for all comparisons displayed as symbols. ns, not significant. *P<0.05; **p<0.01; ****p<0.0001.
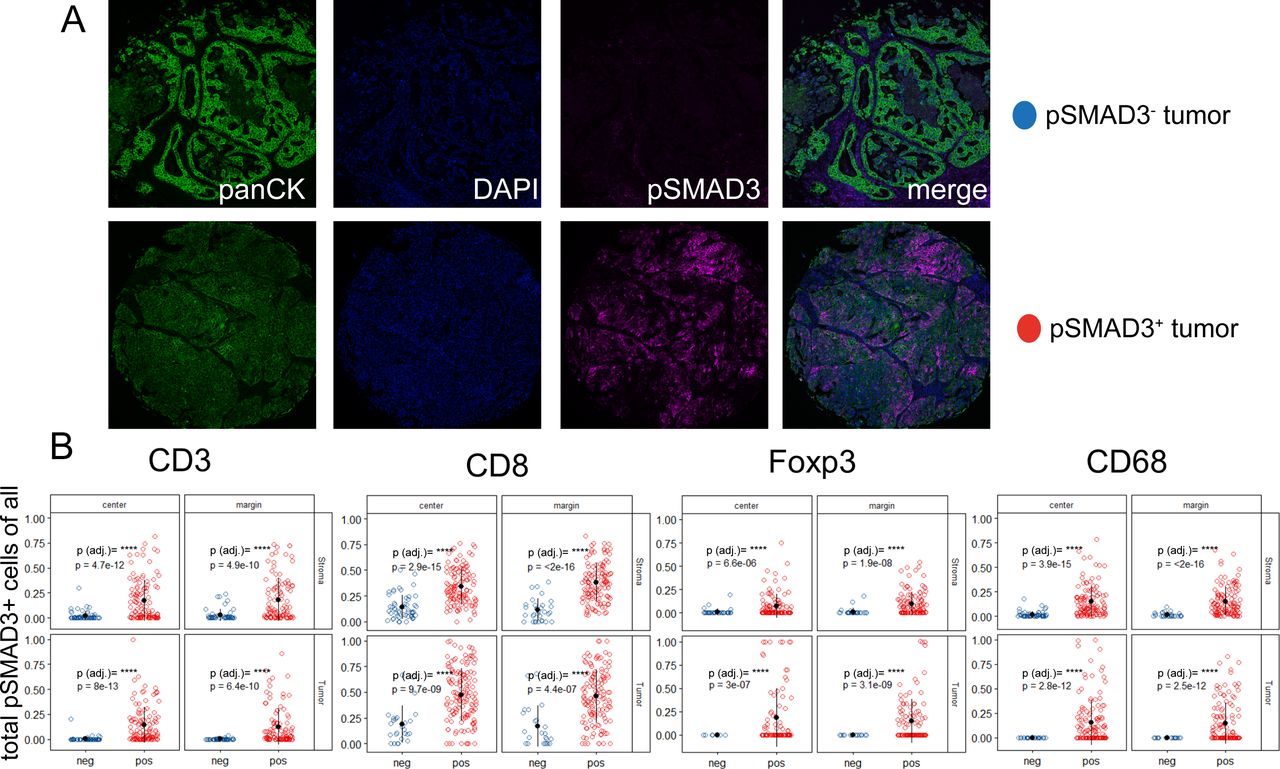
A pSMAD3+ tumor cell environment is associated with SMAD3 phosphorylation of immune cells within the tumor and the adjacent stroma
Since the TGFB pathway has been shown to regulate the local TME,21 37 we next stratified the dataset into samples with pSMAD3− and pSMAD3+ tumors (figure 3A) to gain insights if an active pathway within the cancer cells impacts the abundance of invading immune cells. Again, we first focused on pan-pSMAD3 positivity of CD3, CD8, Foxp3 and CD68 cells (figure 3B). Here, pSMAD3+ NSCLC tissues demonstrated a significant increase of CD3, CD8, Foxp3 and CD68 cells that were also positive for pSMAD3 (figure 3B). The additional combinations of Ki67 and PD-L1 in pSMAD3+/− NSCLSC tissues are found in online supplemental figure 4 with the main findings that PD-L1+pSMAD3− Foxp3 and PD-L1+pSMAD3 CD68 cells are significantly increased in stroma as well as tumor areas from the margin (online supplemental figure 4).
Supplemental material

(A) Transforming growth factor beta (TGFB) pathway activation in non-small cell lung cancer (NSCLC) tissues co-occurs with differential expression of phosphorylation of SMAD3 (pSMAD3)+ in immune cell classes in the tumor and adjacent stroma. NSCLC tumors positive or negative for pSMAD3 were analyzed with respect to the proportion pSMAD3-positive cells among all CD3, CD8, Foxp3 and CD68 cells (B). Data are stratified according to the location the sample was taken from the patient’s formalin-fixed, paraffin-embedded (FFPE) block (center or margin) as well as the results from tissue segmentation (within the tumor tissue/within the stromal part). Each dot in scatter plot represents the mean value of the respective parameter of up to two punches per patient. Benjamini-Hochberg adjusted p values indicated by symbols. ****P<0.0001.
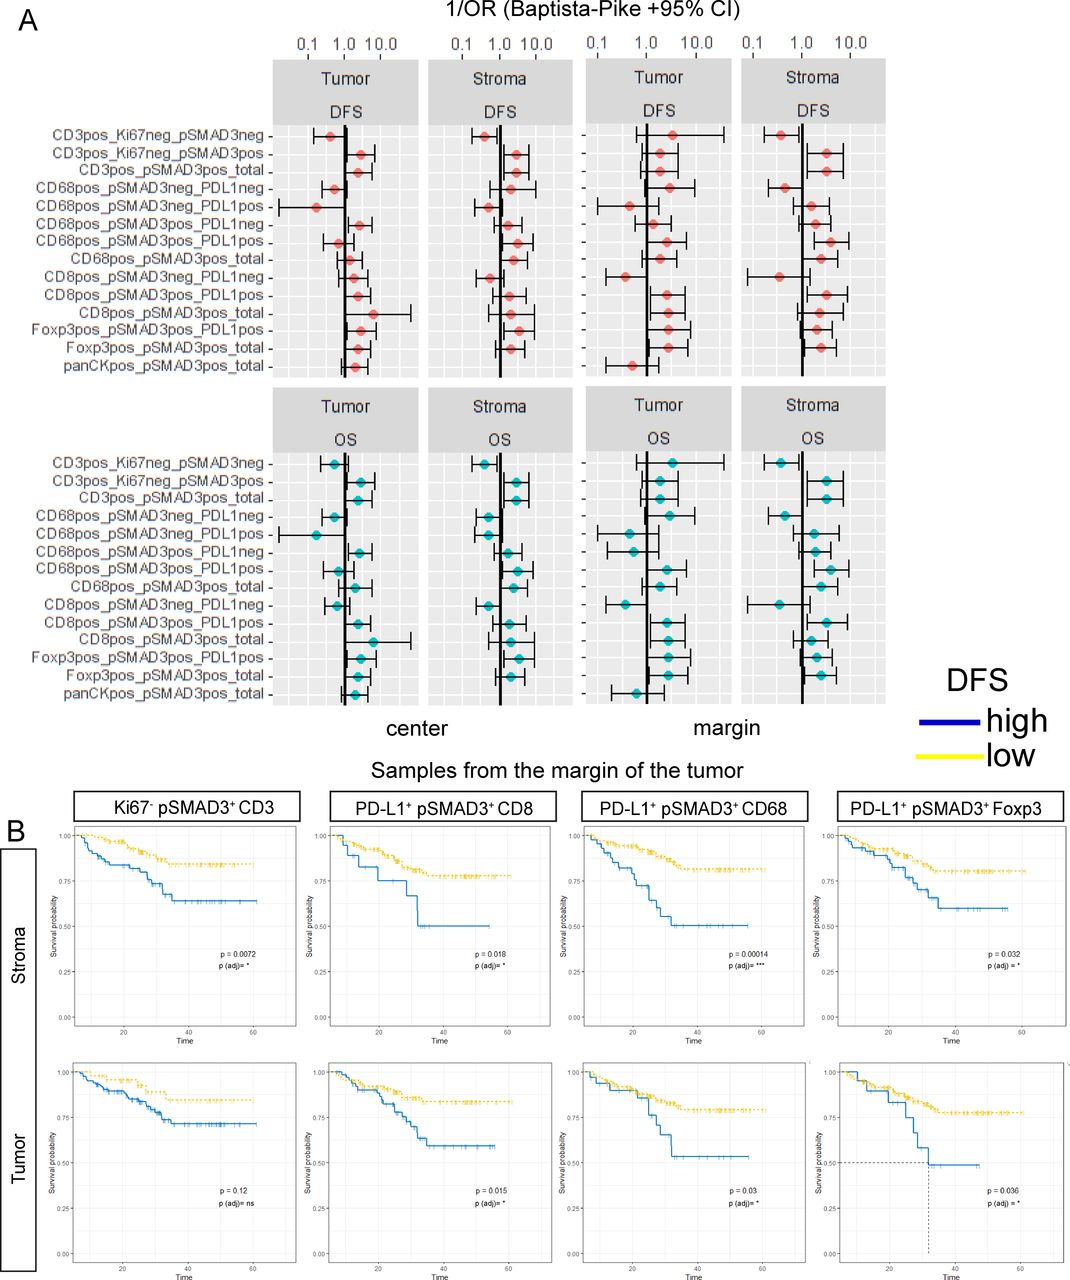
Increased phosphorylation of SMAD3 in various immune cell types results in reduced survival
Beside the differential abundance and localization of observed cellular phenotypes, we next used the proportions of PD-L1+/−, Ki67+/− and pSMAD3+/− cells from each lineage for survival analysis by applying the maximally selected rank statistics from the maxstat/survminer R package. For this, we focused on the effects of pSMAD3 positivity of CD3, CD8, CD68 and Foxp3 cells on OS and DFS. For CD8 cells, CD68 cells or Foxp3 cells, pSMAD3 positivity was combined with PD-L1 expression. The categorized variables were then used for calculation of ORs to gain an overview of the effect size and direction. Figure 4A summarizes the calculated ORs in a forest plot stratified by tissue type and punch location. Overall, pSMAD3 in all cells appeared to be associated with an increased likelihood of patients experiencing an unfavorable outcome in OS and DFS (figure 4A). Low densities of Ki67- pSMAD3+ CD3 cells found in the stroma at the margin seemed to be indicative of prolonged DFS (figure 4B). This effect was not significant if these cells were located within the tumor areas. Figure 4B further displays the impact of pSMAD3+ co-localization with PD-L1 on CD8, CD68 and Foxp3 cells found in at the margin. Here, a low proportion of PD-L1+ pSMAD3+ CD8, independent of residing within the tumor or its stroma resulted in significantly prolonged DFS. Similarly, low levels of PD-L1+ pSMAD3+ CD68 and PD-L1+ pSMAD3+ Foxp3 at the margin, either in the stroma or the tumor, showed significantly enhanced chances of prolonged OS and DFS (figure 4A,B).

Transforming growth factor beta (TGFB) pathway activation in T cells and macrophages influences survival. (A) Calculation of OR according to Baptista-Pike for CD3+, CD8+, Foxp3+, CD68+ or panCK+ cells co-expressing combinations of Ki67, pSMAD3 and PD-L1. All combinations are normalized to the total population of each cell type and stratified for their occurrence in the tumor or stroma as well as the location (center /margin). (B) Disease-free survival for selected variables from the tumor margin is displayed in (B) with time (months until event) as Kaplan-Meier curves with Log-Rank p values. Benjamini-Hochberg adjusted p values are encoded by symbols. ns, not significant. *P<0.05; ***p<0.001.
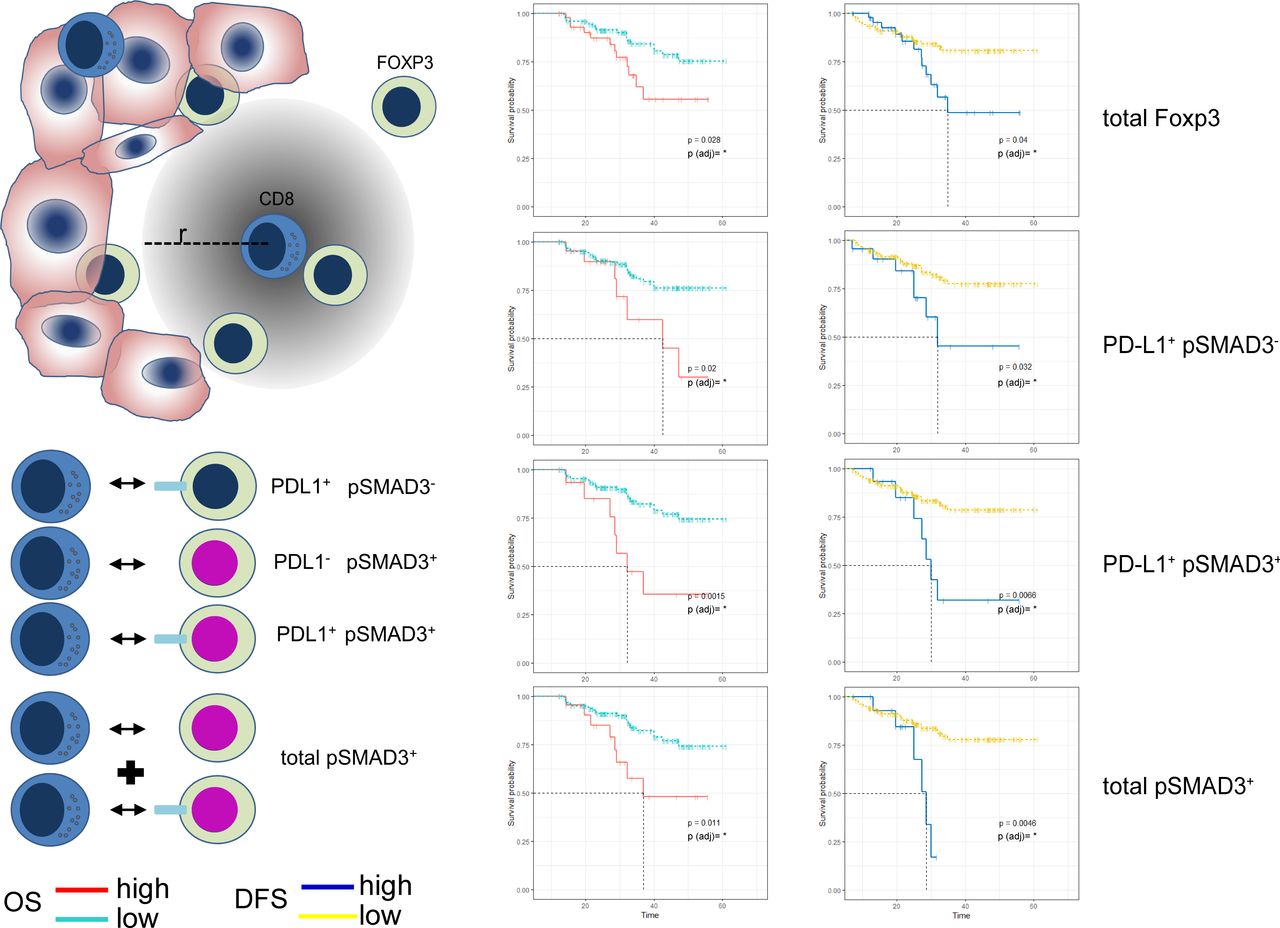
Foxp3 cells in vicinity of CD8 cells impact survival depending on phosphorylation of SMAD3
The tumor-infiltrating immune cells interact with the tumor, and are likely to exchange signals with each other. Many of these signals require a spatial closeness and it has recently been shown that the amount of Foxp3 cells within a given radius of CD8 cells exhibit prognostic value in oral squamous cell cancer.35 We therefore set out to analyze in our cohort the effect of Foxp3 cells within 30 µm of any given intratumorous CD8 cell. In addition to Foxp3 cells alone, we also examined Foxp3 cells that co-expressed PD-L1, pSMAD3 or both. A summarizing forest plot for all combinations of markers on Foxp3 cells within tumor and stroma areas at the center and margin is found in online supplemental figure 5. Spatial analysis showed that Foxp3 by itself exerts indicative value if found to be present in higher numbers within 30 µm radius of CD8 cells in the tumor. Furthermore, high numbers of Foxp3 expressing suppressive PD-L1 resulted in reduced OS as well as DFS and a more distinct impact was observed by Foxp3 cells co-expressing PD-L1 as well as pSMAD3. Overall, pSMAD3 positivity of Foxp3 cells nesting among the cancer cells within close proximity to CD8 cells, independent of PD-L1, appeared to separate groups of patients with NSCLC experiencing a very early relapse or death from patients experiencing a mostly relapse-free and long survival (figure 5).
Supplemental material

Spatial analysis of non-small cell lung cancer (NSCLC) tissues from the tumor margin reveals Foxp3 regulatory T cells adjacent to CD8 effector T cells influencing survival. The average amount of Foxp3 regulatory T cells within a radius of r=30 µm of any given CD8 T cell in NSCLC tumor tissues was analyzed for expression of programmed death ligand 1 (PD-L1) and phosphorylation of SMAD3 (pSMAD3). Survival analysis showing Kaplan-Meier curves for overall survival (OS) and disease-free survival (DFS) time in months as well as Log-Rank p values. *P<0.05.
Discussion
The TGFB pathway exerts pleiotropic effects which can inhibit proliferation, differentiation as well as activation of immune and epithelial cells which results in a contextual response16 17 that is very likely to impede successful therapeutic interventions.38 Nevertheless, recent studies suggested promising potential for interfering with the TGFB pathway in multiple malignancies. Mariathasan et al21 as well as Tauriello et al22 could show in metastatic urothelial cancer and colorectal cancer, how stromal TGFB activity leads to immune cell exclusion and impaired immune checkpoint therapy. Chakravarthy et al37 further developed a ECM gene signature that is linked to TGFB signaling in CAFs and immunosuppression. These studies highlighted the potential use of anti-TGFB interventions in re-programming the TME. NSCLC is a cancer that exhibits a high frequency of TGFB pathway activation in tumor cells and presence of the cytokine25 as well as EMT that is inversely associated with T cell infiltration.28 Nevertheless, little is known about which immune cell types respond to TGFB signaling and how they interact. We therefore aimed to explore the details of TGFB pathway activation in NSCLC within the TME of selected cell types.
The overall effect of TGFB pathway activation as indicated by pSMAD3 revealed among all investigated cell types a significant effect on DFS when located within the stromal areas and for CD3, CD8 and Foxp3 also within the tumor. Effects of TGFB on T cells have been observed to favor immune evasion39 and TGFB was shown to directly target CD8 functions by SMAD-mediated binding to granzyme B and interferon-γ promotor regions, leading to reduced cytolytic capabilities.29 In addition, SMAD3 has been shown to upregulate inhibitory PD-1 in human tumor-infiltrating lymphocytes resulting in T cell suppression.30 As both tumors and Foxp3 cells can be a source of TGFB, we analyzed the possible interactions with CD8 cells. It has been shown that a high amount of these cells within the core tumor region of NSCLC exerts an detrimental effect on OS.40 The overall amount of Foxp3 cells impaired OS and DFS in our cohort, and co-expression of PD-L1 on these cells, which has also been confirmed recently.41 The most prominent effects mediated by Foxp3 cells were observed by spatial analyses (figure 5). Here Foxp3, independently of PD-L1, showed a clear separation of the patients as long as SMAD3 was phosphorylated. Our results are in line with recent observations where mediated immunosuppression was shown to depend on cellular proximity to CD8 effector T cells. Also abrogation of surface-bound TGFB on Foxp3 cells rescued survival in a melanoma mouse model,42 thereby emphasizing the role of direct interaction within the TME and the involvement of TGFB pathway activity.
These observations highlight the complex crosstalk within the TME and we hypothesize that these interactions are crucial and promising targets. Forced expression of the TGFB scavenger receptor BAMBI in NSCLC cells impacted tumor growth and invasive capabilities25 and we recently observed an effect on NSCLC viability and proliferation by the antifibrotic drug pirfenidone, which is known to inhibit TGFB mRNA. Pirfenidone also differentially regulated TGFB gene sets, reduced SMAD phosphorylation and mediated reduced LLC1 tumor growth in a murine subcutaneous model with increased invasion of CD3, CD4, CD8 and NK cells into the tumor.23 This might be reflected with our observation of widespread pSMAD3 activation within immune cells. pSMAD3-positive tumors harbored a significantly increased proportion of immune cells which also showed an activated TGFB signaling cascade (figure 3). These observations suggest from our point of view a promising perspective that might favor combinatorial intervention in NSCLC targeting TGFB by using pirfenidone or other approaches.18 Of note, there is a bifunctional molecule that simultaneously targets PD-L1 as well as TGFB120 and has been shown to promote antitumor efficacy.19
We are well aware that the results of this study have been obtained from a cohort of patients mainly with very early stage NSCLC who received surgery as their treatment and no neo-adjuvant pretreatment. The results might look differently in a cohort containing more advanced stages of NSCLC or heavily pretreated patients. Furthermore, the results would benefit from an additional, independent cohort to obtain more events during the follow-up phase to allow a deeper analysis of clinical data. From a molecular point of view, pSMAD3 happens within a very short time-frame43 and might limit the results only to a very distinct cell population which has just encountered the ligand shortly before tissue fixation. Also, this manuscript did not assess various the possibilities of SMAD2/SMAD2, SMAD2/SMAD3 combinations with their phosphorylation pattern which could bias the presented results towards pSMAD3. Not all TGFB-driven signals are mediated via SMAD molecules, so SMAD3 phosporylation as a surrogate for TGFB activity will only be true for situation where the canonical arm of the signaling pathway is used by the cells, since the TGFB pathway could also communicate via non-SMAD signaling mediators.44 Nevertheless, we think this study is a valid starting point for raising attention to cellular signaling activities within the TME beside or in addition to classical immune-checkpoint assessment.
Acknowledgments
The authors would like to thank Jasmin Tiebach and Wenzel Vogel for excellent technical assistance.
References
Supplementary materials
Supplementary Data
This web only file has been produced by the BMJ Publishing Group from an electronic file supplied by the author(s) and has not been edited for content.
Footnotes
Twitter @MarwitzS, @carmenbm0404, @@BernardAFox
Contributors SM conceived the study, conducted experiments and analyzed the data. SM and BAF discussed data as well as drafted the manuscript. CBM and SMJ analyzed and discussed data. MR provided oncological, CK surgical, SP pathological, DD and TG pneumological aspects.
Funding Patient tissues were provided by the BioMaterialBank North, which is funded in part by the Airway Research Center North (ARCN), Member of the German Center for Lung Research (DZL) and is member of popgen 2.0 network (P2N), which is supported by a grant from the German Ministry for Education and Research (01EY1103). SM received funding from the Deutsche Forschungsgemeinschaft (MA 7800/1-1; project no. 393820492). BAF received funding from the Harder Family, Robert W Franz, Elsie Franz-Finley, Lynn and Jack Loacker, Wes and Nancy Lematta, Chiles Foundation, Murdock Trust and the Providence Medical Foundation.
Competing interests None declared.
Patient consent for publication Not required.
Ethics approval The use of biomaterial and clinical data was positively reviewed by the local ethics council at the University of Lübeck (18-026).
Provenance and peer review Not commissioned; externally peer reviewed.
Data availability statement Data will be available on reasonable request from the corresponding author.
Supplemental material This content has been supplied by the author(s). It has not been vetted by BMJ Publishing Group Limited (BMJ) and may not have been peer-reviewed. Any opinions or recommendations discussed are solely those of the author(s) and are not endorsed by BMJ. BMJ disclaims all liability and responsibility arising from any reliance placed on the content. Where the content includes any translated material, BMJ does not warrant the accuracy and reliability of the translations (including but not limited to local regulations, clinical guidelines, terminology, drug names and drug dosages), and is not responsible for any error and/or omissions arising from translation and adaptation or otherwise.