Article Text

Abstract
Background Transforming growth factor-β (TGFβ) is emerging as a promising target for cancer therapy, given its ability to promote progression of advanced tumors and to suppress anti-tumor immune responses. However, TGFβ also plays multiple roles in normal tissues, particularly during organogenesis, raising toxicity concerns about TGFβ blockade. Dose-limiting cardiovascular toxicity was observed, possibly due to the blockade of all three TGFβ isoforms. The dominant isoform in tumors is TGFβ1, while TGFβ2 and TGFβ3 seem to be more involved in cardiovascular development. Recent data indicated that selective targeting of TGFβ1 promoted the efficacy of checkpoint inhibitor anti-PD1 in transplanted preclinical tumor models, without cardiovascular toxicity.
Methods To further explore the therapeutic potential of isoform-specific TGFβ blockade, we developed neutralizing mAbs targeting mature TGFβ1 or TGFβ3, and tested them, in parallel with anti-panTGFβ mAb 1D11, in two preclinical models: the transplanted colon cancer model CT26, and the autochthonous melanoma model TiRP.
Results We observed that the blockade of TGFβ1, but not that of TGFβ3, increased the efficacy of a prophylactic cellular vaccine against colon cancer CT26. This effect was similar to pan-TGFβ blockade, and was associated with increased infiltration of activated CD8 T cells in the tumor, and reduced levels of regulatory T cells and myeloid-derived suppressor cells. In contrast, in the autochthonous TiRP melanoma model, we observed therapeutic efficacy of the TGFβ1-specific mAb as a single agent, while the TGFβ3 mAb was inactive. In this model, the anti-tumor effect of TGFβ1 blockade was tumor intrinsic rather than immune mediated, as it was also observed in T-cell depleted mice. Mechanistically, TGFβ1 blockade increased mouse survival by delaying the phenotype switch, akin to epithelial-to-mesenchymal transition (EMT), which transforms initially pigmented tumors into highly aggressive unpigmented tumors.
Conclusions Our results confirm TGFβ1 as the relevant isoform to target for cancer therapy, not only in combination with checkpoint inhibitors, but also with other immunotherapies such as cancer vaccines. Moreover, TGFβ1 blockade can also act as a monotherapy, through a tumor-intrinsic effect blocking the EMT-like transition. Because human melanomas that resist therapy often express a gene signature that links TGFβ1 with EMT-related genes, these results support the clinical development of TGFβ1-specific mAbs in melanoma.
- melanoma
- immunotherapy
- cytokines
- drug evaluation
- preclinical
- immunomodulation
This is an open access article distributed in accordance with the Creative Commons Attribution Non Commercial (CC BY-NC 4.0) license, which permits others to distribute, remix, adapt, build upon this work non-commercially, and license their derivative works on different terms, provided the original work is properly cited, appropriate credit is given, any changes made indicated, and the use is non-commercial. See http://creativecommons.org/licenses/by-nc/4.0/.
Statistics from Altmetric.com
Introduction
Transforming growth factor-ß (TGFβ) is a cytokine playing multiple roles in organogenesis.1 These roles are highly context dependent, and TGFβ therefore appears to induce opposite effects in different situations.2 In the context of cancer, TGFβ exerts tumor-suppressive functions in the premalignant stage, by inducing several cyclin-dependent kinase inhibitors or triggering apoptosis.1 3–5 However, at later stages of carcinogenesis, progressing tumors—melanomas in particular—become resistant to anti-proliferative effects of TGFβ, which then favors tumor progression by promoting tumor growth, angiogenesis, invasiveness, dissemination and immunosuppression.5 6 In carcinomas, TGFβ can trigger epithelial-to-mesenchymal transition (EMT), resulting in invasive tumors prone to metastases.5 These observations have prompted significant interest in TGFβ as a drug target for cancer therapy.7 This interest was further reinforced by the recent success of cancer immunotherapy, and trials are underway to increase the efficacy of cancer immunotherapy by blocking the immunosuppressive effects of TGFβ.6
Despite concerns related to the tumor-suppressive function of TGFβ in the premalignant stage, initial clinical trials with TGFβ-blocking therapy did not show an increased incidence of new tumors in patients with cancer, other than occasional benign skin tumors known as keratoacanthomas.8 9 More concern was raised, however, by preclinical studies showing severe cardiac valvulopathies in mice, rats and dogs, after small molecule-mediated TGFβ type I receptor kinase ALK5 inhibition or after antibody blockade of all three TGFβ isoforms.2 10 11 Three highly homologous TGFβ isoforms exist in mammals: TGFβ1, TGFβ2 and TGFβ3.2 7 12 Although they signal through the same receptor, they are encoded by distinct genes and have distinct expression patterns, suggesting different functions depending on the tissue and developmental stage,13 as confirmed by the different phenotypes of knockout mice.14–18 While TGFβ1 knockout mice display a severe inflammatory phenotype,14 15 TGFβ2 knockout mice display a range of developmental phenotypes including congenital heart defects,17 and TGFβ3 knockout mice show perinatal lethality with severe cleft palate and craniofacial defects.18 These observations suggested that the cardiac liability of TGFβ-blocking therapy might be caused by inhibition of TGFβ2 and TGFβ3 more than TGFβ1. This was further supported by observations in humans of loss-of-function TGFβ2 or TGFβ3 mutations in patients with cardiovascular defects such as thoracic aortic aneurysm dissections,19–21 other aortic defects,22 mitral valve disease21 23 or cardiac arrhythmia.24
Because TGFβ1 is the most prevalent isoform expressed in many human tumors,12 it appeared that specific blockade of TGFβ1 might provide the desired anti-tumor effects without the cardiovascular toxicity associated with blockade of TGFβ2 and TGFβ3. Because the three isoforms use the same receptor, this cannot be achieved with small molecule inhibitors of the kinase activity of the receptor. However, this is possible with isoform-specific neutralizing antibodies, and a recent report by Martin et al demonstrated in preclinical tumor models the anti-tumor efficacy of a new TGFβ1-specific mAb administered in combination with anti-PD1 checkpoint inhibitors.12 The report suggested that TGFβ1 blockade could overcome primary resistance of human tumors to checkpoint inhibitors, which has been associated with a TGFβ signature.25 26 Whether TGFβ1-specific inhibition can also exert anti-tumor effects in association with other forms of immunotherapy or independent from immunotherapy is not known.
TGFβ is produced as a fragment trapped in the latency-associated peptide in a homodimeric product known as latent TGFβ, which requires activation to release the active dimeric fragment known as mature TGFβ.27 This activation involves a dynamic interaction with one of several molecular partners that are either bound to the extracellular matrix (ECM), like LTBP1 and LTBP3, or expressed at the surface of the TGFβ-producing cell, such as GARP and LRRC33 on regulatory T cells (Tregs) and macrophages, respectively.27–29 The TGFβ1-selective mAb described by Martin et al recognizes latent, but not mature TGFβ112. We previously described an autovaccination approach to generate anti-cytokine antibodies in mice.30 We used this approach to produce monoclonal antibodies recognizing selectively mature TGFβ1 or TGFβ3. In this report, we evaluated their efficacy in two different preclinical cancer models. We observed a synergistic effect of the anti-TGFβ1 with a prophylactic cancer vaccine in the CT26 colon carcinoma model. More importantly, we also observed therapeutic efficacy of the anti-TGFβ1 antibody as a monotherapy in an autochthonous model of melanoma, in which it prevented tumor progression by blocking EMT induction. Our results support further development of anti-TGFβ1 antibodies for cancer therapy in various settings.
Materials and methods
CT26 cancer vaccine model
BALB/c mice, female and male, aged 14–16 weeks, were either immunized by injection of 1×10⁵ irradiated (250 Gy) CT26CL1 (CT26 colon carcinoma clone 1) cells subcutaneously (s.c.) or left unvaccinated. Some mice were treated with 200 µg of different anti-TGFβ mouse mAbs (1D11: IgG1 specific for TGFβ1, TGFβ2 and TGFβ331; 13A1: IgG1 specific for TGFβ130; or 1901, a novel IgG1 mAb specific for TGFβ3) obtained by the vaccination protocol described in30 or isotype-matched control IgG1 (MOPC-21, BioXcell) at the time of vaccine and tumor challenge, and continued with 100 µg three times a week starting at the time of vaccination and continued until the end of the experiment. All mAbs were purified from hybridoma cultures on Protein G columns (GE Healthcare, Belgium) and depleted of detectable lipopolysaccharide contamination by chromatography on Sartobind Q anion exchange cartridges (Sartorius, Goettingen, Germany). Three weeks after vaccine administration, 1×10⁶ CT26CL1 tumor cells were injected s.c. Additionally, some mice were treated with 67 µg or 40 µg of either 1D11 or 13A1 at the time of vaccine and tumor challenge, and continued with 33 µg or 20 µg three times a week starting at the time of vaccination. Every 3 days the mice were monitored and tumor volume was evaluated with formula: volume=length×width2/2. Mice were killed when the tumor volume reached 1300 mm3, and tumors were harvested for analysis.
TiRP autochthonous melanoma model
TiRP-10B;Ink4a/ARFflox/flox mice on a B10.D2 background (TiRP-10B+/+) were previously described.32 33 Negative TiRP-10B;Ink4a/ARFflox/flox mice (TiRP-10B−/−) were selected by crossing TiRP-10B;Ink4a/ARFflox/flox mice and selecting pups that were positive for Ink4a/ARFflox/flox and negative for the TiRP transgene. TCRP1A transgenic mice, which express the TCR-recognizing peptide P1A35–43 presented by H-2Ld, were kept on B10.D2.Rag1KO background.33 34 Mice used were 4–5 weeks old. All mice were produced under specific pathogen-free conditions at the LAF animal facility of the de Duve Institute. Handling of the mice and experimental procedures were conducted in accordance with national and institutional guidelines for animal care. All the rules concerning animal welfare were respected according to the 2010/63/EU Directive.
4OH-Tamoxifen tumor induction in TiRP mice
A fresh solution of 4OH-Tamoxifen was prepared by dissolving 4OH-Tamoxifen (Sigma Aldrich) in ethanol and mineral oil (Biorad) at the ratio of 1:9 followed by sonication (from a minimum of 30 min to a maximum of 1 hour), and injected two times s.c. (4 mg/200 µL) in the neck area of anesthetized TiRP mice 2 weeks apart. Tumor volume (in mm3) was calculated by the following formula: volume=length×width2/2. For occasional mice that developed more than one tumor, we only considered the tumor that appeared first. Mice were euthanized when tumor volume reached 2000 mm3.
Tumor dissociation and SmartFlare
Mela and Amela tumors (collected at end point) were mechanically and enzymatically dissociated in IMDM containing Collagenase I (100 U/mL) and II (50 U/mL) and Dispase (100 U/mL), and incubated at 37°C for 1 hour. The reaction was blocked by addition of IMDM containing 10% fetal bovine serum (FBS) and the suspension then filtered with a 70 µm mesh, spun and washed two times with complete medium. Cell suspension was depleted of CD45+, F4/80+, Gr-1+, CD3+, CD19+, CD31+ and CD45R+ cells by magnetic sorting, and the flow through (enriched in tumor cells) was incubated with a P1A-mRNA-Cy5 SmartFlare probe, which was designed corresponding to position 367–667 of the P1A exon 1 (sequence: AGAAATTCTGCCTTATCTAGGGTGGCTGGTCTTCGCTGTTGTCACAACAAGTTTTCTGGCGCTCCAGATGTTCATAGACGCCCTTTATGAGGAGCAGTATGAAAGGGATGTGGCCTGGATAGCCAGGCAAAGCAAGCGCATGTCCTCTGTCGATGAGGATGAAGACGATGAGGATGATGAGGATGACTACTACGACGACGAGGACGACGACGACGATGCCTTCTATGATGATGAGGATGATGAGGAAGAAGAATTGGAGAACCTGATGGATGATGAATCAGAAGATGAGGCCGAAGAAGAG) (Merck Millipore). Positive (18s-mRNA-Cy5) and negative (scramble-mRNA-Cy5) control probes were used (Merck Millipore). Then 2×10⁵ cells were seeded in a 12-well plate and 180 pM of reconstituted probe were added to IMDM medium containing 20% FBS and no antibiotics. The cells were incubated for 12 hours at 37°C, 5% CO2 followed by FACS analysis. The P1A+ and P1A− fractions were purified by sorting on a FACSAria (BD Biosciences), verified by staining with P1A-specific antibody 102B3 (see below) and analyzed by RT-qPCR for the expression of TGFβ isoforms, EMT-associated genes, ECM and melanocyte differentiation and pigmentation genes.
Viruses and vaccine
Adeno.Ii.P1At and SFV-P1A viruses were generated and maintained as described.35 TiRP mice were immunized against P1A tumor antigen by a heterologous prime-boost regimen consisting of a first injection of an Adeno.Ii.P1At (108 PFU/mouse/100 µL) followed, 15 days later, by SFV.P1A (107 IU/mouse/100 µL). Both viruses were given intradermally (i.d.). In some experiments, TiRP mice received 0.5 mg intraperitoneally of either anti-TGFβ1 13A1/2A6 (13A1) or anti-TGFβ3 1901/06 (1901) or anti-panTGFβ (1D11) or IgG1 isotype-matched control beginning at day 7 post-first injection of 4OH-Tamoxifen and continuing once a week to the end of the study.
Flow cytometry
Fluorescently labeled antibody to CD8α (clone 53-6.7, Biolegend); CD69 (clone H1.2F3, Biolegend); CD3ε-FITC (clone 17A2, Biolegend); CD45 (clone 30-F11, Biolegend); Gr-1 (clone RB6-8C5, Biolegend); Ly6C (clone HK1.4, Biolegend); Ly6G (clone 1A8, Biolegend); CD11b (clone M1/70, Biolegend); Tim-3 (clone B8.2C12, Biolegend); Lag-3 (clone C9B7W, Biolegend); PD-1 (clone 29F.1A12, Biolegend); CD25 (clone 3C7, Biolegend); MHCII (A-I-E, clone M5-114.15.2, Biolegend); NKp46 (clone 29A1.4, Biolegend); CD62L (clone MEL-14, Biolegend); CD44 (clone IM7, Biolegend) and corresponding isotype controls were used. Antibody to Foxp3-PE (clone 3G3) and viability dye efluor780 were from eBioscience. Intracellular staining of Foxp3 was performed using Foxp3 transcription factor staining kit (eBioscience, #A25865A) following manufacturer’s instructions. Annexin V (Biolegend) was used to monitor apoptosis. H-2Ld/P1A35–43 tetramers were produced as previously described.36 The P1A-specific mAb (clone 102B3) was produced by immunizing P1A-KO mice with P1A peptide CEEMGNPDGFSP coupled to ovalbumin. Hybridoma clone 102B3 was selected based on the production of an IgG1 that recognized P1A specifically when used for Western blot, flow cytometry and ELISA (see antibody validation on online supplemental figure S3). Intracellular staining of P1A was performed using Cytofix/Cytoperm kit (BD Biosciences) following manufacturer’s instructions with minimal changes. Briefly, after fixation and permeabilization, the cells were incubated 1 hour at 4°C with the antibody to P1A. Data acquisition was performed using FACS Fortessa (BD Biosciences) and FACSVerse (BD Biosciences) flow cytometers and analyzed by using FlowJo (Tree Star). Sorted cells were isolated by FACSAria.
Supplemental material
Cell lines
P511 is an azaguanine-resistant variant of P815 and P1.204 is a P815AB-negative variant, carrying a deletion of gene P1A (official gene name Trap1a).37 L1210.P1A.B7-1 cells were obtained by transfection of L1210.P1A leukemia cells with the murine B7-1 cDNA cloned into plasmid pEFBOS.38 All cells were maintained at 37°C with 8% CO2. Unless otherwise specified, all culture media contained 10% FBS supplemented with L-Arginine (0.55 mM, Merck), L-asparagine (0.24 mM, Merck), Glutamine (1.5 mM, Merck), beta-mercaptoethanol (50 µM, Sigma), 50 U mL−1 penicillin and 50 mg mL−1 streptomycin (Life Technologies). Melanoma cells T429.11 were derived from an Amela TiRP tumor.33 Cell lines were routinely tested for mycoplasma contamination. Primary melanoma cell line Xni-5 was established from a Mela TiRP tumor, using γ-irradiated mouse keratinocytes (XB-2 line obtained from ATCC) as feeder cells, and was grown in culture medium containing 10% FBS supplemented with 12-O-Tetradecanoylphorbol 13-acetate (10 ng/mL, WAKO) and cholera toxin (10 nM, Sigma-Aldrich, St Louis, Missouri, USA). Freshly irradiated keratinocytes were added in the co-culture every week up to passage 3 (3 weeks after initial plating).
TCRP1A CD8+ T-cell purification and activation
P1A-specific CD8+ T cells were isolated from spleens and lymph nodes of TCRP1A mice34 using anti-CD8α MicroBeads (Miltenyi Biotec), and stimulated in vitro by co-culture for 4 days with irradiated (100 Gy) L1210.P1A.B7-1 cells (104 of each cell type per well in 48-well plates) in IMDM 10% FBS.
Purification of myeloid-derived suppressor cells
After mechanical and enzymatic dissociation of induced TiRP tumors, myeloid-derived suppressor cells (MDSCs) (as a mix of monocytic and granulocytic cells) were purified by magnetic sorting. Briefly, CD11b+ cells were isolated using magnetic microbeads conjugated with monoclonal rat anti-mouse CD11b antibody. Depending on the experiment, MDSC isolation was carried out by either biotinylated Ly6G and Gr-1 mAbs together or alone, with anti-biotin-coated or streptavidin-coated microbeads. All separations were performed using Miltenyi Biotec kits and MidiMacs columns. Purity of cell populations was evaluated by flow cytometry.
Assay for MDSC-mediated suppression of T-cell proliferation and killing activity
TCRP1A CD8+ T cells activated in vitro for 4 days with irradiated L1210.P1A.B7-1 cells were purified, washed, counted and 100 µL of 2×10⁵ viable cells seeded in a 96-well plate in IMDM+10% FBS. MDSCs from induced tumors were isolated and purified as above. TCRP1A CD8+ T cells were co-cultured with MDSCs at a ratio of 3, 6, 9 or 12 for 3 days at 37°C. TCRP1A T cells were then purified using anti-CD8 microbeads. Their proliferation was assessed in an 18-hour 3H-thymidine incorporation assay. TCRP1A CD8+ T cells co-cultured with MDSC for 3 days as above and purified using anti-CD8 microbeads were tested for cytolytic activity in a standard 4-hour chromium release assay, using P511 cells as P1A-positive target cells and P1A-negative cells P1.204 as cold target competitors.
Treg purification and suppressive assay
CD4+ CD25+ cells were obtained from TiRP tumors by cell sorting, using a FACSAria. To measure the in vitro suppressive activity, CD8+ T cells isolated from TCRP1A mice were stimulated for 4 days with L1210.P1A.B7-1, as mentioned before. After 4 days, CD4+ CD25+ sorted cells were added at a ratio of 1:2, 1:4, 1:8 and 1:18 (1 Treg to 2, 4, 8 or 18 T responder, respectively). For some experiments (CT26 mouse model) the ratio used was 1:3. The culture was then kept for 3 days at 37°C. 3H-thymidine (1 µCi/96 well) was added to cultures in the last 18 hours and cell proliferation was measured using a liquid scintillation counter.
Western blotting
Cells or tissues were lysed in a buffer (50 mM Tris-HCl, 150 mM NaCl and 1% NP-40) supplemented with protease and phosphatase inhibitors (Thermo Fisher). Proteins were quantified by BCA assay (Thermo Fisher), and 30 µg of total proteins (cells) or 100 µg (tissues) were separated on precast NuPage gradient 4%–12% Bis-Tris gels (Thermo Fisher) in MOPS running buffer. Transfer of the proteins into nitrocellulose membrane was done with the iBlot (Thermo Fisher). Membranes were blocked in tris-buffered saline containing 0.1% Tween 20 (TBST) and 5% dry milk, and then probed with primary antibodies against N-cadherin (Cell Signaling 4061, 1/3000); E-cadherin (Cell Signaling, clone 24E10, #3195, 1/5000); MITF (Cell Signaling, clone D5G7V, #12590, 1/1000); tyrosinase (Santa Cruz, clone C-19, #sc-7833, 1/1000); Snail1/2 (Cell Signaling, clone C15D3, #3879, 1/1000); Big-h3 (Santa Cruz, clone E-19, #sc-14742, 1/2000); vimentin (Santa Cruz, clone H-84, #sc-5565, 1/3000); pSMAD2/3 (Cell Signaling, clone D27F4, #8828, 1/500); SMAD2/3 (Cell Signaling, clone D7G7, #8685, 1/2000); or GAPDH (Cell Signaling, clone D161711, #5174, 1/10000). Antibodies were incubated overnight at 4°C, in 5% w/v non-fat dry milk in TBST. Secondary antibodies were incubated 1 hour at room temperature before revelation with the West Pico SuperSignal (Thermo Fisher). Anti-rabbit horseradish peroxidase (HRP)-linked IgG (Cell Signaling Technology, #7074) was used at 1/3000, and goat anti-mouse HRP-conjugated IgG (Santa Cruz, sc-2005) was used at 1/8000.
Histological analysis and immunohistochemistry
Snap-frozen, optimal cutting temperature medium-embedded tissues were cut (7 µm) and fixed in 4% paraformaldehyde for 5 min, then incubated for 1 hour with TBS containing 2.5% normal goat serum+1% bovine serum albumin (BSA) and incubated 2 hours with goat anti-mouse Big-h3 (0.7 µg/mL in TBST 1% BSA, Santa Cruz), or rabbit anti-mouse vimentin (0.5 µg/mL in TBST 2% BSA, Cell Signaling) overnight at 4°C or rabbit anti-mouse fibronectin (0.5 µg/mL in TBST 2% BSA, Cell Signaling) 2 hours. After washing, endogenous peroxidase activity was blocked by incubating the slides with 0.3% H2O2 for 10 min. Secondary antibodies HRP-conjugated were then added for 1 hour in TBST 1% BSA. AEC chromogen (DAKO) was used and revelation reaction was stopped after 5 min, 10 min and 5 min, respectively. Counterstain with hematoxylin (Sigma) was performed. Slides were scanned using MIRAX digital microscope (Carl Zeiss MicroImaging), and images analyzed with MIRAX Viewer software (Zeiss).
RNA extraction and RT-qPCR
RNA was extracted from FACS-sorted cell populations using TRIPURE reagent (Roche). One microgram of total RNA was used to generate cDNA using the revertAid (Thermo Fisher). RT-qPCR was performed using Takyon Rox probe core kit dTTP (Eurogentec). The following primers were used: Trap1a (P1A): forward: 5ʹ-AGC-TGA-GGA-AAT-GGG-TGC-TG-3ʹ (exon 1), reverse: 5ʹ-CAG-CAT-TTT-CAC-ACC-TAC-ACT-CCA-3ʹ (exon 2), probe: 5ʹ-FAM-CCA-TCA-TTT-AAG-GAA-GAA-TGA-AGT-GAA-GTG-TAG-GAT-GA-TAMRA-3ʹ (exon 2). Reactions were performed using an elongation condition of 60°C for 1 min. Probe and primers were purchased from Thermo Fisher. Tgfb1 (Mm01178820_m1); Tgfb2 (Mm00436955_m1); Tgfb3 (Mm00436960_m1); Mitf (Mm00434954_m1); Tyr (Mm00495817_m1); Tyrp1 (Mm004453201_m1); Dct (Mn01225584_m1); Twist (Mm00442036_m1); Snai1 (Mm00441533_g1); Zeb1 (Mm00495564_m1); Zeb2 (Mm00497196_m1); Tgfbi (Mm01337605_m1); Vmac (Mm00619195_g1); Cdh1 (Mm01247357_m1); Cdh2 (Mm 01162497_m1); Acta2 (Mm00725412_g1); Gapdh (Mm99999915_g1).
ELISA assay
Antibody specificity was tested by ELISA on Maxisorb immunoplates (Nunc, Roskild, Denmark), coated overnight at 4°C with 50 µL human TGFβ1, TGFβ2 or TGFβ3 (R&D Systems) or control BSA (100 ng/mL in 50 mM glycine buffer, pH 9). After saturation (100 µL BSA 1% for 1 hour at 37°C) and washing, the antibodies were added at different concentrations and further incubated for 2 hours. Bound antibodies were detected by addition of HRP-labeled goat anti-mouse Ig (BD Pharmingen) followed after 1-hour incubation with Ultra-TMB substrate. Absorbance was acquired at 450 nm.
Transformed mink lung epithelial cell assay
TGFβ activity was measured using TMLEC reporter cells (transformed mink lung epithelial cells), as described by Uyttenhove et al.30 Briefly, 5 ng/mL human TGFβ1, TGFβ2 or TGFβ3 were incubated with serial dilutions of anti-TGFβ1 13A1, anti-TGFβ3 1901 or anti-panTGFβ 1D11 for 4 hours at 37°C. These solutions were then mixed with an equal volume of culture medium (DMEM+10% fetal calf serum), containing 50,000 TMLECs that had been seeded for 4 hours. After a further 24-hour incubation, luciferase activity was measured with the Bio-Glo Luciferase Assay System (Promega, Madison, Wisconsin, USA).
Determination of melanin content
Xni-5 cells were treated with anti-TGFβ1 13A1 antibody at the dose of 100 ng/mL, 30 ng/mL and 10 ng/mL, or corresponding amount of isotype control (IgG1). The cultured media were replaced every week, at the time of cell passage. To evaluate the melanin content, 106 Xni-5 cells were treated with a solution of 1N NaOH in 10% dimethyl sulfoxide (DMSO) for 1 hour at 80°C. Then, 200 µL of cell supernatant were transferred to a 96-well plate and absorbance was measured at 405 nm. Synthetic melanin (Sigma-Aldrich) was used as a standard, starting from 1 mg/mL in DMSO.
Results
TGFβ1-specific and TGFβ3-specific monoclonal antibodies
By immunizing mice with human mature TGFβ1-ovalbumin or TGFβ3-ovalbumin conjugates, we produced mAb 13A1 and mAb 1901, which recognize specifically TGFβ1 and TGFβ3, respectively (figure 1A).30 39 40 Both mAbs efficiently neutralized the relevant TGFβ isoform in a TGFβ activity assay, and mAb 13A1 was slightly more potent to inhibit TGFβ1 than the well-characterized anti-panTGFβ mAb 1D1131 (figure 1B). Monoclonal antibody 13A1 recognized mature but not latent TGFβ1, as the latter was unable to inhibit binding of 13A1 to the former (figure 1C). We then used two different tumor models to test the therapeutic efficacy of these isoform-specific mAbs in comparison with mAb 1D11.

Specificity and inhibitory capacity of anti-TGFβ1 mAb 13A1 and anti-TGFβ3 mAb 1901. (A) ELISA plates coated with human TGFβ1, TGFβ2 or TGFβ3 (100 ng/mL) were incubated with serial dilutions of anti-TGFβ1 mAb 13A1 (IgG1), anti-TGFβ3 mAb 1901 (IgG1), or anti-panTGFβ mAb 1D11 (IgG1), and revealed with HRP-labeled goat anti-mouse Ab. Similar results were obtained when using mouse TGFβ1 or TGFβ3. One representative experiment (±SEM) of at least three performed is shown. The EC50 (±SEM) of the different batches used throughout the work are indicated. (B) Inhibition of the biological activity of the different TGFβ isoforms was evaluated in a TMLEC-TGFβ reporter assay. One representative experiment of at least three is illustrated graphically, and the IC50±SEM of the different batches used throughout the work are indicated. (C) Mature human TGFβ1 (300 ng/mL) was coated on ELISA plates and incubated with 100 ng/mL (0.67 nM) anti-TGFβ1 mAb 13A1 preincubated for 1 hour at room temperature with increasing concentrations of recombinant mature or latent human TGFß1 (R&D systems). Binding of mAb 13A1 to coated TGFβ1 was revealed as in (A). One representative experiment (±SEM) out of two performed. HRP, horseradish peroxidase; TGFβ, transforming growth factor-β; TMLEC, transformed mink lung epithelial cell.
Anti-TGFβ1 mAb synergizes with prophylactic vaccination in the CT26 model
We first used the CT26 colon carcinoma model, in which neutralization of all TGFβ isoforms using mAb 1D11 was previously shown to synergize with immunotherapy based on prophylactic vaccination with irradiated cells.41 We injected anti-TGFβ antibodies three times a week and challenged mice with CT26 tumor cells 3 weeks after vaccination (figure 2). We confirmed the increased survival of mice receiving the vaccine combined with 1D11, as compared with either treatment alone (figure 2B).41 Interestingly, this synergistic effect was fully maintained when using the TGFβ1-specific neutralizing mAb 13A1 (figure 2B). However, it was not observed in mice receiving the TGFβ3-specific mAb 1901 (figure 2B). The protection was associated with an increased infiltration of tumors with activated CD8 T cells expressing activation and effector memory markers and lacking expression of PD-1 and Tim-3 (figure 2C). This lack of PD-1 expression was in line with the recent demonstration that TGFβ1 contributed to the induction of PD-1 on tumor-infiltrating CD8 T cells.42 In contrast, TGFβ3 neutralization reduced infiltration and activation of CD8 T cells in tumors and increased their PD-1 expression (figure 2C). Tumors from mice receiving 13A1 or 1D11 also contained lower numbers of Tregs, which displayed a reduced suppressive activity (online supplemental figure S1A,B), and less monocytic MDSCs also with diminished suppressive activity (online supplemental figure S1C,D). These results confirmed the immunosuppressive role of TGFß1 in the CT26 model43 44 and indicated that neutralization of TGFβ1, but not TGFβ3, potentiated immunotherapy in this model in a similar fashion to neutralization of all three TGFβ isoforms.
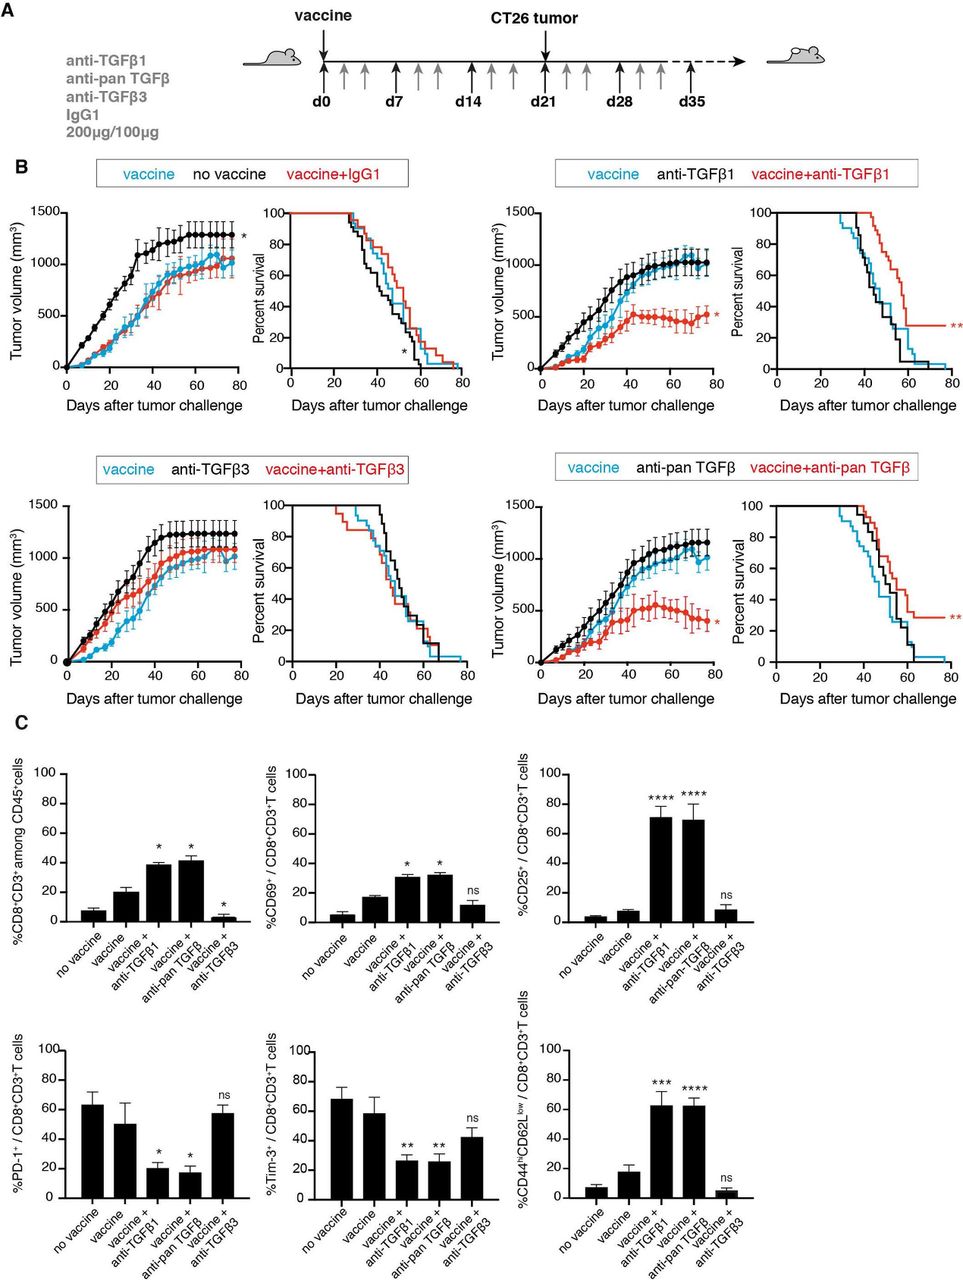
Synergistic effect of anti-TGFβ1 with a prophylactic vaccine against colon carcinoma CT26. (A) Schedule for tumor induction and immunotherapy. BALB/c mice received a prophylactic vaccination with 1×10⁵ irradiated (250 Gy) CT26CL1 tumor cells, injected subcutaneously (s.c.) in the right flank. The same day they received 200 µg intraperitoneally (i.p.) of either anti-TGFβ1 13A1, anti-TGFβ3 1901 or anti-panTGFβ 1D11, or isotype control antibody. Anti-TGFβ antibodies were then administered three times a week at the dose of 100 µg. Three weeks after vaccination, mice received 1×10⁶ CT26CL1 s.c. in the left flank together with 200 µg of anti-TGFβ antibodies. The treatment with anti-TGFβ antibodies then continued three times a week, 100 µg i.p. until the end of the experiment. (B) Tumor growth (left panels) and mouse survival (right panels) were monitored. The figures represent the cumulative data of 6 independent experiments totaling 193 mice (experiment 1, cohort n=44 (groups: no vaccine=4; vaccine=5; vaccine+IgG1=4; vaccine+anti-TGFβ1=6; vaccine+anti-panTGFβ=6; vaccine+anti-TGFβ3=5; anti-TGFβ1=5; anti-panTGFβ=5; anti-TGFβ3=4); experiment 2, cohort n=52 (groups: no vaccine=4; vaccine=4; vaccine+IgG1=4; vaccine+anti-TGFβ1=7; vaccine+anti-panTGFβ=7; vaccine+anti-TGFβ3=7; anti-TGFβ1=6; anti-panTGFβ=7; anti-TGFβ3=6); experiment 3, cohort n=39 (groups: no vaccine=4; vaccine=4; vaccine+IgG1=4; vaccine+anti-TGFβ1=5; vaccine+anti-panTGFβ=5; vaccine+anti-TGFβ3=5; anti-TGFβ1=4; anti-panTGFβ=4; anti-TGFβ3=4); experiment 4, cohort n=20 (no vaccine=5; vaccine=5; vaccine+anti-TGFβ1=5; vaccine+anti-panTGFβ=5); experiment 5, cohort n=20 (no vaccine=5; vaccine=5; vaccine+anti-TGFβ1=5; vaccine+anti-panTGFβ=5); experiment 6, cohort n=18 (no vaccine=5; vaccine=5; vaccine+anti-TGFβ1=4; vaccine+anti-panTGFβ=4)). Tumor growth is reported (left panels) as tumor volume (mm3) over time. Data are presented as mean±SEM, and were analyzed with one-way ANOVA with Tukey’s multiple comparisons correction. All groups were compared with vaccine alone: vaccine versus no vaccine, *p<0.05; vaccine versus vaccine+IgG1, NS; vaccine versus vaccine+anti-TGFβ1, *p<0.05; vaccine versus vaccine+anti-panTGFβ, *p<0.05; vaccine versus vaccine+anti-TGFβ3, NS. Survival percentages are reported (right panels), and were analyzed with Log-rank (Mantel-Cox). All groups were compared with vaccine alone: vaccine versus no vaccine, *p<0.05; vaccine versus vaccine+anti-TGFβ1, **p<0.01; vaccine versus vaccine+anti-panTGFβ, **p<0.01; vaccine versus vaccine+anti-TGFβ3, NS. (C) CT26CL1 tumors from tumor-bearing mice treated as indicated in (A) were analyzed by ex vivo FACS staining for CD8, CD69, CD25, Tim-3, PD-1, CD44 and CD62L. Cumulative data are presented from 6 experiments totaling 193 mice, as detailed in (B). Results are expressed as mean+SEM unpaired Student’s t-test (two-tailed). All groups were compared with vaccine alone: *p<0.05; **p<0.01; ***p<0.001; ****p<0.0001. ANOVA, analysis of variance; NS, not significant; TGFβ, transforming growth factor-β.
We then compared the relative efficacy of 13A1 and 1D11 in potentiating immunotherapy in the CT26 model by repeating the above experiment while titrating down the amount of antibody injected into the mice (online supplemental figure S2A). We compared a high (100 µg), medium (33 µg) and low dose (20 µg) of antibody. In each case a double dose was given at the first injection. We monitored tumor volume and mouse survival (online supplemental figure S2B). The anti-tumor effect of 1D11 was observed at the high dose but was lost at the medium dose. In contrast, 13A1 was still fully effective at the medium dose. Accordingly, increased tumor infiltration with activated effector memory CD8 was observed with the medium dose of 13A1 but not with the medium dose of 1D11 (online supplemental figure S2C). These results indicate that the TGFβ1-specific mAb 13A1 is about three times more potent than the anti-panTGFβ mAb 1D11 in neutralizing TGFβ in this model of cancer immunotherapy.
Cellular origin of TGFβ isoforms in TiRP melanomas
We then studied the TiRP model of autochthonous melanoma, which is characterized by a strong TGFβ signature and primary resistance to all forms of immunotherapy.32 33 In this model, subcutaneous injection of tamoxifen triggers the development of melanomas that express murine MAGE-type antigen P1A and initially develop as black (Mela) tumors, showing a clear MITF-dependent gene signature with no signs of inflammation and a well-defined melanocyte-like morphology.45 On further tumor progression, Mela tumors de-differentiate into white (Amela) tumors, in which the decrease of melanocyte-differentiation genes (MITF, Tyr, TRP1, TRP2) is correlated with the acquisition of a de-differentiated state, characterized by pronounced TGFβ and EMT-like signatures.46 Amela tumors also show signs of pathological inflammation, with a tumor microenvironment (TME) highly enriched in MDSCs that contribute to a severe immunosuppression.32 33 Contrary to the CT26 model, the role played by TGFβ in this model has not been characterized. As a first step, we defined the cellular source of TGFβ, by separating TiRP tumor cells from stromal cells on the basis of tumor-specific P1A expression, and measuring TGFβ production. We used a fluorochrome-labeled P1A-mRNA SmartFlare probe, which does not require permeabilization and therefore maintains RNA integrity, to sort cells based on P1A expression (figure 3A). We validated the sorted cells using a novel P1A-specific mAb that we obtained by immunizing P1AKO mice47 with a P1A peptide coupled to ovalbumin (figure 3A). This mAb, called 102B3, proved specific for P1A when tested in Western blot and FACS (online supplemental figure S3A–C). We then extracted RNA and compared transcripts of P1A-positive tumor cells and P1A-negative stromal cells. We found high levels of TGFβ1 transcripts in tumor cells, particularly in those isolated from Amela tumors (figure 3B). In contrast, TGFβ3 was expressed at a much higher level in stromal cells. TGFβ2 expression was weak and confined to stromal cells. As expected, P1A-positive tumor cells from Mela but not Amela tumors expressed high levels of transcripts for pigmentation-related gene products M-MITF, tyrosinase, TRP-1 and TRP-2, while these transcripts were absent in P1A-negative stromal cells (figure 3B). We also confirmed the presence of an EMT-like signature in Amela tumors, with a higher expression of typical transcripts for Twist, Big-h3, vimentin and N-cadherin and a lower expression of E-cadherin in Amela versus Mela tumors (figure 3B). Notably, Zeb2, which is a typical EMT gene in epithelial cells, showed the opposite trend, with a lower expression in Amela. This is in line with the description of Zeb2 as a gene associated with a differentiated phenotype in the melanocyte lineage, being expressed in Zeb1-negative cells in a mutually exclusive fashion.48 Although detected in both tumor cells and stromal cells, the EMT-like gene signature was more intense in tumor cells, particularly in Amela tumors. We conclude from those data that tumor cells represent the main cellular source of TGFβ1 in the TiRP model, while TGFβ3 mostly originates from non-hematopoietic stromal cells.

Expression of TGFβ isoforms and EMT-associated genes in TiRP melanoma cells and stromal cells. (A) Separation of tumor cells and stromal cells from Mela and Amela TiRP tumors. CD45-negative cells were sorted based on P1A expression using a fluorescently labeled P1A-mRNA SmartFlare probe. Sorted cells were verified by staining with P1A-specific antibody P1A102B3. (B) Cells sorted in (A) were tested by RT-qPCR for the indicated genes. Results are expressed as mean number of transcripts±SEM, from a total 35 Mela and 110 Amela tumors tested. EMT, epithelial-to-mesenchymal transition; TGFβ, transforming growth factor-β.
Increased survival of TiRP tumor-bearing mice after TGFβ1 neutralization
To determine the causative role of TGFβ in tumor progression and the related immunosuppression, we neutralized TGFβ by injecting TiRP mice weekly with anti-panTGFβ mAb 1D11, or with the isoform-specific antibodies described above. We observed a reduced tumor size and an increased survival after neutralization of all TGFβ isoforms or after neutralization of TGFβ1 but not after neutralization of TGFβ3 (figure 4A, left and middle panels). Unexpectedly, this anti-tumor effect was not linked to a release of the immunosuppressive effects of TGFβ, because it was also observed in mice that were depleted of CD4 and CD8 T cells (figure 4B, left and middle panels). Likewise, no synergistic effect was observed with a prophylactic immunization of mice against tumor antigen P1A using an efficient vaccine platform35 (figure 4C, left and middle panels, and online supplemental figure S4). These results indicated that TGFβ1 exerted dominant protumoral effects in this model, which were mediated by tumor-intrinsic rather than immunosuppressive mechanisms.

In vivo neutralization of TGFβ1 increases survival of TiRP tumor-bearing mice and delays EMT-like transition. (A) TiRP mice (B10.D2;Ink4a/ARFflox/flox;TiRP+/+) received two injections of 4OH-Tamoxifen and weekly injections of anti-TGFβ antibodies (0.5 mg) as indicated, until the end of the experiment. Mice were monitored once a week, tumor size (left panels) and survival (middle panels) were measured, and median time to transition from Mela to Amela tumor was calculated (right panels). The figures represent the cumulative data of 5 independent experiments totaling 128 mice (experiment 1, cohort n=27 (groups: IgG1=6; anti-TGFβ1=7; anti-TGFβ3=7; anti-panTGFβ=7); experiment 2, cohort n=23 (groups: IgG1=5; anti-TGFβ1=6; anti-TGFβ3=6; anti-panTGFβ=6); experiment 3, cohort n=26 (groups: IgG1=6; anti-TGFβ1=7; anti-TGFβ3=6; anti-panTGFβ=7); experiment 4, cohort n=21 (groups: IgG1=4; anti-TGFβ1=7; anti-TGFβ3=5; anti-panTGFβ=5); experiment 5, cohort n=31 (groups: IgG1=6; anti-TGFβ1=10; anti-TGFβ3=5; anti-panTGFβ=10)). Tumor growth is reported as tumor volume (mm3) over time (left panel). Data are presented as mean±SEM, and were analyzed with one-way ANOVA with Tukey’s multiple comparisons correction: anti-TGFβ1 versus IgG1, *p<0.05; anti-panTGFβ versus IgG1, *p<0.05. Survival percentages (middle panel) are reported and were analyzed with Log-rank (Mantel-Cox): anti-TGFβ1 versus IgG1, ****p<0.0001; anti-panTGFβ versus IgG1, ****p<0.0001; anti-TGFβ3 versus IgG1, NS; anti-panTGFβ versus anti-TGFβ1, NS. Means+SEM of median times to EMT-like transition in the five experiments are reported (right panel), and were analyzed with the unpaired Student’s t-test (two-tailed). All groups compared with IgG1: *p<0.05; **p<0.01. (B) TiRP mice received anti-CD4 and anti-CD8 depleting antibodies (1 mg each intraperitoneally (i.p.)) as described,57 starting at day 15 and continuing once a week up to the end of the experiment. Depletion was verified by FACS on PBMC every 2 weeks. Mice were then injected two times with 4 mg 4OH-Tamoxifen on days 0 and 15. At day 7, some mice received either anti-TGFβ1 or IgG1 control, 0.5 mg/mouse i.p. in PBS. Weekly injections continued as indicated until the end of the experiment. Mice were monitored and data reported as described in (A). The figure represents the cumulative data of 4 independent experiments totaling 116 mice (experiment 1, cohort n=28 (anti-CD4/anti-CD8+IgG1=7; anti-CD4/anti-CD8+anti-TGFβ1=7; IgG1=7, anti-TGFβ1=7); experiment 2, cohort n=32 (anti-CD4/anti-CD8+IgG1=10; anti-CD4/anti-CD8+anti-TGFβ1=10; IgG1=5, anti-TGFβ1=7); experiment 3, cohort n=31 (anti-CD4/anti-CD8+IgG1=8; anti-CD4/anti-CD8+anti-TGFβ1=8; IgG1=7, anti-TGFβ1=8); experiment 4, cohort n=25 (anti-CD4/anti-CD8+IgG1=5; anti-CD4/anti-CD8+anti-TGFβ1=5; IgG1=7, anti-TGFβ1=8)). Tumor growth is reported as tumor volume (mm3) over time (left panel). Data are presented as mean±SEM, and were analyzed with one-way ANOVA with Tukey’s multiple comparisons correction: anti-TGFβ1 versus IgG1, **p<0.01; anti-CD4/anti-CD8+anti-TGFβ1 versus anti-CD4/anti-CD8+IgG1, **p<0.01. Survival percentages are reported (middle panel) and were analyzed with Log-rank (Mantel-Cox): anti-TGFβ1 versus IgG1, ****p<0.0001; anti-CD4/anti-CD8+anti-TGFβ1 versus anti-CD4/anti-CD8+IgG1, ****p<0.0001. Means+SEM of median times to EMT-like transition in the four experiments are reported (right panel), and were analyzed with the unpaired Student’s t-test (two-tailed): IgG1 versus anti-TGFβ1, **p<0.01; anti-CD4/anti-CD8+IgG1 versus anti-CD4/anti-CD8+anti-TGFβ1, **p<0.01. (C) TiRP mice received a prime/boost vaccine regimen of recombinant adenovirus (Adeno.Ii.P1At, 108 PFU i.d.) and SemlikiForest virus (SFV.P1A, 107 IU i.d.) as described.35 Mice then received 4OH-Tamoxifen and antibody injections as indicated, and were monitored as in (A). The strong CD8+ T cell immune response induced by the vaccine is shown on online supplemental figure S4A–C. The figures represent the cumulative data of 6 independent experiments totaling 161 mice (experiment 1, cohort n=27 (groups: immunized=6; immunized+anti-TGFβ1=7; immunized+anti-TGFβ3=7; immunized+anti-panTGFβ=7); experiment 2, cohort n=23 (groups: immunized=5; immunized+anti-TGFβ1=6; immunized+anti-TGFβ3=6; immunized+anti-panTGFβ=6); experiment 3, cohort n=26 (groups: immunized=6; immunized+anti-TGFβ1=7; immunized+anti-TGFβ3=6; immunized+anti-panTGFβ=7); experiment 4, cohort n=21 (groups: immunized=4; immunized+anti-TGFβ1=7; immunized+anti-TGFβ3=5; immunized+anti-panTGFβ=5); experiment 5, cohort n=30 (groups: immunized=5; immunized+anti-TGFβ1=10; immunized+anti-TGFβ3=5; immunized+anti-panTGFβ=10); experiment 6, cohort n=34 (groups: immunized=5; immunized+anti-TGFβ1=10; immunized+anti-TGFβ3=8; immunized+anti-panTGFβ=11)). Tumor growth (left panel) is reported as tumor volume (mm3) over time. Data are presented as means±SEM and were analyzed with one-way ANOVA with Tukey’s multiple comparisons correction: immunized versus immunized+anti-TGFβ1, *p<0.05; immunized versus immunized+anti-panTGFβ, *p<0.05. Survival percentages are reported (middle panel) and were analyzed with Log-rank (Mantel-Cox): immunized versus immunized+anti-TGFβ1, ****p<0.0001; immunized versus immunized+anti-panTGFβ, ****p<0.0001. Means+SEM of median times to EMT-like transition in the six experiments are reported (right panel), and were analyzed with the unpaired Student’s t-test (two-tailed): immunized versus immunized+anti-TGFβ1, ***p<0.001; immunized versus immunized+anti-panTGFβ, **p<0.01; immunized versus immunized+anti-TGFβ3, NS. ANOVA, analysis of variance; EMT, epithelial-to-mesenchymal transition; i.d., intradermal injection; NS, not significant; PBMC, peripheral blood mononuclear cell; PBS, phosphate-buffered saline; TGFβ, transforming growth factor-β.
In line with this conclusion, TGFβ1 blockade neither increased the amount of tumor-specific T cells isolated from tumor and spleen (online supplemental figure S4A,B) nor their functionality (online supplemental figure S4C). While monocytic MDSC (M-MDSC) levels were reduced in the spleen, polymorphonuclear MDSCs (PMN-MDSCs), which play a prominent role in triggering apoptosis of tumor-infiltrating lymphocytes (TILs) in this model,33 were not (online supplemental figure S4D). Levels of natural killer cells were also unaffected (online supplemental figure S4E). However, Treg numbers were decreased in both tumors and lymph nodes, and their T-cell suppressive activity was dampened, in line with the role of TGFβ in Treg differentiation and function (online supplemental figure S4F,G).49 50 Despite these effects on M-MDSC and Tregs, the fact that the anti-tumor effects of TGFβ1 blockade were fully maintained in T-cell depleted mice indicates the presence of other dominant immunosuppressive mechanisms, so that only the tumor-intrinsic effect of TGFβ1 can affect tumor progression in this model. One possible immunosuppressive mechanism is the induction of TIL apoptosis by PMN-MDSC,33 which are maintained on TGFβ1 blockade (online supplemental figure S4D).
Delayed EMT-like transition in tumors of TGFβ1-neutralized mice
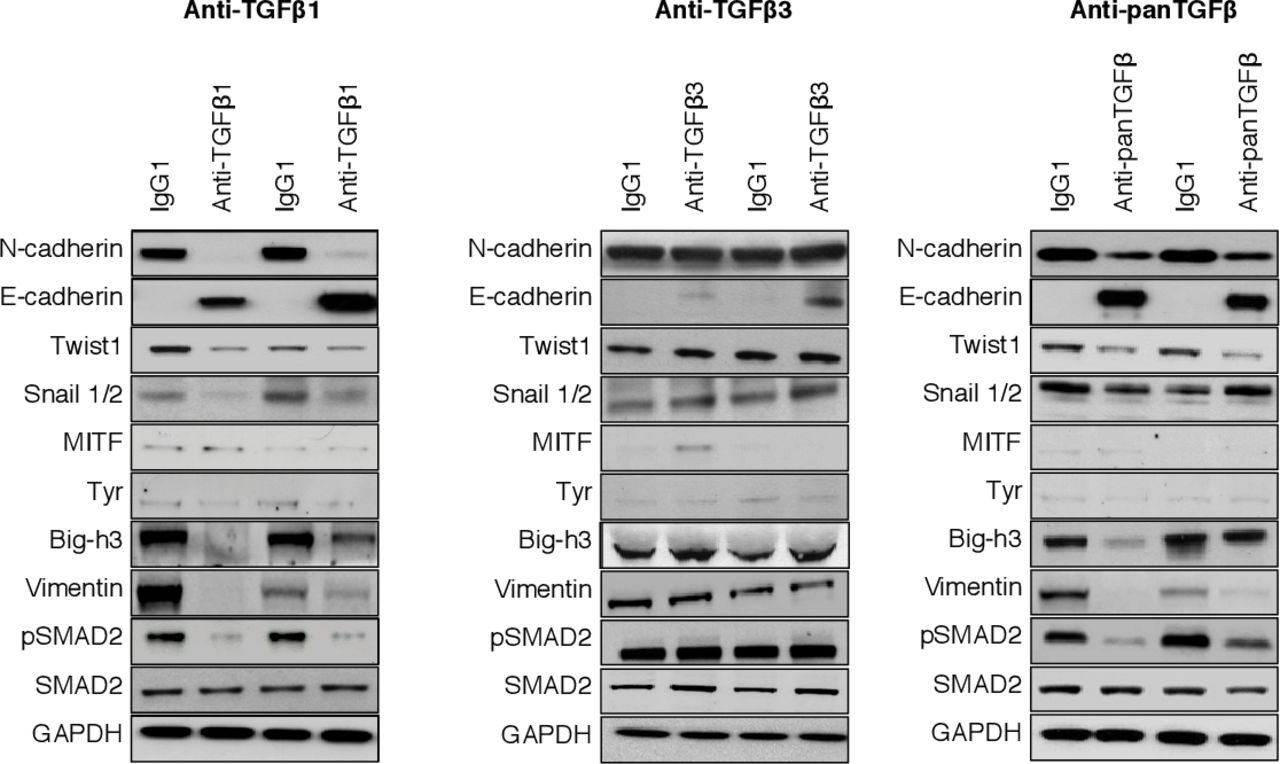
To understand the tumor-intrinsic effect of TGFβ1 in the progression of TiRP tumors, we considered that this progression was invariably linked to the EMT-like transition that converts indolent Mela tumors into aggressive Amela tumors. TGFβ is known as one of the factors that may trigger EMT.51 It was therefore possible that the protumoral effect of TGFβ in this model was linked to the triggering of EMT, and that neutralizing TGFβ prevented or delayed the onset of EMT. To address this, we compared the kinetics of EMT in our cohorts of TiRP mice treated or not with TGFβ-neutralizing mAbs. We observed that the increased survival in treated mice correlated with a delayed transition from Mela to Amela tumors: while this transition was observed after 42 days in control mice, it only occurred after more than 112 days in mice neutralized for TGFβ1 or for all TGFβ isoforms (figure 4A, right panels). Identical effects of TGFβ mAbs were observed in T-cell depleted or in immunized mice (figure 4B,C, right panels). TGFβ3 neutralization did not delay transition (figure 4A–C). We confirmed that the retarded transition from Mela to Amela tumors corresponded to delayed EMT by observing that tumors from mice treated with 13A1 or 1D11 showed reduced expression of EMT-related proteins such as N-cadherin, Twist, Snail1/2, vimentin, Big-h3, while E-cadherin expression was maintained (figure 5, online supplemental figures S5A and S6). Expression of phospho-SMAD2 was also reduced in treated mice, confirming effective neutralization of TGFβ signaling (figure 5). Of note, TGFβ1 neutralization did not affect the expression of the P1A tumor antigen (online supplemental figure S5B). To further explore this tumor-intrinsic effect of TGFβ, we established a pigmented primary melanoma line from a TiRP Mela tumor, and exposed it to anti-TGFβ1 mAb 13A1. We observed that this line spontaneously lost pigmentation after several weeks in culture, as measured by a drop in melanin content. Interestingly, this loss of pigmentation was largely prevented by TGFβ1 neutralization (online supplemental figure S7). This result confirmed not only the tumoral source of TGFβ1 but also its tumor intrinsic effect, whereby tumor cells themselves respond to TGFβ1 by initiating an EMT-like program entailing their depigmentation. Altogether, these results strongly suggest that TGFβ1 plays a causative role in EMT-like transition, and that TGFβ1 neutralization increased survival by preventing this transition and thereby delaying the Mela to Amela transition.
The effects of TGFβ1 blockade are linked to a partial silencing of the EMT-associated proteins and transcription factors. Representative Western blot of transcription factors (Snail1/2 and Twist) and other proteins involved either in EMT (N-cadherin, E-cadherin, vimentin, Big-h3) or in melanocyte differentiation (MITF, Tyr). Tumor tissue lysate was obtained from mice treated with anti-TGFβ1 13A1, anti-TGFβ3 1901, anti-panTGFβ 1D11 or isotype control IgG1. Western blot of pSMAD2 was used as control of a TGFβ-dependent effect. EMT, epithelial-to-mesenchymal transition; TGFβ, transforming growth factor-β.
Discussion
Martin et al recently described a synergistic anti-tumor activity of TGFβ1-specific antibody with checkpoint inhibitor anti-PD1 in preclinical models of bladder carcinoma, breast carcinoma and melanoma.12 Selective neutralization of TGFβ1 increased tumor infiltration of T cells and reduced accumulation of tumor-suppressive myeloid cells. These effects recapitulated previous results obtained with anti-panTGFβ antibody 1D11.26 Importantly, however, blocking TGFβ1 did not induce cardiac anomalies in a rat toxicology study, as opposed to blocking all TGFβ isoforms, suggesting a safer therapeutic index for TGFβ1-specific inhibitors as compared with panTGFβ inhibitors, including small molecule inhibitors of the tyrosine kinase activity of TGFβ receptor type I ALK5.12 Our results confirm and extend the interest of targeting TGFβ1 specifically for cancer therapy. We have compared anti-TGFβ1 and anti-TGFβ3 mAbs in two additional preclinical models, which address different aspects of the TGFβ role in tumor progression. In both models, we observed anti-tumor activity of anti-TGFβ1 but not anti-TGFβ3 mAbs. The first model is the colon carcinoma model CT26, in which TGFβ1 blockade potentiated the anti-tumor effect of prophylactic vaccination with irradiated cells. Because anti-TGFβ1 alone showed no effect in this model, the synergy with vaccination appeared immune mediated. In line with this conclusion, we observed increased infiltration of the tumors by CD8 T cells, which expressed more activation markers and less exhaustion markers. The lack of benefit of targeting TGFβ3 in this setting is in line with the findings of Terabe et al, who showed that blocking only TGFβ1 and TGFβ2 in different immunotherapy settings was as efficient as blocking all three TGFβ isoforms.52 These results indicate the therapeutic potential of selective TGFβ1 blockade in combination with immunotherapy approaches beyond checkpoint inhibitors.
Furthermore, our results in the autochthonous TiRP melanoma model highlight the therapeutic potential of TGFβ1 blockade also as a monotherapy, through a different mechanism of action that is not immune mediated. This melanoma model is characterized by a two-step progression mode, with tumors that are initially highly differentiated and slowly progressive (Mela) turning later into aggressive de-differentiated tumors (Amela). This transition is akin to EMT transition in epithelial tumors, and is associated with the appearance of abnormal inflammation and the accumulation of immunosuppressive MDSC in the TME.33 46 Aggressive Amela tumors also feature a gene signature with a strong TGFβ component and several features of the IPRES signature, which was observed in human melanomas that resist to immunotherapy or targeted therapy.25 Although the TGFβ signature of Amela TiRP tumors was described,45 46 the cellular origin of TGFβ in this model and its pathogenic role have not been studied, particularly with regard to the different isoforms. By separating tumor cells from stromal cells of TiRP melanomas, we defined the cellular source of TGFβ1 as the tumor cells themselves, while TGFβ3 was produced by stromal cells. TGFβ2 was produced only in small amounts, mostly by stromal cells. We then observed that in vivo neutralization of all TGFβ isoforms increased survival of melanoma-bearing TiRP mice. Selective blockade of TGFβ1 similarly increased survival, while blockade of TGFβ3 did not. These results highlight the key role of TGFβ1 in this model.
As mentioned above, Amela TiRP tumors are highly immunosuppressed.33 45 Surprisingly however, the anti-tumor effect the TGFβ1 blockade was not immune mediated, because it was also observed in mice that were T-cell depleted, and it was not synergistic with specific cancer vaccination. This indicated that TGFβ1 blockade did not increase survival by releasing the immunosuppressive effects of TGFβ1, but rather in a tumor-intrinsic fashion. Of note, this does not mean that TGFβ1 has no immunosuppressive function in this model, but rather suggests the presence of other immunosuppressive mechanisms that are dominant, so that only the tumor-intrinsic effect of TGFβ1 blockade can be detected in these conditions. A likely dominant immunosuppressive mechanism is the apoptosis of TILs, which is induced by Fas-ligand-expressing MDSC, as we described previously in this model.33 The tumor-intrinsic effect appears related to the EMT-like transition. Indeed, we observed a significant delay in the transition from Mela to Amela tumors in mice that received anti-TGFβ1 mAb. Because Amela tumors are highly invasive and responsible for the fatal outcome, this delay in appearance of the phenotype switch suffices to explain the increased survival of treated mice. These results indicate that the EMT-like transition is triggered by TGFβ1. The fact that it can be prevented by blocking TGFβ1 might be of great therapeutic interest, particularly in melanoma, where it could have anti-tumor effects as a monotherapy. Human melanomas produce high levels of TGFβ, and elevated TGFβ1 serum levels were found to be poor prognostic factors.1 3–5 53 EMT-related genes contribute to the promotion of the metastatic phenotype in human primary cutaneous melanomas, by supporting adhesive, invasive and migratory properties.54 Moreover, human melanomas that resist targeted therapy or immunotherapy express the IPRES signature, which encompasses an EMT-like signature similar to the one we observed in the TiRP model.25 Patients with melanoma could therefore benefit from TGFβ1-targeted therapy to prevent this EMT-like transition. It will be interesting to investigate whether carcinomas, including breast, pancreatic, lung, colorectal, hepatocellular and bladder carcinomas, which often depend on EMT for progression or metastasis could also benefit from selective neutralization of TGFβ1.55 As discussed above, the TiRP model allowed us to identify the tumor-intrinsic effect of TGFβ1 blockade, because the immune-mediated effect of TGFβ1 blockade is blunted in this model by other dominant immunosuppressive mechanisms. In other tumors that are less immunosuppressed, including some human cancers, it is likely that the two different mechanisms of actions of TGFβ1 blockade, the tumor-intrinsic effect and the immune-mediated effect, could synergize to achieve even better therapeutic benefit.
Among the various TGFβ-targeting therapies, our results, together with those of Martin et al, highlight the interest of strategies blocking specifically the TGFβ1 isoform, which plays a dominant role in both immunosuppressive and tumor-intrinsic protumoral mechanisms. Since all the therapeutic effect could be ascribed to blocking TGFβ1, the use of a TGFβ1-specific neutralizing mAb might limit the potential toxicity, particularly cardiac, as compared with panTGFβ neutralizing antibodies, such as fresolimumab, which is one of the most advanced anti-TGFβ mAbs in clinical development,8 or with small molecules targeting the kinase activity of the ALK5 receptor, which is shared by all TGFβ isoforms.56 Mice treated with mAb 13A1 did not show obvious toxicity. We did not perform histopathological examination searching for cardiac valvulopathy in these mice. Such toxicities are better detected in rats, and Martin et al demonstrated the absence of cardiac lesions in rats treated with their selective TGFβ1-neutralizing mAb, while cardiac valvulopathies were observed in rats neutralized for all TGFβ isoforms with anti-panTGFβ mAb 1D11 or with an ALK5 inhibitor.12Because it is highly selective for TGFβ1, mAb 13A1 is therefore expected not to induce cardiac toxicity, although this has not been formally tested.
The antibody we used here recognized mature, but not latent TGFβ1. This is opposite to Martin et al, who developed an antibody that only recognized latent TGFβ1 and prevented its activation.12 The only reason Martin et al opted to neutralize latent and not mature TGFβ1 is that they expected high difficulties in obtaining an isoform-specific mAb against mature TGFβ, because mature isoforms have high sequence and structural similarity, while the TGFβ prodomains show more sequence variability between isoforms.12 We disproved this prediction by describing highly specific mAbs against mature TGFβ1 or TGFβ3. We did not try to obtain TGFβ2-specific mAb, because at the time of initiation of this research program we could not obtain recombinant TGFβ2 to immunize mice. From a clinical development standpoint, it is unclear which of mature or latent-specific anti-TGFβ1 mAb holds the most promise. In vitro assays showed similar IC50 for both antibodies, in the nanomolar range. Antibodies to mature TGFβ1 are expected to be directly active on any source of TGFβ1, whatever the activation mechanism, as opposed to antibodies to latent TGFβ1, which require validation in the various molecular contexts of TGFβ1 activation. This was done by Martin et al regarding four well-known activation pathways, involving LTBP1, LTPB3, GARP and LRRC33.12It is not impossible that other TGFβ activation pathways remain to be described, which have not been tested. An important difference between latent and mature TGFβ1 is that the former is immobilized on the ECM or the cell surface through its interaction with LTPBs, GARP or LRRC33, while mature TGFβ1 is released. Latent TGFβ1 neutralization is therefore expected to have longer lasting effects as compared with mature TGFβ1 neutralization, for which removal of the mAb from the circulation allows TGFß1 activation to resume. Although these longer term effects of latent TGFß1 neutralization may be beneficial to maximize therapeutic efficacy, they may also reduce opportunities to quickly reduce TGFβ1 inhibition to manage potential side effects. A side-by-side comparison of the two types of TGFβ1-specific neutralizing antibodies could help determine their respective merits. In any case, the availability of TGFβ1-specific reagents opens new opportunities. In that respect mAb 13A1 represents a promising drug candidate for clinical development in combination with various forms of cancer immunotherapy, but also as a monotherapy in cancer types that rely on EMT for progression, including melanomas.
Acknowledgments
We thank Pamela Cheou for excellent technical help, Sophie Lucas and Thierry Boon for helpful suggestions, the LAF animal facility for production of TiRP mice, and Auriane Sibille and Isabelle Grisse for editorial assistance.
References
Supplementary materials
Supplementary Data
This web only file has been produced by the BMJ Publishing Group from an electronic file supplied by the author(s) and has not been edited for content.
Footnotes
Contributors CU, LP and JVS—production and characterization of mAbs 13A1 and 1901. SC and BJVdE—tumor models. SC and BJVdE—conception, design and supervision. SC and BJVdE—development of methodology. SC—acquisition of data. SC and BJVdE—analysis and interpretation of data. SC and BJVdE with help from all authors—writing and revision of the manuscript.
Funding This work was supported by Ludwig Cancer Research, de Duve Institute (Belgium), WELBIO and UCLouvain (Belgium). This work was also supported by a grant from Belgian Foundation against Cancer (grant number: 2010-174). SC was supported by a fellowship from FNRS-Télévie (grant number: 7.4538.14).
Competing interests BJVdE is co-founder of, has ownership interest in, and is SAB member of iTeos Therapeutics.
Patient consent for publication Not required.
Ethics approval All procedures were performed with the approval of the local Animal Ethical Committee, with reference 2015/UCL/MD/15.
Provenance and peer review Not commissioned; externally peer reviewed.
Data availability statement Data sharing not applicable as no datasets generated and/or analyzed for this study. All data relevant to the study are included in the article or uploaded as supplemental information.
Supplemental material This content has been supplied by the author(s). It has not been vetted by BMJ Publishing Group Limited (BMJ) and may not have been peer-reviewed. Any opinions or recommendations discussed are solely those of the author(s) and are not endorsed by BMJ. BMJ disclaims all liability and responsibility arising from any reliance placed on the content. Where the content includes any translated material, BMJ does not warrant the accuracy and reliability of the translations (including but not limited to local regulations, clinical guidelines, terminology, drug names and drug dosages), and is not responsible for any error and/or omissions arising from translation and adaptation or otherwise.