Article Text

Abstract
Background Despite approval of immunotherapy for a wide range of cancers, the majority of patients fail to respond to immunotherapy or relapse following initial response. These failures may be attributed to immunosuppressive mechanisms co-opted by tumor cells. However, it is challenging to use conventional methods to systematically evaluate the potential of tumor intrinsic factors to act as immune regulators in patients with cancer.
Methods To identify immunosuppressive mechanisms in non-responders to cancer immunotherapy in an unbiased manner, we performed genome-wide CRISPR immune screens and integrated our results with multi-omics clinical data to evaluate the role of tumor intrinsic factors in regulating two rate-limiting steps of cancer immunotherapy, namely, T cell tumor infiltration and T cell-mediated tumor killing.
Results Our studies revealed two distinct types of immune resistance regulators and demonstrated their potential as therapeutic targets to improve the efficacy of immunotherapy. Among them, PRMT1 and RIPK1 were identified as a dual immune resistance regulator and a cytotoxicity resistance regulator, respectively. Although the magnitude varied between different types of immunotherapy, genetically targeting PRMT1 and RIPK1 sensitized tumors to T-cell killing and anti-PD-1/OX40 treatment. Interestingly, a RIPK1-specific inhibitor enhanced the antitumor activity of T cell-based and anti-OX40 therapy, despite limited impact on T cell tumor infiltration.
Conclusions Collectively, the data provide a rich resource of novel targets for rational immuno-oncology combinations.
- immunotherapy
- tumor microenvironment
This is an open access article distributed in accordance with the Creative Commons Attribution Non Commercial (CC BY-NC 4.0) license, which permits others to distribute, remix, adapt, build upon this work non-commercially, and license their derivative works on different terms, provided the original work is properly cited, appropriate credit is given, any changes made indicated, and the use is non-commercial. See http://creativecommons.org/licenses/by-nc/4.0/.
Statistics from Altmetric.com
Background
Over the last decade, cancer immunotherapies involving the use of immune checkpoint blockade (ICB) or adoptive cellular transfer (ACT) have emerged as revolutionary therapeutic milestones in oncology. Given the durable clinical benefit observed in a portion of ICB-treated patients, ICBs are now standard front-line treatments for multiple advanced solid cancers, including melanoma,1 non-small-cell lung cancer,2 and head and neck squamous cell carcinoma.3 Additionally, ACT using either ex vivo expanded autologous tumor infiltrating T cells (TILs) or genetically engineered tumor-reactive T cells can also achieve clinical response of 40% in patients with advanced melanoma.4 Despite these recent advances in cancer treatment, many patients with solid tumors still fail to respond due in part to immunosuppressive mechanisms co-opted by tumor cells to subvert the immune response. Therefore, there is an urgent need to identify such immunosuppressive mechanisms in order to develop novel strategies aimed at overcoming immune resistance in patients with cancer.
Recent studies suggest that tumor cells can exploit a broad range of immunosuppressive factors to limit the therapeutic effects of immunotherapy. Many of these factors control two rate-limiting steps of T cell-mediated antitumor immunity, namely, the trafficking of T cells to the tumor and T cell-mediated tumor killing. Achieving durable antitumor activity requires to improve the efficiency of both steps with either monotherapy or combination therapies. Studies from our group and others have demonstrated that dysregulation of tumor intrinsic pathways can promote immune resistance via regulating these two rate-limiting steps.5–8 In particular, our preclinical results demonstrating the immunosuppressive role of hyperactivated PI3K pathway6 enabled an ongoing clinical trial to evaluate the safety and efficacy of combining PI3Kβ-specific inhibition with ICB in patients with phosphatase and tensin homolog (PTEN)-loss melanoma.9 Therefore, a basic understanding of the role of individual tumor intrinsic factors in regulating these two rate-limiting steps can empower the rational design of mono/combination therapies. However, it is challenging to use conventional methods to systematically evaluate the potential of tumor intrinsic factors to act as immune regulators in patients with cancer.
Current advances in the development of gene-editing tools and defining molecular profiles in patients with cancer provide unique platforms to interrogate the contributions of tumor intrinsic factors in immune resistance in an unbiased manner. The Cancer Genome Atlas (TCGA), a landmark cancer genomics project funded by the National Institutes of Health, has profoundly illuminated the molecular landscape of at least 20,000 primary cancers and matched normal samples spanning 33 cancer types.10 11 Several recent studies have successfully used the deposited genomic, transcriptomic and proteomic data to comprehensively characterize the tumor microenvironment (TME) and explore the key regulators that shape the TME.12 13 In parallel, high-throughput genetic screens using thousands of lentiviral-encoding guide RNAs (gRNAs) combined with the next-generation sequencing (NSG) have been developed and used to functionally interrogate the role of tumor intrinsic factors in cell growth/viability and drug resistance.14 15 Although the clinical datasets generated by TCGA project and the preclinical studies using genetic screens have been individually used to address molecular determinants for tumor immune exclusion phenotype5 13 16 and resistance to T cell killing,17–19 respectively, there are limited studies that effectively integrate the results from these two resources. Given that tumor immune infiltration and tumor killing by T cells are both rate-limiting steps in antitumor immune response, it is our hypothesis that integrating unbiased immune functional screens with correlative studies using clinical data can better reveal a mechanistic blueprint of immune evasion in non-responders to cancer immunotherapy.
In this study, we designed an unbiased integrative strategy to leverage the complementary strength of in vitro functional genomic screens and multi-omic clinical data to assess the role of individual tumor intrinsic factors in regulating T cell tumor infiltration and T cell-mediated tumor killing. For the in vitro screen, a genome-wide CRISPR-Cas9 screening system using paired murine tumors and tumor-reactive T cells was employed to systematically screen tumor intrinsic factors that modulate the sensitivity of tumor cells to T cell-mediated killing. Then, we integrated our findings with the bioinformatics analysis of clinical datasets to further evaluate the role of each tumor intrinsic factor in governing antitumor immunity. Our integrative analysis not only successfully identified several novel tumor intrinsic factors as effectors of immune resistance but also demonstrated the involvement of these factors in controlling two rate-limiting steps in antitumor immune responses: T cell tumor infiltration and T cell-mediated killing of tumor cells. By using PRMT1 and RIPK1 as representatives of two classes of immune regulators, we confirmed their distinct immunoregulatory roles in murine and human tumor models, and demonstrated their potential as therapeutic targets to enhance T cell-mediated antitumor activity. In summary, the data generated in this study provide a rich resource for uncovering tumor intrinsic factors/pathways, which can be targeted to improve the antitumor activity of T cell-based cancer immunotherapies.
Methods
Cell lines and mice
MC38, H2023, and HEK293T cells were obtained from either the National Cancer Institute (NCI) or the American Type Culture Collection (ATCC). Pmel-1 T cells used in in vitro assays and luciferase-expressing pmel-1 T cells used for in vivo studies were generated as previously described.20 Given that H2023 is a human lung cancer cell line expressing both MAGE-B2 and HLA-A0201, we generated T cells that can recognize HLA-A2-restricted MAGE-B2 as previously described.21 Additional information for cell culture condition, generation of tumor-reactive T cells and genetically modified tumor cell lines was provided in the online supplemental methods.
Supplemental material
Pmel-1 TCR/Thy1.1 transgenic mice on a C57BL/6 background were a general gift provided by Dr Nicholas Restifo (NCI) and in-house bred. C57BL/6 mice, C57BL/6 albino mice and nude mice were purchased from the Charles River Frederick Research Model Facility. All mice were maintained in a specific pathogen-free barrier facility at either the University of Texas MD Anderson Cancer Center (MDACC) or the University of Houston. Mice were handled in accordance with protocols approved by Institutional Animal Care and Use Committees.
Genome-scale CRISPR-Cas9 screen in MC38/gp100 cells
The mouse improved genome-wide knockout CRISPR Library version 2 consisting of 90,230 gRNAs targeted 18,424 genes was purchased from Addgene.22 Viral supernatants were generated as previously described. 1.5×10⁸ of MC38/gp100-Cas9 cells (MC38/GC cells) were transduced with pooled library lentivirus at low multiplicity of infection (MOI; ~0.15–0.2) and cultured with growth medium in the presence of 2 µg/mL puromycin to select gRNA-transduced cells. One week after selection, pooled gRNA-transduced tumor cells were seeded for overnight. For the T cell-treated groups, cultured Pmel T cells were added at an effector:target (E:T) ratio of 0.3:1 and 1:1 for 16 hours. For the non-T cell-treated groups, equal amount of T cell growth medium was added. After treatment, non-adhesive cells including T cells and dead tumor cells were removed by repeated wash using prewarmed phosphate-buffered saline (PBS). Additionally, tumor cells after 48-hour or 7-day puromycin selection were collected to determine the coverage of the genome-wide library in transduced cells before our functional immune screen. Triplication was performed for all treatment groups, and each sample includes at least 3×10⁷ of transduced tumor cells.
Genomic DNAs were extracted from tumor samples by Blood & Cell Culture DNA Maxi Kit (Qiagen). After genomic DNA isolation, gRNAs were amplified and barcoded with adaptation by nested PCR as previously described.22 The primers used for the PCR were listed in the online supplemental table 1. The PCR products were purified by using NucleoSpin Gel and PCR Clean-up Kit (Macherey-Nagel). Samples were then sequenced by Illumine NSG at MDACC Genomics Core.
Cytotoxicity assays
Two independent assays by flow cytometry or real-time imaging were used to determine tumor sensitivity to T cell-mediated killing. For the flow cytometry-based cytotoxicity assay, tumor cells were mixed with paired tumor-reactive T cells at 37°C for 3 hours. The percentage of cleaved caspase-3+ cells in tumor cells was assessed by FACS Canto II (BD Biosciences). Additionally, we performed high-throughput time-lapse imaging microscopy in nanowell grids (TIMING) to real-time monitor T cell-mediated killing process at the single cell level as previously described.23 Detailed information for both assays was provided in the online supplemental methods.
Immunoblot analysis
Proteins were extracted by lysed tumor cells using RIPA lysis and extraction buffer (Thermo Fisher Scientific). The western blot analysis was used to determine the expression of total and phosphorated proteins. The intensity of protein bands was detected using ECL Plus (GE Healthcare Life Sciences) using the ChemiDoc Imaging System (Bio-Rad). The antibodies targeting Phospho-IκBα (Ser32) (clone 14D4, #9246), IκBα (clone 44D4, #4812), Phospho-RELA (Ser536, #3033), RELA (clone D14E12, #8242) and β-actin (8H10D10, #3700) were purchased from the Cell Signaling Technology and used for western blot analysis.
In vivo murine tumor models
Additionally, 5×10⁵ of genetically modified MC38/gp100 tumors were subcutaneously injected into either nude or C57/BL6 mice. For the mice treated with immunomodulatory antibodies, 6 days after tumor inoculation, tumor-bearing mice were intraperitoneally administrated with either anti-PD-1 (BioLegend, clone 29F.1A12) or anti-OX40 (BioXcell, clone OX86) at the dose of 100 µg/dose, twice per week. Tumor sizes in all experimental mice were monitored by measuring the perpendicular diameters of the tumors every 3 days. To determine the in vivo effect of GSK2982772, a RIPK1-specific inhibitor, on the function of tumor-reactive CD8+ T cells, luciferase-expressing Pmel-1 T cells were transferred into C57BL/6 albino mice-bearing MC38/gp100 tumor as previously described.20 GSK2982772 (25 mg/kg; ChemieTek) suspended in vehicle (1% methylcellulose) was administered daily via oral gavage daily. All experiments were carried out in a blinded, randomized fashion.
Statistical and bioinformatics analyses
Summary statistics (eg, mean, SEM) of the data are reported. Assessments of differences in continuous measurements between two groups were made using two-sample t-test posterior to data transformation (typically logarithmic, if necessary), or Mann-Whitney U test. Differences in tumor size among several treatments were evaluated using analysis of variance models with the Tukey’s multiple comparisons test. The log-rank test was used to assess the statistical significance of survival rate difference between two groups. A p value of less than 0.05 was considered significant. Graph generation statistical analyses were performed using the Prism software program (GraphPad Software), Tableau V.8.2 software program (Tableau Software), and R software programming language (V.3.1.0). The sample size for each experiment was chosen based on the study feasibility given its exploratory nature. Samples that did not meet proper experimental conditions were excluded from the analysis. Detailed information of bioinformatics analysis for the NGS results from the genome-wide gRNA screens and RNA-seq results in TCGA dataset was provided in the online supplemental Methods. The raw RNA-seq data in fastq format and calculated gene-level expression data have been deposited in the NCBI GEO database (GSE161496).
Results
Identification of tumor intrinsic factors regulating tumor sensitivity to T cell-mediated killing
To functionally interrogate the contribution of tumor intrinsic pathways to tumor immune evasion, we developed a genome-wide CRISPR/Cas9-based immune screen using pooled gRNA libraries (figure 1A). This CRISPR/Cas9 immune screen employed a murine colon adenocarcinoma cell line MC38, expressing the melanoma antigen gp100 (MC38/gp100), paired with tumor-reactive murine Pmel T cells that can specifically recognize gp100 in an H2-Db-restricted manner. This screen was based on the premise that the tumor cells expressing gene-specific gRNAs that target immune resistance genes would be significantly depleted on coincubation with tumor-reactive T cells, when compared with other gRNA-expressing cells (figure 1A). The MC38/gp100 cell line was first engineered to overexpress Cas9, which was confirmed by western blot analysis (online supplemental figure S1A). We then transduced Cas9-expressing MC38/gp100 (MC38/GC) cells with a murine genome-wide knockout CRISPR-gRNA library, which includes 90,230 sgRNAs targeting 18,424 genes.22 Infected tumor cells were then subjected to puromycin selection. To achieve a 50%–80% rate of T cell-mediated tumor killing, which is an optimal selection pressure for an in vitro dropout screen,7 we performed pilot studies to determine the cytotoxic effect of cultured Pmel T cells on MC38/GC tumor cells at different effector to target (E:T) ratios. Based on the results from the pilot experiment (online supplemental figure S1B), we selected the E:T ratios of 0.3:1 (ET0.3) and 1:1 (ET1) to represent conditions of weak and moderate T cell-selection pressure, respectively. The frequencies of gRNAs in pooled tumors among triplicate samples were highly correlated, thereby providing evidence of the consistency of our barcode sequencing results (online supplemental figure S1C). To remove gRNAs targeting genes that can broadly control cell proliferation and survival before our functional immune screens, pooled gRNA-expressing tumor cells were expanded in vitro for 7 days. Additionally, we referenced data from a previously reported genetic vulnerability screen24 to categorize the gRNA library into three subsets: essential genes (n=360), non-essential genes (n=927), and other genes (n=17 137). By comparing the distribution of the density of each gRNA group in pooled tumor samples, we observed that the overall distribution of the three gRNA groups in the reference samples was comparable. In contrast, a proportion of gRNAs in the essential group was significantly reduced in the samples after the 7-day expansion, but not in the non-essential and other groups (online supplemental figure S1D). This suggests that the 7-day expansion not only removed a series of gRNAs targeting key molecules for cell proliferation and survival, but also largely preserved the representation of a majority of gRNAs, particularly those in the non-essential and other groups, in pooled tumor cells before the immune screen.
Supplemental material
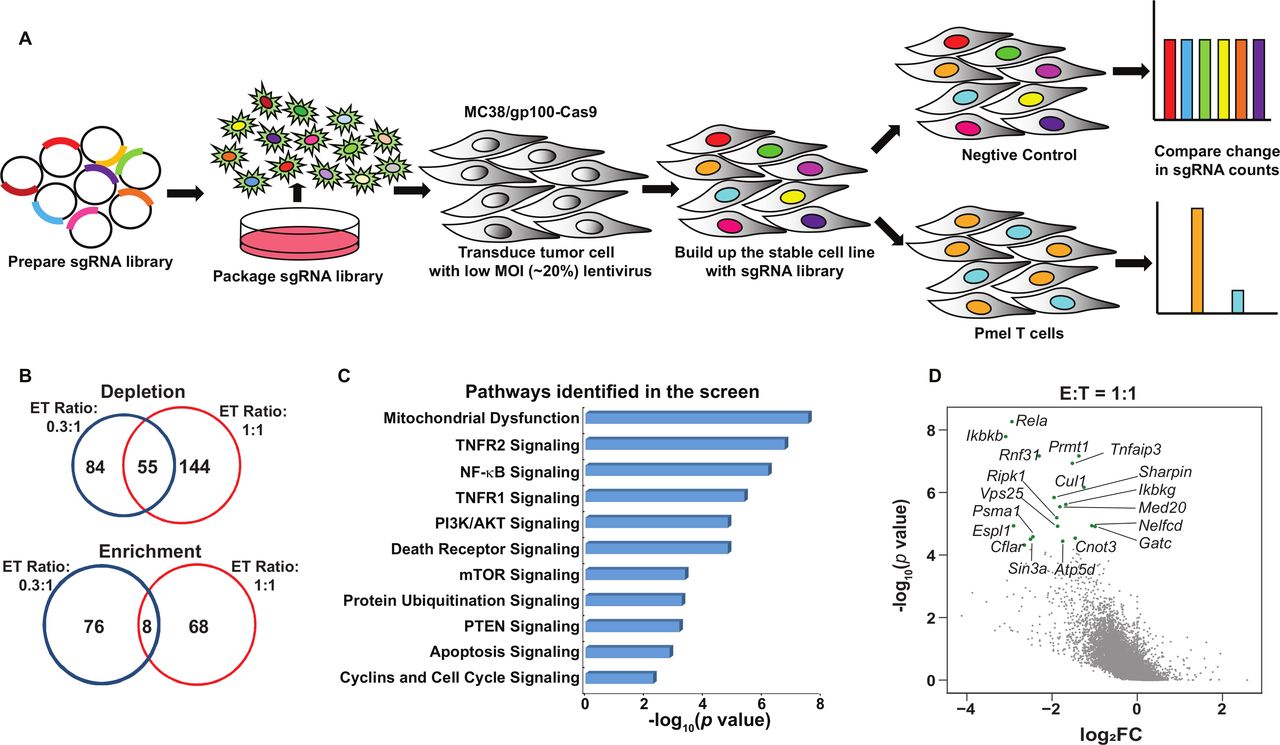
Systematical discovery of tumor intrinsic factor regulating sensitivity to T cell-mediated killing. (A) A schematic diagram of the functional genome-wide CRISPR/Cas9-based immune screen strategy. A genome-wide sgRNA library (five sgRNAs per gene) was transduced into Cas9-expressing MC38/gp100 cells. Pooled MC38/gp100 cells were cocultured with tumor-reactive Pmel T cells, and followed by the next-generation sequencing of sgRNA representation. Tumors without T cell treatment were served as controls. (B) A Venn diagram illustrating the degree of overlapped candidates identified by two screens under different selection pressure. The numbers of genes whose gRNAs were significantly depleted or enriched in T cell-treated groups (|log2 (fold-change)|>1 and p<0.05) at the effector and target ratio (ET) of 0.3:1 (blue) and/or 1:1 (red) were indicated. (C) Ingenuity pathway analysis of results from the screen at the ET ratio of 1:1 revealed tumor-associated immunosuppressive pathways. (D) A scatterplot of individual gene changes in the T cell-treated groups at the ET ratio of 1:1. The changes of genes were plotted based on fold changes of their targeting sgRNAs and p values computed by MAGeCK (Model-based Analysis of Genome-wide CRISPR-Cas9 Knockout) when compared the groups with and without T cell treatment. Top depleted genes in T cell-treated groups were highlighted with green dots. MOI, multiplicity of infection.
Next, we determined the fold change (FC) in the frequency of each gRNA in tumor cells with and without T cell coincubation. Using an FC cut-off in gRNA frequency (Log2FC<-1) and a statistically significant threshold of p<0.05, we found that 139 genes and 199 genes were significantly depleted in the ET0.3 and ET1 groups, respectively. Among them, 55 genes were identified under both conditions (figure 1B). As expected, more gRNAs in the essential group were significantly depleted in the samples under moderate selection pressure when compared with those under weak selection pressure (online supplemental figure S1E). We further performed gene ontology analysis using the list of depleted genes in the T cell-treated groups and identified several validated immunosuppressive pathways, such as PI3K-related pathways and the OXPHOS pathway (figure 1C).6 25 These results demonstrate that our optimized dropout screen can accurately recapitulate the contributions of tumor intrinsic factors to govern tumor sensitivity to T cell-killing. Importantly, our screen also led to the identification of novel immunological roles of a set of genes in traditional cancer signaling pathways, including molecules in the nuclear factor κB (NF-κB) pathway (Rela, Ikbkb, Ikbkg), tumor necrosis factor (TNF) pathway (Ripk1, Tnfaip3), and protein ubiquitination pathway (Psma1, Cul1) (figure 1D).
The distinct contributions of identified candidates to the regulation of tumor immune infiltration in patients with cancer
To evaluate the involvement of genes identified in our in vitro dropout screen in regulating tumor immune infiltration, we aligned these murine candidate genes with their human orthologs and found that 189 depleted candidates under moderate selection pressure (ET1) have matched human orthologs. Next, we extracted their RNA-seq-based expression profiles from the publicly available SKCM-TCGA dataset. Histologically reviewed lymphocyte infiltration scores (L scores) were also collected and used to determine immune infiltration at tumor sites. By using an L score cut-off of 3, we stratified patients with melanoma in the TCGA dataset into two groups, namely, the high lymphocyte infiltration (L score >3) and low lymphocyte infiltration (L score ≤3) groups. Among these candidates, 48 genes were significantly downregulated in melanomas with high lymphocyte infiltration (inflamed tumors) in comparison to those with poor lymphocyte infiltration (non-inflamed tumors) (figure 2A, table 1), underscoring their potential to modulate two rate-limiting steps of tumor immune response, namely, immune cell trafficking and tumor sensitivity to T cell-killing. These candidates were termed as dual immune resistance regulators (subsequently referred to as dual regulators). The remaining identified candidates whose expression levels were not associated with tumor immune infiltration were termed as cytotoxicity resistance regulators (subsequently referred to as cytotoxicity regulators). Additionally, 16 of the 48 genes were also identified under low T cell selection pressure (table 1). To confirm the distinct roles of two types of candidates in shaping TME, we selected one dual regulator and one cytotoxicity regulator that were top-ranked hits identified under both selection conditions to determine their association with a variety of immune gene expression signatures within tumor tissues. PRMT1, a member of the protein arginine N-methyltransferase family, was selected to represent dual regulators. As shown in figure 2B, increased PRMT1 expression was found in melanomas with poor immune cell infiltration. On the other hand, receptor‐interacting protein kinase 1 (RIPK1) whose expression levels are comparable between high and low immune infiltration groups (figure 2B), was chosen to represent cytotoxicity regulators. Given that the Cytolytic Activity Score (CYT) has been reported as a prognostic immune marker in patients with melanoma,16 we examined the correlation between the CYT and the expression of selected candidates, and found that the expression of PRMT1, but not RIPK1, was significantly higher in melanoma with low CYT (figure 2C). Besides melanoma, the analysis of pan-TCGA data including 33 types of cancers revealed that PRMT1 expression was also negatively correlated to CYT in patients with adrenocortical carcinoma (p=0.00204, r=−0.346), thyroid cancer (p=0.000104, r=−0.171) and sarcoma (p=0.0292, r=−0.135). In contrast, no meaningful negative correlation was observed between CYT and RIPK1 expression in tumor types across TCGA. Furthermore, we used the TCGA SKCM tumor purity calculated by previous studies26 27 to exclude the samples with tumor purity <0.5 from the correlation analysis to control for the confounding effect caused by poor tumor tissue purity. The negative correlation between PRMT1 expression and L score/CYT remains statistically significant in samples with relatively high tumor purity, whereas there is no significant correlation between RIPK1 expression and L score/CYT in the same set of tumors (online supplemental figure S2A,B). In addition to PRMT1, ALDOA, whose immunoregulatory role was reported in our previous study,7 was also identified as a dual regulator from the screen under moderate selection pressure. Similar to PRMT1, melanomas with high ALDOA expression displayed reduced L score and CYT (online supplemental figure S3A,B). Negative correlations between ALDOA and CYT were also found in a broad range of solid cancer types (online supplemental figure S3C). Moreover, we employed a computational deconvolution approach known as Cell-type Identification By Estimating Relative Subsets of RNA Transcripts (CIBERSORT)28 to characterize the cellular composition in the TME. Our analysis using the SKCM-TCGA dataset revealed a strong negative correlation between PRMT1 expression and the presence of CD8+ T cells in the TME (figure 2D). In addition to CD8+ T cells, tumors with high PRMT1 expression displayed low abundance of other types of antitumor effector cells, including CD4+ T helper cells, plasma cells, M1 macrophage and activated natural killer (NK) cells (figure 2D). However, the expression of RIPK1 only weakly correlates the presence of regulatory T cells and plasma cells in the TME (figure 2D). Taken together, integrating the clinical sample analysis with the genomic-wide genetic screen revealed a set of tumor intrinsic factors with the capability to control T cell-mediated tumor killing and/or shape the TME.
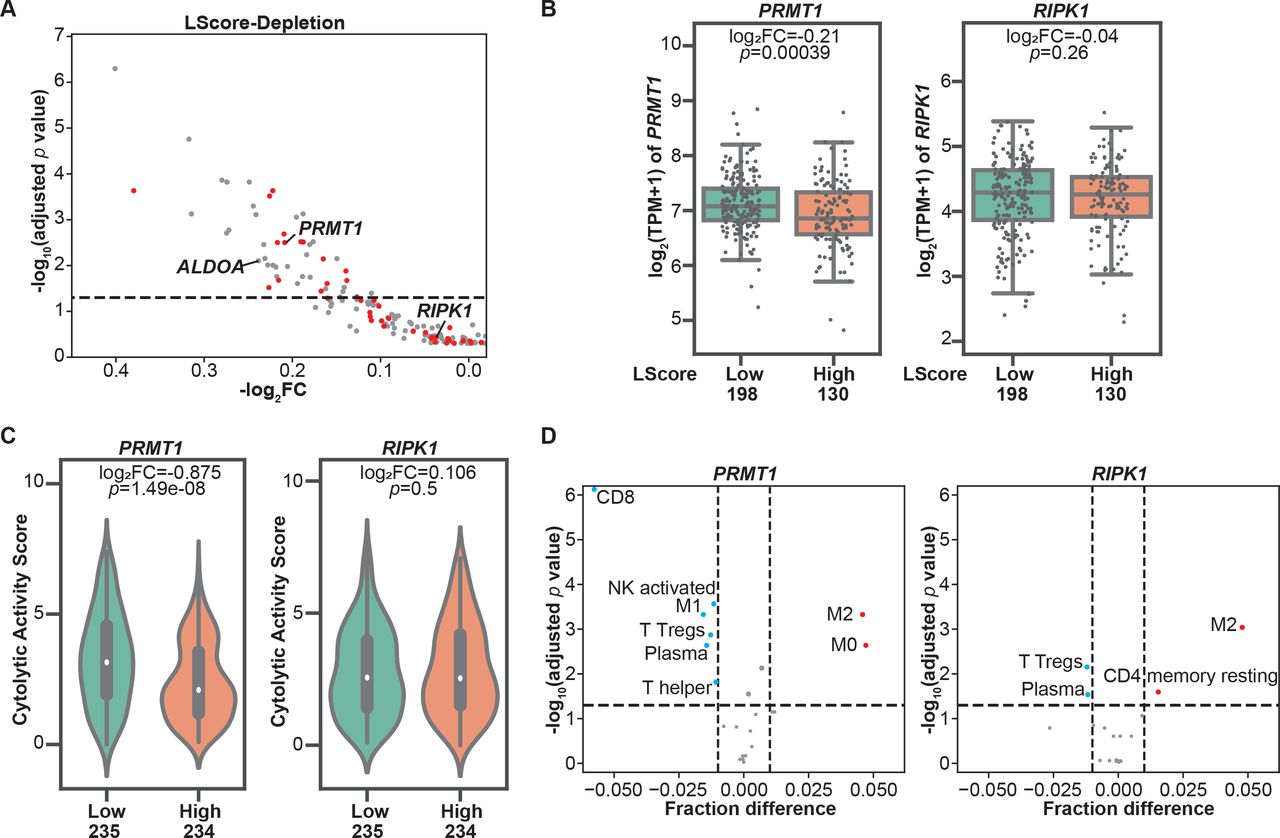
Immune regulators with the potential to modulate tumor microenvironment revealed by clinical database analysis. (A) Correlations between the expressions of resistance regulators identified in the CRISPR screens and tumor immune infiltration. Patients with cutaneous melanoma whose information was included in The Cancer Genome Atlas (TCGA) were stratified based on lymphocyte infiltration score (L score). A scatterplot was used to demonstrate the differences in mRNA expression levels of these candidate genes in high lymphocyte infiltration (L score >3) and low lymphocyte infiltration (L score ≤3) groups. Candidate genes identified under both screen conditions (effector:target ratio (ET) at 0.3:1 and 1:1) were highlighted with red dots. The dashed line indicates an adjusted p value at 0.05. (B) Boxplots of mRNA expression of PRMT1 and RIPK1 in inflamed (L score >3) and non-inflamed (L score ≤3) groups. The log2 fold changes (inflamed vs non-inflamed) of TPM of PRMT1/RIPK1 in inflamed and non-inflamed groups were calculated, and their related p values were indicated in the corresponding plot. (C) Comparison of intratumoral cytolytic activity (CYT) in melanomas with different expression levels of PRMT1/RIPK1. The median of mRNA expression (PRMT1 or RIPK1) was used to stratify the clinical samples in the SKCM TCGA dataset. The log2 fold changes (high vs low) of CYT and their related p values were indicated in the corresponding plot. (D) The profiles of tumor-infiltrating immune cells in melanomas with different expression of PRMT1/RIPK1. CIBERSORT analysis was performed to determine the association between the abundance of immune cells and the levels of PRMT1/RIPK1 expression in SKCM-TCGA database. Immune cell types with significant negative correlation (fraction difference <−0.01 by dashed line on the X axis and p<0.05) were highlighted with blue dots, and immune cell types with significant positive correlation were highlighted with red dots. NK, natural killer.
List of dual regulators (left) and cytotoxicity regulators (right) identified by the screens under two different types of selection pressure
Genetic depletion of PRMT1 or RIPK1 increases tumor sensitivity to T cell-mediated killing
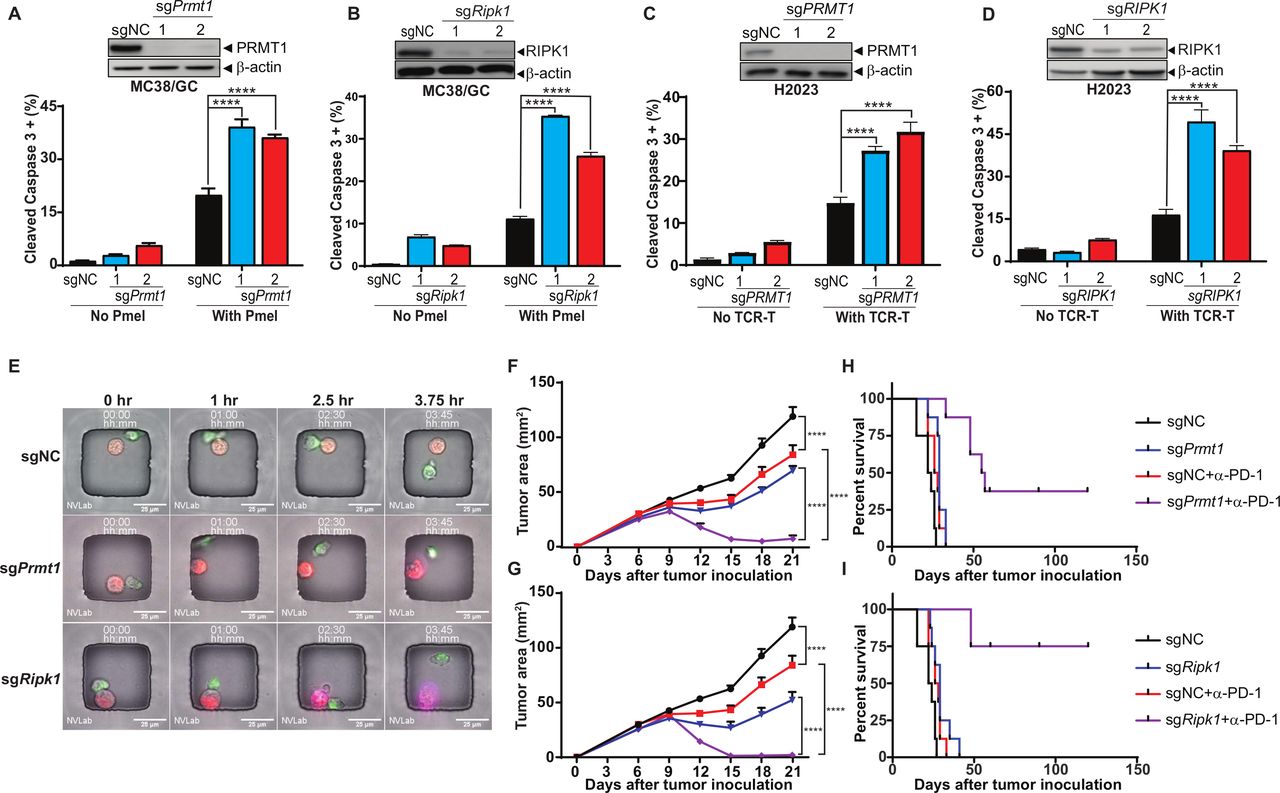
To validate the roles of PRMT1 and RIPK1 in regulating tumor response to T cell-mediated antitumor immune response, we knocked out the expression of PRMT1 or RIPK1 in both murine (MC38/GC) and human (H2023) tumor cells using two independent gRNAs and generated a set of tumor cell lines with either PRMT1 or RIPK1 knockout (figure 3A–D, upper panels). After coculturing with Pmel T cells, MC38/GC cells with stable expression of either Prmt1-specific or Ripk1-specific gRNAs were more sensitive to T cell-induced killing, which was determined by the percentage of tumor cells expressing cleaved caspase-3 (figure 3A,B, lower panels). Given that H2023 cells were derived from an HLA-A2 lung cancer patient expressing MAGE-B2, an identified tumor antigen, we generated human HLA-A2-restricted, MAGE-B2-specific TCR-T cells and evaluated the impact of PRMT1 and RIPK1 inhibition on susceptibility of H2023 to the apoptosis induced by these T cells. Consistent with murine tumor cells, knocking out of PRMT1 or RIPK1 significantly enhanced the apoptosis rate of H2023 cells after coincubation with paired tumor-reactive T cells (figure 3C,D, lower panels).

Genetic depletion of PRMT1 or RIPK1 enhancing tumor cell sensitivity to T cell-mediated killing. (A, B) Knocking out of Prmt1 and Ripk1 increases murine tumor sensitivity to T cell-mediated killing. By using two independent sgRNAs, a set of Cas9-expressing MC38/gp100 cell lines with either Prmt1 or Ripk1 knockout were successfully generated. The knockout of Prmt1 or Ripk1 in these cells was confirmed by western blot (A and B, upper panel). Genetically modified MC38/GC cells were exposed to tumor-reactive Pmel T cell with the effector:target (ET) ratio at 1:1 for 3 hours. The apoptosis rate of tumors was determined by the percentage of tumor cells expressing cleaved caspase-3 (A and B, lower panel). (C, D) Knocking out of PRMT1 and RIPK1 increases human tumor sensitivity to T cell-mediated killing. Cas9 expression H2023 cells were modified to express PRMT1 or RIPK1-specific sgRNAs. The knockout efficiency of PRMT1 and RIPK1 in these cells was validated by western blot (C and D, upper panel). Genetically modified H2023 cells were exposed to paired MAGE-B2-specific TCR T cell with the ET ratio at 3:1 for 4 hours and followed by flow cytometry analysis to determine tumor apoptosis rate (C and D, lower panel). (E) Representative imagines using time-lapse imaging microscopy to monitor T cell-mediated tumor killing at the single cell level. Equal numbers of genetically modified MC38/GC cells (red) and Pmel T cells (green) were loaded in the nanowells and cultured for additional 4 hours. Time-series imaging data were recorded and used to determine the morphology change and apoptosis (annexin staining; purple) of tumors during the course of coculture. (F, G) Inhibition of Prmt1/Ripk1 potentiates T cell-mediated antitumor activity of anti-PD-1 treatment in vivo. MC38/GC transduced with gRNAs specific for either Prmt1 (sgPrmt1; F) and Ripk1 (sgRipk1; G) were inoculated into C57BL/6 mice. Mice-bearing tumors expressing non-targetable sgRNA (sgNC) were used as controls. Seven days after tumor inoculation, mice with measurable tumors were randomly treated with either control antibody or anti-PD-1 (100 µg). Tumor area was measured every 3 days. (H, I) Anti-PD-1 treatment significantly extends survival of mice-bearing Prmt1/Ripk1 knockout tumors, but not control tumors. Kaplan-Meier survival curves from all experimental groups were plotted and recorded. Representative data from at least two independent experiments are shown. Log-rank test demonstrated statistical significance (p<0.05): sgNC versus sgPrmt1/Ripk1 or sgNC+anti-PD-1 or sgPrmt1/Ripk1+anti-PD-1; sgNC+anti-PD-1 versus sgPrmt1/Ripk1+anti-PD-1; sgPrmt1/Ripk1 versus sgPrmt1/Ripk1+anti-PD-1 (n=6–8). ****p<0.0001.
In addition to using flow cytometry-based cytotoxicity assays, we also leveraged our recently optimized live cell imaging method known as time-lapse imaging microscopy in nanowell grids23 to monitor T cell-induced killing of genetically modified individual tumor cells in real time. Equal numbers of MC38/GC tumor cells (red dye) and Pmel T cells (green dye) were labeled with lipophilic membrane dyes and co-incubated in the nanowell grids, and the induction of apoptosis was monitored using changes in morphology and annexin V staining. As shown in the representative images (figure 3E), the color and morphology of control tumor cells, which expressed a non-targeting gRNA (sgNC), remained unchanged within 3.75 hours after coincubation with T cells. However, annexin V-stained tumor cells were observed in Prmt1-specific gRNA-expressing tumor cells (sgPrmt1), within 3.75 hours after coincubation with T cells. Moreover, Ripk1-deficient tumor cells (sgRipk1) displayed morphological changes and became Annexin V staining positive as early as 2.5 hours after T cell treatment (figure 3E). These results confirmed that inhibition of Prmt1 or Ripk1 is sufficient to increase tumor sensitivity to T cell killing in vitro.
We further performed RNA-seq analysis to determine the transcriptomic profiles of sgPrmt1, sgRipk1 and sgNC tumor cells, and to identify the differentially expressed genes on Prmt1/Ripk1 knockout. By using gene set enrichment analysis (GSEA), we found that inhibiting Prmt1/Ripk1 can significantly alter the expression of genes in the apoptosis and IFN pathways, which could contribute to the enhanced sensitivity of sgPrmt1 and sgRipk1 tumor cells to T cell-mediated killing (online supplemental figure S4A–C). Although knocking out Prmt1 in MC38 tumor cells leads to major changes in the RNA level of multiple cytokines/chemokines, such as Vegfa, Ccl7 and Ccl9, no major changes in RNA level were observed for these cytokines/chemokines in sgRipk1 when compared with sgNC tumor cells (online supplemental figure S4D). Given that cytokines/chemokines are key immune regulators for immune cell trafficking, these results imply that PRMT1 and RIPK1 could play distinct roles in controlling tumor infiltration of immune cells.
Next, we examined the impact of genetic inhibition of Prmt1 and Ripk1 in murine tumor models. Although knocking out of Prmt1 or Ripk1 did not affect tumor growth in immune compromised mice (online supplemental figure S5), genetic inhibition of Prmt1 or Ripk1 expression in tumor cells moderately delayed their growth in immunocompetent mice (figure 3F,G), suggesting their extrinsic roles in regulating antitumor immune responses. We then challenged C57BL/6 mice with genetically modified MC38/GC tumors and tested whether inhibition of PRMT1 or RIPK1 could potentiate T cell-mediated antitumor responses in the in vivo cancer immunotherapy models described in online supplemental figure S6A. Anti-PD-1 and anti-OX40 treatments were selected to represent two distinct types of cancer immunotherapies, the antagonists of immune coinhibitory receptors and the agonists of immune costimulatory receptors, respectively. We found that the size of sgPrmt1 and sgRipk1 tumors were significantly shrunk after administration of anti-PD-1 antibody in relative to control tumors (figure 3F,G). Furthermore, anti-PD-1 treatment significantly extended the overall survival in the sgPrmt1 and sgRipk1 groups in related to the control group (figure 3H,I). Similar results were also obtained when sgPrmt1 and sgRipk1 tumors were treated with an OX40 agonist (online supplemental figure S6B,C). However, inhibition of PRMT1 or RIPK1 in tumors did not alter the survival of tumor-bearing mice in response to OX40 agonist treatment when compared with the control group (online supplemental figure S6D,E).
RIPK1-specific inhibitor improves T cell-mediated tumor killing, but not tumor infiltrating of T cells
Previous studies have demonstrated that pharmaceutical inhibition of pathways with the capability to regulate both rate-limiting steps, such as the MAPK, PI3K, HSP90, and PRMT pathways, can synergize with the antitumor activity of ICB treatments.6 29–31 Therefore, here, we focused on validating the in vivo effects of the identified cytotoxicity regulators with bioactive compounds, such as RIPK1-specific inhibitors (RIPK1i), on T cell-mediated antitumor immune response, and evaluate the efficacy of combining RIPK1i with immunotherapy. GSK2982772 was recently developed as a first-in-class RIPK1i with an IC50 value of 1 nM in an FP/ADP-Glo assay.32 As GSK2982772 prevents tumor necrosis factor (TNF)-induced necrotic cell death and blocks cytokine production in preclinical models,33 several phase IIa clinical studies have been conducted to test its therapeutic effects in patients with rheumatoid arthritis (NCT02858492), psoriasis (NCT02776033), or ulcerative colitis (NCT02903966). We first evaluated the target engagement of GSK2982772 at different concentrations based on the activation of the NF-κB pathway in response to TNFα stimulation. As shown in figure 4A, TNFα significantly increased the levels of p-IκBα and p-RELA, two markers for the activation of the NF-κB pathway, in MC38/gp100 tumor cells. In comparison to tumors receiving mock treatment, tumors pretreated with 5 µM or 10 µM GSK2982772 displayed significantly reduced levels of p-IκBα and p-RELA after TNFα stimulation (figure 4A), suggesting an efficient on-target effect of GSK2982772 starting at 5 µM. Compared with murine tumor cells, lower concentration of GSK2982772 pretreatment (ie, 2.5 µM) is sufficient to reduce the levels of p-IκBα and p-RELA in human H2023 tumor cells after TNFα stimulation (figure 4B). Our result is consistent with the previous report showing that GSK2982772 had a species selectivity.32 The in vitro cell growth assay showed that even a high concentration of GSK2982772 (10 µM) did not alter in vitro proliferation of both MC38/gp100 and H2023 tumor cells (figure 4C,D). However, GSK2982772 treatment significantly enhanced the apoptosis rate of MC38/gp100 and H2023 tumor cells after coincubation with their paired tumor-reactive T cells (figure 4E,F).

GSK2982772, a RIPK1-specific inhibitor, significantly enhances tumor sensitivity to T cell-mediated tumor killing, but display limited impact on regulating tumor cell proliferation rate. (A, B) The pretreatment of GSK2982772 suppresses activation of the NF-κB pathway triggered by TNFα stimulation. (A) MC38/gp100 cell lines were pretreated with GSK2982772 at the indicated concentrations overnight, and then stimulated with 10 ng/mL of TNFα for 5 min. (B) H2023 cells were pretreated with GSK2982772 at the indicated concentrations overnight, and then stimulated with TNFα at the concentration of 10 ng/mL for 2 min. The levels of phosphorylation of IκBα and RELA, two activation markers of the NF-κB pathway, in the collected protein samples were measured by western blot. Total amounts of IκBα, RELA and β-actin were also measured. (C, D) GSK2982772 pretreatment does not affect in vitro proliferation of MC38/gp100 (C) and H2023 (D) tumor cells. The Cell Counting Kit-8 was used to monitor the growth of tumor cells in the medium containing indicated concentrations of GSK2982772. (E, F) In vitro GSK2982772 pretreatment enhances tumor sensitivity to T cell-mediated killing. (E) MC38/gp100 were pretreated with indicated concentrations of RIPK1-specific inhibitor overnight and then exposed to Pmel T cell with the effector:target (ET) ratio at 1:1. (F) H2023 cells were pretreated with indicated concentrations of RIPK1-specific inhibitor overnight and then exposed to paired MAGE-B2-specific TCR T cell with the ET ratio at 3:1. The tumor apoptosis rate was determined by the percentage of tumor cells expressing cleaved caspase-3. Representative data from two independent experiments are shown. **p<0.01; ****p<0.0001. NS, no significance; TNFα, tumor necrosis factor α.
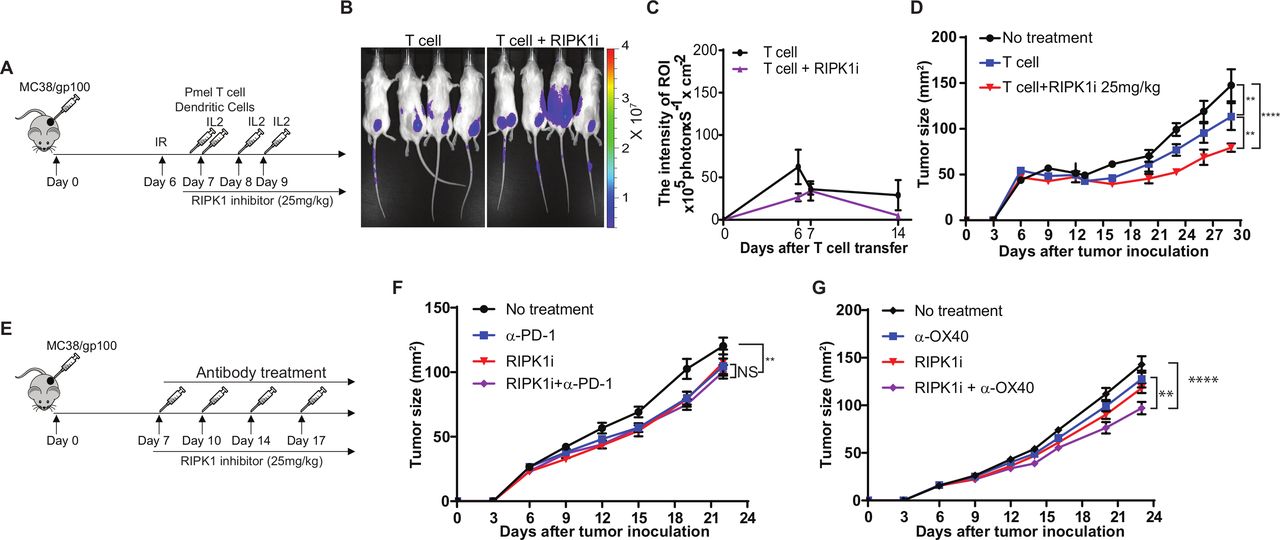
Next, we assessed the in vivo effect of GSK2982772 on T cell-mediated tumor killing and tumor infiltration of T cells using a murine ACT model (figure 5A). When we transferred luciferase-expressing Pmel T cells and used luciferase intensity at MC38/gp100 tumor sites to quantitate tumor infiltration of transferred T cells, we observed that the number of transferred T cells in mice treated with the RIPK1i was comparable to that in mice received mock treatment (figure 5B,C). As depicted in figure 5, RIPK1i treatment at a dose of 25 mg/kg potentiated the antitumor activity of transferred tumor-reactive T cells. These in vivo results further confirmed that the immunoregulatory role of tumor intrinsic RIPK1 is largely dependent on modulating the sensitivity of tumor cells to T cell killing, but not on altering the TME to facilitate T cell trafficking. Moreover, we examined antitumor effect of RIPK1i alone and in combination with immunomodulatory reagents (figure 5E). We found that RIPK1i alone moderately suppressed tumor growth in mice-bearing MC38/gp100 tumors (figure 5F). Interestingly, no significant synergistic antitumor effect was observed in mice treated with the combination of RIPK1i and anti-PD-1 (figure 5F). However, RIPK1i moderately enhanced the antitumor activity of anti-OX40 (figure 5G). Although the dual regulators tested in our previous studies displayed the potential to synergize with both immunomodulatory reagents, the results from RIPK1i imply that targeting cytotoxicity regulators on cancer immunotherapy can also be used to improve the efficacy of cancer immunotherapy.
GSK2982772 treatment significantly enhances T cell-mediated tumor killing in vivo but not tumor infiltration of T cells. (A) Schematic diagram of the experimental design to treat mice with adoptive T cell transfer. MC38/gp100 were inoculated into C57BL/6 mice. Six days later, all mice received 350 cGy irradiation. 1×10⁶ Pmel-1 T cells were transferred into tumor-bearing mice, along with 5×10⁵ gp100 peptide-pulsed dendritic cells (DCs), both by intravenous injection, and systemic interleukin-2 (IL-2) treatment. Tumor-bearing mice receiving irradiation only served as the control group. Tumor sizes were measured every 3 days. From day 7, mice were daily treated with 25 mg/kg of RIPK1-specific inhibitor GSK2982772. (B, C) In vivo GSK2982772 treatment has no impact on tumor trafficking of tumor reactive T cells (N=4–5). Imaging was performed at indicated time points after T cell transfer, and luciferase signaling intensity at tumor sites was recorded to determine the number of transferred tumor-reactive T cells. (B) Representative images showing the luciferase intensity of transferred T cells at tumor sites 6 days after T cell transfer. (C) Time course of quantitative imaging analysis of tumor trafficking of transferred T cells. (D) GSK2982772 treatment potentiates T cell-mediated antitumor activity of adoptively transferred tumor-reactive T cells. C57BL/6 mice were challenged with MC38/gp100 and then transferred Pmel T cells together with or without treatment of GSK2982772. (E) Schematic diagram of the experimental design to treat mice with immunomodulatory reagents in combination with GSK2982772. MC38/gp100 were inoculated into C57BL/6 mice. Seven days after tumor inoculation, mice with measurable tumors were randomly treated with either control antibody or immunomodulatory reagents every 3 days. (F) GSK2982772 treatment fails to enhance antitumor tumor activity of anti-PD-1. Mice-bearing MC38/gp100 were treated with either vehicle plus control antibody, GSK2982772 (25 mg/kg/day), anti-PD-1(100 µg, twice per week), or the combination (n=5). (G) GSK2982772 treatment moderately enhances antitumor tumor activity of anti-OX40 antibody. Mice-bearing MC38/gp100 were treated with either vehicle plus control antibody, GSK2982772 (25 mg/kg/day), anti-OX40 (100 µg, twice per week), or the combination (N=5). Tumor area were measured and recorded every 3 days. Representative data from two independent experiments are shown. **p<0.01; ****p<0.0001. NS, no significance.
Discussion
Recent advances in genetic editing tools have led to the emergence of CRISPR-based genetic screens in the investigation of the regulatory mechanisms of a myriad of cellular processes, including oncogenesis.22 24 34 Compared with the arrayed CRISPR screen platform, the pooled CRISPR-gRNA screen platform represents a more streamlined approach with high-throughput capability. In this study, we used a pooled CRISPR-gRNA screen to identify a set of tumor intrinsic factors that could significantly enhance sensitivity of tumor cells to T cell-mediated killing. Several groups have already used genetic screens to discover molecular determinants of tumor resistance to immune attack.17 19 35 Although current genome-wide CRISPR screens are largely based on in vitro systems using paired tumor and tumor-reactive T/NK cells, the results from our group and others identified various tumor intrinsic factors such as PTPN2, ARID2, PBRM1, PRMT1, and RIPK1, whose immunoregulatory functions have been confirmed in in vivo preclinical models.17 19 35 Additionally, multiple factors/pathways including RNF31, RELA, and the TNFα pathway identified in other screens were also identified in our screens using the murine MC38 colon cancer cell line. We also identified other factors such as ALDOA and SERBINB9,36 which have been reported to regulate T cell-mediated killing.7 These results suggest that in vitro genome-wide CRISPR immune screens can sensitively and reliably elucidate the immunoregulatory potential of tumor intrinsic factors and demonstrate the value of genome-wide immune screens as complementary approaches to discover novel prognostic biomarkers and therapeutic targets for immunotherapy.
To complement the CRISPR screen, we leveraged available clinical data in the TCGA datasets to characterize the roles of identified regulators in controlling tumor trafficking of immune cells, another rate-limiting step of T cell-mediated cancer immunotherapy. After integrating targets of depleted gRNAs from our screens with negative immune correlates from TCGA analysis, we stratified these immune regulators into two categories, namely, dual regulators and cytotoxicity regulators. By using PRMT1 and RIPK1 as representative dual regulators and cytotoxicity regulators, respectively, we demonstrated their roles in T cell-mediated killing and T cell trafficking to tumor cells. PRMT1, an identified dual regulator, encodes a critical enzyme for type I protein arginine methylation. PRMT1 accounts for more than 90% of asymmetric arginine dimethylations and is involved in several cellular processes including pre-mRNA splicing, DNA repair, transcriptional regulation, and signal transduction.37 38 Dysregulation of PRMT1 has been observed in a number of human cancers including breast cancer, prostate cancer, lung cancer, colon cancer, bladder cancer, and leukemia.39 In addition to the role of PRMT1 in modulating tumor susceptibility to immune attack revealed by our results from the in vitro cytotoxicity assay, the TCGA dataset analysis revealed a strong correlation between PRMT1 upregulation and the immunological ‘coldness’ of multiple tumor types. RIPK1, a cytotoxicity regulator identified in this study, has been most extensively studied in the TNFR1 signaling and programmed cell death pathways.33 Although inhibition of RIPK1 increased the sensitivity of human and murine tumor cells to T cell-mediated killing, there was no significant correlation between the expression of RIPK1 and the abundance of immune cells at tumor sites. Furthermore, analyses of the difference in transcriptomic profiles between tumor cells with or without knockout of Prmt1/Ripk1 showed that knocking out either Prmt1 or Ripk1 alters the expression of molecules involved in T cell-mediated tumor apoptosis, while only PRMT1-deficient tumor cells display a major change in cytokine/chemokine production. Thereby, these results highlight the difference in their contributions to antitumor immune response. Taken together, our integrative analysis revealed two distinct functions of tumor intrinsic immune regulators in controlling rate-limiting steps of T cell-mediated immune responses. Given that melanoma is widely used to study the influences of cancer cells on resident immune cells, we selected the SKCM TCGA data to explore the contribution of tumor intrinsic pathways to controlling tumor immune infiltration in this study. Further studies are required to validate our findings in other types of cancers, particularly non/lowly immunogenic tumor types.
Multiple dual regulators including PRMTs and ALDOA have been demonstrated to govern tumor trafficking of immune cells by amplifying interferon-stimulated gene induction and/or shaping TME in favor of antitumor immune responses, and inhibiting these regulators by bioactive compounds enhanced tumor infiltration of T cells and improved the efficacy of cancer immunotherapy in previous studies.7 31 Here, we further explore the in vivo immunological impact of pharmacologically targeting cytotoxic regulators on antitumor immunity. An in vivo genetic screen using a pooled CRISPR library with 2368 genes identified Ripk1 as a significantly depleted gene in B16 melanoma-bearing immunocompetent mice in response to anti-PD-1 treatment.18 Consistent with this study, RIPK1-specific inhibitor treatment enhanced antitumor activity of transferred tumor reactive T cells and anti-OX40 treatment in mice-bearing MC38 tumor model. Whereas, pharmacologically targeting RIPK1 failed to promote T cell trafficking to tumor sites in vivo, confirming that the impact of tumor RIPK1 activity on modifying the tumor immune microenvironment may be limited. Moreover, we did not observe significant body weight loss in mice receiving the combination of RIPK1 inhibitor and either T cell transfer or anti-OX40 treatment, suggesting that RIPK1 inhibitors can be used to develop effective and safe immuno-oncology (IO) combinations. Collectively, the data provide a rich resource of novel targets for rational IO combinations.
Although the bulk RNA-seq analysis of PRMT1-KO and RIPK1-KO tumor cells in the absence of T cells revealed the genes/pathways controlled by these two immune regulators, future studies by using single cell RNA sequencing are necessary to characterize the changes of PRMT1-KO and RIPK1-KO tumor cells in the presence of T cells and the in vivo effect of PRMT1 or RIPK1 inhibitors on immune cells. In addition, our in vivo studies demonstrated that the RIPK1-specific inhibitor only synergized with anti-OX40, but not PD-1 blockade. Anti-OX40 and PD-1 blockade use different mechanisms to augment T cell-mediated antitumor immune response. Inappropriate combination strategies have been reported to compromise the efficacy of these two treatments via inducing T cell apoptosis.40 41 Here, our results also suggest that the mechanism of action of different cancer immunotherapies will impact the selection of cytotoxicity regulators, such as RIPK1, to be used for the development of effective IO combinations. Additional studies are needed to determine whether RIPK1 inhibitors could impose different impacts on the function of T cells, when combined with anti-OX40 or PD-1 blockade.
References
Supplementary materials
Supplementary Data
This web only file has been produced by the BMJ Publishing Group from an electronic file supplied by the author(s) and has not been edited for content.
Footnotes
Twitter @UH_NVLab
JH, YW and LS contributed equally.
Contributors Conception and design: PH and WP. Acquisition of data (provided required animals, cells, patient samples, clinical information and so on): JH, LS, YC, CX, AS, KP, RB, NAE, JAMK, RMM, LJW, ZY, MS, XL, JRA, NV, CY and WP. Analysis and interpretation of data (statistical analysis and bioinformatics analysis): YW and YC. Writing and/or revision of the manuscript: JH, JAMK, YC, PH and WP. Study supervision: YC, PH and WP.
Funding This work was supported, in part, by the following National Cancer Institute grants: R01CA187076 (PH and MD), R01GM130838 (YC), P50CA221703 (MDACC Melanoma SPORE), P30CA016672 (MDACC CCSG for the Flow facility and the sequencing core),1S10OD024977 (MDACC sequencing core) and P50CA093459 (to JAM); by philanthropic contributions to MDACC Melanoma Moon Shots Program, BMS-MRA Young Investigator Award in Immunotherapy (YC, 569414), Melanoma Research Alliance (MRA) Young Investigator Award (WP, 558998), MRA Established Investigator Award (NV, 509800), Dr. Miriam and Sheldon G. Adelson Medical Research Foundation, Aim at Melanoma Foundation, Miriam and Jim Mulva research funds; by National Science Foundation (NV, 1705464); by Cancer Prevention and Research Institute of Texas (PH and WP, RP170401; NV, RP180466; JAM, RP140106 and RP170067); and by start-up research funds kindly provided to WP by the University of Houston.
Competing interests WP received honoraria and travel support from Bristol-Myers Squibb (BMS). PH is on the scientific advisory boards for Immatics, Dragonfly, Sanofi and GlaxoSmithKline (GSK). JR received consulting and/or travel fees from European Journal of Cancer, Vall d'Hebron Institut of Oncology, Chinese University of Hong Kong, SOLTI, Elsevier, GSK, Novartis, Eli Lilly, Orion Pharmaceuticals, Servier Pharmaceuticals, Peptomyc, Merck Sharp & Dohme, Kelun Pharmaceutical/Klus Pharma, Spectrum Pharmaceuticals Inc, Pfizer, Roche Pharmaceuticals, Ellipses Pharma, NovellusDx, Ionctura and Molecular Partners (including serving on the scientific advisory board from 2015 to present), received research funding from Blueprint Pharmaceuticals, Bayer and Novartis, and served as investigator in clinical trials with Spectrum Pharmaceuticals, Tocagen, Symphogen, BioAtla, Pfizer, GenMab, CytomX, KELUN-BIOTECH, Takeda-Millenium and GSK. No potential conflicts of interest were disclosed by other authors.
Patient consent for publication Not required.
Ethics approval All preclinical studies were performed in accordance with the protocols approved by the Institutional Animal Care and Use Committees.
Provenance and peer review Not commissioned; externally peer reviewed.
Data availability statement All data relevant to the study are included in the article or uploaded as supplementary information.
Supplemental material This content has been supplied by the author(s). It has not been vetted by BMJ Publishing Group Limited (BMJ) and may not have been peer-reviewed. Any opinions or recommendations discussed are solely those of the author(s) and are not endorsed by BMJ. BMJ disclaims all liability and responsibility arising from any reliance placed on the content. Where the content includes any translated material, BMJ does not warrant the accuracy and reliability of the translations (including but not limited to local regulations, clinical guidelines, terminology, drug names and drug dosages), and is not responsible for any error and/or omissions arising from translation and adaptation or otherwise.