Article Text

Abstract
Background Dickkopf 1 (DKK1) is associated with tumor progression. However, whether DKK1 influences the tumor response to programmed cell death protein 1 (PD-1) blockade in colorectal cancers (CRCs) with deficient mismatch repair (dMMR) or microsatellite instability (MSI) has never been clarified.
Methods Tumor tissues from 80 patients with dMMR CRC were evaluated for DKK1 expression and immune status via immunohistochemistry. Serum DKK1 was measured in another set of 43 patients who received PD-1 blockade therapy. CT26 cells and dMMR CRC organoids were cocultured with T cells, and CT26-grafted BALB/c mice were also constructed. T-cell cytotoxicity was assessed by apoptosis assays and flow cytometry. The pathway through which DKK1 regulates CD8+ T cells was investigated using RNA sequencing, and chromatin immunoprecipitation and luciferase reporter assays were conducted to determine the downstream transcription factors of DKK1.
Results Elevated DKK1 expression was associated with recurrence and decreased CD8+ T-cell infiltration in dMMR CRCs, and patients with high-serum DKK1 had a poor response to PD-1 blockade. RNA interference or neutralization of DKK1 in CRC cells enhanced CD8+ T-cell cytotoxicity, while DKK1 decreased T-bet expression and activated GSK3β in CD8+ T cells. In addition, E2F1, a downstream transcription factor of GSK3β, directly upregulated T-bet expression. In organoid models, the proportion of apoptotic cells was elevated after individual neutralization of PD-1 or DKK1 and was further increased on combined neutralization of PD-1 and DKK1.
Conclusions DKK1 suppressed the antitumor immune reaction through the GSK3β/E2F1/T-bet axis in CD8+ T cells. Elevated serum DKK1 predicted poor tumor response to PD-1 blockade in dMMR/MSI CRCs, and DKK1 neutralization may restore sensitivity to PD-1 blockade.
- biomarkers
- tumor
- CD8-positive T-lymphocytes
- gastrointestinal neoplasms
- immunotherapy
- lymphocytes
- tumor-infiltrating
Data availability statement
Data are available in a public, open access repository. The data underlying this article available in the Research Data Deposit online (https://www.researchdata.org.cn/) and can be accessed with RDD number RDDB2020000849. RNA-seq data were deposited at Gene Expression Omnibus (GSE149206).
This is an open access article distributed in accordance with the Creative Commons Attribution Non Commercial (CC BY-NC 4.0) license, which permits others to distribute, remix, adapt, build upon this work non-commercially, and license their derivative works on different terms, provided the original work is properly cited, appropriate credit is given, any changes made indicated, and the use is non-commercial. See http://creativecommons.org/licenses/by-nc/4.0/.
Statistics from Altmetric.com
- biomarkers
- tumor
- CD8-positive T-lymphocytes
- gastrointestinal neoplasms
- immunotherapy
- lymphocytes
- tumor-infiltrating
Background
DNA deficient mismatch repair (dMMR), which is highly correlated with microsatellite instability (MSI), plays a prominent role in the tumorigenesis of colorectal cancer (CRC).1 2 To date, dMMR/MSI CRCs have been linked to better prognosis and immune status than microsatellite-stable CRCs.3–7 dMMR/MSI CRCs are associated with a higher mutational burden and tumor neoantigen load, resulting in dense infiltration of immune cells, especially CD8+ T lymphocytes.8–11 However, although dMMR/MSI enrichment benefits patients with CRC who receive immune checkpoint inhibitors (ICIs),12–14 40%–60% of them still experience resistance to ICIs.15 16 Because the infiltration and cytotoxicity of CD8+ T lymphocytes can suppress tumor growth and influence sensitivity to immunotherapy17 and because immune status differs among dMMR/MSI CRCs,16 insensitivity to PD-1 blockade could be attributed to inactivation of CD8+ T lymphocytes in dMMR/MSI CRCs.
Dickkopf (DKK) proteins, which bind to LRP5/6 to suppress the WNT pathway,18 19 have been theoretically associated with tumor suppression.20–22 However, elevated Dickkopf 1 (DKK1) has been linked to worse prognosis in several cancers.21 23 24 DKK1 was reported to modulate immune cells,25 26 and D’Amico et al observed an accumulation of CD8+ tumor-infiltrating lymphocytes (TILs) when DKK1 was blocked.27 We previously found that in patients with CRC with liver oligometastases, serum DKK1 was negatively correlated with CD8+ T-cell infiltration in the invasive margin (IM) of metastatic lesions,28 indicating that DKK1 could be a potential target for immunotherapy.
Despite these findings, the significance of DKK1 in the tumor response to PD-1 blockade remains unknown, and the mechanism through which DKK1 affects the CRC microenvironment has yet to be determined. Here, we investigated the function, prognostic impact, and underlying mechanism of DKK1 in dMMR/MSI CRCs.
Methods
Animals and cell lines
Female BALB/c mice aged 6–8 weeks were purchased from The Vital River Laboratory (Beijing, China). The cell lines CT26 (BALB/c mouse CRC cells), DLD1 (human CRCs, date of authentication: August 17, 2017) and Jurkat (human T-cell leukemia cells, date of authentication: December 6, 2019) were cultured at 37°C in complete medium (RPMI 1640 supplemented with 100 µg/mL streptomycin, 100 IU/mL penicillin, and 10% fetal bovine serum (FBS)).
Organoids
Tumor tissues of dMMR CRCs (dMMR1 and dMMR2) were digested with digestion buffer (RPMI 1640 medium containing 10% FBS, 1% penicillin–streptomycin, 4 mg/mL of collagenase (Sigma C5138)) and embedded in Matrigel (Corning). After solidification, the Matrigel was overlaid with IntestiCult OGM Human (Stem Cell) supplemented with penicillin (100 U/mL), streptomycin (100 µg/mL) and 10 mM Y-27632 (Sigma) at 37°C with 5% CO2. Organoids used in experiments were under passage 30. H&E-stained sections of organoids were assessed by pathologists to determine the tumor status.
Lentiviral transduction
Lentiviruses containing mouse short hairpin RNA (shRNA) were produced by GenePharma (Shanghai, China). To achieve knockdown of DKK1 in cells, a sequence targeting mouse DKK1 was subcloned into the pLenti-CMV-IRES-puromycin lentiviral expression vector (online supplemental table S1). A pLenti-CMV-IRES-puromycin vector expressing control (Ctrl) shRNA was used as a negative Ctrl. The virus-containing pellet was dissolved in RPMI 1640, and aliquots were stored at −80 °C until use. CT26 cells were seeded in a 24-well plate and infected with concentrated virus in the presence of polybrene (Sigma-Aldrich). The supernatant was replaced with complete culture medium after 24 hours. The cells were then seeded in 96-well plates as single cells. Selection with 2 µg/mL puromycin was conducted for 1 week, and clones after selection were collected for further culture. The expression of DKK1 in both the supernatant and the infected cells was verified by western blot analysis. The cells were then used for tumor grafts and in vitro experiments.
Supplemental material
Tumor grafts
CT26 tumor cells (5.0×10⁵) transfected with Ctrl shRNA or shDKK1 were suspended in 100 µL phosphate-buffered saline (PBS) and injected subcutaneously into the right flanks of the backs of BALB/c mice (six mice in each group). Tumor growth was measured with calipers, and size was expressed as one-half of the product of the perpendicular length and the square width in cubic millimeters. For antibody treatment (five mice in each group), when the size of the tumor reached 500 mm3, Ctrl IgG antibody and anti-PD-1 antibody (BE0273, BioXcells) were diluted in PBS, and 1 mg of anti-PD-1 antibody per kilogram body weight was injected intraperitoneally every 3 days.
Preparation of T cells from tumor-grafted mice
For the preparation of TILs, tumors were minced with scissors and scalpel blades and then incubated with digestion buffer (RPMI 1640 medium (Gibco)) containing 10% FBS, 1% penicillin–streptomycin, 4 mg/mL collagenase (Sigma C5138), and 2 mg/mL deoxyribonuclease (Sigma DN25) in a shaker for 1 hour at 37°C. For the preparation of T cells from mouse spleens, spleens were minced with scissors and washed with Hank's balanced salt solution (HBSS). Cell pellets were collected and resuspended in PBS. To collect mouse and human peripheral blood mononuclear cells (PBMCs), blood was subjected to centrifugation at 1600 rpm for 15 min, and the serum was removed.
Dispersed cells were filtered through a 0.22 mm cell strainer (Falcon) to eliminate clumps and debris and were washed with HBSS (Gibco). After centrifugation for 10 min (400 g) at 4°C, cell pellets were resuspended in PBS. Then, Ficoll was applied to separate leukocytes by centrifugation at 450 g for 20 min at room temperature. The collected leukocytes were washed with HBSS, and after centrifugation, the cell pellets were resuspended in red blood cell lysis buffer (Sigma R7757) and incubated at room temperature for 5 min to remove erythrocytes. Finally, the cells were pelleted again and resuspended in PBS.
Preparation and treatment of mouse lymphocytes
Primary T cells for CT26-T cell coculture were isolated from the spleens of healthy female BALB/c mice (8 weeks old) with mouse pan-T cell isolation kits (Miltenyi Biotec) according to the manufacturer’s instructions. T cells were cultured in RPMI 1640 (Gibco) supplemented with 10% FBS, penicillin (100 U/mL), and streptomycin (100 µg/mL) at 37°C with 5% CO2. Before experiments, T cells were prestimulated with interleukin (IL)-2 (200 U/mL, Peprotech), anti-CD3 (Peprotech) and anti-CD28 (Peprotech) in the presence of CT26 cells for 48 hours and then isolated. Mouse DKK1 was purchased from Peprotech. CD8+ T cells were isolated by EasySep Mouse CD8+ T cell Isolation Kits (Stem Cell) and were cultured in the same culture medium and conditions as the T cells. For PD-1 neutralization, cells were treated with 1 µg/mL anti-PD-1 neutralizing antibody (BioXcell) for 24 hours.
Preparation and treatment of human T cells
PBMCs from two patients with dMMR CRC (dMMR1 and dMMR2) and healthy volunteers were isolated, and then T cells and CD8+ T cells were isolated from the PBMCs using a human pan-T cell isolation kit and CD8+ T-cell isolation kit, each according to the manufacturer’s instructions (Miltenyi Biotec). Human T cells were cultured in Human ImmunoCult-XF T Cell Expansion medium (Stem Cell) with penicillin (100 U/mL) and streptomycin (100 µg/mL) at 37°C with 5% CO2. Cells were prestimulated with IL-2 (200 U/mL, Peprotech), anti-CD3 (Peprotech) and anti-CD28 (Peprotech) for 48 hours before treatment with recombinant DKK1 (Peprotech) and DKK1 neutralizing antibody (Sinobio) or IgG. Before the experiment, T cells from patients with dMMR were also prestimulated in the presence of paired CRC organoid cells for 48 hours. CD8+ T cells were cultured in the same culture medium and conditions as the T cells. For PD-1 neutralization, T cells were treated with 1 µg/mL pembrolizumab (Keytruda, Merck & Co.) for 24 hours.
CT26-T cell coculture
For mouse CT26-T cell coculture, primary T cells from healthy mice were prepared as described previously. CT26 cells were plated in a 96-well plate and left overnight in the presence of 200 ng/mL mouse interferon gamma (IFNG) (Peprotech). T cells were added to the tumor cells at a 20:1 ratio at 37°C. The number of live tumor cells was determined by CCK-8 assays, as mentioned earlier. Cell apoptosis was assessed by flow cytometry with an Annexin V Apoptosis Detection Kit (Dojindo). CD8+ T cells were cocultured under the same conditions as T cells but at a ratio of 5:1 (CD8+ T cells: CT26 cells). To test the effect of DKK1 in coculture, we cultured isolated T cells in the presence or absence of 100 ng/mL DKK1 for 24 hours.
Organoid–T cell coculture
Organoid–T-cell coculture models were constructed based on the methods of previous studies.29 30 To evaluate the infiltration ability of T cells, organoids were dissociated into single cells and plated (5×10⁴ per well) in a 24-well plate in the presence of Matrigel 3 days before coculture. Before coculture, organoid cells were treated with 200 ng/mL human IFNG (Peprotech). Then, the pretreated T cells (1×10⁶ per well) were added to the organoid culture medium in each well. After 3 days of coculture, Matrigel samples containing cells were carefully obtained without destroying the cells. For H&E staining, Matrigel samples were fixed with formalin at 4°C overnight and coated with 5% agarose gel before paraffin imbedding. To evaluate organoid viability, organoids were digested into single cells and stained with Trypan Blue. Cell counting (six wells for each group) was carried out with a Cellometer (Nexcelom).
To evaluate the cytotoxicity of T cells, organoids were dissociated into single cells and plated (5×10⁴ per well) in a 24-well plate in the absence of Matrigel 24 hours before coculture. Pretreated T cells (1×10⁶) or CD8+ T cells (2.5×10⁵ per well) were added to each plate. After 6 hours, tumor cells were obtained and then digested into single cells. Cell apoptosis was assessed by flow cytometry. For flow cytometry, T cells were derived via Ficoll separation after coculture with organoids for 24 hours. Each experiment contained three replicates and was repeated three times.
Flow cytometry assay
Leukocytes in single-cell suspension were stained with antibodies for cell-surface markers for 30 min at 4°C in the dark. For the staining of intracellular proteins, the cells were fixed with fixation buffer, resuspended in permeabilization buffer (eBioscience), and then stained with antibodies for another 30 min at 4°C in the dark. The cells were then resuspended in PBS for flow cytometry analysis using a Beckman CytoFLEX FCM (Beckman Coulter). Each experiment contained three replicates and was repeated three times.
Proliferation assay
CT26 cells were seeded in 96-well plates at 2000 cells per well, and after a certain time of culture, cell viability was measured using CCK-8 assays (Dojindo). Each experiment contained five replicates and was repeated three times. For CT26 cells cocultured with T cells, the CT26 cells were seeded at 10 000 cells per well with 2×10⁵ T cells. Before measurement, the cells were gently prewashed with PBS once to remove the T cells.
Transwell assay
Transwell assays were performed in a 24-well Millicell chamber (Falcon) in triplicate. Each experiment contained three replicates and was repeated three times. Prestimulated T cells were treated with 100 ng/mL DKK1 or mock for 24 hours, and CD8+ cells were derived. Cells (2 ×10⁵) were added to the Matrigel-coated filters in fresh IntestiCult OGM Human (Stem Cell) medium in the presence or absence of 100 ng/mL DKK1. We added organoid supernatant to the lower chambers as a chemoattractant. After incubation for 24 h at 37 °C in an incubator with 5% CO2, the cells that had migrated through the filters were fixed with methanol and stained with crystal violet. Cell numbers were counted in three random fields.
RNA sequencing (RNA-seq) and data analysis
DLD1 cells, prestimulated T cells, and CD8+ T cells were cultured in the presence or absence of 300 ng/mL DKK1 for 24 hours (DLD1 cells were treated with DKK1 or mock in the presence of IFNG), and then RNA was isolated and purified with TRIzol (Invitrogen). RNA purity was assessed using the ND-1000 Nanodrop. Each RNA sample had an A260:A280 ratio above 1.8 and an A260:A230 ratio above 2.0. RNA integrity was evaluated using the Agilent 2200 TapeStation (Agilent Technologies, USA), and each sample had an RNA integrity number above 7. Briefly, rRNAs were removed from total RNA using the EpicentreRibo-Zero rRNA Removal Kit (Illumina, USA) and fragmented to approximately 200 bp. Subsequently, purified RNA was subjected to first-strand and second-strand cDNA syntheses followed by adaptor ligation and enrichment with a low cycle, according to the instructions of the NEBNext Ultra RNA Library Prep Kit for Illumina (NEB, USA). The purified library products were evaluated using the Agilent 2200 TapeStation and Qubit2.0 (Life Technologies, USA). The libraries were paired-end (PE) sequenced (PE150, sequencing reads were 150 bp) on an Illumina HiSeq3000 at Guangzhou RiboBio Co. (Guangzhou, China). Clean reads were obtained after the removal of low-quality reads and reads containing adapter or poly-N from the raw data. HISAT2 was used to align the clean reads to the human reference genome hg19 with default parameters. HTSeq was subsequently employed to convert the aligned short reads into read counts for each gene model. Differential expression was assessed by differential expression sequencing read counts as input. The Benjamini–Hochberg multiple test correction method was enabled. Differentially expressed genes were chosen according to the criteria of a p value of <0.05. Kyoto Encyclopedia of Genes and Genomes (KEGG) analysis was used for gene functional annotation. Data were deposited at Gene Expression Omnibus (GEO) (GSE149206).
RNAsi interference and electrotransfection
Small interfering RNAs (siRNAs) targeting the E2F1 gene and non-targeting siRNA Ctrl (online supplemental table S1) were purchased from GenePharma (Shanghai, China). Electrotransfections were performed using the Bio-Rad Gene Pulser Xcell (catalog number 165–2106). The cells (5×10⁶) were suspended in 500 µL of RPMI 1640 with 100 nM siRNA.
Quantitative real-time PCR (qPCR)
Total RNA was extracted with TRIzol (Invitrogen) and quantified on an ND-1000 spectrophotometer (NanoDrop Technologies). cDNA was synthesized with 2 µg of RNA using the RevertAid First Strand cDNA Synthesis Kit (K1622, Thermo). The amplification of the target genes was performed using LightCycler 480 SYBR Green I Master Mix (Roche) on a LightCycler 480 Real-Time PCR System (Roche). β-actin mRNA was used as an internal Ctrl. Relative quantification of transcription was performed by calculating the power of the difference between amplification of the target gene and the amplification of β-actin (ie, 2−[Ct target gene−Ct β-actin], where Ct represents threshold cycle). Each experiment contained three replicates and was repeated three times. The specific primers for human cells are shown in online supplemental table S1.
Western blot analysis
CT26 cells and human CD8+ T cells isolated from PBMCs were lysed with Radio-Immunoprecipitation Assay buffer (50 mM Tris–HCl, pH 7.4, 150 mM NaCl, 1% NP-40, 0.1% SDS, 0.5% sodium deoxycholate, 1 mM EDTA and 10% glycerol) supplemented with protease and phosphatase inhibitor cocktail (Thermo). The supernatant of the CT26 culture medium was collected and concentrated 20 times with an ultrafiltration tube (Millipore), followed by 1:1 dilution with RIPA buffer. Equal amounts of total protein lysates were subjected to 10% sodium dodecyl sulfate–polyacrylamide gel electrophoresis and transferred to polyvinylidene fluoride or polyvinylidene difluoride membranes. The membranes were blocked in 5% bovine serum albumin (BSA) in TBS/Tween-20 for 1 hour and then probed with the appropriate specific primary antibody overnight at 4°C. The membranes were washed and incubated for 1 hour at room temperature with the corresponding HRP-linked secondary antibodies (7074 and 7076, Cell Signaling Technology; ab97110, Abcam). The results were visualized by chemiluminescence detection using SuperSignal West Dura Extended Duration Substrate (Thermo). The primary antibodies are listed in the online supplemental material. Equal loading was assessed using an anti-β-actin antibody (ab8227, Abcam). For the supernatant of CT26 culture medium, equal loading was assessed using Ponceau S. Each experiment was repeated three times.
Supplemental material
Cell fractionation
Cell fractionation was carried out with a cell fractionation kit (Thermo) according to the manufacturer’s protocol. In brief, CD8 +T cells were washed with cold PBS and resuspended in cytoplasm isolation buffer. After centrifugation, the supernatant was collected as the cytosolic fraction, and the pellet was re-suspended in membrane isolation buffer and centrifuged again. After the second centrifugation, the supernatant containing the membrane fraction was collected, and the pellet was collected as the nuclear fraction. The nuclear fraction and the pooled membrane and cytosolic fractions were subjected to western blot analysis. Equal loading was assessed using an anti-β-actin antibody for the cytoplasmic fraction and an anti-Lamin B1 antibody for the nuclear fraction.
Coimmunoprecipitation
Co-immunoprecipitation was carried out with the Pierce Classic Magnetic IP/Co-IP Kit (Thermo) according to the manufacturer’s protocol. CD8 +T cells were lysed in lysis buffer (50 mM HEPES, pH 7.4, 150 mM NaCl, 1% Triton X-100, 10% glycerol, 2 mM MgCl2, 2 mM Ethylene Glycol Tetraacetic Acid) with protease inhibitor and phosphatase inhibitor cocktail (Thermo) on ice. The cell lysates were centrifuged to remove insoluble materials. Immunoprecipitation was performed with anti-LRP6 and anti-GSK3β antibodies incubated with beads overnight at 4°C. The beads were washed repeatedly, and bound proteins were analyzed by western blotting.
Chromatin immunoprecipitation
Chromatin immunoprecipitation assays were performed using the EZ-Magna ChIPTM A/G Kit (17–10086, Millipore). JASPAR software was used to identify the potential transcription factors binding the TBX21 promoter region. Briefly, cells were cross-linked with 1% formaldehyde, lysed, and sonicated on ice to generate DNA fragments with an average length of 200–500 bp. Pre-cleared DNA from each sample was saved as the input fraction. Pre-cleared DNA was then used for immunoprecipitation with 5 µg of ChIP-grade antibody specifically targeting E2F1 (ab179445, Abcam). IgG was included as the non-specific Ctrl. DNA was eluted, purified, and subjected to qPCR using specific primers (online supplemental table S1). The qPCR products were then mixed with BlueJuice Gel Loading Buffer (Thermo). Electrophoresis was conducted with a 3% agarose gel stained with SuperRed (Biosharp). Each experiment contained three replicates and was repeated three times.
Reporter gene assay
For promoter reporter assays, a luciferase reporter vector was purchased from FulenGen (Guangzhou, China). The TBX21 promoter sequence was cloned into the dual-luciferase reporter vector containing the pGl3 promoter, firefly luciferase reporter, and pRL-TK Renilla luciferase reporter. Then, 500 ng of reporter plasmid and 50 nM siRNA (Ctrl or siE2F1) were co-electrotransfected into Jurkat cells in 24-well plates. The luciferase activities were assessed at 24 hours post-transfection with the Dual-Luciferase Reporter Assay System (Promega), and the relative Fluc/Rluc activity was calculated by normalizing the activity of firefly luciferase to that of Renilla luciferase. Each experiment contained three replicates and was repeated three times.
Patient inclusion and follow-up
Genetically tested patients with dMMR CRC from Sun Yat-sen University Cancer Center (SYSUCC, Guangzhou, China) were enrolled. Patients with insufficient tumors for immunohistochemistry (IHC) tests were excluded. Baseline information and follow-up data were collected as previously described.16 Another set of 78 stage II to III CRC cases from SYSUCC were also enrolled for validation. In addition, patients with dMMR/MSI CRC from SYSUCC who received PD-1 blockade treatment without further surgical treatment were enrolled. Follow-up data and determination of responses were collected from the tracking system.
IHC analysis and lymphocyte counting
All specimens were prepared as 4 µm formalin-fixed paraffin-embedded (FFPE) sections. The sections were deparaffinized via a series of decreasing concentrations of ethanol (100, 95, 70, and 50%), deionized with H2O, and rinsed in PBS. Endogenous peroxidase activity was blocked via incubation in 3% H2O2 solution in methanol. The antigenic epitopes were unmasked in a decloaking chamber using citrate buffer (10 mM sodium citrate and 0.05% Tween 20, pH 6). The sections were then washed in deionized water, rinsed in PBS, blocked for 30 min at room temperature with 5% BSA in PBS, and incubated with primary antibodies in a humidified chamber at 4°C overnight. The primary antibodies are listed in the online supplemental material. After washing, the sections were incubated with anti-rabbit/mouse IgG monoclonal antibody (DAKO Real Envision) at room temperature for 1 hour. Staining was performed using Diaminobenzidine (DAKO Real Envision), followed by counterstaining using haematoxylin.
The IHC score for DKK1 was determined using the semiquantitative method, according to the percentage and intensity of positively stained cells. The percentage of positively stained cells was scored as follows: 0, for slides containing <5% positively stained tumor cells; 1, for slides containing 5%–24% positively stained tumor cells; 2, for slides containing 25%–49% positively stained tumor cells; 3, for slides containing 50%–74% positively stained tumor cells; and 4, for slides containing 75%–100% positively stained tumor cells. Negative, weak, moderate, and strong staining was scored as 0, 1, 2, and 3, respectively. The final IHC score was generated by multiplying the percentage score with the staining score. Two trained pathologists evaluated all of the specimens. Based on the receiver operating characteristic (ROC) curve of disease-free survival (DFS), the optimal cut-off value for differentiating between a high and low DKK1 level was estimated when the Youden index reached its maximum, and an IHC score of ≤7 was determined to indicate low DKK1 expression.
Lymphocyte counting was conducted, and the areas of the IM, tumor stroma (TS) and cancer nest (CN) were defined. IM was defined as discrete lymphoid reactions in the IM of the tumor. TS was defined as a lymphocytic reaction in the TS within the tumor mass. CN was defined as lymphocytes in the CNs.16 The number of lymphocytes in high-power fields (HPFs; 400×, 0.028 mm2; Olympus BX41, Tokyo, Japan) was counted by a pathologist unaware of other information according to the following methods: select five HPFs in the IM, TS, and CN; count the positive cells; and take the average. The ratio of the number of PD-1-positive cells to the total number of CD8+ cells was calculated. A typical image of PD-1 staining is shown in online supplemental figure S2C.
Supplemental material
For dMMR diagnosis, protein deficiency was defined as the absence of nuclear staining within the tumor cells. Positive nuclear staining in normal tissues was used as an internal Ctrl. Expression was determined as nuclear staining in tumor cells with consistent labeling in Ctrl cells.
DKK1 ELISA
Serum DKK1 levels were measured using the Human DKK1 ELISA Kit (R&D Systems) according to the manufacturer’s instructions. For optimal measurements of DKK1 in the serum, the samples were all diluted at a ratio of 1:10 for ELISA analysis. The cut-off value for grouping was based on the ROC curve of DFS, and DKK1 of ≤818 pg/mL was determined to represent low serum DKK1.
Analysis of online data
Data on DKK1 expression (Fragments Per Kiolbase Million) and MSI status in The Cancer Immunome Atlas (TCIA), Tumor Immune Estimation Resource (TIMER) and Immune Cell Abundance Identifier (ImmuCellAI) were obtained from The Cancer Genome Atlas (TCGA). The immunophenoscores (IPSs) of MSI CRC cases were obtained online (https://tcia.at/home). The cut-off value for DKK1 expression was based on the ROC curve of IPS, and an FPKM value of 0.17 was determined as the cut-off value. The infiltration levels of CD4+ T cells, CD8+ T cells, B cells, dendritic cells, neutrophils and macrophages of MSI CRC cases were obtained from TIMER (https://cistrome.shinyapps.io/timer/) and were compared between the DKK1 high and low groups. The infiltration levels of CD8+ naïve cells, effector memory cells and cytotoxic cells of MSI CRC cases were obtained from ImmuCellAI (http://bioinfo.life.hust.edu.cn/ImmuCellAI/#!/) and were compared between the DKK1 high and low groups.
Data on DKK1 expression in GSE39582 were obtained from the GEO dataset. The optimal cut-off value for high and low DKK1 expression was determined based on the ROC curve of recurrence, and a value of 3.483 was determined to be the cut-off value. Data on LRP6 expression in individual T cells from treatment-naïve patients with CRC were obtained online (http://crctcell.cancer-pku.cn/).31 Analysis was conducted using single T-cell analysis by RNA-seq and TCR tracking.32
Statistical analysis
SPSS V.19.0 and GraphPad Prism V.6 (San Diego, California, USA) were used for data analysis. Data for continuous and discrete variables are reported as the mean and median, respectively. Data for categorized variables are reported as percentages. Student’s t-test was used for the comparison of two sets of quantitative data that deviated from the Gaussian distribution. The Mann-Whitney U rank-sum test was used for the comparison of two sets of quantitative data that did not deviate from the Gaussian distribution. The Wilcoxon test was used for the comparison of paired quantitative data that did not deviate from the Gaussian distribution. For Student’s t-test, the mean value is shown, and the SD is displayed by the error bar (mean±SD). For the Mann-Whitney U rank-sum test, the median value is shown, and the range is displayed by the error bar. The Wald χ2 test was used to compare the differences in categorical parameters.
Distributions of DFS, recurrence-free survival, progression-free survival (PFS), and overall survival (OS) were determined using Kaplan-Meier methods. Univariate and multivariable Cox proportional hazards models were used to predict the outcomes of influential factors. The Spearman rank correlation test was used to measure the relationship between two discrete variables. All p values were two-sided, and p values of <0.05 were considered statistically significant. ROC curves were also used to compare the predictive ability of the prognostic factors for survival.
See online supplemental material for additional information on Methods.
Results
Elevated DKK1 was associated with poor prognosis, insensitivity to PD-1 blockade, and worse immune status in dMMR/MSI CRCs
To assess the prognostic value of DKK1 in CRC, DKK1 expression data in GSE39582 were analyzed. We found that elevated DKK1 expression was correlated with a high risk of recurrence (figure 1A) and that patients with lower DKK1 expression demonstrated a tendency for better OS (online supplemental figure S1A). To demonstrate the prognostic value of DKK1 in dMMR/MSI CRCs, we included 80 dMMR CRC cases. The IHC scoring for DKK1 is shown in online supplemental figure S1B, and the demographics of the patients are detailed in table 1. Patients with lower scores demonstrated better DFS, while the OS was comparable (figure 1B and online supplemental figure S1C). In addition, the IHC scores were higher in sporadic dMMR CRCs than in Lynch-associated dMMR (online supplemental figure S1D).
Supplemental material
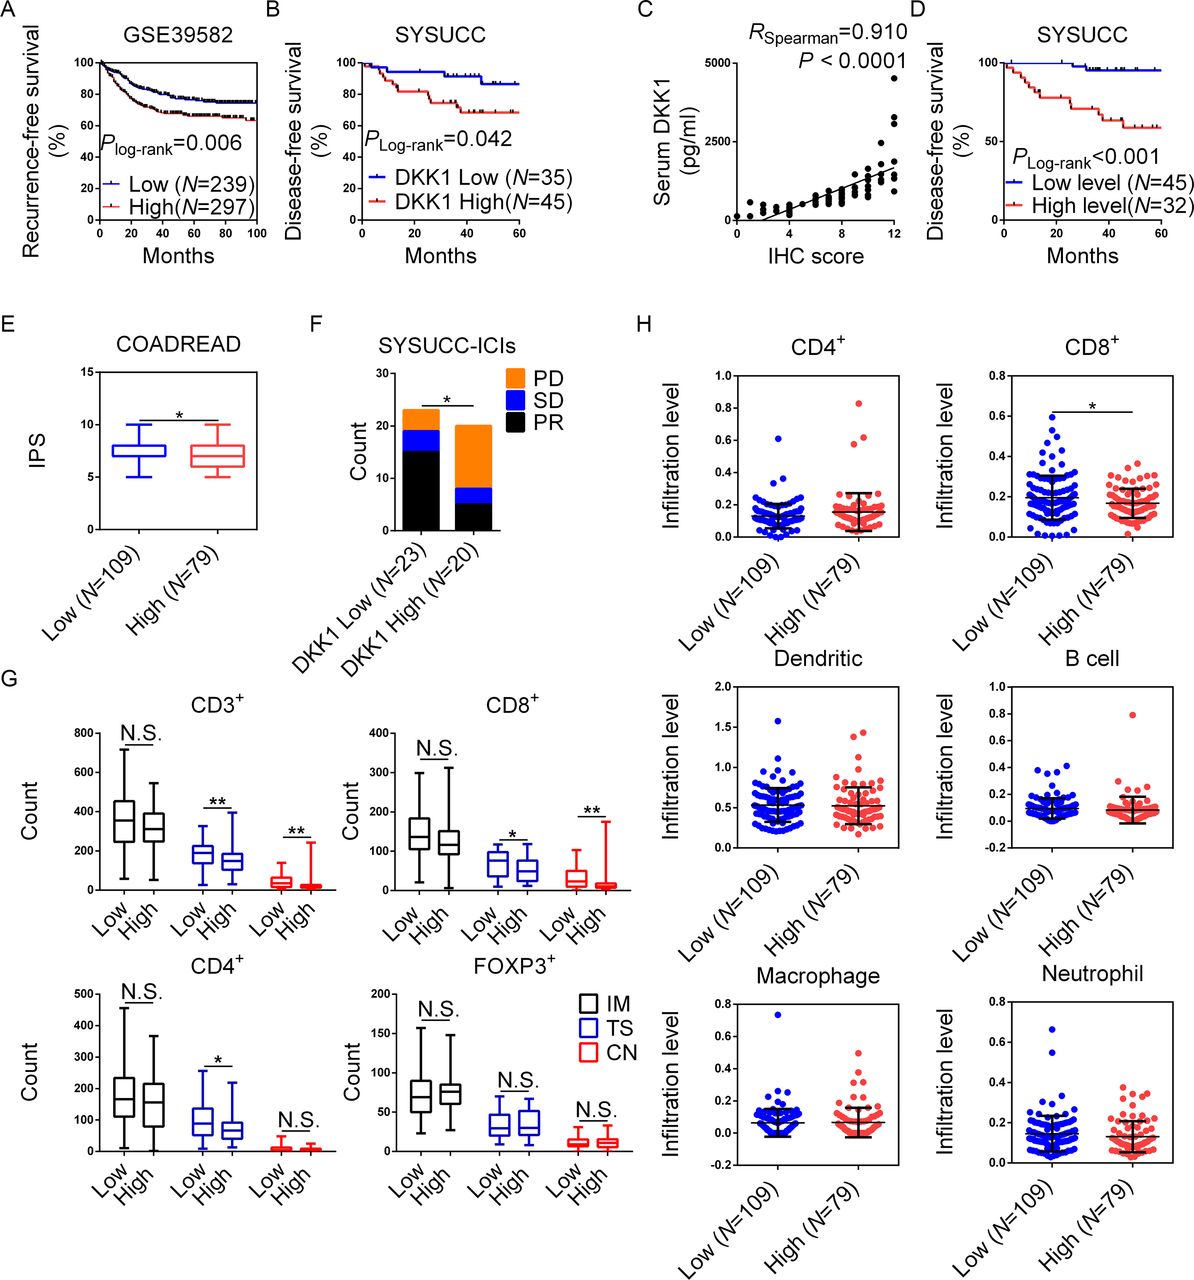
DKK1 was associated with poor prognosis and worse immune status in patients with dMMR/MSI CRC. (A) In GSE39582, the recurrence-free survival of patients with CRC was compared between the high (n=297) and low (n=239) DKK1 expression groups. (B) DFS of patients with dMMR/MSI CRC was compared between the high (n=45) and low (n=35) DKK1 expression groups. (C) Spearman correlation test between serum DKK1 concentration and tumor DKK1 IHC scores. (D) Comparison of DFS of patients with dMMR CRC with high (n=32) and low (n=45) serum DKK1 levels. (E) The IPS of MSI CRCs in the TCIA database in TCGA were compared between high (n=109) and low (n=79) DKK1 expression groups. (F) Comparison of the response to PD-1 blockade between patients with dMMR/MSI with high (n=23) and low (n=20) serum DKK1. (G) CD3+ TILs, CD4+ TILs, CD8+ TILs and FOXP3+ TILs were identified by IHC and measured in the IM, TS, and CN. Each of the TILs was compared between the high and low DKK1 expression groups. (H) Comparison of the infiltration of CD4+ cells, CD8+ cells, B cells, dendritic cells, macrophages, and neutrophils in MSI CRCs in TCGA between (n=109) and low (n=79) DKK1 expression groups in timer. *0.01≤p<0.05, **0.001≤p<0.01. CN, cancer nest; CRC, colorectal cancer; DFS, disease-free survival; DKK1, Dickkopf 1; dMMR, deficient mismatch repair; ICI, immune checkpoint inhibitor; IHC, immunohistochemistry; IM, invasive margin; IPS, immunophenoscore; MSI, microsatellite instability; N.S., not significant; PD, progressive disease; PR, partial regression; SD, stable disease; SYSUCC, Sun Yat-sen University Cancer Center; TCGA, The Cancer Genome Atlas; TCIA, The Cancer Immunome Atlas; TIL, tumor-infiltrating lymphocyte; TS, tumor stroma.
Baseline characteristics of patients with dMMR CRC
The IHC score cut-off value of ≤7 was determined based on the ROC curve and was highly over-fitted. Therefore, IHC staining for DKK1 was conducted in an independent cohort of 78 stage II/III CRCs. We found that patients with scores≤7 still demonstrated better DFS (online supplemental figure S2A and B).
In previous studies, serum DKK1 was positively correlated with the DKK1 expression level in tumors.27 28 Based on these findings, we investigated the correlation between serum and tumor-expressed DKK1 in the current study. ELISAs were conducted using preoperative serum samples from 77 scored patients (serum samples from three patients were unavailable). We found a positive correlation between serum DKK1 and IHC scores (figure 1C), and the DFS for patients with lower serum DKK1 was better (figure 1D).
In TCIA, DKK1 expression was associated with insensitivity to ICIs in MSI CRCs (figure 1E). To investigate the association between DKK1 and the tumor response to PD-1 blockade, the serum DKK1 levels of another 43 dMMR/MSI CRCs prior to PD-1 blockade were tested by ELISA. The demographics of the patients are detailed in online supplemental table S2. We found that patients with lower serum DKK1 demonstrated a higher partial regression ratio and better PFS (figure 1F and online supplemental figure S1E).
Supplemental material
Resistance to PD-1 blockade could be attributed to poor immune status.17 Therefore, we next investigated the correlation between DKK1 IHC scores and immune status and their influence on dMMR CRCs. In 73 dMMR CRCs with DKK1 IHC scores (7 cases had missing counting areas), subpopulations of TILs were identified using IHC staining for CD3, CD4, CD8, FOXP3 and PD-1. In Cox proportional hazards regression for DFS, instead of DKK1 score, the age, tumor, node, metastases stage and number of CD3+ TILs in CN were independently associated with risk of recurrence (online supplemental table S3). In tumors with lower DKK1 scores, the numbers of CD3+ and CD8+ TILs in the TS and CN and CD4+ TILs in the TS were higher (figure 1G), and the PD-1-positive ratio in CD8+ TILs was lower (online supplemental figure S2D). Moreover, negative correlations were detected between DKK1 IHC scores and the numbers of CD8+ TILs in the CN and CD3+ and CD4+ TILs in the TS (online supplemental figure S1F). In addition, a positive correlation between DKK1 scores and the PD-1-positive ratio in CD8+ TILs was found (online supplemental figure S2E). In TIMER, we also found that elevated DKK1 expression was associated with fewer CD8+ TILs in MSI CRCs (figure 1H). Our findings showed that elevated DKK1 expression was associated with poor prognosis, reduced sensitivity to PD-1 blockade, and worse immune status in dMMR/MSI CRCs.
Supplemental material
DKK1 knockdown suppressed tumor formation and modulated the CRC immune microenvironment
To investigate the function of DKK1, we constructed DKK1 knockdown CT26 cells with two shRNAs, and CT26 cells transfected with Ctrl shRNA were used as a negative Ctrl. To evaluate DKK1 expression, western blotting was conducted. In DKK1 knockdown cells, decreased DKK1 protein was identified in both the cell lysate and the supernatant (online supplemental figure S3A). To investigate the function of DKK1 in tumor growth and immune status, BALB/c mice were grafted with CT26 cells subcutaneously, and TILs and PBMCs were then collected for flow cytometry. We found that DKK1 knockdown suppressed the growth of tumors (figure 2A), and the ratio of CD8+ TILs, instead of the ratio of CD4+ TILs, was increased (figure 2B). In terms of the percentage of CD8+ T cells in PBMCs, there were no differences between the Ctrl and DKK1 knockdown groups (online supplemental figure S3B).
Supplemental material
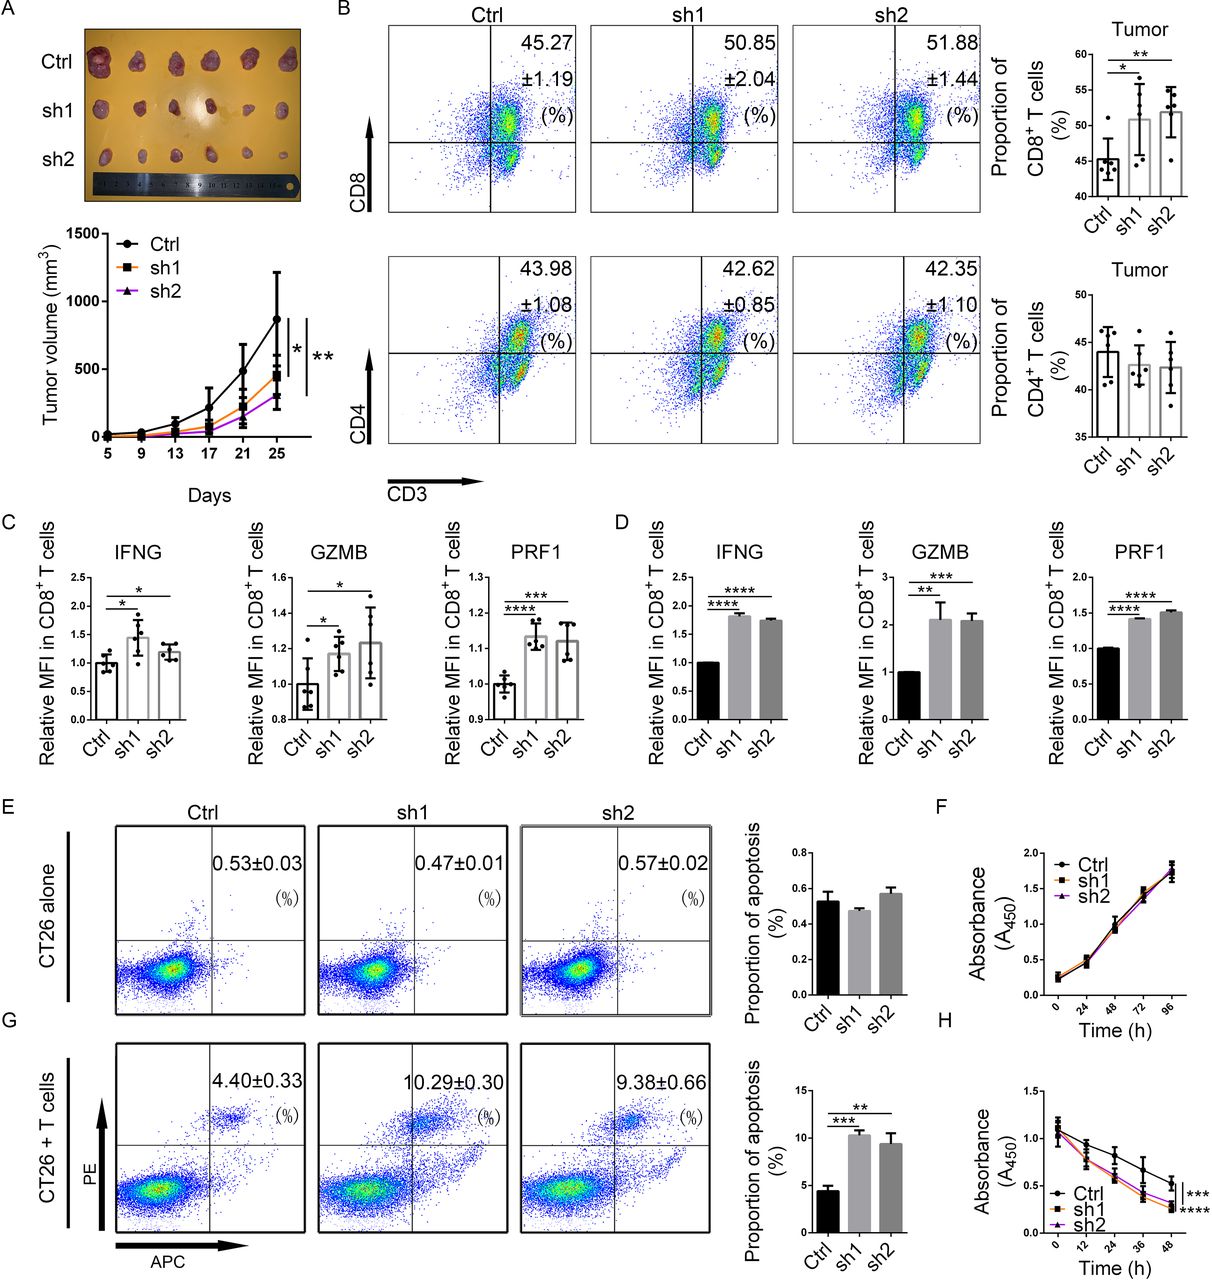
DKK1 knockdown suppressed tumor formation and modulated the tumor immune microenvironment in mouse CRC. (A) DKK1 knockdown (SH1 and SH2) and Ctrl CT26 cells (5×10⁵) were subcutaneously grafted into BALB/c mice. The size of each tumor was measured every 4 days. On day 25, the mice were sacrificed, and their tumors were removed for examination and analysis. (B) TILs were derived from the tumors, and the proportions of CD4+ and CD8+ T cells were measured by flow cytometry. (C) Immune activation markers, including IFNG, GZMB, and PRF1, in CD8+ TILs were measured using flow cytometry. (D) IFNG, GZMB, and PRF1 in CD8+ T cells cocultured with each of the CT26 cells for 24 hours were measured using flow cytometry. (E,F) Apoptosis assays (E) and CCK-8 assays (F) were conducted in DKK1 knockdown and Ctrl CT26 cells cultured alone. (G,H) Apoptosis assays (G) and CCK-8 assays (H) of DKK1 knockdown and Ctrl CT26 cells cocultured with mouse T cells for 6 hours. *0.01≤p<0.05, **0.001≤p<0.01, ***0.0001≤p<0.001, ****p<0.0001. CRC, colorectal cancer; Ctrl, control; DKK1, Dickkopf 1; GZMB, granzyme B; IFNG, interferon gamma; MFI, mean fluorescence intensity; PE, paired end; PRF1, perforin 1; TIL, tumor-infiltrating lymphocyte.
To evaluate the activation of effector CD8+ T cells, flow cytometry assays were used to assess the expression of immune activation markers. We found increased expression of IFNG, granzyme B (GZMB), and perforin 1 (PRF1) in CD8+ TILs in DKK1 knockdown tumors (figure 2C and online supplemental figure S3C). To assess the influence of DKK1 on CD8+ T cells in vitro, spleen-derived T cells from healthy mice were prestimulated and cocultured with CT26 cells in vitro and then used for flow cytometry. We still found a substantial increase in IFNG, GZMB, and PRF1 expression in CD8+ T cells in the DKK1 knockdown groups (figure 2D and online supplemental figure S3D). In addition, in DKK1-treated T cells, a decrease in IFNG, GZMB, and PRF1 was also demonstrated in CD8+ T cells (online supplemental figure S3E).
To evaluate the function of DKK1 in tumor proliferation and apoptosis, apoptosis assays and CCK-8 assays using CT26 cells were conducted, and neither assay showed a difference between the Ctrl and DKK1 knockdown groups (figure 2E,F). However, after coculture with T cells, an increased proportion of apoptotic cells and decreased viability of CT26 cells were detected in the DKK1 knockdown groups (figure 2G,H). Based on these findings, we hypothesized that DKK1 suppressed the cytotoxicity of CD8+ TILs in CRCs.
DKK1 modulated the cytotoxicity of T cells in dMMR CRCs
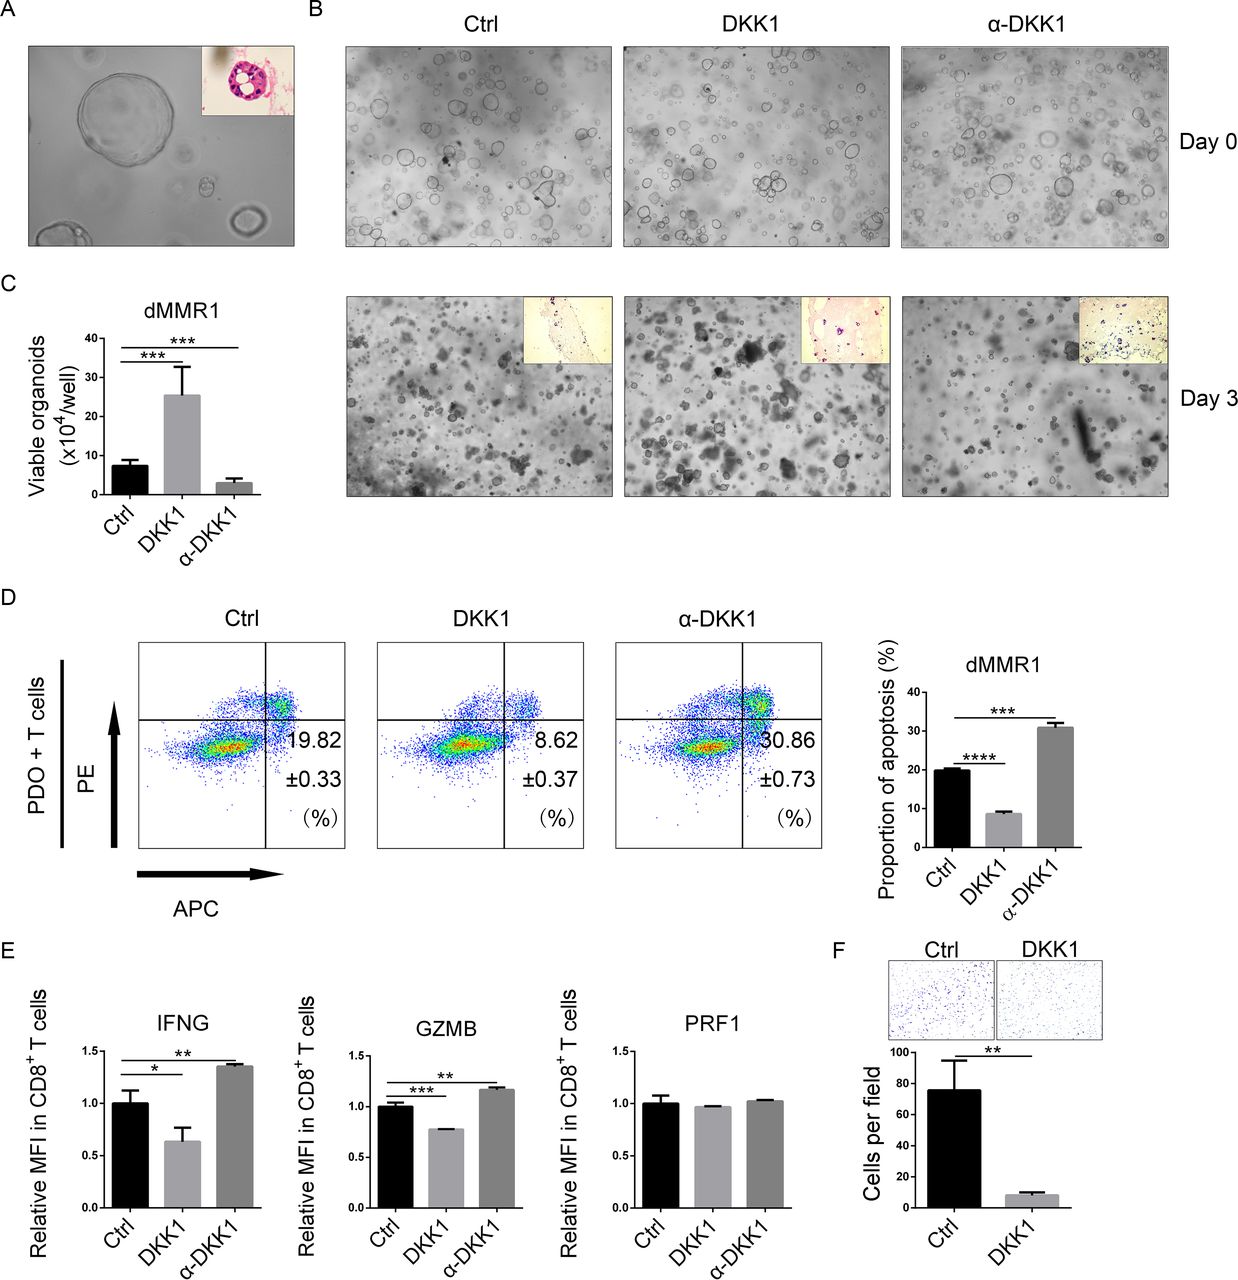
To assess the function of DKK1 in dMMR CRCs, patient-derived organoids (PDOs) from two patients with dMMR CRC (dMMR1 and dMMR2) (figure 3A and online supplemental figure S4 and 5A) were cocultured with T cells and treated with DKK1, DKK1 neutralizing antibody (α-DKK1), and mock (Ctrl) in the presence of Matrigel. Cells of PDOs were then stained with Trypan Blue and counted. The viability of PDO cells was higher in the DKK1 group and lower in the α-DKK1 group than in the Ctrl group (figure 3B,C and online supplemental figure S5B and C). To investigate whether DKK1 mediates T-cell infiltration, H&E staining of Matrigel was performed. Visual analysis indicated that DKK1 showed a trend of inhibiting infiltration, and α-DKK1 showed a trend of enhancing infiltration (figure 3B and online supplemental figure S5B). To evaluate the cytotoxicity of T cells, PDOs were cocultured with T cells in the absence of Matrigel. Apoptosis assays detected a decrease in the proportion of apoptotic cells in the DKK1 group and an increase in the proportion of apoptotic cells in the α-DKK1 group (figure 3D and online supplemental figure S5D).
Supplemental material
Supplemental material

DKK1 mediated the cytotoxicity of T cells in dMMR CRC. (A) Typical bright-field image (400×) and H&E staining of dMMR1 organoids. (B,C) Organoids were cultured in 24-well plates with mock and IgG (Ctrl), 100 ng/mL DKK1 and IgG (DKK1), and mock and DKK1 neutralizing antibodies (α-DKK1) in the presence of Matrigel for 24 hours (day 0). Then, T cells were added to the medium and cocultured for another 3 days (day 3). Images were captured on day 0 and day 3 (100×), and the Matrigel was collected for H&E staining (100×) (B). Organoids cocultured with T cells for 3 days were derived and digested into single cells, and the number of viable living cells per well was counted (C). (D) Apoptosis assays of organoids cocultured with lymphocytes in the absence of Matrigel. (E) T cells were treated with 100 ng/mL DKK1 plus IgG (DKK1), DKK1 neutralizing antibody with mock (α-DKK1), or IgG with mock (Ctrl) for 24 hours. The MFIs of IFNG, GZMB, and PRF1 in CD8+ T cells were measured by flow cytometry. (F) CD8+ cells were derived from T cells. The Transwell assay was conducted with the supernatants from PDOs. Typical images (100×) are shown. *0.01≤p<0.05, **0.001≤p<0.01, ***0.0001≤p<0.001, ****p<0.0001. CRC, colorectal cancer; Ctrl, control; DKK1, Dickkopf 1; dMMR, deficient mismatch repair; GZMB, granzyme B; IFNG, interferon gamma; MFI, mean fluorescence intensity; PDO, patient-derived organoid; PRF1, perforin 1.
To determine whether DKK1 could suppress the activation of CD8+T cells, prestimulated T cells were treated with DKK1, α-DKK1, or mock Ctrl. Then, flow cytometry assays were used to evaluate the expression of activation markers. We detected a decrease in IFNG and GZMB expression in DKK1-treated CD8+ T cells and an increase in α-DKK1-treated cells. However, there was no difference in PRF1 expression (figure 3E and online supplemental figure S5E). To determine whether DKK1 could suppress CD8+ T-cell infiltration, CD8+ T cells were isolated for Transwell assays. We showed that DKK1 suppressed the invasiveness of CD8+ T cells (figure 3F and online supplemental figure S5F). Together, these findings demonstrated that DKK1 suppressed the cytotoxicity and infiltration of CD8+ T cells in dMMR CRC cells.
DKK1 directly suppressed CD8+ T-cell activation
To exclude the possibility that DKK1 mediates immune-associated ligands in CRCs, DLD1 cells were treated with DKK1 or mock. RNA-seq was performed. Among genes with significant changes, immune-associated ligands were not found (online supplemental table S4).
Supplemental material
Since DKK1 suppressed T-cell cytotoxicity, RNA-seq was conducted on T cells from dMMR1 and a healthy donor. After DKK1 treatment, T cells from dMMR1 and the healthy donor exhibited changes in 14 shared genes, among which we noticed an upregulation of PDCD1 (the gene encoding PD-1) (figure 4A and online supplemental figure S6A and table S5). To further investigate the association between DKK1 and PD-1, we conducted flow cytometry assays using T cells from CT26-grafted mice. In the DKK1 knockdown groups, decreased PD-1 expression in CD8+ T cells was detected in TILs, PBMCs, and splenic lymphocytes (figure 4B). In addition, among the dMMR patients in our center, PD-1 expression was significantly higher in CD8+ TILs with higher DKK1 IHC scores (online supplemental figure S2D,E).
Supplemental material
Supplemental material
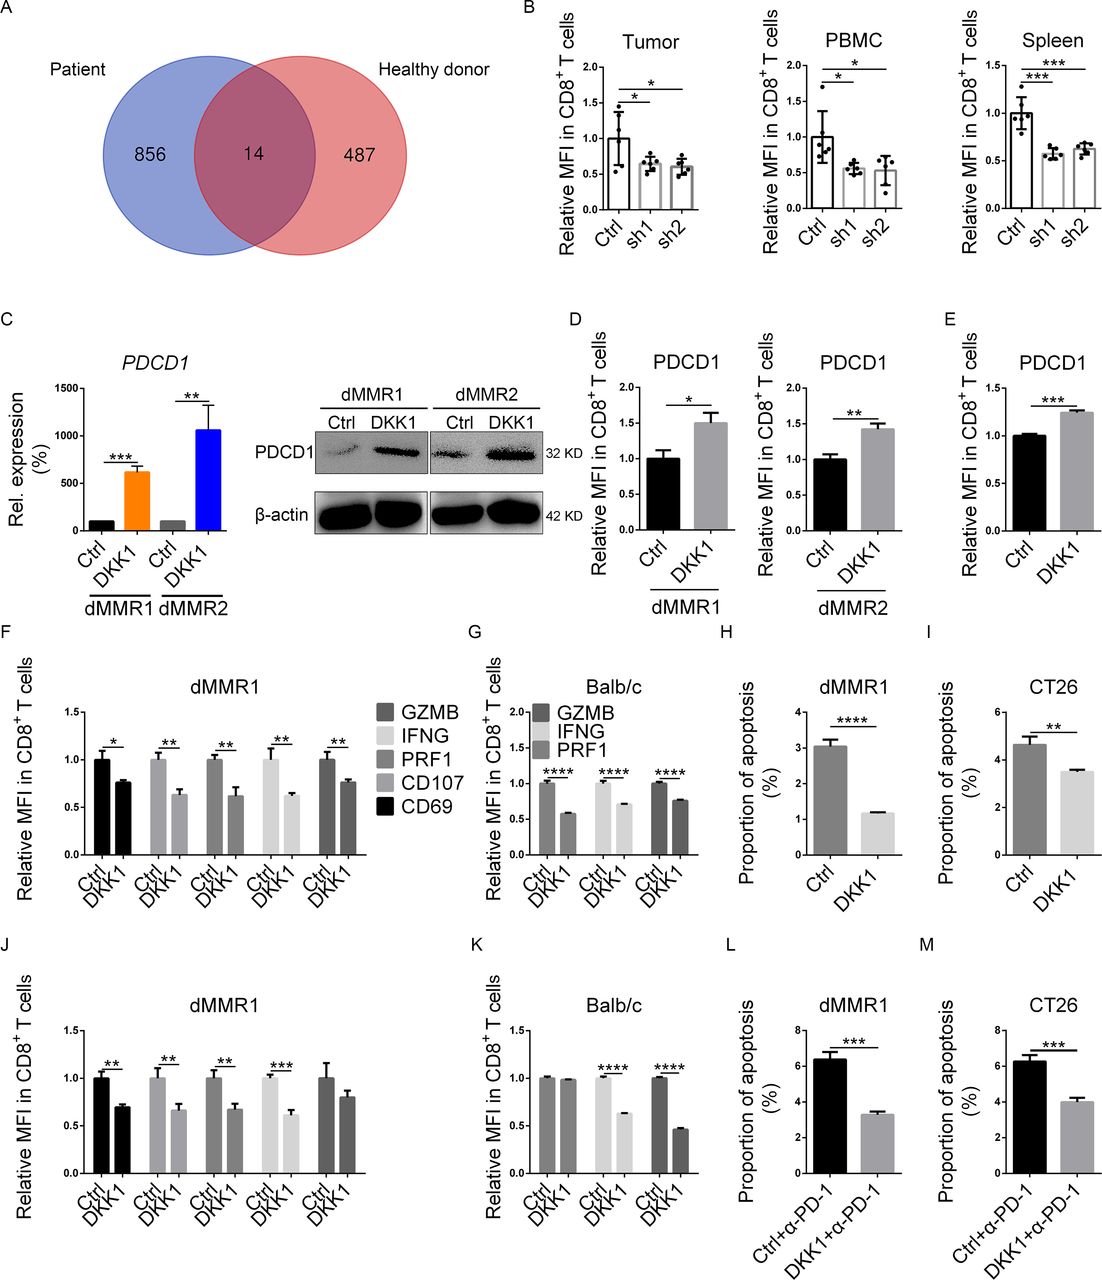
DKK1 directly suppressed CD8+ T cells. (A) T cells of dMMR1 and a healthy donor were derived from PBMCs and cultured for 24 hours in the presence or absence of DKK1. Then, RNA was obtained for sequencing, and genes with significant changes and similar tendencies from both the dMMR1 and healthy donors were identified. The Venn diagram shows the numbers of unique and shared gene expression changes. (B) The relative MFI of PDCD1 in CD8+ T cells from TILs, PBMCs, and spleen in DKK1 knockdown (SH1 and SH2) and Ctrl groups was measured using flow cytometry. (C) Both qPCR and Western blotting were conducted to evaluate PDCD1 expression in human CD8+ T cells cultured in the presence (DKK1) or absence (Ctrl) of 100 ng/mL DKK1. The relative MFIs of PD-1 (PDCD-1) were analyzed using flow cytometry in human (D) and mouse (E) CD8+ T cells cultured in the presence (DKK1) or absence (Ctrl) of 100 ng/mL DKK1. Immune activation markers in both dMMR1 (F) and mouse (G) CD8+ T cells were measured by flow cytometry after culturing in the presence or absence of 100 ng/mL DKK1. Both dMMR1 organoids (H) and CT26 cells (I) were cocultured with CD8+ T cells pretreated with mock (Ctrl) or 100 ng/mL DKK1, and then tumor cells were collected for apoptosis assays. (J,K) Immune activation markers in both dMMR1 (J) and mouse (K) CD8+ T cells after PD-1 blockade in the presence or absence of 100 ng/mL DKK1 were measured by flow cytometry. Both dMMR1 organoids (L) and CT26 cells (M) were cocultured with CD8+ T cells pretreated with PD-1 neutralizing antibody (Ctrl+α-PD-1) or PD-1 neutralizing antibody plus DKK1 (DKK1+α-PD-1), and the tumor cells were then collected for apoptosis assays. *0.01≤p<0.05, **0.001≤p<0.01, ***0.0001≤p<0.001, ****p<0.0001. Ctrl, control; DKK1, Dickkopf 1; dMMR, deficient mismatch repair; MFI, mean fluorescence intensity; PBMC, peripheral blood mononuclear cell.
Because CD8+ TILs functionally express LRP633 and are inactivated by PD-1,34 we hypothesized that DKK1 modulates CD8+ T cells directly. To further demonstrate the influence of DKK1 treatment on CD8+ T cells, flow cytometry assays were conducted. Treatment with DKK1 elevated PD-1 expression in human and mouse CD8+ T cells (figure 4C–E). In addition, DKK1 downregulated the expression of other activation markers, including CD69, CD107, IFNG, GZMB, and PRF1 (figure 4 and online supplemental figure S6B), and we also observed a decrease in IFNG, GZMB, and PRF1 expression in mouse CD8+ T cells (figure 4G). Additionally, to evaluate the cytotoxicity of CD8+ T cells, human CRC organoids and CT26 cells were cocultured with paired CD8+ T cells and treated with mock (Ctrl) or DKK1. Apoptosis assays for tumor cells were then conducted. We found a decrease in the proportion of apoptotic cells in the DKK1-treated groups (figure 4H1 and online supplemental figure S6C).
It is possible that DKK1 exhausted effector CD8+ T cells by upregulating PD-1 expression. To assess the importance of PD-1 in DKK1-mediated T-cell suppression, PD-1 was neutralized during stimulation and DKK1 treatment of CD8+ T cells. In contrast to our hypothesis, we detected a decrease in many activation markers in CD8+ T cells after DKK1 treatment (figure 4J,K and online supplemental figure 6). In addition, in CRC cells cocultured with PD-1-neutralized CD8+ T cells, the difference in the proportion of apoptotic cells remained between the Ctrl and DKK1 groups (figure 4L,M and online supplemental figure 6). These findings indicated that PD-1-associated exhaustion of effector CD8+ T cells was not critical for DKK1-associated suppression.
To further investigate the subpopulation of cells targeted by DKK1, LRP6 expression data from deep single-cell RNA-seq of individual T cells from treatment-naïve patients with CRC were analyzed.31 We noticed that the LRP6 expression level was highest in CD8_C01-LEF1 cells, which express naïve markers, including LEF1, TCF7, CCR7 and CD28 (online supplemental figure S6F). More significantly, by analyzing RNA-seq data using dMMR1 T cells, we found an increase in the expression of TCF7 and LEF1 in the DKK1-treated group as well as a decrease in the expression of IFNG, GZMA (p=0.06) and the transcription factor ZEB2 (p=0.06) (online supplemental figure S6A).35 36 To further investigate the function of DKK1 in naïve CD8+ T cells, LEF1 staining and flow cytometry were conducted using mock-treated and DKK1-treated CD8+ T cells of dMMR1 and dMMR2. We found that the ratio of LEF1+ cells was higher in the DKK1-treated groups (online supplemental figure S6G). Furthermore, to investigate the difference in CD8+ T-cell subpopulations between MSI-H CRCs with high and low DKK1 expression, TCGA data were analyzed using ImmuCellAI. We found that the infiltration level of CD8+ naïve cells was higher in the DKK1 high expression groups, while the infiltration level of effector memory CD8+ T cells and cytotoxic CD8+ T cells was lower (online supplemental figure S6H). These findings further indicated that DKK1 suppressed the activation of naïve CD8+ T cells to effector cells. Therefore, our findings suggested that DKK1 directly suppressed CD8+ T cells by inhibiting the process of activation.
DKK1 mediated the GSK3β/E2F1/T-bet axis in CD8+ T cells
DKK1 downregulated the activation markers in CD8+ T cells (figure 4F,G and online supplemental figure 6), while the expression levels of many cytokines and transcription factors in effector CD8+ T cells, including GZMB and PRF1, were comparable between mock-treated and DKK1-treated T cells in the RNA-seq data (online supplemental figure S6A). We considered that the background of other T cells could have interfered with and affected the detection of downstream signaling pathways of DKK1. To further investigate the mechanism by which DKK1 inactivates CD8+ T cells, we performed RNA-seq to compare DKK1-treated and mock-treated CD8+ T cells from two patients. Gene-set enrichment analysis revealed inhibited epithelial–mesenchymal transition after DKK1 treatment (online supplemental figure S7A), which could explain the decreased CD8+ TIL infiltration.
Supplemental material
However, among CD8+ effector T cells, Tc1, Tc2, Tc9, and Tc17 cells are the main subpopulations,37 among which Tc1 cells are recognized as cytotoxic T lymphocytes and express IFNG, TNF, PRF1 and GZMB. It was unclear whether DKK1 promoted the activation of other CD8+ T-cell subpopulations and influenced effector CD8+ T cells indirectly. To demonstrate whether DKK1 influences Tc2, Tc9 and Tc17 cells, the expression of their products in RNA-seq data was further analyzed. We found that the expression of these markers was comparable between the DKK1-treated and mock-treated groups (online supplemental figure S7B). Therefore, inactivation of Tc1 cells is likely to be the main effect of DKK1.
KEGG analysis using RNA-seq data demonstrated suppression of the PI3K pathway in CD8+ T cells after DKK1 treatment (figure 5A). In the PI3K pathway, GSK3β is activated by DKK1. When DKK1 binds to LRP5/6, GSK3β is then dephosphorylated and transported into the nucleus. Inhibition of GSK3β induces proliferation of CD8+ TILs, upregulating the expression of GZMB, IFNG and CD107.38 39 Moreover, GSK3β promotes PD-1 expression by downregulating T-bet, a transcription factor promoting robust effector CD8+ T-cell differentiation.39 40 Thus, we assessed whether DKK1 regulates the GSK3β/T-bet axis. With coimmunoprecipitation and cell fractionation followed by western blotting, we found that DKK1 promoted the dephosphorylation of GSK3β, decreasing its binding with LRP6 (figure 5B and online supplemental figure S7C) and inducing its nuclear localization (figure 5C and online supplemental figure S7D). Furthermore, qPCR detected that DKK1 downregulated the expression of TBX21 (the gene encoding T-bet) and downstream genes in CD8+T cells from dMMR1 and dMMR2 (figure 5D,E and online supplemental figure S7E).

DKK1 mediated CD8+ T cells through the GSK3β/T-bet pathway. (A) CD8+ T cells were cultured for 24 hours in the presence or absence of DKK1. Then, RNA sequencing was conducted, and genes with significant changes were selected for KEGG analysis. (B) Western blot and coimmunoprecipitation assays were conducted on mock-treated (Ctrl) or DKK1-treated CD8+ T cells from dMMR1 to measure the phosphorylation level of GSK3β as well as its interaction with LRP6. (C) Subcellular fractionation was performed on mock-treated (Ctrl) or DKK1-treated CD8+ T cells from dMMR1 to measure the nuclear and cytoplasmic localization of GSK3β. TBX21 (the gene encoding T-bet) expression in mock-treated (Ctrl) or DKK1-treated CD8+ T cells was measured by qPCR (D), and the expression levels of downstream genes of TBX21 in mock-treated (Ctrl) or DKK1-treated CD8+ dMMR1 T cells were also evaluated (E). (F) E2F1 expression in mock-treated (Ctrl) or DKK1-treated CD8+ T cells was measured by qPCR. (G) Ctrl and E2F1 knockdown (siE2F1-1 and siE2F1-2) Jurkat cells were treated with dimethyl sulfoxide or the GSK3β inhibitor SB216763 (iGSK3β), and then qPCR was conducted to measure the expression of TBX21. (H) Chromatin immunoprecipitation assays were conducted in CD8+ T cells, and electrophoresis following qPCR was performed to assess the binding site of the TBX21 promoter. (I) Luciferase reporter vectors containing the WT TBX21 promoter or a Mut promoter with a binding site deletion were generated and transfected into Ctrl or E2F1 knockdown Jurkat cells. The cells were then cultured for 24 hours and collected for the luciferase reporter assay. **.001≤p<0.01, ***0.0001≤p<0.001, ****p<0.0001. Ctrl, control; DKK1, Dickkopf 1; dMMR, deficient mismatch repair; KEGG, Kyoto Encyclopedia of Genes and Genomes; Mut, mutated; qPCR, quantitative PCR; WT, wild type.
Next, to reveal the transcription factor connecting GSK3β and T-bet, we analyzed the TBX21 promoter in JASPAR (http://jaspar.genereg.net/) and hTFtarget (http://bioinfo.life.hust.edu.cn/hTFtarget/). We noticed that E2F1 ranked at the top among the targets of GSK3β (online supplemental table S6).41 42 In addition, using qPCR, we found a decrease in the expression of E2F1 in CD8+ T cells from dMMR patients after DKK1 treatment (figure 5F). Then, we assessed the effect of E2F1 on TBX21. Using qPCR, we found that E2F1 knockdown suppressed TBX21 expression and reversed the upregulation of TBX21 induced by GSK3β inhibition in Jurkat cells (figure 5G). More importantly, chromatin immunoprecipitation assays showed binding of E2F1 in the predicted binding site in the T-bet promoter (figure 5H).
Supplemental material
To verify the transactivation of the binding site, luciferase reporter vectors containing the wild-type (WT) promoter and a mutated (Mut) promoter with a deleted binding site were generated and transfected into Ctrl or E2F1 knockdown Jurkat cells. In the reporter assay, E2F1 knockdown reduced the activity of the WT reporter, while no difference was detected when the Mut reporter was used (figure 5I). Therefore, we concluded that DKK1 inactivated CD8+ T cells through the GSK3β/E2F1/T-bet axis.
DKK1 neutralization enhanced the tumor response to PD-1 blockade in dMMR/MSI CRC cells
Given that elevated DKK1 was associated with a poor response to anti-PD-1 therapy (figure 1F and online supplemental figure S1E) and that DKK1 inhibited the cytotoxicity of PD-1-neutralized CD8+ T cells (figure 4I and J and online supplemental figure S6D), we hypothesized that DKK1 could be a biomarker to predict the response to anti-PD-1 therapy. To evaluate this possibility, 1 mg/kg of PD-1 neutralizing antibody or IgG was given to CT26-grafted mice. We found no difference in tumor volume between the PD-1-neutralized group and the IgG-treated Ctrl group, whereas the growth of DKK1 knockdown tumors was inhibited by PD-1 neutralization (figure 6A). To assess the in vitro sensitivity to PD-1 neutralization, CT26 cells were cocultured with PD-1-neutralized or IgG-treated T cells, and then apoptosis assays were conducted with the CT26 cells. Among the PD-1 neutralization groups, an increased proportion of apoptotic cells was detected only in the DKK1 knockdown group (figure 6B).

DKK1 blockade enhanced the response to PD-1 blockade. (A) DKK1 knockdown (SH1 and SH2) and Ctrl CT26 cells (5×10⁵) were subcutaneously grafted into BALB/c mice. When the size of the individual tumor reached 500 mm3, 1 mg/kg of PD-1 neutralizing antibody (α-PD-1) or IgG was intraperitoneally injected every 3 days, and the tumor sizes were measured every 4 days until day 16. The mice were then sacrificed to assess the tumors. (B) DKK1 knockdown (SH1 and SH2) and Ctrl CT26 cells were cocultured with PD-1-neutralized (α-PD-1) or IgG-treated T cells, respectively, for 6 hours, and apoptosis assays were conducted. (C) DKK1-neutralized (α-DKK1) and IgG-treated (Ctrl) dMMR1 organoids were cocultured with PD-1-neutralized (α-PD-1) or IgG-treated T cells, respectively, for 6 hours, and an apoptosis assay was conducted. **0.001≤p<0.01, ***0.0001≤p<0.001, ****p<0.0001. Ctrl, control; DKK1, Dickkopf 1; dMMR, deficient mismatch repair.
To determine whether DKK1 neutralization could improve the anti-PD-1 response, PDOs were cocultured with either PD-1-neutralized or IgG-treated T cells. Apoptosis assays demonstrated an increase in the proportion of apoptotic cells in PDOs after individual neutralization of either PD-1 or DKK1. More significantly, combined neutralization of PD-1 and DKK1 resulted in a greater increase in the proportion of apoptotic cells than individual PD-1 neutralization (figure 6C and online supplemental figure S8). These findings revealed that DKK1 neutralization enhanced the response to PD-1 blockade in dMMR/MSI CRC cells.
Supplemental material
Discussion
We demonstrated an immunomodulatory role of DKK1 in CD8+ TILs through the GSK3β/E2F1/T-bet axis. Additionally, DKK1 may be a potential target to enhance the sensitivity to PD-1 blockade in dMMR/MSI CRCs. To our knowledge, these findings have not been reported before.
According to Norgaard et al, mutation of MSH2 leads to hypermethylation of the DKK1 promoter,43 resulting in DKK1 inhibition. Moreover, sporadic dMMR CRCs are strongly correlated with the hypermethylated MLH1 promoter and BRAF V600E,44 which do not influence DKK1 expression.22 Therefore, the heterogeneity of dMMR CRCs may result in differential DKK1 expression, and DKK1 expression was actually higher in sporadic dMMR CRCs than in Lynch-associated CRCs in the current study. Furthermore, elevated DKK1 was correlated with a worse antitumor immune reaction, which could provide a new explanation for the poor prognosis and immune status in sporadic CRCs.16
DKK1 did not mediate the proliferation and apoptosis of CRC cells but suppressed the cytotoxicity of CD8+ TILs. DKK1 has been considered a tumor suppressor, whereas research has indicated that it functions in tumor progression.21 Because DKK1 neutralization increases activated and memory T cells in tumors27 and because DKK1 decreases CD8+ TILs and promotes the evasion of NK cell-mediated clearance,28 45 immune cells are thought to be critical to the effects of DKK1. Although Myeloid-derived suppressor cells (MDSCs) were shown to be the primary target of DKK1 to regulate T cells,27 both the research of Chae et al and our research demonstrated direct regulation of T cells by DKK1.25 Moreover, Chae et al indicated that DKK1 suppression on CD4+ T cells partially depended on cell–cell contact with FOXP3+ regulatory T cells.25 This could in turn explain the lack of detectable changes in CD4+ TILs in our study.
Although both LRP5 and LRP6 are receptors of DKK1 and can activate GSK3β, we only studied LRP6 in the current study. Xiao et al reported that DKK2 led to the internalization of LRP5, while the internalization of LRP6 was weak.33 The author thereby claimed that LRP5 contributed more to the suppression of TILs than LRP6. However, the suppression caused by LRP5 internalization did not affect TIL infiltration, and the GSK3β/T-bet axis was not affected.33 Therefore, the downstream effectors of DKK1 and DKK2 should be different. The binding of LRP6 to DKK1 is stronger than that of LRP5,46 and LRP6 internalization is not necessary for the activation of GSK3β.47 Thus, we hypothesized that LRP6, rather than LRP5, plays an important role in the function of DKK1.
Prior to our study, the mechanism by which GSK3β regulates T-bet was unclear. Taylor et al suspected NFATc1 as the connecting factor, yet NFATc1 knockdown inhibited both T-bet and PD-1.39 GSK3β suppressed T-bet by downregulating E2F1 expression. E2F1 regulates the proliferation and apoptosis of CD4+ T cells.48 In addition, CD8+ T cells deficient in E2F1 are less susceptible.49 In the current study, E2F1 was shown to be a transcription factor of TBX21; therefore, it also played an important role in tumor immunity by affecting the activation of effector CD8+ T cells.
Elevated DKK1 correlated with poor tumor response to PD-1 blockade, and this effect was reversed by DKK1 blockade. Prior to our study, it was reported that DKK proteins could be biomarkers associated with sensitivity to immunotherapy.33 50 Here, we showed that the serological DKK1 test recognized dMMR/MSI CRCs that would not benefit from PD-1 blockade. Most importantly, DKK1 blockade in cells from these patients restored their sensitivity to PD-1 blockade.
There are certain limitations in the current study. First, the influence of DKK1 on stromal cells, which may also contribute to the suppression of CD8+ TILs, was not shown. In addition, although we showed that DKK1 suppressed the tumor response to PD-1 blockade by experiments both in vitro and in vivo, the result of blocking PD-1/PD-L1 in in vitro culture may be different from that of blocking PD-1/PD-L1 in tumors, in which the source of PD-L1 may be different.
In conclusion, DKK1 is a negative modulator of antitumor immune responses in dMMR/MSI CRCs via inactivation of CD8+ TILs through the GSK3β/E2F1/T-bet axis. Serological DKK1 testing ahead of PD-1 blockade may predict the response to treatment in dMMR/MSI CRCs, and DKK1 blockade for patients with high serum DKK1 may enhance their sensitivity to PD-1 blockade.
Data availability statement
Data are available in a public, open access repository. The data underlying this article available in the Research Data Deposit online (https://www.researchdata.org.cn/) and can be accessed with RDD number RDDB2020000849. RNA-seq data were deposited at Gene Expression Omnibus (GSE149206).
Ethics statements
Ethics approval
All procedures performed in studies involving human subjects were approved by the ethical standards of the ethics committee of Sun Yat-sen University Cancer Center (GZR2020-273) and were in accordance with the 1964 Declaration of Helsinki and its later amendments or comparable ethical standards. Informed consent was obtained from all subjects included in the study.
Acknowledgments
We thank Dr Liyi Zhang and the staff at American Journal Experts (North Carolina, USA) for their assistance with English writing.
References
Supplementary materials
Supplementary Data
This web only file has been produced by the BMJ Publishing Group from an electronic file supplied by the author(s) and has not been edited for content.
Supplementary Data
This web only file has been produced by the BMJ Publishing Group from an electronic file supplied by the author(s) and has not been edited for content.
Footnotes
Correction notice This paper has been revised since first published to amend first authorship and correspondence details.
Contributors ZP, JZ, PZ and P-RD planned and supervised the experimental work and data analysis; QS, DL, GL, LL, QO, YL and JC performed all the experiments; KH, ZL and ZZ analyzed the data; KH, WJ, JT, YL, LK and BX diagnosed the patients and provided clinical information and samples; and QS and KH wrote the manuscript. All authors discussed and revised the manuscript.
Funding This work was supported by the National Natural Science Foundation of China (grant numbers 82073159, 82072606, 82002467, 81871971 and 81772595); the National Key R&D Program of China (grant number 2017YFC0908200); the Sun Yat-sen University Clinical Research 5010 Program (grant number 2014013); the Science and Technology Program of Guangzhou (grant number 201803010117); the Young Teacher Foundation of Sun Yat-sen University (grant number 13ykpy46) and the CSCO Foundation (grant number Y-XD2019-073, Y-2019Genecast-055). All procedures were approved by the Sun Yat-sen University Animal Care and Use Committee (L102012C16000C).
Competing interests None declared.
Provenance and peer review Not commissioned; externally peer reviewed.
Supplemental material This content has been supplied by the author(s). It has not been vetted by BMJ Publishing Group Limited (BMJ) and may not have been peer-reviewed. Any opinions or recommendations discussed are solely those of the author(s) and are not endorsed by BMJ. BMJ disclaims all liability and responsibility arising from any reliance placed on the content. Where the content includes any translated material, BMJ does not warrant the accuracy and reliability of the translations (including but not limited to local regulations, clinical guidelines, terminology, drug names and drug dosages), and is not responsible for any error and/or omissions arising from translation and adaptation or otherwise.