Article Text

Abstract
Background Currently available biomarkers are imperfect in their ability to predict responses to the multiple first-line treatment options available for patients with advanced non-small cell lung cancer (NSCLC). Having an early pharmacodynamic marker of treatment resistance may help redirect patients onto more effective alternative therapies. We sought to determine if changes in circulating tumor DNA (ctDNA) levels after initiation of first-line pembrolizumab±chemotherapy in NSCLC would enable early prediction of response prior to radiological assessment.
Methods Plasma collected from patients with advanced NSCLC prior to and serially after starting first-line pembrolizumab±platinum doublet chemotherapy was analyzed by next-generation sequencing using enhanced tagged-amplicon sequencing of hotspots and coding regions from 36 genes. Early change in ctDNA allele fraction (AF) was correlated with radiographic responses and long-term clinical outcomes.
Results Among 62 patients who received first-line pembrolizumab±platinum/pemetrexed and underwent ctDNA assessment, 45 had detectable ctDNA alterations at baseline. The median change in AF at the first follow-up (at a median of 21 days after treatment initiation) was −90.1% (range −100% to +65%) among patients who subsequently had a radiologic response (n=18), –19.9% (range: −100% to +1884%) among stable disease cases (n=15), and +28.8% (range: −100% to +410%) among progressive disease cases (n=12); p=0.003. In addition, there was a significant correlation between the percent change in ctDNA at the first follow-up and the percent change in tumor target lesions from baseline (R=0.66, p<0.001). AF decrease between the pretreatment and first on-treatment blood draw was associated with significantly higher response rate (60.7% vs 5.8%, p=0.0003), and significantly longer median progression-free survival (8.3 vs 3.4 months, HR: 0.29 (95% CI: 0.14 to 0.60), p=0.0007) and median overall survival (26.2 vs 13.2 months, HR: 0.34 (95% CI: 0.15 to 0.75), p=0.008) compared with cases with an AF increase.
Conclusion In patients with advanced NSCLC, rapid decreases in ctDNA prior to radiological assessment correlated with clinical benefit. These results suggest a potential role for ctDNA as an early pharmacodynamic biomarker of response or resistance to immunotherapies.
- immunotherapy
- lung neoplasms
- biomarkers
- tumor
This is an open access article distributed in accordance with the Creative Commons Attribution Non Commercial (CC BY-NC 4.0) license, which permits others to distribute, remix, adapt, build upon this work non-commercially, and license their derivative works on different terms, provided the original work is properly cited, appropriate credit is given, any changes made indicated, and the use is non-commercial. See http://creativecommons.org/licenses/by-nc/4.0/.
Statistics from Altmetric.com
Introduction
Immune checkpoint inhibitors (ICI) that target programmed cell death-1/programmed cell death ligand-1 (PD-1/PD-L1) have recently emerged as an integral component of front-line treatment in metastatic non-small cell lung cancer (NSCLC) patients.1–3 The PD-1 inhibitor pembrolizumab is approved as monotherapy for advanced NSCLC with a PD-L1 tumor proportion score (TPS) of ≥1% and in combination with platinum doublet chemotherapy regardless of PD-L1 expression level.1–3 However, responses to either regimen occur in only a minority of cases, and PD-L1 TPS is limited as a biomarker in predicting whether a cancer will respond to PD-1 inhibition alone or would be more likely to benefit from PD-1 inhibition plus chemotherapy. Additional biomarkers of immunotherapy efficacy, such as tumor mutational burden (TMB), have not been incorporated into routine clinical practice for treatment selection.4 5
The timely identification of patients who are or are not responding to immunotherapies is critical for guiding subsequent treatment decisions. A rapid assessment of therapeutic efficacy prior to radiographic assessment could enable early modifications to a treatment regimen, such as a switch or intensification of therapy. Early indicators of response could theoretically prevent patients from staying on an ineffective therapy where they might experience complications due to disease progression or develop toxicities from unnecessary exposure to an inactive agent.
Liquid biopsies are a non-invasive method to detect tumor-related mutations in the plasma of patients with cancer. In NSCLC, plasma genotyping of circulating tumor DNA (ctDNA) is currently used in clinical practice for detecting targetable genomic alterations in genes such as the epidermal growth factor receptor (EGFR) or anaplastic lymphoma kinase (ALK).6 7 In addition, clearance of ctDNA after treatment initiation, as in the case of EGFR-mutant NSCLC is associated with improved clinical outcomes to EGFR tyrosine kinase inhibitors, while an increase in ctDNA can predict disease progression weeks ahead of imaging modalities.8 ctDNA dynamics have been explored also as potential biomarker of response to ICIs. Previous studies have shown that patients with melanoma with no detectable levels of ctDNA prior or during treatment with ICI have better response to immunotherapy.9 10 In NSCLC, patients with undetectable ctDNA at any point post-treatment with ICI had improved survival compared with patients with detectable ctDNA,11 and patients whose ctDNA levels decreased by ≥50% exhibited longer benefit compared with those whose ctDNA decreased by <50%.11 12
Although these studies have provided rationale for the use of early ctDNA change as an additional and potentially earlier assessment of response to immunotherapy in NSCLC, these data have been produced in heterogenous patient populations who received ICI primarily as a second-line or subsequent-line therapy, or prior to the approval of immunotherapy±chemotherapy in the first-line setting.11 12 Therefore, whether early ctDNA dynamics could also predict response to first-line pembrolizumab±platinum doublet in patients with treatment naïve NSCLC has remained unknown.
In this study, we hypothesized that rapid changes in plasma ctDNA measured by next-generation sequencing (NGS) after the initiation of immunotherapy would enable early detection of response and resistance to immunotherapy in treatment naïve NSCLCs prior to radiological assessment.
Materials and methods
Study population
Patients with advanced NSCLC who received first-line treatment with pembrolizumab alone or in combination with platinum doublet chemotherapy at the Dana-Farber Cancer Institute, and had consented to a correlative research study (DF/HCC protocol #02-180), were enrolled in this study.
Plasma sample collection and preparation
Blood samples were collected from each patient on the first day of treatment (prior to the start of therapy), and at each subsequent cycle before therapy administration. Blood samples were transferred to Ethylenediaminetetraacetic acid (EDTA)-coated tubes and processed to plasma by centrifugation. After plasma extraction, 2 mL of plasma were stored at −80°C according to validated specifications and shipped to the Inivata Clinical Laboratory Improvement Amendments (CLIA)-certified/College of American Pathologists (CAP)-accredited laboratory (Research Triangle Park, NC) for InVisionFirst ctDNA analysis.
Plasma targeted next-generation sequencing
Amplicon-based plasma NGS was performed using the InVision First-Lung platform (Inivata, Morrisville, NC),13 which sequences 36 cancer-related genes using gene-specific primers for hotspots and entire coding regions of interest. NGS libraries were prepared from 2000 to 16,000 amplifiable copies of the genome using a two-step PCR amplification process incorporating replicate and patient-specific barcodes and Illumina sequencing adaptors. Libraries were sequenced on the Illumina NextSeq 500. Sequencing files were analyzed using Inivata’s internal bioinformatic pipelines to identify Single-Nucleotide Variants (SNVs), Copy Number Alterations (CNAs), indels, and gene fusion events.13 If more than one somatic mutation was identified in a baseline sample, the mutation with the highest allelic fraction (AF) was used to track ctDNA levels over time relative to baseline. To enable relative change calculations between timepoints, if a variant was undetectable, the variant allele fraction percentage (VAF%) was set to the assay’s lowest detection limit of 0.02%.
Tumor mutational burden assessment and PD-L1 assessment
TMB, defined as the number of somatic, coding, base substitution and indel mutations per megabase (Mb) of genome examined was calculated from the DFCI OncoPanel NGS platform, as previously described.14 PD-L1 expression on tissue was assessed by immunohistochemistry using an anti-PD-L1 rabbit monoclonal antibody (clone E1L3N, Cell Signaling Technology).15
Clinical outcomes
Objective response rate (ORR) and progression-free survival (PFS) were determined using Response Evaluation Criteria In Solid Tumors (RECIST) version 1.1 by a dedicated thoracic radiologist. PFS was defined as the time from the start of immunotherapy to the date of disease progression or death, whichever occurred first. Patients who were alive without disease progression were censored on the date of their last adequate disease assessment. Overall survival (OS) was defined as the time from the start of immunotherapy to death. Patients who were still alive were censored at the date of last contact.
Statistical analysis
Categorical and continuous variables were summarized descriptively using percentages and medians. The Wilcoxon-Rank Sum test and Kruskal-Wallis test were used to examine differences between continuous variables, and Fisher’s exact test was used to compare associations between categorical variables. Agreement between radiographic response and ctDNA decrease was assessed with Cohen’s kappa coefficient. Kaplan-Meier methodology was used to estimate event-time distributions, and the Greenwood formula was used to estimate the standard errors of the estimates. Log-rank tests were used to test for differences in event-time distributions, and Cox proportional hazards models were fitted to obtain estimates of HRs in univariate and multivariable models. All P values are two-sided and CIs are at the 95% level, with statistical significance defined as p<0.05. All statistical analyses were performed using R V.3.6.3.
Results
Patient characteristics
Clinicopathologic and genomic characteristics of the 62 patients with advanced NSCLC who received immunotherapy between March 2015 and January 2020 are shown in online supplemental table 1. The median age of patients was 61.5 (range: 39–89), 85.5% were current or former smokers, and 88.7% had an Eastern Cooperative Oncology Group performance status (ECOG PS) of 0–1. An activating KRAS mutation was identified by tissue NGS in 21 (35.0%) cases and an EGFR mutation in 4 (6.6%) cases. The median TMB was 9.8 mutations/megabase (mut/Mb) (range: 1.5–41.8). Among the 56 cases (90.3%), which underwent PD-L1 assessment, 13 (23.2%) had a PD-L1 TPS of <1%, 10 (17.8%) had a PD-L1 TPS of 1%–49%, and 33 (58.9%) had a PD-L1 TPS of ≥50%. First-line therapy consisted of pembrolizumab monotherapy in 50.0% of cases, and pembrolizumab plus platinum-based chemotherapy in the remaining 50.0% of cases. Of the four patients with EGFR mutation, two had an EGFR exon 20 insertion and received pembrolizumab monotherapy, while the remaining two had an EGFR L858R mutation and an exon 19 deletion, and started pembrolizumab monotherapy and pembrolizumab plus chemotherapy, respectively, before the results of EGFR sequencing were available. Two patients were found to have ALK and ROS1 rearrangement after the start immunotherapy, as there was insufficient tissue to perform tumor sequencing at baseline.
Supplemental material
Mutations detection in ctDNA
Among 62 patients who received first-line pembrolizumab±platinum/pemetrexed and underwent ctDNA sequencing, 17 (27.4%) had no detectable plasma alterations at baseline, and 45 (72.6%) had at least one alteration detected (range: 1–4 alterations), as shown in figure 1. A total of 81 plasma ctDNA mutations were detected in the 45 patients at baseline (online supplemental table 2). The most commonly detected mutations at baseline involved TP53 (35/81, 43.2%), KRAS (19/81, 23.4%), and BRAF (5/81, 6.2%), as shown in online supplemental figure 1. The concordance between plasma and tissue NGS is shown in online supplemental figure 2.
Supplemental material
Supplemental material
Supplemental material

Study flow chart. ctDNA, circulating tumor DNA.
Early ctDNA change precedes radiographic response and correlates with clinical outcomes to immunotherapy
We evaluated whether early changes in plasma ctDNA levels correlated with radiographical response to first-line therapy. In cases where more than one somatic mutation was identified in a baseline sample, the mutation with the highest AF was used to track ctDNA levels over time compared with baseline. Of the subset of 45 patients with detectable baseline ctDNA mutations, first-line treatment consisted of pembrolizumab monotherapy in 24 (53.3%) cases, and pembrolizumab plus platinum/pemetrexed in 21 (46.6%) cases. The median time to the first follow-up ctDNA assessment was 21 days (IQR: 19–24) from the start of first-line therapy. There was moderate agreement between ctDNA decrease at the first follow-up blood sampling and radiographic best objective response (BOR) by RECIST V.1.1 using the Cohen’s kappa statistic (κ=0.50; 95% CI: 0.26 to 0.71; p<0.001, figure 2A). In addition, there was a significant correlation between the percent change in ctDNA at the first follow-up and the BOR (R=0.66, p<0.001, figure 2B).

(A) Agreement between ctDNA decrease at the first follow-up blood sampling and radiographic best objective response (BOR) to immunotherapy. The waterfall plot shows the percent change in target lesions from baseline. Red bars indicate cases where there was a ctDNA decrease, while blue bars indicate cases with a ctDNA increase. (B) Linear correlation between BOR by RECIST V.1.1 and percent of change in ctDNA at the first follow-up blood sampling. Y-axis is truncated at 100%. Two patients (not shown) with ctDNA increase had non-measurable disease and experienced disease progression as best response to treatment. ctDNA, circulating tumor DNA; RECIST, Response Evaluation Criteria In Solid Tumors.
The median AF percent change between the pretreatment sample and the first follow-up sample was significantly different among patients who achieved either a partial or complete response (PR/CR) versus stable disease (SD) versus primary progressive disease (PD) (−90.1% vs −19.9% vs +28.8%, p=0.003, figure 3A). The deepest median AF change, defined as the largest percent decrease in plasma AF between baseline and any future time point, also correlated significantly with BOR (−99.9% PR/CR vs −53.8% SD vs +19.6% PD, p=0.0003, online supplemental figure 3A). Importantly, two patients (DFCI23 and DFCI5) with radiological evidence of PR and SD, respectively, experienced an AF decrease at the second follow-up (day 42 for both), after an initial transient increase in AF (online supplemental figure 4). Among the 17 cases with no detected ctDNA at baseline, 5 patients had an emergence of ctDNA within 8 weeks of treatment initiation: two with PD, two with a PR (ctDNA emerged at day 63 and 84), and one with SD (ctDNA emerged at day 21) as the BOR. The patient with initial radiological SD instead experienced a disease progression few weeks after ctDNA emerged. In the other 12 cases, ctDNA remained undetected. Among these, four patients had a PR, five patients had SD, and three patients had PD as best response to treatment.
Supplemental material
Supplemental material
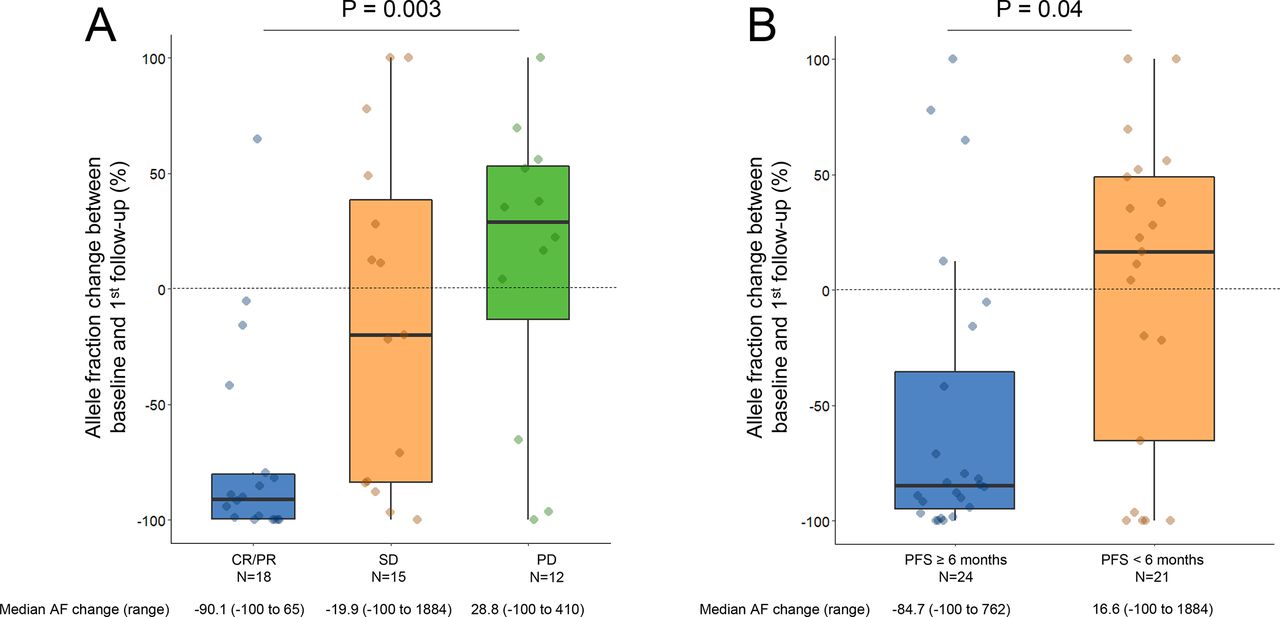
(A) Plasma ctDNA change at the first follow-up blood sampling according to the response to pembrolizumab±chemotherapy. (B) Plasma ctDNA change at the first follow-up according to whether the progression-free survival (PFS) was ≥6 months or <6 months to pembrolizumab±chemotherapy. Y-axis is truncated at 100%. AF, allele fraction; ctDNA, circulating tumor DNA.
Of note, while no cases of pseudoprogression were observed among cases with detectable ctDNA at baseline, we did observe one case of pseudoprogression among those without detectable baseline ctDNA. In this case, two somatic variants (STK11 E199* and CTNNB1 G24E), which were also identified by tumor tissue NGS, became detectable in ctDNA at the first follow-up (day 21), and predated a radiologic progression in multiple left lung nodules (day 61). However, ctDNA later became undetectable at the subsequent follow-up, and there was a subsequent decrease in the lung lesions observed at the CT scan performed at day 83, indicating pseudoprogression.
We next examined whether the early change in AF correlated with a long-term benefit from immunotherapy, which was defined as a PFS of ≥6 months from the start of treatment, and found moderate agreement between ctDNA decrease and radiographic control of disease lasting a minimum of 6 months (κ=0.46; 95% CI: 0.19 to 0.71; p<0.01). Cases with a PFS of ≥6 months, compared with those with a PFS of <6 months, had a significantly lower median AF change between baseline and first follow-up sample (−84.7% versus +16.6%, p=0.04, figure 3B). Additionally, the deepest median AF change was significantly different in cases with a PFS of ≥6 months, compared with those with a PFS of <6 months (−98.6% versus +4.4%, p=0.005, online supplemental figure 3B). Detailed kinetics of AF change over time in patients with CR/PR, SD, and PD are shown in figure 4, as well as in patients with a PFS ≥6 months versus <6 months (online supplemental figure 5). Of note, three patients with PD as their best response to treatment had a decrease in ctDNA at the first follow-up (figure 4). In one case, the AF variant (HER2 D769H) decreased from 0.09% to undetectable at day 21. While the InVision First-Lung platform has a 99.48% sensitivity for single nucleotide variants present at a VAF range of 0.25%–0.33%,13 for AF as low as 0.06%–0.09%, only 50% of SNVs are usually detected. Therefore, a sensitivity issue might explain the discordance in this case. In the second case, the patient had an initial decrease (−65% at day 21) in the AF (KRAS G12D) followed by rapid increase (+230% at day 42) which was detected 5 days after evidence of radiologic progression (at day 37). In the third case, although there was a decrease (from 3.7% to undetectable) in the AF variant (KRAS A146V) at the first follow-up (day 22), two additional somatic variants that were not found at baseline were detected (TP53 R273H and MAP2K1 K48K) simultaneously with radiologic progression (day 22). Although ctNDA dynamics and radiographic response were discordant, it should be highlighted that the changes in ctDNA observed in the latter two cases reflected their clinical course, which was characterized by the lack of response to immunotherapy.
Supplemental material
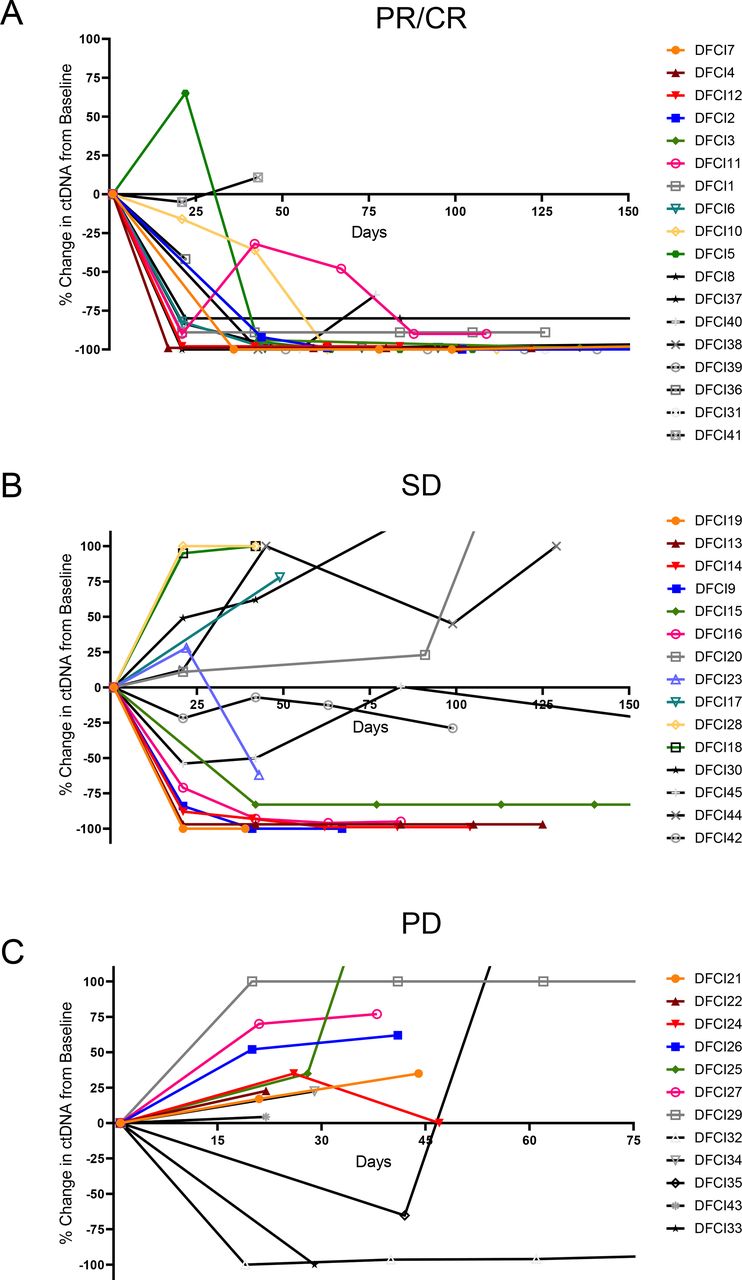
ctDNA change over time in patients with (A) partial or complete response (PR/CR), (B) stable disease (SD), and (C) progressive disease (PD) to immunotherapy±chemotherapy by RECIST V.1.1. ctDNA, circulating tumor DNA; RECIST, Response Evaluation Criteria In Solid Tumors.
In seven cases, we also noted the emergence in new mutations, which were not identified at baseline, over time. This emergence in ctDNA occurred at the first follow-up in three patients who experienced PD as their best response to treatment. In the remaining four cases, additional mutations were identified at the moment of or prior to the radiologic disease progression in three patients who initially responded to immunotherapy, and in one patient who had a SD as best response to treatment.
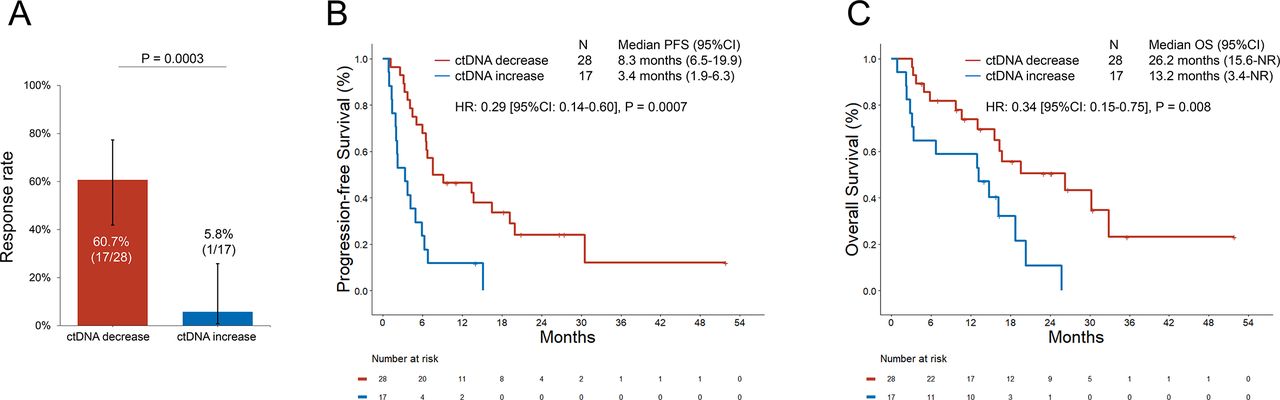
We next compared the ORR, PFS, and OS to pembrolizumab±platinum/pemetrexed in patients who had a decrease versus an increase in plasma AF at the first-follow-up. The baseline clinicopathologic characteristics of patients with ctDNA increase versus decrease at the first follow-up were well balanced (table 1). The ORR among patients with a decrease in plasma AF was 60.7% (95% CI: 41.9 to 77.3), which was significantly higher than the ORR of 5.8% (95% CI: 0.3 to 25.7) in patients with plasma AF increase (p=0.0003, figure 5A). ctDNA decrease preceded radiologic response in 88.8% (16/18) of cases, while in 11.1% (2/18) of cases, ctDNA and radiologic response were concomitant (online supplemental figure 6). The median PFS was significantly longer among patients with a plasma AF decrease at the first blood draw versus increase (8.3 vs 3.4 months, HR: 0.29 (95% CI: 0.14 to 0.60), p=0.0007, figure 5B). The median OS was significantly longer among patients with a plasma AF decrease at the first blood draw compared with increase (26.2 vs 13.2 months, HR: 0.34 (95% CI: 0.15 to 0.75), p=0.008, figure 5C). After adjusting for PD-L1 expression, performance status, age, sex, treatment received, and smoking status, a plasma AF decrease at the first blood draw retained a significant association with improved ORR (OR: 2.82 (95% CI: 1.8 to 5.3), p=0.01), PFS (HR: 0.28 (95% CI: 0.10 to 0.81), p=0.02), and OS (HR: 0.44 (95% CI: 0.31 to 0.64), p<0.0001) in multivariable analysis (online supplemental table 3). Because ctDNA clearance has been previously reported to correlate with improved outcomes in NSCLCs across treatment regimens,16 17 we also explored whether ctDNA clearance, compared with just a decrease in ctDNA, was associated with improved PFS and OS in our immunotherapy-treated cohort. We did not observe any difference in clinical outcomes between these groups (online supplemental figure 7A,B); however, these results should be interpreted with caution due to the small sample size of the two cohorts.
Supplemental material
Supplemental material
Supplemental material
(A) Overall response rate to pembrolizumab±chemotherapy in patients with decrease versus increase in plasma ctDNA at the first follow-up. (B) Progression-free survival (PFS) and (C) overall survival (OS) to pembrolizumab±chemotherapy in patients with decrease versus increase in plasma ctDNA at the first follow-up blood sampling. ctDNA, circulating tumor DNA.
Patient characteristics
As pembrolizumab monotherapy represents a first-line treatment option for patients with NSCLC and a PD-L1 expression level of ≥50%, we also investigated the impact of AF change in this specific clinical context. Among the 24 patients with a PD-L1 expression level of 50% or greater, the ORR to pembrolizumab among cases with an AF decrease was 50.0% (95% CI: 23.3 to 76.6), which was higher compared with the ORR of 8.3% (95% CI: 0.4 to 34.7) of cases with an AF increase (p=0.06, online supplemental figure 8A). The median progression-free survival (mPFS) was significantly longer among patients with an AF decrease versus increase (7.6 vs 3.5 months, HR: 0.35 (95% CI: 0.13 to 0.92), p=0.03, online supplemental figure 8B). The median overall survival (mOS) was also significantly longer among patients with a ctDNA decrease versus increase (26.2 vs 14.8 months, HR: 0.30 (95% CI: 0.10 to 0.99), p=0.048, online supplemental figure 8C). When we analyzed the clinical outcomes among the 21 patients who received pembrolizumab in combination with chemotherapy, we found that patients with ctDNA decrease at the first follow-up had a significantly higher ORR (68.7% (95% CI: 43.7 to 87.5) versus 0% p=0.01, online supplemental figure 8D), longer mPFS (11.2 vs 2.1 months, HR: 0.15 (95% CI: 0.04 to 0.54), p=0.004. online supplemental figure 8E), and longer mOS (16.8 vs 3.2 months, HR: 0.29 (95% CI: 0.10 to 0.89), p=0.03, online supplemental figure 8F), compared with those with a ctDNA increase. Importantly, these two treatment groups had similar median ctDNA change (−8% vs −79%, p=0.15) and ctDNA decrease rate at the first follow-up (50% vs 76.1%, p=0.13).
Supplemental material
Because radiologic SD following immunotherapy is common in NSCLC, and can also reflect either a slowly growing or shrinking cancer, we finally examined whether early changes in ctDNA in patients with radiographic SD could distinguish these clinical scenarios. Among the 15 patients with radiologic SD, 53.3% (8/15) had a decrease in ctDNA at the first follow-up, while the remaining 46.7% (7/15) had an increase in ctDNA. Importantly, early ctDNA decrease occurred in 62.5% (5/8) of patients with radiologically SD who subsequently achieved a PFS ≥6 months, and only in 42.8% (3/7) of patients who experienced a PFS of <6 months (online supplemental figure 9). Although the small sample size of these subgroups does not enable the conclusion that ctDNA change can predict the duration of immunotherapy benefit among patients with SD as their BOR, these data suggest that radiologic assessment may not fully capture the degree of benefit from immunotherapy. In some cases, early ctDNA kinetics have the potential to more accurately identify patients who will achieve durable cancer control with immunotherapy. Additional studies in this specific patient population are warranted to validate these findings.
Supplemental material
Discussion
Assessment of ctDNA has had increasing clinical utility in determining certain actionable genetic alterations in NSCLC to guide selection of targeted therapies with kinase inhibitors.6 More recently, ctDNA detection following resection of early stage lung cancer has also been shown to detect molecular residual disease earlier than standard-of-care radiologic imaging in patients with localized lung cancer.18 19 However, it is still unclear whether ctDNA can be used to predict and monitor response and resistance to ICI in NSCLC.
Prior studies have explored the use of ctDNA assessment as a quantitative marker of response to ICI in patients with melanoma.9 10 20 Most of these studies, however, focused on tracking driver mutations using other technologies, including digital PCR or allele-specific PCR.9 10 20 In NSCLC, a recent retrospective study of 86 patients with NSCLC treated with PD-1 inhibitors has shown that changes in ctDNA as assessed by plasma targeted sequencing can predict response to PD-1 inhibition, and can potentially identify specific alterations known to correlate with response and resistance to immunotherapy.12 However, this study included patients who received PD-1 inhibition as second or subsequent line of therapy. Similarly, another study showed that patients with NSCLC who achieve a ctDNA decrease of ≥50% by plasma NGS after immunotherapy initiation are more likely to have a longer duration of treatment benefit, and superior PFS and OS compared with those without ctDNA drop of ≥50%.11 However, this study enrolled a heterogenous group of patients treated with different immunotherapy regimens across multiple lines of therapy, when at the time of the study, the standard of care for treatment-naïve NSCLC lacking actionable mutations did not include chemotherapy in combination with ICIs.
Our study expands on previous findings by examining early ctDNA changes specifically in patients who received first-line pembrolizumab-based therapies. Typically, patients with PD-L1 levels≥50% receive pembrolizumab monotherapy while those with low or absent PD-L1 expression are treated with a combination of a PD-(L)1 inhibitor plus platinum doublet chemotherapy. However, because there has not been direct comparison of pembrolizumab with or without chemotherapy in patients with a PD-L1 level of either ≥1% or≥50%, there is a growing uncertainty about which regimen is optimal for these populations. Our study suggests that early plasma ctDNA change may easily identify patients who are responding to or progressing on immunotherapy alone prior to radiological assessment, and inform on how to implement alternative therapeutic approaches in a timely fashion. In addition, as the response to ICIs can be delayed over time,19 21 22 initial radiographic assessment may not necessarily capture the activity of ICIs. Instead, early ctDNA kinetics may allow more accurate characterization of clinical benefit compared with initial radiographic imaging. In our study, early ctDNA decrease occurred in more frequently among patients with radiologically SD who subsequently achieved a PFS ≥6 months, compared with patients who experienced a PFS of <6 months, suggesting that early ctDNA assessment might help discriminate which patients are experiencing a true benefit from ICIs, in cases where imaging is more ambiguous. Importantly, ctDNA change may also help differentiate pseudoprogression from true progression, which represent a challenge for clinicians. In a retrospective analysis of 29 patients with advanced melanoma treated with PD-1 inhibition, undetectable ctDNA at baseline or detectable ctDNA at baseline followed by >10 fold decrease was more commonly associated with pseudoprogression.23 However, because these findings are based on small retrospective cohort, and pseudoprogression is a rare phenomenon,24 these data should be interpreted with caution. In our cohort, we identified only one case of pseudoprogression among patients without detectable baseline ctDNA, and in this case, there was a transient ctDNA increased along with an increase of tumor volume, which was followed by a clearance in ctDNA and decrease in subsequent decrease in tumor volume, highlighting the challenges in interpreting ctDNA increase in such cases.
In addition to anticipating the response to ICIs, an early identification of non-responders to immunotherapies through ctDNA assessment could also inform clinical practice as well as clinical trials, by reducing the cost associated with therapies that are not effective and unnecessary adverse events. To this end, an investigator-initiated trial is currently evaluating if the detection of early response through ctDNA assessment in patients with NSCLC treated with pembrolizumab can prospectively guide continued treatment with pembrolizumab versus intensification of treatment to pembrolizumab in combination with chemotherapy (NCT04166487).
Limitations of this study include the retrospective design, the lack of an independent validation cohort, and the small sample size. Another important limitation is that the success of the liquid biopsy depends on the tumor shedding quantifiable ctDNA, which even in cases of metastatic disease is not universal. However, the assay used in this study is highly sensitive (99.48% sensitivity for single nucleotide variants present at a VAF range of 0.25%–0.33%).13 Because ctDNA has a short half-life, estimated to be around 1 hour,25 26 and the amount of DNA shed from tumor cells is not predictable, a high sensitivity is crucial to identify early changes in ctDNA and guide subsequent treatment decision. Although our panel included targeted regions from 36 genes, larger panels with broader coverage may have enabled the detection of baseline ctDNA in a higher proportion of patients. Finally, because we did not perform paired peripheral blood mononuclear cell NGS, false positive mutations potentially arising from clonal hematopoietic cells cannot be excluded, particularly for cases without paired tumor NGS.
In conclusion, in this study we demonstrate an amplicon-based plasma NGS platform can detect early quantitative changes across a wide range of variants in samples from patients with advanced NSCLC treated with first-line immunotherapy, and that rapid decreases of ctDNA in advance of radiological and clinical assessment correlated with clinical benefit, while increasing or newly detectable ctDNA was a harbinger of PD. These results suggest a potential role for longitudinal plasma ctDNA NGS analysis as a new efficacy metric to rapidly assess response or resistance to immunotherapies.
References
Supplementary materials
Supplementary Data
This web only file has been produced by the BMJ Publishing Group from an electronic file supplied by the author(s) and has not been edited for content.
Footnotes
Twitter @alessi_joao, @DrMarkAwad
Presented at This work was presented as poster discussion at the 2020 American Society for Clinical Oncology (ASCO) annual meeting.
Contributors MA, BR, MC, and GJ were involved in conceptualizing the study, manuscript writing, data collection and analysis, and oversight of the study. MS, CL, ML, JA, GR, BR, GJ, and TF were involved in specimen collection and sequencing. MN was involved in radiographic assessments. All authors were involved in data interpretation, read, and approved the final manuscript.
Funding The authors have not declared a specific grant for this research from any funding agency in the public, commercial or not-for-profit sectors.
Competing interests GJ and TF: current employee and shareholder of Inivata. MN: consultant: Toshiba Medical Systems, WorldCare Clinical, Daiichi Sankyo; Research grant: Merck, Canon Medical Systems, AstraZeneca; Honorarium: Bayer and Roche. MC: consultant/advisory board for AstraZeneca, Inivata. Honoraria: The Lynx Group (supported by Bristol-Myers Squibb), PCME (supported by Lilly and Merck), WebMD (supported by AstraZeneca). Travel/accommodation funding: Allergan, Sanofi-Aventis, Daiichi Sankyo, Natera, AstraZeneca. MA: consultant/advisory board for BMS, AstraZeneca, Achilles, AbbVie, Neon, Maverick, Nektar, Hegrui, Syndax, Gritstone Research funding from BMS, AstraZeneca, Lilly, Genentech.
Patient consent for publication Not required.
Ethics approval This study was performed in accordance with the Declaration of Helsinki of the World Medical Association and appropriate consent for reporting patient data presented in this manuscript was obtained at the Dana-Farber Cancer Institute under an institutional review board-approved protocol (DF/HCC protocol #02-180).
Provenance and peer review Not commissioned; externally peer reviewed.
Data availability statement Data are available upon reasonable request. Deidentified participant data are available upon reasonable request to the corresponding author.
Supplemental material This content has been supplied by the author(s). It has not been vetted by BMJ Publishing Group Limited (BMJ) and may not have been peer-reviewed. Any opinions or recommendations discussed are solely those of the author(s) and are not endorsed by BMJ. BMJ disclaims all liability and responsibility arising from any reliance placed on the content. Where the content includes any translated material, BMJ does not warrant the accuracy and reliability of the translations (including but not limited to local regulations, clinical guidelines, terminology, drug names and drug dosages), and is not responsible for any error and/or omissions arising from translation and adaptation or otherwise.