Article Text

Abstract
Background Hydrolysis of extracellular ATP to adenosine (eADO) is an important immune checkpoint in cancer immunology. We here investigated the impact of the eADO pathway in high-grade serous ovarian cancer (HGSC) using multiparametric platforms.
Methods We performed a transcriptomic meta-analysis of eADO-producing CD39 and CD73, an eADO signaling gene signature, immune gene signatures and clinical outcomes in approximately 1200 patients with HGSC. Protein expression, localization and prognostic impact of CD39, CD73 and CD8 were then performed on approximately 1000 cases on tissue microarray, and tumor-infiltrating lymphocytes (TILs) were analyzed by flow cytometry and single-cell RNA sequencing on a subset of patients.
Results Concomitant CD39 and CD73 gene expression, as well as high levels of an eADO gene signature, were associated with worse prognosis in patients with HGSC, notably in the immunoregulatory molecular subtype, characterized by an immune-active microenvironment. CD39 was further associated with primary chemorefractory and chemoresistant human HGSC and platinum-based chemotherapy of murine HGSC was significantly more effective in CD39-deficient mice. At protein level, CD39 and CD73 were predominantly expressed by cancer-associated fibroblasts, and CD39 was expressed on severely exhausted, clonally expanded and putative tissue-resident memory TILs.
Conclusions Our study revealed the clinical, immunological, subtype-specific impacts of eADO signaling in HGSC, unveiled the chemoprotective effect of CD39 and supports the evaluation of eADO-targeting agents in patients with ovarian cancer.
- adenosine
- immune evation
This is an open access article distributed in accordance with the Creative Commons Attribution Non Commercial (CC BY-NC 4.0) license, which permits others to distribute, remix, adapt, build upon this work non-commercially, and license their derivative works on different terms, provided the original work is properly cited, appropriate credit is given, any changes made indicated, and the use is non-commercial. See http://creativecommons.org/licenses/by-nc/4.0/.
Statistics from Altmetric.com
Introduction
Increased lymphocytic infiltration in high-grade serous ovarian cancer (HGSC) is associated with improved overall survival (OS), supporting the rationale to develop immunotherapeutic strategies.1–3 However, immune checkpoint inhibitors targeting programmed cell death protein 1 (PD-1) or programmed death-ligand 1 (PD-L1) have yet to show meaningful clinical impact in HGSC as single agents, with overall response rates ranging from 8% to 15%.4 Reported synergistic activities with chemotherapy, poly(ADP‐ribose) polymerase inhibitors,5 antiangiogenic agents, radiation therapy and other immunotherapies6 raise new hopes for combinatorial approaches.
Among emerging cancer immunotherapies are inhibitors of extracellular adenosine (eADO) signaling, a pathway mainly regulated by the ectonucleotidases CD39 and CD73 and the G protein-coupled receptors A2A and A2B.7 CD39 hydrolyses extracellular ATP into AMP, while CD73 hydrolyses extracellular AMP into eADO. Targeted blockade of CD39, CD73, A2A and/or A2B receptors enhances anti-tumor immunity in preclinical cancer models.7 8 Whether targeting eADO signaling represents a therapeutic avenue for HGSC still remains to be determined.
Previous studies, including from our group, reported that CD73 gene and protein expression in HGSC are significantly associated with worse overall and progression-free survival.9 In the ID8 mouse model of ovarian cancer, inhibition of CD73 or A2A receptor enhanced antitumor immunity and suppressed tumor growth.10 11 CD73 has also been associated with ovarian cancer stemness12 and platinum resistance.13 The clinical and biological impact of CD39 in ovarian cancer, on the other hand, is largely uncharacterized. CD39 has been found expressed by ovarian tumor-associated macrophages,14 15 T regulatory cells (Tregs)16 and terminally exhausted CD8+ tumor-infiltrating lymphocytes (TILs). Notably, CD39 expression on TILs has been associated with tumor antigen reactivity.17
We here performed gene expression meta-analysis of the eADO pathway, protein expression analysis of CD39 and CD73 and flow cytometry analysis and single-cell RNA sequencing (scRNAseq) of ovarian TILs to investigate the clinical impact of eADO in HGSC.
Methods
Patients and gene expression analysis
Datasets were processed from the curated MetaGxOvarian R package.18 Analysis was restricted to datasets featuring microarray-based whole-transcriptome studies of at least 40 patients with high-grade, primary tumors of ovarian serous histology and OS data. This resulted in nine studies providing data for 1161 patients with long-term follow-up. For each dataset, each gene was scaled using the genefu R package.19 Molecular classification was assigned for each dataset separately using the ConsensusOV R package.20 The cytotoxic (CYT),21 ADO signature22 and interferon (IFN) signature23 have been described. The chemoresistant HGSC dataset24 is hosted by the International Cancer Genome Consortium under the accession code: OV-AU. It contains raw counts from RNA-sequencing of 93 HGSC patients with linked patient’s clinical and survival information. Raw counts expression data were normalized by computing log2 transcript per million method.
Patients and immunofluorescence analysis
Co-immunofluorescence (IF) was performed in a previously described cohort of 200 HGSC on tissue microarray (TMA)9 and in a previously described cohort of 1000 HGSC (from the Canadian Ovarian Experimental Unified Resource)25 on TMA (online supplemental table S1). Only cases that did not receive neoadjuvant chemotherapy were included for analyses. Slides were deparaffinized, rehydrated, demasked using a citrate buffer and incubated for 30 min with a protein blocking solution. Primary antibodies were co-incubated on the slides overnight at 4°C and secondary antibodies were incubated for 2 hours at room temperature (online supplemental table S2). Slides were then mounted with 4′,6-diamidino-2-phenylindole (DAPI). Sections were imaged at 20X magnification on VS-110 scanner (Olympus) and super images were imported into Visiomorph DP (Visiopharm). CK8-18 positivity was used to identify the epithelial area and where indicated α smooth muscle actin (SMA) positivity was used to identify the activated stromal area. Cores with epithelial or stromal areas representing less than 5% of the total tissue area were eliminated from survival analyses. Recommendations for Tumor Marker Prognostic Studies criteria were followed.26
Supplemental material
Patients and TIL analysis
Fresh tissue was collected from five newly diagnosed treatment-naive patients undergoing primary cytoreductive surgery for high-grade epithelial ovarian cancer at Montreal University Hospital Center (CHUM), and processed to a single-cell suspension using GentleMACS (MACS Miltenyi). Isolated CD45+ cells were cryopreserved in 90% fetal bovine serum (FBS) and 10% dimethyl sulfoxide (DMSO) until stained with fluorescent dyeconjugated antibodies for 30 min at 4°C (online supplemental table S2). Data were acquired on a BD Symphony instrument and analyzed using FlowJo software. DownSample plugin was used to obtain equal numbers of CD4 and CD8 cells for each patient. Events from downsamples were processed together allowing sample comparison. t-distributed stochastic neighbor embedding (tSNE) map distribution was run on CD3+CD4+ and CD3+CD8+ cells to reduce dimensionality of the data followed by FlowSOM for clustering. Resulting subpopulations were analyzed as described.
Single-cell RNA sequencing
CD45+ cells (as above) were analyzed using 10X Genomics Chromium technology. Cells were treated with 200 U/mL of Nuclease S7 and samples with viability greater than 80% were loaded for RNA barcoding in emulsion. For gene expression library, 50 ng of cDNA was fragmented, end-repaired, adaptor inserted and cleaned with SPRIselect 0.8X. Sample index was inserted, fragments selected and DNA quantified by BioAnalyzer. For T cell receptor (TCR) libraries, 2 µL of cDNA was used for amplification of TCR region in two rounds of PCR. After target enrichment, fragment selection was performed and product quantified. A 50 ng of PCR product was fragmented, end-repaired, adaptor inserted and cleaned. Sample index was inserted, cleaned and quantified. Libraries were sequenced on Illumina NovaSeq 6000 (Sainte-Justine Hospital, Montreal, Canada) with minimum sequencing depth of 50 000 read pairs per cell for gene expression library and 5000 reads per cell for TCR libraries.
scRNA-seq analysis
Libraries were processed using Cell Ranger (10X Genomics). From five patients, a total of 173 907 569 transcripts were obtained in 33 670 cells. From 18 658 recovered genes, an average of 1580 genes was detected per cell. Filtered contig annotation was used for T cell clonotype analysis. Analysis was performed on Seurat package.27 Cells with at least 200 features and features detected in at least three cells were included. Cell filtering comprised exclusion of dead cells and tumor cells. Following the Seurat pipeline, normalization was done by scTranform method, including regression of mitochondrial genes. For data visualization, first dimension reduction was executed using RunPCA and RunUMAP, following by clustering using FindNeighbors and FindClusters. Clusters were characterized by differentially expressed gene (DEG) analysis using the test model-based analysis of single-cell transcriptomics.28 The top genes identified, as well as known markers, were used to identify cell types. For TCR analysis, the pipeline of scRepertoire was used.29 TCR diversity was calculated by Shannon and Invert Simpson indexes.
Animal studies
All experiments were approved by the CHUM Institutional Animal Ethics Committee. Mouse HGS2 cells were obtained from Dr Frances Balkwill (Cancer Research UK) and were previously described.30 Syngeneic HGS2 cells (107 cells) were injected intraperitoneally (i.p.) in phosphate buffered saline (PBS) to WT and CD39-/- mice (obtained from S.C. Robson, Harvard Medical School) and treated with carboplatin (20 mg/kg i.p.) once per week on weeks 5, 6 and 7. Mice were euthanized when signs of distress were observed or when weight loss exceeded 20%. In an independent experiment, WT and CD39-/- mice were injected with 2×10⁶ HGS2 cells s.c. and single cell suspensions were analyzed by flow cytometry (BD LSRFortessa) at day 12 for expression of Thy1.2 (clone 53–2.1; BV786; BD), CD4 (clone RM4-5; BUV737; BD), Foxp3 (clone NRRF-30; PE; eBiosciences), CD8 (clone 53–6.7; BV650; BD) and viability (eBiosciences Fixable dye; eFluor506).
In vitro T cell activation assays
CD39-/- mice were crossed with OT-1 transgenic mice (Jackson Lab). CD39-/- mouse embryonic fibroblasts were transfected to express pCAGGS-mCD39 plasmid (using Nucleofector kit, Lonza) and sorted (on BD FACSAria) to >95% purity for CD39 expression. All experiments were approval by the CHUM Animal Ethics Committee. For T cell activation assays, 103 ovalbumin (OVA)-expressing ID8 cells per well were seeded with or without 103 syngeneic fibroblasts onto round-bottom non-tissue culture 96 well-plates in a solution of 2.4 mg/mL methyl cellulose diluted in DMEM-10% FBS. Spheroids were allowed to form for 24 hours. OVA-specific CD8 T cells were purified by immune-magnetic negative selection (Stem cell EasySepTM, 19853) from splenocytes of OT-1 WT and OT-1 CD39-/- mice. The 106 OT-1 cells per ml were stimulated for 72 hours with interleukin 2 (IL-2) (30 U/mL), IL-7 (0.5 ng/mL) and plate-bound anti-CD3 and anti-CD28 antibodies (5 µg/mL each). Activated OT-1 cells were added to the spheroids at an E/T ratio of 10:1. After 4 hours of coculture, protein transporter inhibitors (Thermofisher, 00-4980-03) were added to the mix. Supernatants were harvested and measured for IFN-γ by ELISA (R&D Systems, DY485-05) following manufacturer’s instructions.
Statistical analyses
Differential gene expression between two conditions was assessed by two-sided Wilcoxon Rank-Sum test and, when more than two conditions where compared, Kruskal-Wallis test was considered.
Spearman correlation was used to evaluate the association between individual genes and gene signatures. Optimal cut-points were computed for each variable using the surv_cutpoint function form the survminer R package. Statistical significance of the difference in survival was computed using the Cox proportional hazard model and the log-rank test p value reported on Kaplan-Meier survival curves.19 Gene ontology (GO) enrichment analysis was performed using the goana function from the limma R package.31
Protein expression was quantified as the mean fluorescence intensity (MFI). Batch effects were removed using COMBAT R package.32 Postcombat MFI data were log10 transformed prior to analysis. Mean expression of duplicate cores was used for analysis. Correlation between duplicates was significant (Spearman’s r>0.6; p<0.001). Cox proportional hazards (coxph) regression was used for univariable and multivariable models,19 adjusting for age (≤60 years vs >60 years), stage (I/II vs III/IV) and debulking (optimal vs suboptimal). Where indicated, protein expression was stratified into two groups based on CK8-18 or ⍺SMA expression. Optimal cut-points were computed for each variable using the surv_cutpoint function form the survminer R package. Statistical significance of the difference in survival was computed using the Cox proportional hazard model and the log-rank test p value reported on Kaplan-Meier survival curves. All statistical analyses were performed as two sided and, when needed, p values were adjusted for multi-testing using the Benjamini and Hochberg correction (false discovery rate) using the p.adjust function.
Results
Prognostic and immunological impacts of eADO signaling in HGSC
We performed a gene expression meta-analysis of eADO-producing CD39 and CD73, eADO receptor gene signature22 and immune gene signatures in 1,161 HGSC patients. CD73 gene expression was significantly associated with worse PFS and OS (online supplemental figure S1A) and its prognostic impact was restricted to tumors with concomitant high levels of CD39 (figure 1A). Consistent with the immunosuppressive effect of eADO, high levels of CD73 abrogated the good prognosis associated with high immune CYT signature (figure 1B), while CD39 expression had no impact (online supplemental figure S1B). An eADO gene signature (ADO_sig) was also associated with worse OS in patients with tumors with high levels of CD73 or CD39 (figure 1C,D). Interestingly, ADO_sig was positively correlated with immune CYT gene signature, IFN gene signature and T cell exhaustion genes (online supplemental figure S2A).

Prognostic impact of the eADO pathway in HGSC (n=1161 patients). (A) High CD73 (NT5E) expression was associated with worse overall survival in tumors with high CD39 (ENTPD1) expression. (B) Overall survival analysis of high and low immune cytotoxic (CYT) signature according to CD73 gene expression. (C, D) Overall survival analysis of high and low adenosine signature (ADO_sig) according to CD73 or (D) CD39 gene expression. eADO, extracellular adenosine; HGSC, high-grade serous ovarian cancer.
We next investigated whether the eADO pathway was associated with specific molecular subtypes of HGSC.20 Together, CD39, CD73 and ADO_sign were highest in the immunoregulatory (IMR) and mesenchymal (MES) subtypes, and lowest in the differentiated (DIF) and proliferative (PRO) subtypes (online supplemental figure S2B). CYT score was expectedly highest in the IMR subtype (online supplemental figure S2B). The prognostic impacts of CD73 and ADO_sig were also subtype-specific: they were associated with worse OS in the IMR and DIF subtypes, but associated with better OS in the MES and PRO subtypes (figure 2A).

eADO pathway according to molecular subtypes and response to chemotherapy. (A) Subtype-specific prognostic impact of CD73 (NT5E) and ADO_sig in a meta-analysis (n=1161 patients). HGSC molecular subtypes: differentiated (DIF), immunoregulatory (IMR), mesenchymal (MES) and proliferative (PRO). (B) CD39 (ENTPD1) and CD73 (NT5E) expression was evaluated in pretreatment primary refractory, resistant or sensitive HGSC (n=93 patients). (C) Same as B, overall survival analysis was performed. (D) WT and CD39-/- mice were injected i.p. with syngeneic HGS2 mouse ovarian cancer cells (107 cells) and treated with carboplatin (20 mg/kg i.p. Weekly on weeks 5, 6 and 7). Overall survival is shown (n=5/group; log RANK P shown). (E) Tumor-infiltrating CD8+ T cells (CD8) and Foxp3+CD4+ T cells (Tregs) of HGS2 tumors were analyzed by flow cytometry at day 12. The ratio of CD8/Tregs in individual tumors, means and SEs are shown (*p<0.05 by Student’s t-test). eADO, extracellular adenosine; HGSC, high-grade serous ovarian cancer; ns, not significant; Tregs, T regulatory cell.
Since CD39 has been associated with decreased immunogenic cell death triggered by chemotherapy,7 we evaluated whether pretreatment CD39 expression was associated with chemoresistance in patients with HGSC. In a characterized cohort of 93 HGSC with primary refractory, resistant or sensitive disease,24 we observed that pretreatment CD39 gene expression, but not CD73 expression, was significantly higher in primary refractory and resistant HGSC compared with chemosensitive HGSC (figure 2B), and was associated with worse OS (figure 2C). Interestingly, we observed a significant negative correlation between CD39, CD73 or ADO_sig and BCRA signature,24 but no correlation with mismatch repair, APOBEC or AGE signatures (online supplemental figure S3). Since our correlative data suggested a role for CD39 in promoting chemoresistance, we compared the therapeutic activity of carboplatin in a syngeneic mouse model of HGSC implanted into WT and CD39-deficient mice. As shown in figure 2D, chemotherapy with carboplatin was significantly more effective in CD39-deficient mice compared with WT mice, demonstrating a role for host-derived CD39. Notably, host-derived CD39 significantly altered the ovarian tumor immune landscape by decreasing the ratio of infiltrating CD8/Tregs (figure 2E).
Tissue distribution and impact of tumor-derived CD73
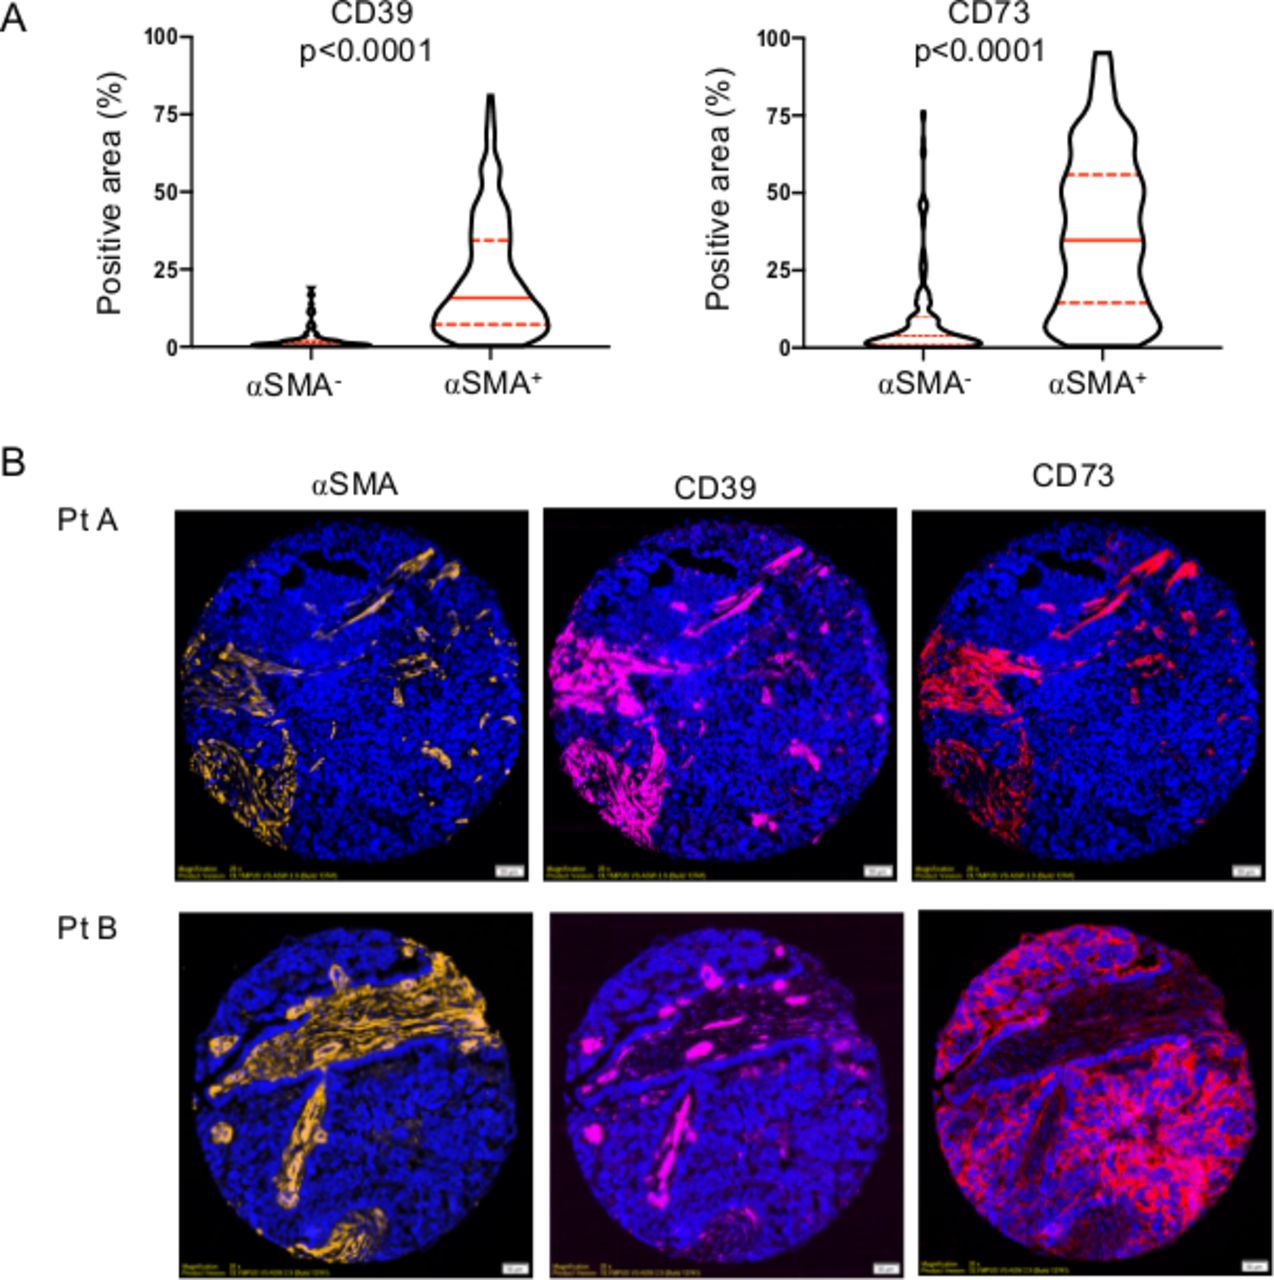
Using quantitative IF, we next assessed what cell types within HGSC tumors expressed CD39 and CD73. Both ectonucleotidases were found to be predominantly expressed by activated (αSMA+) stromal cells (figure 3A). CD39 was consistently absent from tumor cells, while high tumorous levels of CD73 were observed in approximately 5% of cases (figure 3B and online supplemental figure S4A). CD73 expression was not associated with age, cytoreductive surgery (ie, debulking) or BRCA mutations, but was higher in advanced stages (online supplemental figure S4B). Survival analysis revealed that higher CD73 expression in tumor cells was significantly associated with worse disease-free survival (figure 4A). To gain insights in the molecular pathways associated with CD73 expression, we performed GO analysis focusing on DIF and IMR molecular subtypes (the two subtypes where CD73 is associated with worse prognosis). CD73-high tumors were enriched for GO pathways promoting extracellular matrix remodeling (figure 4B). Notably, the top correlated genes with CD73 are known to promote epithelial-to-mesenchymal transition (EMT) (online supplemental figure S5). Accordingly, gene silencing of the pro-EMT transcription factor ZEB1 in human in ovarian tumor cells significantly downregulated CD73 surface expression (figure 4C), and CD73 gene silencing significantly upregulated epithelial cytokeratin-19 and downregulated MES vimentin and N-cadherin in human ovarian tumor cells (figure 4D).

CD39 and CD73 are predominantly expressed in the activated stroma of HGSC. (A) Coimmunofluorescence analysis of αSMA, CD39 and CD73 protein expression in a cohort of 200 HGSC on tissue microarray (median, 95% CIs and Mann-Whitney U test p values are shown). (B) Representative staining of a tumor (Pt a) with coexpression of CD39 and CD73 in activated (αSMA+) stroma, and a tumor (Pt B) with high CD73 expression in tumor cells. HGSC, high-grade serous ovarian cancer.

CD73 protein expression in HGSC is associated with worse prognosis and promotes epithelial-to-mesenchymal transition (EMT). (A) Disease-free survival analysis of CD73 protein expression in epithelial (cytokeratin+) areas of HGSC tumors (n=720 patient). (B) Gene ontology analysis of CD73-High immunoregulatory (IMR) and differentiated (DIF) HGSC. (C) Gene-silencing of ZEB1 was performed in human SKOV-3 ovarian tumor cells and CD73 surface expression measured by flow cytometry. (D) Gene-silencing of CD73 was performed in SKOV-3 cells and cytokeratin (CK)−19, vimentin and N-cadherin protein expression measured by Western blot (means±SEs) of three experiments are shown. (E) Disease-free survival analysis of CD73 protein expression in αSMA+ stromal areas of HGSC tumors (n=704 patients). (F) Disease-free survival analysis according to stromal (αSMA+) CD73 expression and intratumoral CD8 expression (n=585 patients). HGSC, high-grade serous ovarian cancer.
Impact of stroma-derived CD73
We next evaluated the prognostic impact of stromal CD73 expression. High levels of CD73 protein expression by activated (αSMA+) stromal fibroblasts were significantly associated with worse patient survival (figure 4E). Although we observed a similar trend for stromal CD39 expression, it did reach not statistical significance (online supplemental figure S6). When we evaluated the combined prognostic impact of stromal CD73 and tumor-infiltrating CD8+ cells, we observed that patients with tumors with high levels of stromal CD73 and low levels of CD8 had the worse prognosis (figure 4F). As a continuous variable, stromal-derived CD73 protein expression was also significantly associated with worse OS in univariate and multivariate analyses, independently of patient age, cytoreductive surgery and cancer stage (figure 5).

Overall survival univariate and multivariate analysis. Cox proportional hazards models,19 adjusting for age, stage and cytoreductive surgery (debulking), for CD73 protein expression (ie, MFI) as a continuous variable within αSMA+ stromal area (CD73_MFI_aSMA_PosArea) or epithelial (cytokeratin+) areas. MFI, mean fluorescence intensity.
CD39 on TILs
CD39 expression within the epithelium of HGSC tumors showed an expression pattern suggestive of immune infiltrates and was accordingly associated with better prognosis (figure 6A,B). To gain more insights on CD39 expression in TILs, we performed flow cytometry (online supplemental figure S7) and scRNAseq analysis on purified TILs. Unsupervised tSNE analysis revealed predominant CD39 expression in two CD8+ clusters characterized with high levels of PD-1 and TIGIT (figure 6C and online supplemental figure S7). Notably, one CD8+CD39+ cluster expressed higher levels of CD25, CD69, CD38, HLADR, LAIR-1, CD244 and IL-7R (CD127). Within CD4+ TILs, CD39 was expressed in putative Tregs (CD25high and TIGIT+) (online supplemental figure S7) and in CD4 +T cells expressing high levels of PD-1, TIGIT, HLADR and CD69 (figure 6C).

CD39 is expressed by myeloid cells and exhausted clonally expanded tumor-infiltrating T cells. (A) Disease-free survival analysis of high and low CD39 protein expression in epithelium of HGSC tumors (n=200 patient). (B) Representative CD39 staining. (C) Flow cytometry analysis of tumor-infiltrating lymphocytes (TILs) from five HGSC patients. Colored bars represent the proportion of each tSNE cluster within CD8+ (top) or CD4+ TILs (bottom). Pie charts represent the proportion of CD8+ versus CD4+ TILs. Heatmaps represent relative mean fluorescence intensity (MFI) for each marker within a tSNE cluster. Arrows represent clusters with highest CD39 expression. (D) ScRNAseq analysis of CD45+ immune cells isolated from five HGSC patients. UMAP of immune cell clusters (left) and ENTPD1 expression across clusters (right). (E) Expression levels of selected genes in CD8 clusters. (F) Clonal proportion and (G) diversity index of T cell receptors in CD8 clusters were measured. (H) In vitro T cell responses against OVA-expressing ID8 ovarian tumor cells were measured using transgenic mouse OVA-specific CD8+ T cells (OT-1) proficient or deficient in CD39 with or without primary mouse embryonic fibroblasts (MEF) proficient or deficient in CD39. IFN-γ production was measured by ELISA after 16 hours (means±SEs of triplicates are shown; **p<0.01 by Mann-Whitney U test). HGSC, high-grade serous ovarian cancer; OVA, ovalbumin; ScRNAseq, single-cell RNA sequencing;
scRNAseq analysis of immune infiltrates
ScRNAseq analysis (online supplemental figure S8) of CD45+ immune cells revealed high expression of CD39 in CD8+ T cells, Tregs, myeloid cells, NK cells and B cells infiltrating HGSC (figure 6D). Within CD8+ TILs, CD39 was enriched in the CD8.T4 cluster together with T cell exhaustion genes, activation marker (41BB), CD103 and CXCL13 (figure 6E). Analysis of DEGs in CD8+ TILs revealed a positive correlation between CD39 and CTLA-4, TIM-3, TIGIT, CXCL13, 41BB, SNX9 (involved in T cell costimulation),9 MYO1E (involved in lymphocyte motility)33 and LAYN (linked to the suppressive function of TILs),34 while the top gene negatively correlated with CD39 was GZMK (online supplemental figure S9), involved in anti-PD-1 activity.35 We next investigated whether CD39 expression was associated with T cell expansion and indeed observed that CD39+ CD8+ TILs (ie, CD8.T4 cluster) displayed highest clonal expansion (figure 6F) and lowest TCR diversity (figure 6G).
CD39 on fibroblasts or T cells suppresses T cell function
We finally evaluated the functional impact of CD39 expression on cancer-associated fibroblasts (CAFs) and effector CD8+ T cells using primary OVA-specific mouse CD8+ T cells (OT-1 cells) and fibroblasts derived from CD39-deficient mice. OT-1 cells were cocultured with OVA-expressing mouse ovarian tumor cells (ID8) in the presence or absence of syngeneic fibroblasts. IFN-γproduction was measured as a marker of T cell activation. As shown in figure 6H, CD39 expression on CD8+ T cells (OT-1 cells) or fibroblasts significantly suppressed IFN-γ production by OT-1 cells.
Discussion
Inhibitors of eADO signaling represent an expanding class of immune-stimulating agents with therapeutic activity. However, their potential in gynecological oncology remains largely unknown. eADO accumulates as a result of ATP hydrolysis, mainly by the ectonucleotidases CD39 and CD73. We here demonstrated that both CD39 and CD73 proteins are predominantly expressed by activated CAFs in human HGSC. Notably, CD73 expression in αSMA+ CAFs was highly prognostic and independent of age, debulking or stage. Given our prior work on CD73-deficient fibroblasts9 and our current work on CD39-deficient fibroblasts, our data support a model where CAF-derived ectonucleotidases contribute to ovarian tumor immune escape. High levels of CD73 and CD39 on ovarian CAFs s may, therefore, help stratify patients for eADO-targeting therapy.
In contrast to CAFs, epithelial ovarian tumor cells were only occasionally found to expressed high levels of CD73 (approximately 5% of cases), while CD39 was consistently absent. Yet, CD39 gene expression in HGSC tumors was significantly associated with chemorefractory and chemoresistant disease. While CD39 may be upregulated following chemotherapy,36 our data suggest a prominent role for CD39 expression by ‘host’ cells, such as CAFs and immune infiltrates in promoting ovarian cancer. In support of this, we observed that CD39-deficient mice with ovarian cancer were significantly more responsive to carboplatin chemotherapy and displayed significantly higher CD8/Tregs ratios in the tumor microenvironment.
Another important finding was that the prognostic impacts of CD73 and ADO_sig were subtype-specific. Accordingly, CD73 and ADO_sig were associated with worse prognosis in the IMR and DIF molecular subtypes of HGSC, but were in contrast associated with better prognosis in the MES and PRO subtypes. Interestingly, CD73 has been previously shown act as a tumor suppressor in certain cancers, such as endometrial carcinomas,37 and to be associated with better prognosis in ovarian cancers of broad histotype.38 Although the clinical significance of molecular classification is still controversial, our data support further investigation of subtype-specific effects eADO signaling in ovarian cancer.
Our study also provides additional support that CD73 is associated with tumor cell stemness.12 We indeed demonstrated that EMT was associated with CD73 expression on ovarian tumor cells, and GO analysis revealed a strong correlation between CD73 and extracellular matrix remodeling and EMT genes. Since EMT has been associated with resistance to immune checkpoint blockade therapy, CD73-mediated EMT may contribute to anti-PD-1 treatment resistance in ovarian cancer.39
The ADO_sig22 here analyzed was found to be associated with worse prognosis in HGSC expressing high levels of CD73 or CD39. Surprisingly, it was associated with better prognosis in tumors expressing low levels of ectonucleotidases. A potential confounding factor may lie in the fact that several genes in the ADO_sig are in fact associated with T cell activation. Alternatively, high expression of the ADO_sig independently of CD73 or CD39 may reflect alternative eADO-generating pathways. A refinement of the ADO gene signature that better reflects tumor immune landscapes may increase its clinical utility.
Fow cytometry and scRNA-seq analyses revealed that CD39 expression in TILs was highest in exhausted T cells with evidenced of clonal expansion. Our data; thus, support prior studies showing that CD39 identifies exhausted T cells enriched for tumor antigen recognition.17 40 Interestingly, a subpopulation of CD39+CD8+ TILs was found to express CD69, CD127 (IL-7R) and CD103, suggestive of tissue-resident memory T cells (TRM cells). Furthermore, coexpression of PD-1 and CD103 in HGSC CD8+ TILs has been previously shown.41 A recent study demonstrated a critical role for extracellular ATP and signaling through P2×7 receptor in the generation of TRM cells.42 Activation of P2×7 receptor was shown to controls TRM cells by enhancing TGF-β signaling. Given that CD39 depletes ATP, CD39 upregulation on T cell exhaustion may, therefore, prevent the development of long-lived TRM cells.
Preclinical studies demonstrated that anti-CD39 mAb therapy not only overcomes eADO-mediated immunosuppression, it also increases eATP signaling via P2×7 receptor leading to increased production of IL-1β and IL-18 in the tumor.43 Activation of P2×7 and downstream NLRP3 inflammasome are indeed required for antitumor activity of anti-CD39 mAbs.43 By engaging the inflammasome pathway, blocking CD39 may thus convert ‘immune-cold’ tumors into ‘immune-active’ tumors, which may in turn promote increased sensitivity to chemotherapy, radiotherapy and immune checkpoint blockade.
Selective and potent inhibitors of CD39, CD73, A2A and/or A2B have now entered clinical trials.7 Preclinical studies suggest that eADO-targeting agents are most effective when used in combination, for instance with immune checkpoint inhibitors and/or chemotherapy. Combining anti-CD73 mAb with an A2A antagonist also appears synergistic in animal cancer models.44 Whether targeting CD39 similarly synergizes with CD73 inhibitors or A2A/A2B antagonists remains to be investigated. Considering that ovarian cancer patients are currently being treated with eADO inhibitors (NCT03719326, NCT03629756, NCT03454451, NCT03549000) and the therapeutic landscape of HGSC, it would of interest to evaluate combinations of eADO inhibitors with PARP inhibitors, anti-angiogenic agents or emerging immunotherapies.6
Acknowledgments
We thank Dr Yohann Dabi for his constructive feedbacks. We thank the patients, the Gynecology-Oncology and Pathology services of all participating centers for tumor procurement. We thank the cytometry core facility of CRCHUM for cell sorting and the molecular pathology core facility of the CRCHUM for performing the HGS2013 and COEUR TMA construction and tissue scanning. Tumor banking for the discovery cohort was supported by the Banque de tissus et de données of the Réseau de recherche sur cancer of the Fonds de recherche Québec – Santé (FRQS) affiliated with the Canadian Tumor Repository Network. This study uses resources provided by the COEUR biobank funded by the Terry Fox Research Institute (TFRI) and managed and supervised by the CHUM. The Consortium acknowledges contributions to its COEUR biobank from Institutions across Canada (www.tfri.ca/COEUR/members).
References
Supplementary materials
Supplementary Data
This web only file has been produced by the BMJ Publishing Group from an electronic file supplied by the author(s) and has not been edited for content.
Footnotes
Twitter @carneiro_mayra, @LauBuisseret, @rejeanlapointe
YB, SP and MC contributed equally.
Contributors YB, SP, MC, LB, IC, PT, PC, LC and DA performed experiments, wrote the manuscript and analyzed data; SCR provided reagents and edited the manuscript; A-MM-M and DP provided reagents and edited the manuscript; RL edited the manuscript; JS analyzed data and wrote the manuscript.
Funding A-MM-M, DP, RL and JS are researchers of CRCHUM, which receive support from the Fonds de recherche Québec – Santé (FRQS). This work was supported by a research grant (Immunotherapy network; iTNT) from the Terry Fox Research Institute to AMMM, RL and JS, by a research grant from the Canadian Institutes of Health Research (CIHR grant FRN 148872) to JS, and by National Institute of Health (NIH) grants (1R21CA221702, R21CA164970 and R01HL094400) to SCR. YB was supported by the Jean-Guy Sabourin Research Chair in Pharmacology of Université de Montréal. LC was supported by a postdoctoral fellowship from FRQS.
Competing interests JS is a SAB member and owns stocks of Surface Oncology. LB received research grants for her Institute from AstraZeneca, speaker honoraria from BMS and travel grant from Roche. SCR received grant support and has served as Consultant to Tizona and is Scientific founder of Purinomia.
Patient consent for publication Not required.
Ethics approval The study was approved by the Research Ethics Committee of the Montreal University Hospital Center (CHUM) and informed consent was obtained.
Provenance and peer review Not commissioned; externally peer reviewed.
Data availability statement Data are available in a public, open access repository. Data are available in previously reported public repositories.
Supplemental material This content has been supplied by the author(s). It has not been vetted by BMJ Publishing Group Limited (BMJ) and may not have been peer-reviewed. Any opinions or recommendations discussed are solely those of the author(s) and are not endorsed by BMJ. BMJ disclaims all liability and responsibility arising from any reliance placed on the content. Where the content includes any translated material, BMJ does not warrant the accuracy and reliability of the translations (including but not limited to local regulations, clinical guidelines, terminology, drug names and drug dosages), and is not responsible for any error and/or omissions arising from translation and adaptation or otherwise.