Article Text

Abstract
Background The most common clinical outcome observed after treatment with immune checkpoint inhibitor antibodies is disease stabilization. Using vaccines to generate high levels of tumor antigen-specific T-helper 1 (Th1), we show that tumors not eradicated by vaccination demonstrate prolonged disease stabilization. We evaluated the mechanism by which type I T cells inhibit disease progression and potentially influence the subsequent clinical response to standard therapy in treatment refractory cancers.
Methods We employed a meta-analysis of studies with tumor growth from four different vaccines in two different mammary cancer models. The T-cell subtype and cytokine essential for vaccine-induced tumor inhibition was determined by in vivo neutralization studies and immunohistochemistry. The role of interferon gamma (IFN-γ) in receptor tyrosine kinase and downstream signaling was determined by immunoblotting. The role of suppressor of cytokine signaling 1 (SOCS1) on IFN-γ signaling was evaluated on SOCS1-silenced cells with immunoblotting and immunoprecipitation. The effect of vaccination on growth factor receptor signaling pathways, performed in both luminal (TgMMTVneu) and basal (C3(1)-Tag) mammary cancer models treated with paclitaxel or an anti-HER2-neu monoclonal antibody were assessed via immunoblotting.
Results Immunization with an epitope-based vaccine targeting a representative tumor antigen resulted in elevated tumor trafficking Tbet+CD4 T cells, decreased tumor proliferation and increased apoptosis compared with control vaccinated mice. The resulting disease stabilization was dependent on IFN-γ-secreting CD4+ T cells. In the presence of excess IFN-γ, SOCS1 became upregulated in tumor cells, bound insulin receptor, insulin like growth factor receptor 1 and epidermal growth factor receptor resulting in profound oncogenic signaling inhibition. Silencing SOCS1 restored growth factor receptor signaling and proliferation and prevented cell death. Similar signaling perturbations were detected in vaccinated mice developing antigen-specific Th1 cells. Vaccination synergized with standard therapies and restored disease sensitivity to treatment with both a neu-specific antibody and paclitaxel in TgMMTVneu and to paclitaxel in C3(1)-Tag. Combination of vaccination and chemotherapy or biological therapy was more effective than monotherapy alone in either model and resulted in complete resolution of disease in some individuals.
Conclusions These data suggest the clinical activity of type I T cells extends beyond direct tumor killing and immune therapies designed to increase type I T cells and could be integrated into standard chemotherapy regimens to enhance therapeutic efficacy.
- CD4-positive T-lymphocytes
- immunization
This is an open access article distributed in accordance with the Creative Commons Attribution Non Commercial (CC BY-NC 4.0) license, which permits others to distribute, remix, adapt, build upon this work non-commercially, and license their derivative works on different terms, provided the original work is properly cited, appropriate credit is given, any changes made indicated, and the use is non-commercial. See http://creativecommons.org/licenses/by-nc/4.0/.
Statistics from Altmetric.com
Introduction
Type I T cells are associated with a clinically effective antitumor response. Several studies have shown that tumors enriched for type I T cells are associated with improved survival,1 response to chemotherapy,2 and response to immune therapy, such as immune checkpoint blockade3 across multiple tumor types. Type I interferons secreted by these cells can have profound effects on the tumor microenvironment; upregulation of immune checkpoint proteins, activation of antigen-presenting cells, and inhibition of tumor growth.4
Studies by our group, using vaccines to generate high levels of T-helper 1 (Th1) specific for a variety of tumor antigens, demonstrate that tumors escaping immune eradication have a significantly decreased tumor growth rate compared with controls and develop prolonged disease stabilization.5 6 Disease stabilization is also the dominant clinical response seen with the use of immune checkpoint inhibitor monoclonal antibodies.7 In patients treated with an anti-program cell death protein-1 (PD-1) monoclonal antibody, stable disease occurred in 26% of patients with breast cancers,8 30% of patients with ovarian cancers,9 and 22% of patients with non-small cell lung cancer.10 The number of patients developing disease stabilization was, in each study, greater than those that developed a measurable clinical response.
We found that vaccine-induced type I T cells mediated tumor growth stabilization and identified that suppressor of cytokine signaling-1 (SOCS1), upregulated by tumor cells in the presence of interferon gamma (IFN-γ), bound to several oncogenic growth factor receptors in oncogene addiction pathways. Signaling through the receptor was profoundly inhibited by SOCS1 binding, resulting in the tumors becoming sensitized to chemotherapy. The combination of biological or cytotoxic therapy and IFN-γ-secreting type I T cells could result in complete eradication of treatment refractory cancers.
Materials and methods
Animal models
Female, FVB/N-TgN (MMTVneu)−202Mul mice (TgMMTV-neu) (8 weeks old; median weight: 18 g, range: 15.6–18.5 g; Jackson Laboratory) or FVB-Tg(C3-1-TAg)cJeg/Jeg (C3(1)-Tag) mice (6 weeks old; median weight: 18 g, range: 16.5–18.5 g; provided by Dr Jeff Green, NCI) were used in this study. Animals were housed in a specific pathogen free facility at the University of Washington, were fed ad libitum with irradiated Picolab Rodent Diet 20 #5053 (PMI Nutrition International, St. Louis, Missouri, USA), and provided nestlet enrichment.
Study design
A power analysis was used to detect a difference in tumor volume and five mice per group was determined to provide 80% power to detect a significant pairwise difference at the two-sided alpha level of 0.05. The number of mice analyzed in assays other than tumor volume is indicated in the figure legends of figures 1, 4 and 5. Mice were randomly assigned to a particular study on weaning (TgMMTV-neu) or after PCR-confirmed genotype (C3(1)-Tag). Individual animals were then randomized into treatment groups by age and assigned sequentially until the study was fully enrolled. The investigators and animal caretakers were not blinded to the treatment groups. Vaccinations and tumor implantation were performed in random cage order. Studies were terminated when the volume of the vaccinated group was statistically significantly less than the control for at least two measurements. Tumors were collected and processed in a random order. No inclusion or exclusion criteria were established before the start of each study. No expected or unexpected adverse event occurred. In vitro analysis used the syngeneic luminal mouse mammary carcinoma cell line (MMC) derived from TgMMTV-neu. All in vitro experiments were performed at least three times. All data points in in vitro experiments and all mice in in vivo experiments were included in the data analysis. We used the Animal Research: Reporting of In Vivo Experiments (ARRIVE) checklist when writing this article.11
Immunization, treatment, and tumor growth
Mice were immunized subcutaneously three times with a mixture of insulin-like growth factor receptor-1 (IGF-IR) peptides,6 a mixture of hypoxia-inducible factor-1 alpha (HIF-1α) peptides,12 a mixture of insulin-like growth factor binding protein-2 (IGFBP2) peptides6 or a mixture of human epidermal growth factor receptor (HER2) peptides6 in complete/incomplete Freund’s adjuvant (Sigma) at 2-week intervals, or with adjuvant alone (control). These previous publications have demonstrated that peptide specific T cells respond to corresponding antigen-specific proteins.
The mouse mammary tumor cell lines MMC and M6 were derived from spontaneous mammary tumors from TgMMTV-neu13 and C3(1)-Tag14 mice, respectively. Both cells lines were authenticated before use; MMC was verified to express rat neu by flow cytometry and M6 was verified to express the SV40 antigen by western blot and low expression of estrogen receptor by reverse transcription PCR (RT-PCR). Mycoplasma contamination was assessed using the Universal Mycoplasma Detection Kit (American Type Culture Collection) after three passages and a minimum of 10 days in culture. Cell signaling studies were performed on cells between passages 7 and 10.
For tumor challenge, 0.5×10⁶ cells (between passages 10 and 12) were implanted into the mammary fat pad 2 weeks after the last vaccine. Tumors were measured every 2–3 days with Vernier calipers, and tumor volume was calculated as the product of length×width×height×0.5236. Treatment with 7.16.4 antibody was performed as previously described15 16 In some cases, 10 mg/kg paclitaxel was administered subcutaneously, two times per week for the duration of the study. The tumor implant site was surgically excised in some animals to document disease status. Tumor growth is presented as mean tumor volume (mm3±SEM).
Measurement of antigen-specific T-cell responses
Murine splenic cells were evaluated by IFN-γ ELISPOT.17 Spleen cells were plated, 2×10⁵ per well (five replicates), with IGF-IR peptides or HIV Gag p5218 (all 10 µg/mL) (CPC Scientific). Positive responses were defined as p<0.05 between the means of experimental and no antigen wells and reported as corrected spots/well (experimental-no antigen control spots)±SEM or absolute spots/well. T-cell lines were generated as previously described.17 Briefly, splenocytes from seven vaccinated mice were stimulated with a pool of 10 µg/mL each of IGF-IR-p354-388, IGF-IR-p545-559, IGF-IR-p921-935 and IGF-IR-p1092-1106. 10 ng/mL recombinant mouse interleukin (IL)-7 (R & D Systems), 5 ng/mL recombinant human IL-15 (PreproTech) and 10 U/mL recombinant human IL-2 (Hoffmann-La Roche) were added on days 5 and 12, with IL-2 on days 15 and 18. Cytokine levels were assessed according to the manufacturer’s instructions using the appropriate ELISA (eBioscience) on medium collected on day 10. Data are expressed as mean ng/mL ±SD of three replicates.
In vivo cell depletion and cytokine neutralization
Depletion of CD4+ and CD8+ T cells was performed as published (>95% depletion).19 B cells were depleted by intraperitoneal rituximab (400 µg) (Genentech) 2 days before MMC inoculation (30%±5% depletion).20 Cytokine neutralization was performed by intraperitoneal injection of anti-IFN-γ (100 µg, clone 37895; R and D Systems), anti-tumor necrosis factor alpha (TNF-α) (100 µg, clone MP6-XT22; R and D Systems), anti-IL-2 (100 µg, clone JES6-1A12; R and D Systems), rat IgG2a isotype (clone 54447, R and D Systems) or rat IgG1 isotype (clone 11711, R and D Systems) given 4 and 2 days prior to and on the same day as tumor inoculation, then repeated once weekly until study end.21 Tumor growth is presented as mean tumor volume (mm3±SEM). All experiments were repeated twice with similar results.
Protein expression
MMC were stimulated with 100 ng/mL recombinant mouse IFN-γ (R & D Systems) and cultured in media/1% fetal bovine serum (FBS) for 18 hours followed by western blotting using 25 µg cell lysates (23). Antibodies used were phospho-IGF-IR (Tyr 1161, #sc-101703), IGF-IRα (clone, N-20), phospho-epidermal growth factor receptor (EGFR) (Tyr 1173, #sc-12351), EGFR (clone 1005), phospho-insulin receptor (IR) β (clone 10C3), IR β (clone C-19) all at 1 µg/mL (Santa Cruz Biotechnology), α-tubulin (clone B-7), phospho-signal transducer and activator of transcription (STAT-1; Tyr 701, clone D4A7), STAT-1 (clone D1K9Y), non-phospho-phosphatase and tensin homolog (PTEN;Ser380/Thr382/Thr383, #9569), SOCS1 (clone A156), SOCS2 (#2779), phospho-serine/theronine-protein kinase (AKT) (Ser473, #9271) and AKT (#9272), all at 1 µg/mL (Cell Signaling Technology), SOCS3 (#626602) at 1 µg/mL (Biolegend) and horseradish peroxidase-conjugated goat anti-rabbit (20 ng/mL, Thermo Fisher Scientific). For coimmunoprecipitation, 40–100 µg of MMC lysate was precleared in 1 µg/mL normal rabbit IgG and 20 µL Protein A/G beads (Santa Cruz) for 1 hour at 4°C. Beads were removed by centrifugation, and 1 µg/mL anti-IGF-IR, anti-EGFR or anti-IR was added for 1 hour at 4°C followed by 20 µL of Protein A/G beads and incubated overnight at 4°C. The beads were washed and bound proteins were removed with 0.1 M glycine pH 2.6, neutralized with 0.1 M Tris–HCL pH 8. Expression levels were quantitated by densitometry using NIH Image Processing and Analysis in Java (ImageJ) software.
For immunocytochemistry, MMC cells were cultured on glass coverslips and stimulated with IFN-γ as mentioned previously. MMC cells were fixed in 4% paraformaldehyde and permeabilized with 1% Triton X-100 before staining. Immunocytochemistry was performed using Vecastain ABC reagent according to the manufacturer (Vector Labs) and anti-mouse proliferating cell nuclear antigen (PCNA; #ab2426, 0.5 µg/mL; Abcam). Terminal deoxynucleotidyl transferase dUTP nick end labeling (TUNEL) staining was performed using the DeadEnd Fluorometric kit according to manufacturer’s instructions (Promega). For tumor tissue protein expression, immunohistochemistry and TUNEL was performed as mentioned previously on frozen sections (10 µm) fixed in 75% acetone/25% methanol and permeabilized with 1% Triton X-100. Antibodies included anti-mouse PCNA as previously mentioned, anti-mouse Tbet (1 µg/mL, clone EPR9301; Abcam), anti-mouse GATA3 (clone EPR178741, Abcam) and anti-mouse CD4 (1 mg/mL, MT310; Santa Cruz). Cells were counted from four high-powered fields, and positive cells were expressed as a percent of the total cells. All fields are shown at ×100. In some studies, tumors were frozen in liquid nitrogen, ground to a powder, and 25 µg cell lysate was separated by sodium dodecyl sulfate–polyacrylamide gel electrophoresis.
Cell analysis by flow cytometry
IFN-γ receptor expression was documented by adding 2 mg/mL Phycoerythrin-conjugated anti-mouse CD119/IFN-γR1 (clone 2E2, eBioscience) or PE-conjugated Armenian Hamster IgG isotype to MMC. Flow cytometry was performed on the FACSCanto (BD Biosciences) and analyzed using FlowJo software.
Small interfering RNA
MMC were transfected with 60 pmol SOCS1 or control siRNA (csiRNA) (Santa Cruz) using 6 µL of transfection reagent for 6 hours after which RPMI medium conatining20% FBS was added. After 18 hours, media was replaced with RPMI/10% FBS and incubated for 24 hours before stimulation with mouse IFN-γ as described previously. SOCS1 protein expression was decreased by 66%±12% with siRNA treatment; SOCS1 protein expression is described as % inhibition or restoration based on adjuvant control.
Statistical analysis
Model assumptions were assessed using the Shapiro-Wilk normality test. The unpaired, two-tailed Student t-test and analysis of variance (ANOVA) test was used to evaluate differences when normality was confirmed. When normality of the data was not confirmed, the non-parametric Kruskal-Wallis and Man-Whitney tests were used. Differences in tumor volume were determined by two-way ANOVA with a Dunnett post-test for multiple comparisons. Tumor growth rate analysis was performed as previously described.22 A p value of <0.05 was considered significant (GraphPad Software, Prism V.8).
Results
Vaccine-induced antigen-specific Th1 significantly reduce the rate of or completely inhibit tumor growth via secretion of IFN-γ
In a meta-analysis of 26 individual experiments in 303 mice conducted over 73 months using two different mammary tumor models, tumor growth rate was monitored after immunization with IGF-IR, IGFBP-2, HER2 or HIF-1α class II epitope-based vaccines or adjuvant alone to generate type I CD4 T cells.5 6 23 In animals with progressive tumors after immunization, we consistently observed a significantly reduced growth rate in the tumors from vaccinated mice (5.9±0.48 mm3/day) compared with controls (12.2±0.83 mm3/day, p<0.001; figure 1A).
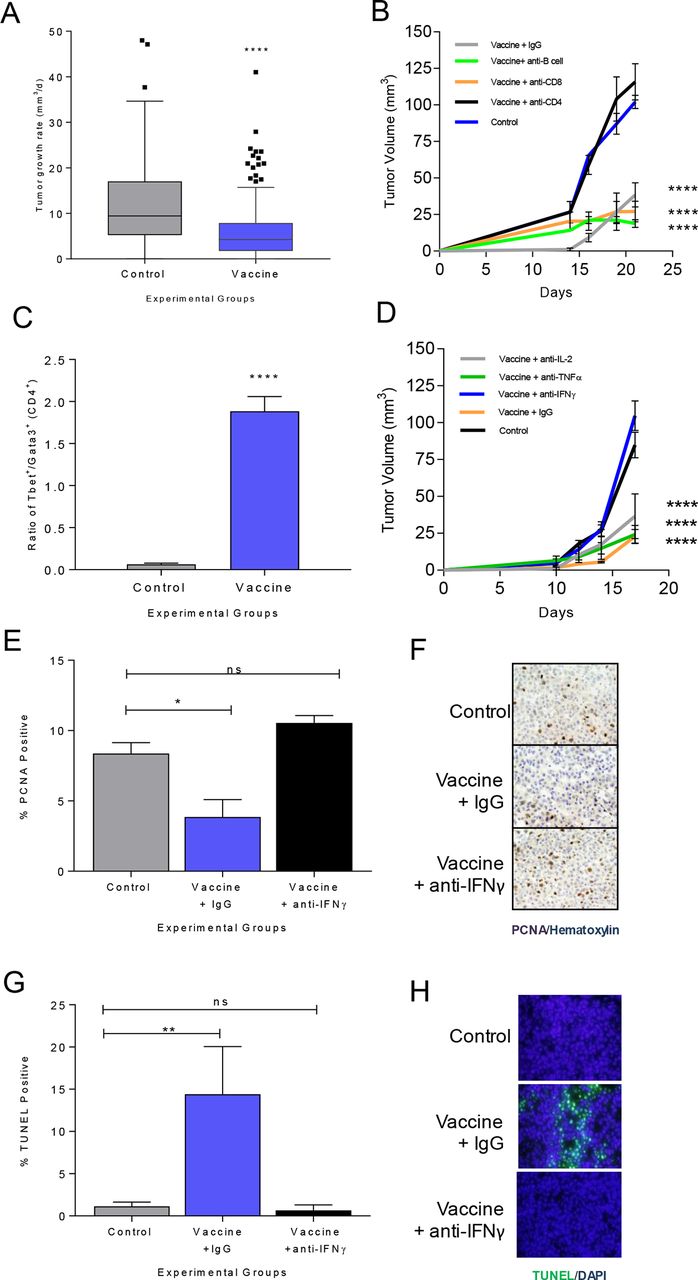
Vaccine-induced antigen-specific Th1 significantly reduces the rate of or completely inhibits tumor growth via secretion of IFN-γ. (A) Tumor growth rate (mm3/day), as box and whisker plots with Tukey outliers, in adjuvant only (n=131) or class II epitope immunized (n=172) mice (MMC or M6 implanted); ****p<0.0001. (B) Mean tumor volume (mm3±SEM) from mice immunized with adjuvant only (control) or an IGF-IR epitope vaccine and treated with a depletion or isotype control antibody as indicated; ****p<0.0001. (C) Ratio of Tbet+ to GATA3+CD4+ T cells (±SEM); adjuvant (control) or IGF-IR epitope vaccine; ****p<0.0001. (D) Mean tumor volume (mm3±SEM) from mice immunized with adjuvant only (control) or an IGF-IR epitope vaccine and treated with a neutralizing or isotype control antibody as indicated; ****p<0.0001. Mean percent positive cells (±SEM) and corresponding representative IHC for (E,F) PCNA or (G,H) TUNEL for adjuvant alone (control) or IGF-IR epitope vaccine treated with isotype control Ig (IgG) or anti-IFN-γ; n=3–6 mice/group; *p<0.05, **p<0.01. IFN-γ, interferon gamma; IL, interleukin; ns, not significant; Th1, T-helper 1; IgG, immunoglobulin G; DAPI, diamidino-2-phenylindole; IHC, immunohistochemistry; PCNA, proliferating cell nuclear antigen; TUNEL, terminal deoxynucleotidyl transferase dUTP nick end labeling.
To determine the mechanism of Th1-induced tumor inhibition, we used IGF-IR as a representative antigen in the TgMMTVneu (MMC) model.6 Immunization against IGF-IR induced significant levels of antigen-specific type I T cells (online supplemental figure S1A) and inhibited tumor growth (mean volume, 95±11 mm3/growth rate, 7.1 mm3/day) compared with controls (mean volume, 290±11 mm3, growth rate 25.3 mm3/day; p<0.001) (online supplemental figure S1B). To assess which T-cell subset mediated the antitumor effect, IGF-IR vaccinated mice were selectively depleted of CD4+ and CD8+ T cells prior to tumor challenge. B cells were also depleted as IGF-IR-specific antibodies can induce tumor regression.12 Depletion of CD4+ T cells abrogated the antitumor effect of IGF-IR vaccination, and tumor growth was no different from controls (p=0.339, figure 1B). IGF-IR vaccination and treatment with isotype control Ig (cIg) produced similar tumor inhibition as vaccination and treatment with anti-CD8 (p=0.376) or anti-CD20 (p=0.75, figure 1B). When tumors were analyzed after immunization, there was a significantly higher ratio of Tbet+CD4+ to GATA3+CD4+ tumor-infiltrating lymphocytes in vaccinated mice compared with control, demonstrating a Th1 dominant infiltrate (p<0.001, figure 1C). The IGF-IR-specific T cells secreted more IFN-γ than IL-2 (p=0.046) or TNF-α (p=0.004) in response to antigen (online supplemental figure S1C). We selectively neutralized these type I cytokines in vaccinated mice prior to tumor challenge to determine if any contributed to the antitumor activity of immunization. The average tumor volume in IFN-γ-neutralized mice was significantly larger than vaccinated mice treated with cIg, anti-TNF-α or anti-IL-2 (p<0.001 for all, figure 1D). Tumor size in the vaccinated IFN-γ-neutralized animals was equivalent to controls (p=0.207). We observed that tumor cell proliferation was decreased (p=0.015, figure 1E,F) and apoptosis was increased (p=0.008; figure 1G,H) in the IGF-IR immunized animals compared with control. However, after IFN-γ depletion, the percentage of proliferating or apoptotic tumor cells in vaccinated mice was no different from the control (p=0.251 and p=0.984, respectively).
Supplemental material
IFN-γ suppresses signaling through multiple oncogenic growth factor receptors in tumor cells
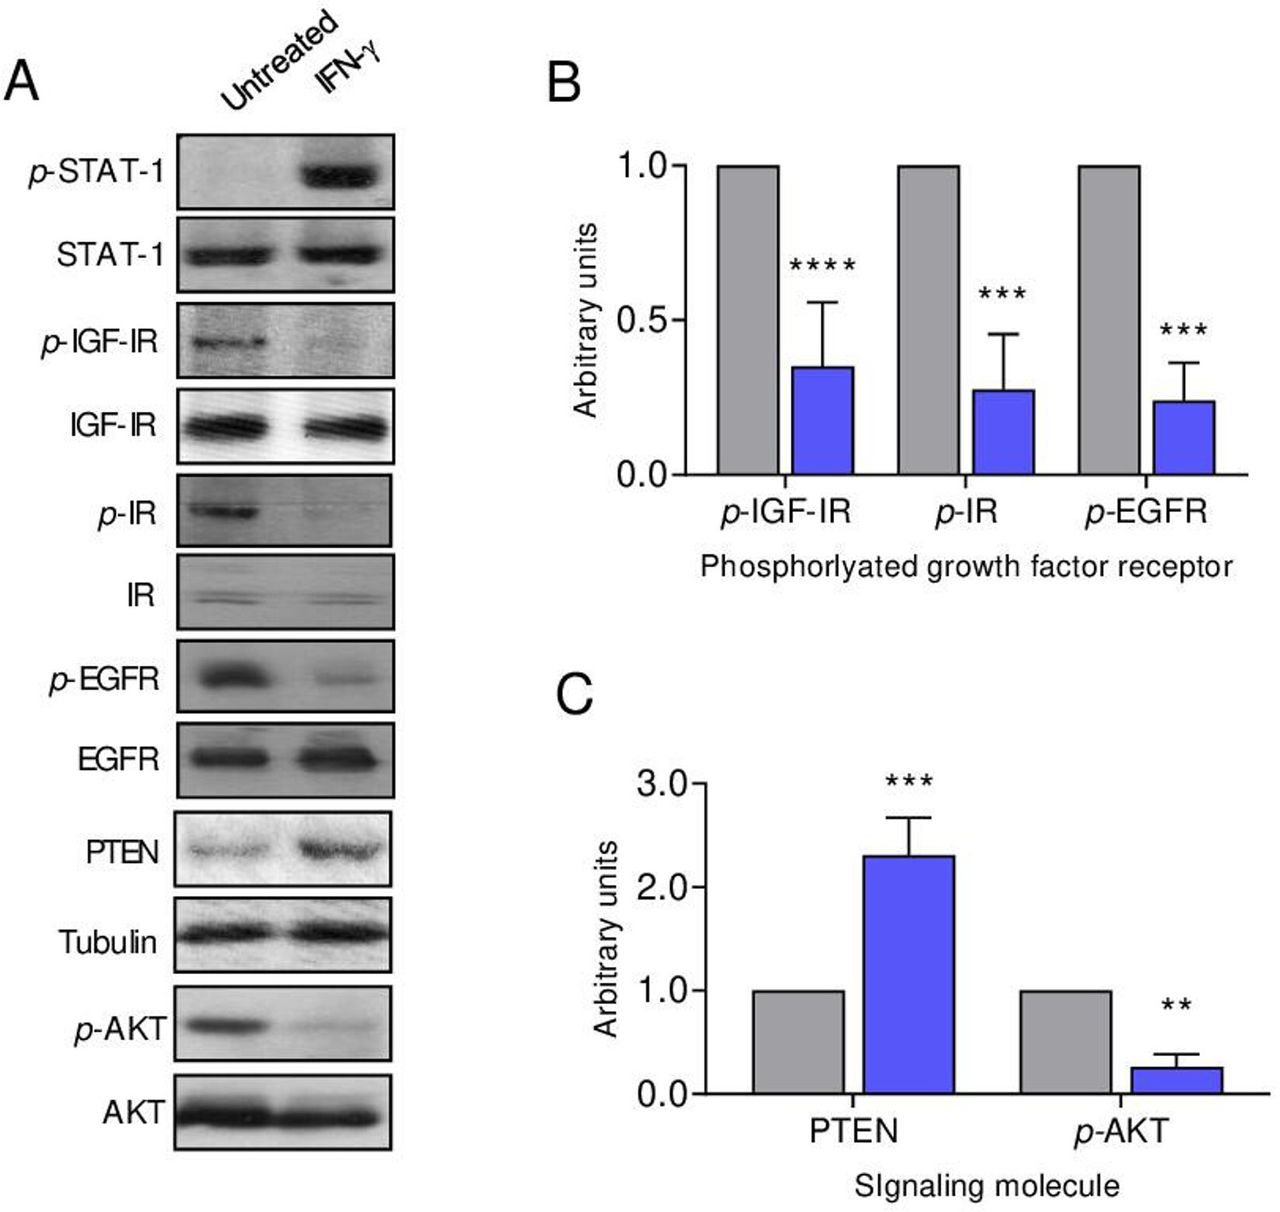
IFN-γ receptors are expressed on cells from several common human solid tumors including breast cancer,13 14 ovarian cancer15 and colon cancer.16 We similarly demonstrate that IFN-γR1 is expressed on syngeneic murine mammary tumor cell lines derived from the spontaneous tumors developing in TgMMTVneu, MMC (online supplemental figure S2A). In vitro IFN-γ treatment of human breast cancer cells has been shown to restore STAT-1 signaling,17 as it did in the MMC cells (figure 2A). Figure 2 demonstrates that IFN-γ treatment of MMC inhibits signaling through the receptor tyrosine kinases IGF-IR, IR and EGFR (p<0.001 for all; figure 2A,B) without significantly altering receptor protein levels. As enhanced receptor tyrosine kinase signaling has been shown to be associated with a loss of PTEN protein expression in breast cancer, conferring a growth advantage to PTEN negative cells,18 we assessed PTEN restoration with IFN-γ treatment. The level of PTEN protein was significantly increased after IFN-γ exposure (p<0.001; figure 2A,C). As PTEN negatively regulates the PI3K/AKT pathway,19 we evaluated phospho-AKT expression after IFN-γ treatment, which demonstrated a marked decrease in activity (p=0.004; figure 2A,C).
Supplemental material

IFN-γ suppresses signaling through multiple oncogenic growth factor receptors in tumor cells. (A) Western blots of the indicated proteins from MMC cells unstimulated and after IFN-γ treatment with tubulin loading control. Densitometric quantification of the (B) indicated growth factor receptor or (C) signaling molecule after treatment with IFN-γ (blue bars) compared with the untreated control cells (gray bars); n=3 independent experiments, **P<0.01, ***P<0.001, ****P<0.0001. IFN-γ, interferon gamma; IR, insulin receptor; p-IR, phosphorylated IR; IGF-IR, insulin-like growth factor receptor-1; p-IGF-IR, phosphorylated IGF-IR; EGFR, epidermal growth factor receptor; p-EGFR, phosphorylated EGFR; PTEN, phosphatase and tensin homolog; AKT, serine/threonine-protein kinase; p-AKT, phosphorylated AKT; STAT-1, signal transducer and activator of transcription 1; p-STAT-1, phosphorylated STAT-1.
SOCS1 protein, induced by IFN-γ, directly binds to receptor tyrosine kinases to obstruct signaling
SOCS proteins have been shown to attenuate signaling through IR, and we questioned whether SOCS family members were operative in modulating additional receptor tyrosine kinase signaling.20 SOCS1 expression in MMC was strongly induced with IFN-γ treatment (p=0.001) compared with SOCS2 and SOCS3 (figure 3A,B). To determine the contribution of SOCS1 in regulating phosphorylation in the presence of IFN-γ, we attempted to knockout expression via CRISPR-Cas9 in MMC cells, which proved lethal to the cells. Alternatively, we silenced expression via siRNA. Untreated MMC cells demonstrate high levels of IR, EGFR and IGF-IR phosphorylation, which was significantly inhibited with IFN-γ treatment in siRNA control cells (csiRNA, p<0.05 for all; figure 3C,D). Reduction of SOCS1 levels via siRNA in the presence of IFN-γ resulted in 67% restoration of IGF-IR signaling (p=002), 56% restoration of IR signaling (p=0.02) and 42% restoration of EGFR signaling (p=0.006) compared with IFN-γ csiRNA-treated cells (p=0.002) (figure 3C,D). There were low levels of PTEN in untreated cells, which was significantly elevated on IFN-γ treatment (p<0.001). PTEN levels were reduced by 93% in IFN-γ-treated cells where SOCS1 expression was silenced (figure 3C,D; p<0.001). Silencing SOCS1 expression, in the presence of IFN-γ, increased cell proliferation compared with csiRNA (p<0.001) (online supplemental figure S3A,B). Furthermore, the number of TUNEL-positive cells was decreased compared with the control IFN-γ-treated cells (p<0.001) and was similar to the number observed in untreated cells (p=0.592; online supplemental figure S3C,D). SOCS1 may directly interact with IR to inhibit activation of its downstream effectors.21 We show significant coprecipitation of SOCS1 with IR (p<0.001), EGFR (p=0.013) and IGF-IR (p=0.041) following IFN-γtreatment compared with the untreated control cells (figure 3E,F).
Supplemental material
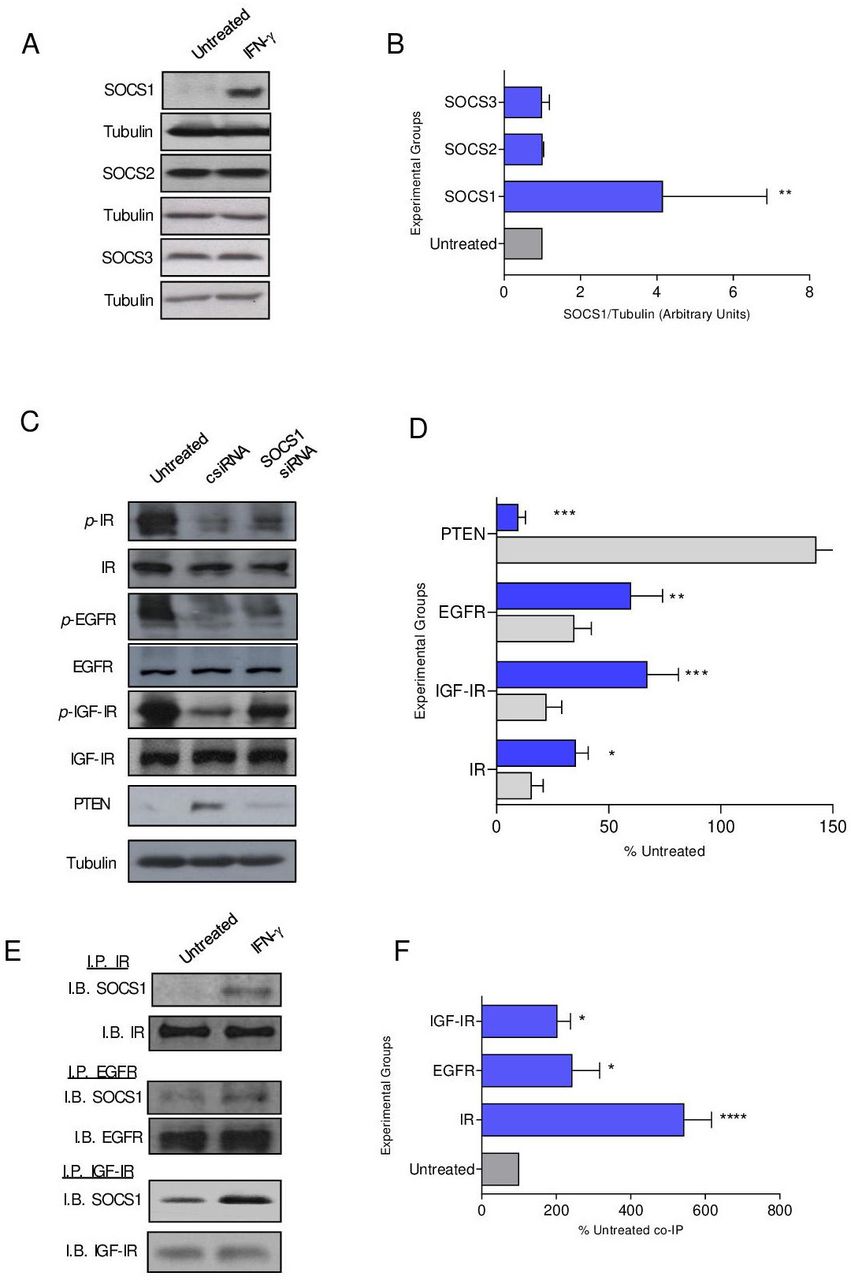
SOCS1 protein, induced by IFN-γ, directly binds to receptor tyrosine kinases to obstruct signaling. (A) Representative western blots and (B) densitometric quantification of the indicated SOCS protein expression after treatment with IFN-γ (blue bars) compared with the untreated control (gray bars) cells; n=3 independent experiments; **p<0.01. (C) Representative Western blots and (D) densitometric quantification of phospho-receptor tyrosine kinases in IFN-γ-treated cells after transfection with csiRNA (gray bars) or SOCS1 siRNA (blue bars) presented as a percent of the untreated (±SEM); n=3 independent experiments; **p<0.01, ****p<0.0001. (E) Representative western blots and (F) densitometric quantification of the coimmunoprecipitation of SOCS1 with the indicated receptor tyrosine kinase after treatment with IFN-γ (blue bars) compared with the untreated (gray bar) cells presented as a percent of the untreated; n=3 independent experiments; ****p<0.0001, *p<0.05. csiRNA, control siRNA; SOCS, suppressor of cytokine signaling; IGF-IR, insulin-like growth factor receptor 1; p-IGF-IR, phosphorylated IGF-IR; EGFR, epidermal growth factor receptor; p-EGFR, phosphorylated EGFR; PTEN, phosphatase and tensin homolog;IB, immunoblot; IFN-γ, interferon gamma; IP, immunoprecipitation; IR, insulin receptor; p-IR, phosphorylated IR; siRNA, small interfering RNA.
Vaccine-induced IFN-γ-secreting Th1 sensitizes tumors to monoclonal antibody therapy and chemotherapy in vivo, resulting in tumor rejection
We observed a substantial reduction in IGF-IR signaling (p=0.017; figure 4A,B) and an increase in active PTEN expression (p=0.028; figure 4C,D) in tumors derived from IGF-IR vaccinated mice. Tumors in TgMMTVneu mice do not completely regress in response to treatment with a neu-specific monoclonal antibody, 7.16.4.24 We questioned whether the abrupt decrease in growth factor receptor signaling associated with IGF-IR vaccination would enhance the efficacy of antibody therapy. Tumors in mice vaccinated with IGF-IR epitopes or treated with 7.16.4 were reduced by 69% (p<0.001) and 77% (p<0.001), respectively, compared with control tumors (figure 4E). Tumors in mice receiving both vaccination and monoclonal antibody therapy were completely inhibited (p<0.001). Fifty-five percent of the mice receiving both vaccination and monoclonal antibody treatment had no evidence of palpable tumor and on excision of the tumor implant site demonstrated no evidence of residual malignancy. Combination therapy was significantly more effective than vaccine alone (p<0.001) or antibody therapy alone (p=0.029). TgMMTVneu tumors are also resistant to treatment with paclitaxel.22 Vaccination concurrent with paclitaxel therapy completely prevented tumor growth compared with vaccination (p<0.001) or paclitaxel alone (p=0.001, figure 4F).

Vaccine-induced IFN-γ-secreting Th1 sensitize tumors to monoclonal antibody therapy and chemotherapy in vivo, resulting in tumor rejection. (A) Representative western blot and (B) densitometric quantification for phospho-IGF-IR in tumors from mice immunized with adjuvant alone (control) or the IGF-IR epitope vaccine presented as box and whisker plots with Tukey outliers, n=6 tumors/group; *p<0.05. (C) Representative western blot and (D) densitometric quantification for PTEN in tumors from mice immunized with adjuvant alone or the IGF-IR epitope vaccine presented as box and whisker plots with Tukey outliers, n=6 tumors/group; *p<0.05. mean implanted tumor volume (±SEM) from mice immunized with adjuvant alone or the IGF-IR epitope vaccine and treated with 7.16.4 (E) or paclitaxel (F); (E) ****p<0.0001 and *p<0.05 compared with vaccination +7.160.4. (F) ***p<0.001 and ****p<0.0001 compared with vaccination +paclitaxel. IFN-γ, interferon gamma; Th1, T-helper 1; IGF-IR, insulin-like growth factor receptor; p-IGF-IR, phosphorylated IGF-IR; PTEN, phosphatase and tensin homolog.
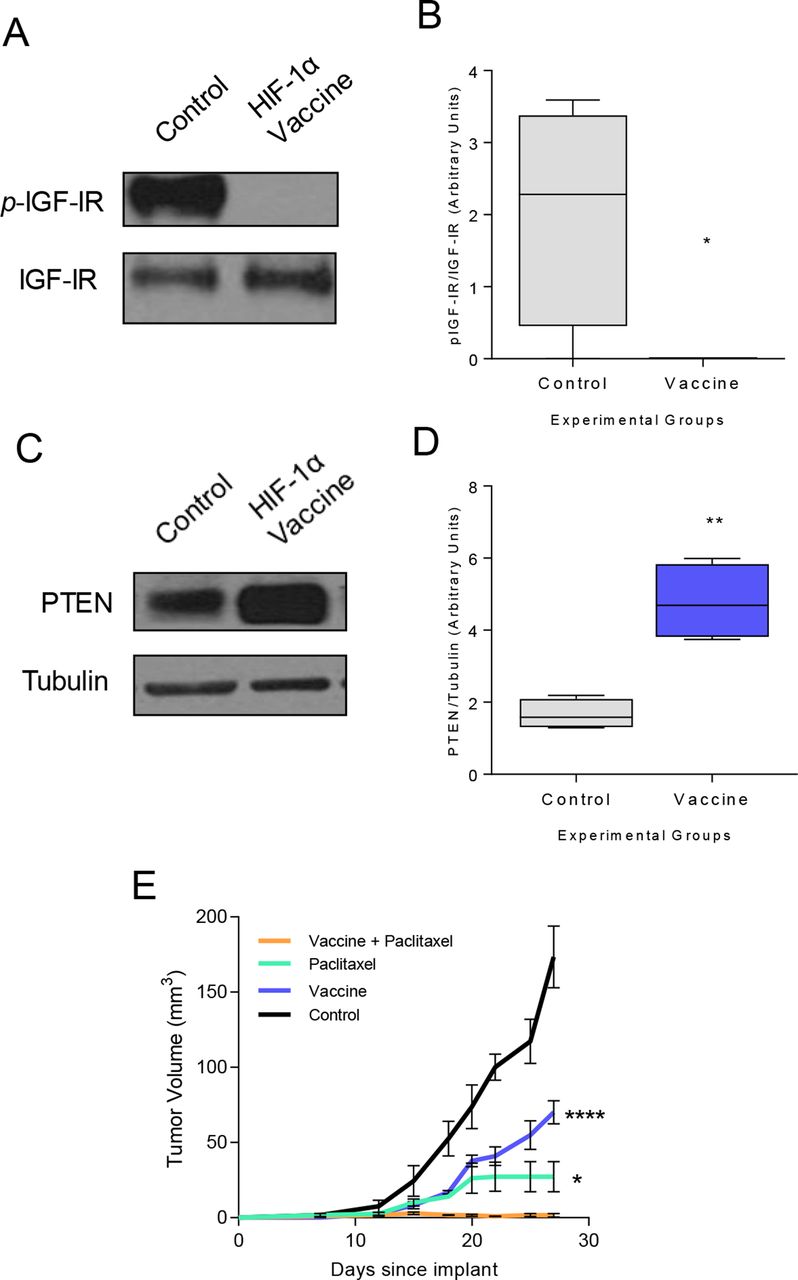
To determine the general applicability of the observation, we assessed the same effect in a different mouse model with a different Th1-inducing vaccine. We have previously demonstrated that a vaccine specific for HIF-1α class II epitopes could elicit Th1 which traffic to tumor and inhibit basal mammary cancer growth.5 The basal mammary cancer cell line, M6, was confirmed to express IFN-γR1 (online supplemental figure S2B). The HIF-1α vaccine completely suppressed IGF-IR activation (p=0.019; figure 5A,B) and increased PTEN protein expression (p=0.002; figure 5C,D) in cancer cells in vivo. A combination of vaccination and paclitaxel therapy prevented cancer outgrowth compared with vaccination alone (p<0.001) or paclitaxel therapy alone (p=0.013, figure 5E), thus demonstrating tumor trafficking Th1 can sensitize drug resistant tumors to chemotherapy in multiple models.
Combination paclitaxel therapy and hypoxia-inducible factor-1 (HIF-1α) Th1-inducing epitope vaccine prevents breast cancer growth. (A) Representative western blot and (B) densitometric quantification for phospho-IGF-IR in tumors from mice vaccinated with adjuvant alone (control) or the HIF-1α epitope vaccine presented as box and whisker plots with Tukey outliers; n=4 mice/group; *p<0.05. (C) Representative western blot and (D) densitometric quantification for PTEN in tumors from mice immunized with adjuvant only or the HIF-1α epitope vaccine presented as box and whisker plots with Tukey outliers; n=4 mice/group; **p<0.01. (E) Mean implanted tumor volume (±SEM) from mice immunized with adjuvant alone or the HIF-1α epitope vaccine and treated with paclitaxel; *p<0.05, ****p<0.0001 compared with vaccination+paclitaxel. Th1, T-helper 1; IGF-IR, insulin-like growth factor receptor-1; pIGF-IR, phosphorylated IGF-IR; PTEN, phosphatase and tensin homolog.
Discussion
Type I CD4 tumor-specific T cells can have diverse antitumor effects. Through the secretion of type I cytokines, Th1 can activate antigen-presenting cells, upregulate costimulatory molecules, and enhance antigen presentation.25 Type I cytokines support CD8 T-cell proliferation and activation and can have direct tumor cytotoxic activity.25 Data presented here demonstrate a novel role for tumor-specific Th1 in cancer therapy and shows that vaccine-induced antigen-specific IFN-γ-secreting T cells incite secretion of SOCS1 by cancer cells. In excess, the SOCS1 protein binds to multiple growth factor receptors inhibiting signaling through multiple tyrosine kinases. SOCS1-induced perturbation of numerous signaling pathways simultaneously sensitizes treatment-resistant cancers to biological therapy or chemotherapy, resulting in an enhanced antitumor response and even complete resolution of disease.
IFN-γ is essential for tumor rejection, and elevated levels of IFN-γ in cancers is associated with positive disease outcomes and response to therapy. Interferon gene signatures predict a more favorable prognosis for many human malignancies, including pancreatic,26 ovarian27 and breast cancers.28 Recent studies suggest that upregulation of IFN-γ associated genes is predictive of response to immune checkpoint blockade presumably reflecting an active type I immune response present in the tumor.29 Other investigators have shown that type I IFN-related gene signatures portend a favorable response to chemotherapy.30 Tumor exposure to IFN-γ results in profound effects on cell proliferation.31 The cytokine has antiangiogenic and antiproliferative effects and can induce apoptosis of tumor cells. Systemic IFN-γ is unlikely to have the same effect as T cells are more efficient at local delivery of cytokines and maintaining that secretion as long as there is antigen-stimulating T-cell proliferation. Moreover, systemic delivery of IFN-γ can be associated with significant toxicity.32 Studies in animal models have suggested that a primary mode of tumor control by type I T cells is not direct lysis of tumor, but rather the induction of cell cycle arrest by the secretion of IFN-γ.33 Initiation of cytokine secretion by CD4 T cells after antigen stimulation is an early event. The murine experiments described here (figure 1) suggest CD4 secretion of IFN-γ is an important pathway of early antitumor activity. Type I cytokines secreted by CD4 T cells, however, also enhance cross-priming of CD8 T cells, which may allow lysis by CD8 T cells to become the primary mode of anti tumor activity later in the course of vaccination.34 Our previous vaccine studies, analyzing a later time point (35 days), have shown antitumor activity is dependent on both CD4 and CD8 T cells.5 The antiproliferative effects attributed to IFN-γ are variable: downregulation of cell cycle proteins via activation of STAT1,35 increased expression of Fas,36 and the induction of cell senescence.37 Our observation that oncogene activation is obstructed by IFN-γ-induced SOCS1 may be an early upstream event that is associated with other reported changes in the expression and activation of cell cycle-related proteins.
SOCS proteins are negative regulators of several cytokines that use Janus kinase/signal transducer and activator of transcription (JAK/STAT) signaling pathways for activation.38 SOCS1 is the primary regulator of IFN-γ and inhibits JAK kinase activity by blocking the substrate-binding groove on the protein.39 Several studies suggest that SOCS1 will bind other tyrosine kinase proteins and is not specific to JAK. SOCS1 binds with high affinity to Lck kinase, a protein involved in T-cell signal transduction.40 There have also been reports of SOCS1 binding the IR, inhibiting signaling and leading to insulin resistance.21 41 We show that SOCS1 binds multiple tyrosine kinase receptors preventing signaling required for tumor growth. Signaling through the RKT/RAS pathway represented by involvement of EGFR and IGF-IR is a dominant oncogenic pathway for many common solid tumors such as breast, pancreatic, and microsatellite stable colon cancer.42 We also observed modulation of the PI3K pathway with inhibition of AKT phosphorylation and restoration of PTEN expression.42 The inhibitory effect of IFN-γ on cell signaling occurred within hours in culture and was detected in vivo a month after vaccinations had ended. A broad attenuation of cell signaling, especially in pathways to which growth had become addicted, has been shown to leave the cell vulnerable to death, that is, oncogenic shock.43 We questioned whether this potential could be exploited by concurrent use of cytotoxic therapies.
Employing vaccines as a way to generate Th1, we studied the antitumor effects of type I immunity using different antigens as immunogens to prime Th1 (IGF-1R and HIF-1a) and evaluated concurrent chemoimmune therapy in two different models: TgMMTV-neu and C3(I)-Tag murine mammary cancers representing luminal B and basal phenotypes, respectively. Both tumor types are resistant to biological therapy and chemotherapy. Administration of these agents in combination with the generation of tumor trafficking Th1, however, resulted in complete or near complete antitumor responses. These data may mirror reports of surprising clinical responses to salvage chemotherapy in patients with lung cancer after they had been treated with immunotherapy. The oncogenic pathways shown in our models are similarly important in lung cancer. One report of 73 patients noted that objective response rates after salvage chemotherapy were nearly doubled in patients previously treated with PD-1 or program death ligand-1 (PD-L1) inhibitors (68%) compared with patients who had not had immune therapy (40%).44 Another retrospective analysis suggested that patients with lung cancer who underwent salvage chemotherapy are 30% more likely to have an objective response if they had previously been treated with an immune checkpoint inhibitor than if they did not undergo an immunomodulation.45 We would hypothesize the patients’ tumors were made more responsive to elimination by chemotherapy by Type I T cells evoked by immune checkpoint blockade. We did not evaluate changes in the tumor microenvironment related to the potential upregulation of PD-L1/PD-1 in response to IFN-γ secretion or the accumulation of T-regulatory cells or myeloid-derived suppressor cells in response to inflammation elicited by vaccination.46 Immune regulation induced by high local levels of IFN-γ in the tumor could limit the duration of clinical response.
Over the past several years, the components of an effective antitumor immune response have been increasingly defined: high numbers of type I T cells capable of penetrating into the tumor parenchyma.47 Studies such as this demonstrate the potential clinical activity of type I T cells extends beyond direct tumor killing and that immune therapies designed to increase type I T cells could be integrated into standard chemotherapy regimens to enhance therapeutic efficacy.
Supplemental material
References
Supplementary materials
Supplementary Data
This web only file has been produced by the BMJ Publishing Group from an electronic file supplied by the author(s) and has not been edited for content.
Footnotes
Contributors DC designed and performed experiments, interpreted data, and wrote the manuscript. KHP and BC conducted in vitro experiments. LC performed in vivo experiments. MD designed the experiments, interpreted the data, and wrote the manuscript.
Funding This work was supported by a grant from the Ovarian Cancer Research Fund, NCI contract N01-CN-53300/WA#10, NCI R01 CA101190, and NCI U01 CA141539 (all MD), and DOD Postdoctoral Fellowship W81XWH-10-1-0700 (DC). MD is supported by the Athena Professorship for Breast Cancer Research and an American Cancer Society Clinical Professorship.
Competing interests DC and MD are inventors on patents held by the University of Washington, and MD holds stock in Epithany. Epitope sequences presented have been included in the US patent 61/972,176.
Patient consent for publication Not required.
Ethics approval Animal care and use were within institutional guidelines. Work described was performed in accordance with the University of Washington Institutional Animal Care and Use Committee guidelines and considered to be under the U.S. Department of Agriculture pain and distress category C.
Provenance and peer review Not commissioned; externally peer reviewed.
Data availability statement The datasets used and/or analyzed during the current study are available from the corresponding author on reasonable request.
Supplemental material This content has been supplied by the author(s). It has not been vetted by BMJ Publishing Group Limited (BMJ) and may not have been peer-reviewed. Any opinions or recommendations discussed are solely those of the author(s) and are not endorsed by BMJ. BMJ disclaims all liability and responsibility arising from any reliance placed on the content. Where the content includes any translated material, BMJ does not warrant the accuracy and reliability of the translations (including but not limited to local regulations, clinical guidelines, terminology, drug names and drug dosages), and is not responsible for any error and/or omissions arising from translation and adaptation or otherwise.