Article Text

Abstract
Background Resistance to therapy is a major problem in treating head and neck squamous cell carcinomas (HNSCC). Complement system inhibition has been shown to reduce tumor growth, metastasis, and therapeutic resistance in other tumor models, but has yet to be explored in the context of HNSCC. Here, we tested the effects of complement inhibition and its therapeutic potential in HNSCC.
Methods We conducted our studies using two Human Papilloma Virus (HPV)-negative HNSCC orthotopic mouse models. Complement C3aR and C5aR1 receptor antagonists were paired with radiation therapy (RT). Tumor growth was measured and immune populations from tumor, lymph node, and peripheral blood were compared among various treatment groups. Genetically engineered mouse models DEREG and C3-/- were used in addition to standard wild type models. Flow cytometry, clinical gene sets, and in vitro assays were used to evaluate the role complement receptor blockade has on the immunological makeup of the tumor microenvironment.
Results In contrast to established literature, inhibition of complement C3a and C5a signaling using receptor antagonists accelerated tumor growth in multiple HNSCC cell lines and corresponded with increased frequency of regulatory T cell (Treg) populations. Local C3a and C5a signaling has importance for CD4 T cell homeostasis and eventual development into effector phenotypes. Interruption of this signaling axis drives a phenotypic conversion of CD4+ T cells into Tregs, characterized by enhanced expression of Foxp3. Depletion of Tregs reversed tumor growth, and combination of Treg depletion and C3a and C5a receptor inhibition decreased tumor growth below that of the control groups. Complete knockout of C3 does not harbor the expected effect on tumor growth, indicating a still undetermined compensatory mechanism. Dexamethasone is frequently prescribed to patients undergoing RT and inhibits complement activation. We report no deleterious effects associated with dexamethasone due to complement inhibition.
Conclusions Our data establish Tregs as a pro-tumorigenic driver during complement inhibition and provide evidence that targeted C3a and C5a receptor inhibition may add therapeutic advantage when coupled with anti-Treg therapy.
- tumor microenvironment
- radiotherapy
- immunotherapy
- T-lymphocytes
Data availability statement
Data are available on reasonable request. All data relevant to the study are included in the article or uploaded as supplementary information. The data of this study are available from the corresponding author on request (sana.karam@cuanschutz.edu).
This is an open access article distributed in accordance with the Creative Commons Attribution Non Commercial (CC BY-NC 4.0) license, which permits others to distribute, remix, adapt, build upon this work non-commercially, and license their derivative works on different terms, provided the original work is properly cited, appropriate credit is given, any changes made indicated, and the use is non-commercial. See http://creativecommons.org/licenses/by-nc/4.0/.
Statistics from Altmetric.com
Introduction
Head and neck squamous cell carcinomas (HNSCC) can be characterized by their proclivity to develop immunologically cold tumors, resulting in poor response to immunotherapy.1 Radiation therapy (RT), a staple in treatment regimens, is typically paired with chemotherapies and immunotherapies to give additional punch to treatments and help reinvigorate a robust immune response.2 Even with sophisticated combination therapies, treatments still fail, mainly through the development of resistance to therapies.2 3 Resistance is likely mediated by acting on both innate and adaptive immune populations, changing the landscape of the tumor microenvironment (TME).4 However, the exact mechanisms behind this resistance remain unknown, highlighting the immediate need for novel therapeutic approaches to augment established treatment modalities.
The complement system, an arm of the innate immune system, is a collection of serum bound proteins organized into a proteolytic cascade. Induction of the complement system occurs through three unique pathways, classical, mannose-binding lectin, and alternative.5 These pathways converge on a central component C3, resulting in the clearance and lysis of target cells, and acts as an interface between the innate and adaptive immune responses.5–7 Due to its essential role in bridging innate and adaptive immunity, complement activation was initially hypothesized to play an important role in providing a robust antitumor response, based on its ability to recognize self from non-self and the immunomodulatory capabilities of complement anaphylatoxins.8 9 Recent studies instead paint a more confusing role of complement activation promoting and potentiating tumor growth,10–13 and while a small subset does characterize antitumor capabilities of complement,14 the overwhelming majority implicate complement in a pro-tumorigenic role.
In HNSCC, pathway15 and transcriptome analysis using The Cancer Genome Atlas (TCGA) and additional clinical datasets reveal an inverse relationship between elevated complement gene expression and survival prognosis. While the efficacy of complement inhibition in reducing tumor burden has been demonstrated in various cancer models,10 11 14 16 there is a scarcity of complement literature in HNSCC. Manipulating complement activation in HNSCC is a prospect that, to our knowledge, has yet to be pursued and could represent a new immunotherapeutic to be used in tandem with RT to improve patient outcomes.
Here, we establish that complement fragments, C3a and C5a, play a pro-tumorigenic role in HNSCC, challenging the axiom that pharmacological inhibition and/or genetic knockout of complement invigorates a robust antitumor immune response.10 11 13 16 Inhibition of C3a receptor (C3aR) and C5a receptor 1 (C5aR1) signaling induces conversion of CD4+ T cells into immunosuppressive regulatory T cells (Tregs) through elevated expression of Foxp3, leading to accelerated tumor growth.
Also investigated is the use of dexamethasone, a glucocorticoid17 and known inhibitor of complement activation,18 19 and the potential negative effects it may confer to overall treatment efficacy through decreased C3a and C5a signaling. This is highly relevant translationally as dexamethasone is commonly prescribed to cancer patients, particularly in palliating symptoms of patients with HNSCC undergoing RT.
Methods
Mouse and cell lines
C57BL/6 and Balb/c mice were purchased from the Jackson Laboratory (Bar Harbor, Maine, USA). C3 -/- mice were provided in collaboration with Raphael Nemenoff at University of Colorado, Anschutz Medical campus. C3-/- mice were bred on a C57BL/6 background. Depletion of regulatory T cell (DEREG) mouse colonies were bred and maintained by our lab and were bred on a C57BL/6 background. All protocols for animal tumor models were approved by the Institutional Animal Care and Use Committee (IACUC) of the University of Colorado Anschutz Medical Campus.
MOC2 and LY2 head and neck squamous cell carcinoma cell lines were used for these studies. Both cell lines were cultured at 37°C and 5% CO2 using appropriate media (DMEM-F12 for LY2 and IMDM for MOC2) supplemented with 10% FBS and 1% primocin as previously reported.3
In vivo experiments
C3a and C5a receptor antagonists were prepared using sterile DPBS (GIBCO, Waltham, Massachusetts, USA) and diluted to a working stock of 1 mg/kg of body weight. Antagonists were injected i.p. daily (Monday–Friday) beginning the day after tumor implantation, concluding at the time of sacrifice. Mice were given 10 Gy RT on day 7 and another 8 Gy on day 15 for MOC2 and 10 Gy on day 14 for LY2. Dexamethasone was administered daily via oral gavage at a concentration of 0.3 mg/kg beginning the day prior to RT. RT was administered at 10 Gy on day 12 followed by another dose of 8 Gy on day 25. Tumor measurements were conducted twice weekly with digital calipers, and tumor volumes were calculated using the longer and shorter diameters of the tumor (V=[A×B2/2 mm3), as previously reported.3 Diphtheria toxin (DT), when indicated was injected beginning 2 days before implantation via i.p. at a concentration of 1 µg/ml. Dose concentration was then reduced to 0.5 µg/ml for the remainder of the study. Wild type (WT) C57Bl/6 and C3 knockout (KO) mice were orthotopically implanted with MOC2 cancer cells and treated with a dose of 10 Gy RT on day 7 post implantation. Mice exhibiting signs of morbidity according to the guidelines set by the IACUC were sacrificed immediately. Primary tumors were harvested on sacrifice and either flash frozen in liquid nitrogen or fixed using 10% formalin. All protocols for animal tumor models were approved by the IACUC of the University of Colorado Anschutz Medical Campus. Catalog numbers and commercial source of drugs and compounds used can be found in online supplemental table 2.
Supplemental material
In vitro experiments
CD4 T cells were isolated from irradiated, tumor bearing mouse spleens and lymph nodes (LNs) using a negative selection cocktail (Stemcell, Vancouver, British Columbia, USA). Isolated T cells were activated with αCD3, αCD28 (3 µg/mL), recombinant IL-2 (5 ng/mL), C3a (10 nM) and C5a (10 nM) receptor antagonists, and TGF-βR1 inhibitor (10 µM) and cultured at 37°C for 48 hours. Cells were then stimulated with cell activation cocktail and incubated at 37°C for 4 hours. Conditioned media was collected, and cells were stained with AlexaFluor 532-Foxp3 and analyzed using a Cytek Aurora spectral cytometer (Cytek Biosciences, Fremont, California, USA).
ELISA Assay
Blood was collected at the time of sacrifice and centrifuged to obtain serum. ELISA of IL-10 was performed following manufacturer’s instructions (Bosterbio, Pleasanton, California, USA).
Irradiation
Irradiation was performed using the PXi-225Cx image guided irradiator (Precision X-Ray, North Bradford, Connecticut, USA) at 225 kV with a 0.3 mm Cu filter. Mice were positioned in the prone position and irradiation was delivered at a dose rate of 5.6 Gy/min. Radiation plan was based on Monte Carlo simulation using a CT of a model mouse. Dose rates are checked monthly using an ionization chamber.
Flow cytometry
Flow cytometric analysis of tumor tissue and LNs was performed by digesting tumors, LNs, and peripheral blood into single cell suspension. Receptor antagonists were administered daily (Monday–Friday) via i.p. injection, beginning 1-day post implantation. Tumor size was monitored and mice were sacrificed and tissue harvested 3 days post-RT. Tumors were chopped and placed in Hanks basic salt solution (ThermoFisher, Waltham, Massachusetts, USA) along with 500 µL of collagenase III (Worthington Biochemical, Lakewood, New Jersey, USA) and incubated for 30 min at 37°C. After incubation, tumor tissue was mechanically processed through 70 µm cells strainers to obtain single cell suspension. Collected LNs were mechanically processed into single cell suspension using similar process. Red blood cells were lysed with red blood cell lysis buffer (Invitrogen, Carlsbad, California, USA) in peripheral blood, and tumor samples as needed. After processing, cells were plated in 24-well plates with cell activation cocktail containing Brefeldin A and golgi-stop solution containing monensin to stimulate cytokine production and prevent release of cytokines, respectively, and cultured for 4 hours at 37°C. After incubation, cells were transferred to 96 well plates and blocked with CD16/CD32 (Tonbo Bioscience, San Diego, California, USA) FC block solution. List of antibodies used can be found in online supplemental table 2. Cells were fixed and permeabilized using Foxp3/transcription factor staining kit (Invitrogen, Carlsbad, California, USA) prior to intracellular staining. For gating, fluorescence minus one controls were used. Samples were run on a Cytek Aurora spectral analyzer (Cytek Biosciences, Fremont, California, USA) at the Barbara Davis Center Flow Cytometry Core at the University of Colorado Anschutz Medical. Data were analyzed using Flowjo software V.10.7.1 (Ashland, Oregon, USA)
The Cancer Genome Atlas (TCGA) and hallmark pathways analysis
The HNSCC dataset was downloaded from TCGA and gene expression was sorted according to average expression of relevant complement genes. Patients were sorted by median expression levels and assessed for overall survival (OS) and disease-free survival (DFS). Survival statistical significance was analyzed using Kaplan-Meier curves and were assessed using log rank Mantel-Cox test. Hazard ratio’s (HR) were generated between pairs of groups.
Statistical analysis
Unpaired t test was used to compare means between two groups. All statistical tests were two sided and a p value of less than 0.05 was considered to be statistically significant. All statistical analyses were performed in Prism software (GraphPad, V.9.0.1).
Results
Pathway and transcriptome analysis of human gene sets reveals an inverse correlation between complement activation and survival outcome in HNSCC
Upon hallmark pathways analysis of clinical patient datasets from pretreatment tumors of 40 locally advanced patients with oral cavity cancer,20 we observed that complement is highly upregulated in patients with HNSCC with instances of recurrence, corresponding with reduced OS (online supplemental figure 1). Using the TCGA, we found that increased expression of complement C5a receptor 1 (C5aR1) is indicative of a reduction in OS and a statistically significant decrease in DFS (figure 1A,B). These data collectively suggested that complement activation may negatively modulate the immune response in HNSCC, leading us to further investigate the role it plays in this disease.
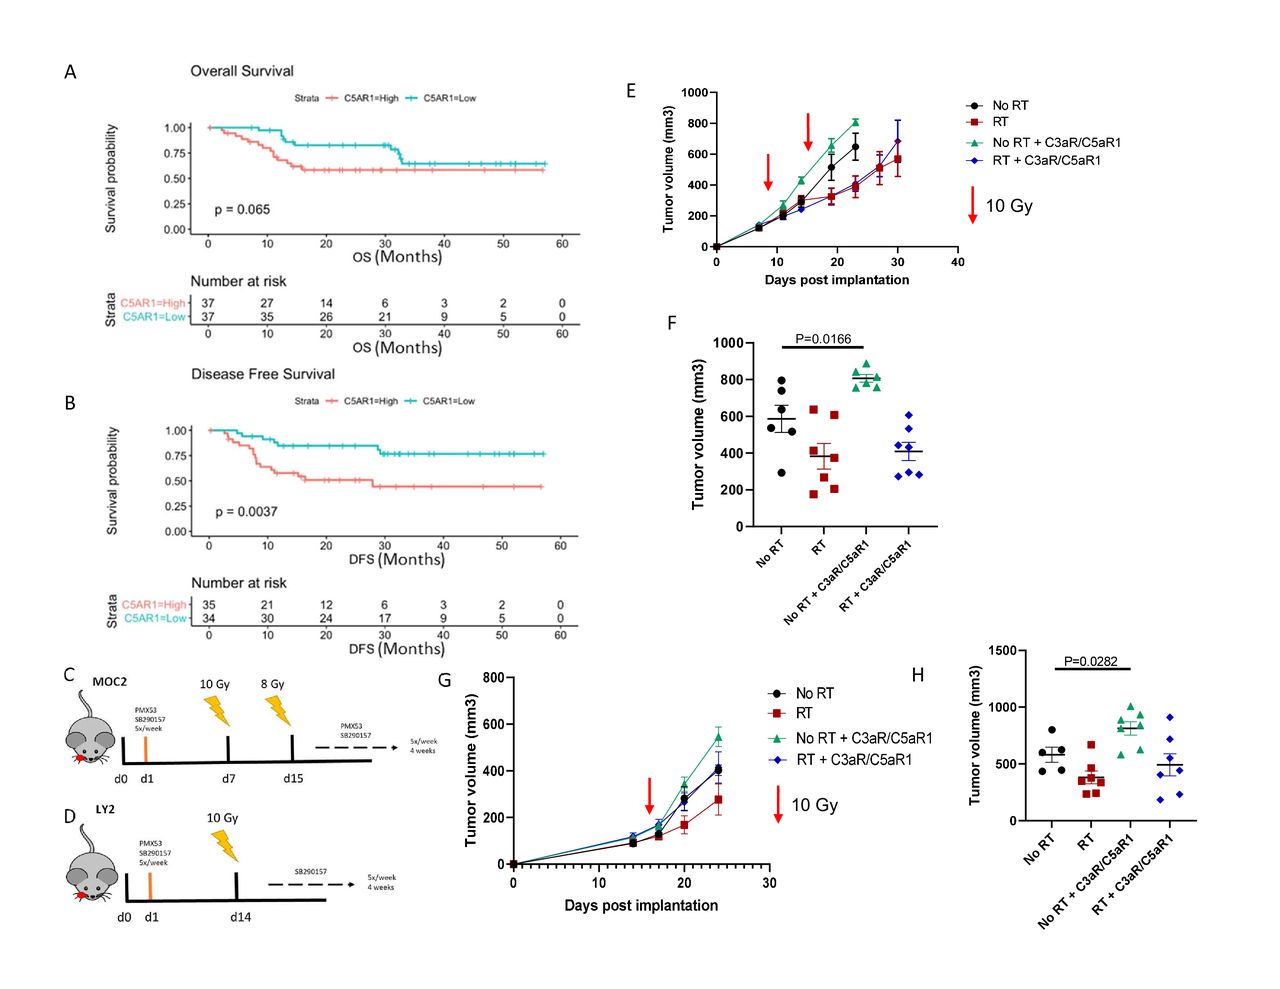
Inhibition of complement C3a and C5a receptors accelerates tumor growth in HNSCC models. (A,B) Overall (p=0.06, 95% CI 0.43 to 0.86, HR=2.28) and disease-free (p=0.003, 95% CI 0.29 to 0.94, HR=3.07) survival plots of C5aR1 expression in HPV-negative patients with HNSCC. (C) Tumor growth analysis of MOC2 (C57Bl/6) tumor bearing mice. Mice received C3a and C5a receptor antagonists starting the day after tumor implantation. Mice received 10 Gy RT on day 7 and 8 Gy RT on day 14. Receptor antagonists were administered 5×/week, beginning 1-day post implantation, for the duration of the study. (D) Tumor growth analysis of LY2 (Balb/c) tumor bearing mice. Mice received C3a and C5a receptor antagonists starting the day after tumor implantation. Mice received 10 Gy RT 14 days post implantation. Receptor antagonists were administered 5×/week, beginning 1-day post implantation, for the duration of the study. (E,F) Growth curves and tumor volumes of MOC2 tumors on day 23 post implantation. (G,H) Growth curves and tumor volumes of LY2 tumors on day 28 post implantation.
Inhibition of complement C3a and C5a receptors accelerates tumor growth in HNSCC
Due to the observed negative prognostic relationship of C5aR1 with OS and DFS, we sought to determine the effect that complement C3a and C5a receptor inhibition has on tumor growth. Although C3a receptor (C3aR) expression did not exhibit a statistically significant correlation with patient outcome, we still wished to examine the biological effect of C5aR1 and C3aR inhibition. Tumors were implanted into the buccal mucosa of wild type C57BL/6 and Balb/c mice and C3aR and C5aR1 antagonists were administered beginning 1 day post implantation (figure 1C,D). Contrary to our hypothesis, inhibition of C3aR and C5aR1 resulted in accelerated tumor growth in MOC2 implanted C57BL/6 mice (figure 1E,F). Non-irradiated mice treated with C3aR and C5aR1 inhibitors displayed a significant increase in tumor volume compared with the non-irradiated control group (figure 1E). This same effect was observed in LY2 cancer cell model, with a significant increase in tumor volume in the non-irradiated group treated with complement receptor inhibitors (figure 1G,H).
Inhibition of C3a/C5a signaling axis leads to an increase in regulatory T cells
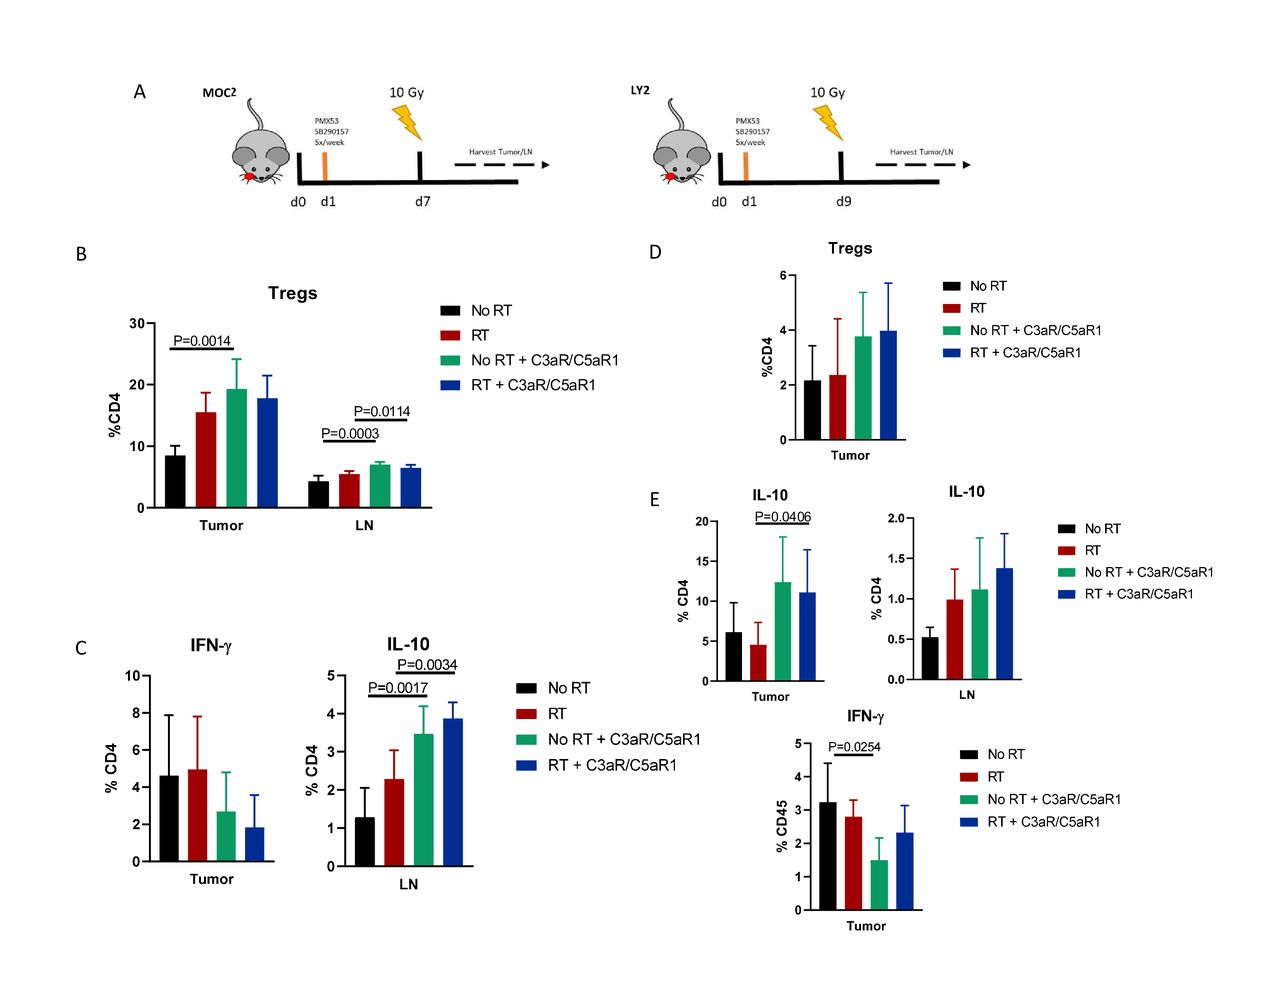
Based on these unexpected results, especially given the abundance of literature showing a beneficial effect of complement inhibition,10 11 13 14 16 using flow cytometry we sought to determine mechanisms behind the observed increased tumor growth (figure 2A). Compared with controls, administration of C3aR and C5aR1 inhibitors resulted in significant increase in Tregs in both tumor and tumor draining LN (figure 2B). Tregs were also increased in the LN when C3aR and C5aR1 inhibitors were added to RT. CD4+ T cells in the tumor displayed increased IL-10 in both irradiated non-irradiated groups, alongside a trending decrease in IFN-γ (figure 2C), suggesting a shift to a more immunosuppressive TME resulting from C3aR and C5aR1 inhibition. Immune populations harvested from LY2 tumor bearing mice showed similar characteristics, with a trending increase in tumoral Treg frequency, though not statistically significant (figure 2D). Expression of IL-10 was similarly increased in CD4+ populations in tumor and LN, as well as decreased IFN-γ production in tumoral CD4+ T cells from non-irradiated mice (figure 2E). These data suggest an increase in Tregs and subsequent immunosuppression as a potential driver of increased tumor growth.

Inhibition of C3a/C5a signaling axis leads to an increase in regulatory T cells. (A) Timeline and illustration of treatment schedule. Receptor antagonists were administered 5×/week, beginning 1-day post implantation, for duration of study. Tissue was harvested 3 days post-RT. (B) Flow cytometric analysis of regulatory T cell populations in MOC2 tumor and lymph nodes. Tregs are defined as CD45+,CD3+, CD4+,Foxp3+ (online supplemental figure 3). (C) Expression levels of IFN-γ and IL-10 among CD4 populations. (D) Analysis of Treg populations of LY2 tumor and lymph nodes. Tregs were defined as per figure 2B. (E) Expression of IL-10 produced by CD4 populations in tumor and lymph node. IFN-γ expression in tumoral CD4 T cells.
Blockade of C3a and C5a signaling results in increased Foxp3 expression and a conversion of CD4+ T cells into regulatory T cells
We next sought to elucidate the mechanism behind the increase in Tregs when complement signaling is inhibited. Signaling through C3aR and C5aR1 from locally produced complement assist in modulating T cell function and regulation,21 and absence of C3a and C5a signaling in T cells induces development of Tregs, rather than T effectors.22 23 Seeing as we observed an increase in Tregs when blocking C3aR/C5aR1 signaling, we investigated if T cells were undergoing a similar process in our tumor model (figure 3A). CD4+ T cells cultured in the presence of both C3aR and C5aR1 antagonists exhibited significantly higher frequency of Foxp3 expression compared with the control (figure 3B). Individual inhibition of either C3aR or C5aR1 resulted in modest increase in Treg frequency but failed to induce the same magnitude of phenotypic conversion as seen with dual inhibition (figure 3B). C5aR1 inhibition resulted in a significant increase in Treg frequency, indicating that C5a exhibits a stronger influence on T cell—Treg conversion. Incubation with a TGF-β1 receptor inhibitor negated the phenotypic conversion of T cells into Tregs, indicating that this process may be reliant on autocrine TGF-β signaling (figure 3B). Furthermore, analysis of cytokine production revealed elevated IL-10 with receptor inhibitors (online supplemental figure 4).
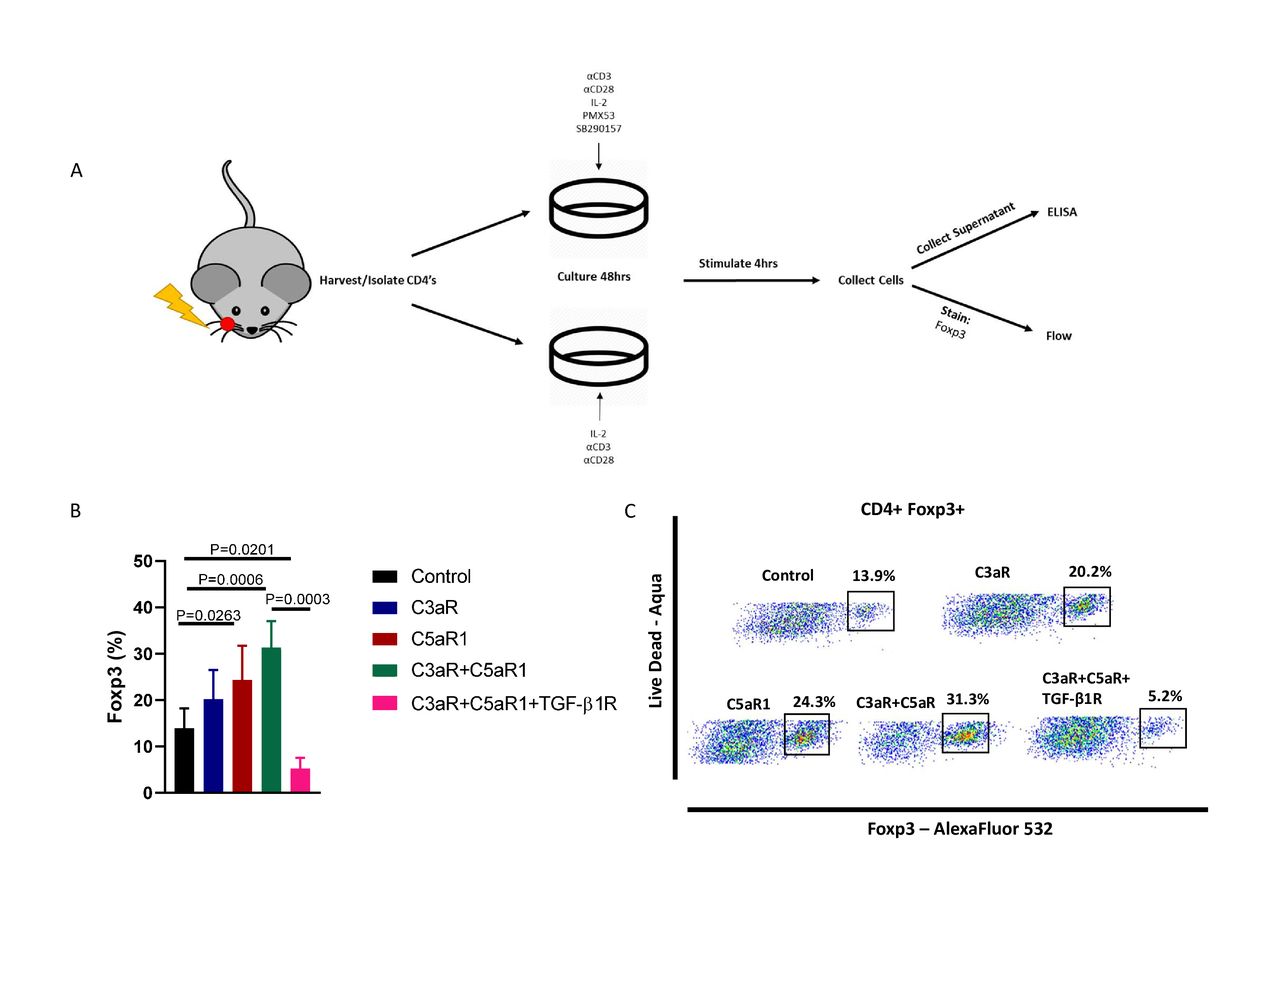
Blockade of C3a and C5a signaling results in increased Foxp3 expression and a conversion of CD4+ T Cells into regulatory T cells. (A) Illustrated outline of assay. CD4 T cells were isolated from irradiated, tumor bearing mice and cultured for 48 hours with α-CD3, α-CD28, IL-2, C3aR/C5aR1, and TGF-βR1 inhibitors either alone or in combination. After incubation cells were stimulated for 4 hours, collected, and stained for Foxp3 expression. (B) Frequency of Foxp3 expression of CD4+ T cells in control, C3aR inhibitor only, C5aR1 inhibitor only, C3aR+C5aR1 inhibitors, and C3aR+C5aR1+TGF-βR1 inhibitor groups. Gating strategy can be found in online supplemental figure 4). (C) Representative scatter plots demonstrating C3aR-C5aR1 inhibitor mediated conversion.
Ablation of regulatory T cells reverses C3aR/C5aR1 inhibitor induced tumor growth
To validate the involvement of Tregs in accelerating tumor growth on C3aR and C5aR1 signaling inhibition, we predicted that depletion of Treg populations would reverse the negative effects of C3a and C5a receptor inhibition. To test this, we used a DEREG mouse model24 which has Diphtheria toxin (DT) receptor genetically linked to cells expressing Foxp3, allowing for depletion of Treg populations upon injection with diluted DT. WT and DEREG mice were treated with a combination of DT and complement inhibitors (figure 4A). Treatment with combination C3aR and C5aR1 inhibitors and DT reverses the WT effect of receptor inhibition and results in a significant reduction in tumor growth (figure 4B). Flow cytometric analysis reveals a significantly increased frequency of activated CD4+ T cells in the LN, and overall increase in both intratumoral CD4 and CD8 T cells (figure 4C). Analysis of Tregs in peripheral blood highlights the conversion capabilities of complement inhibition, with a significant increase in Treg frequency upon the addition of C3aR/C5aR1 inhibitors in DEREG mice (figure 4C). Elevated IFN-γ and reduced IL-10 production from CD4 T cells indicates a shift towards effector T cell phenotypes when administering C3aR/C5aR1 inhibitors in the absence of Tregs (figure 4D). These results further implicate T cell–Treg conversion via blockade of C3aR/C5aR1 signaling as being responsible for the observed increase in tumor growth.
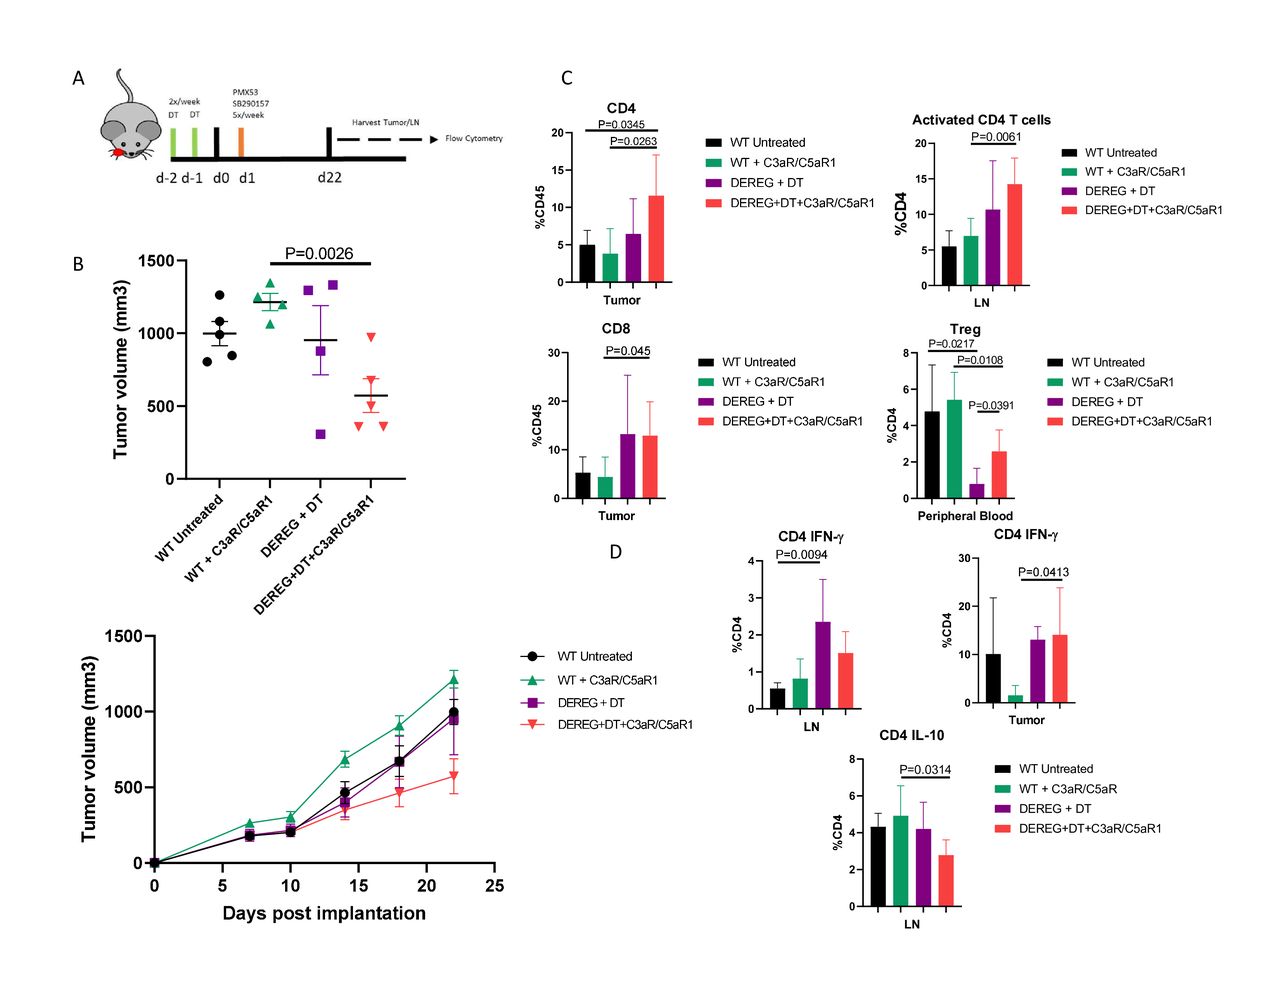
Ablation of regulatory T cell populations reverses C3aR and C5aR1 inhibitor driven tumor growth. (A) Timeline and illustration of treatment schedule. Receptor antagonists were administered as per previous experiments. Diphtheria toxin (DT) was given 2 days prior to implantation to deplete Tregs, and continued two times a week until the conclusion of the study. (B) Tumor volumes and growth curves on day 22 post implantation. (C) Flow cytometric analysis of immune populations of effector T cell and Treg populations in tumor, lymph node, and peripheral blood. CD4 T cells can be defined as CD45+ CD3+ CD4+. CD8 T cells are defined as CD45+ CD3+ CD8+. Tregs are defined as CD45+ CD3+ CD4+ Foxp3+. Activated CD4 T cells are defined as CD45+ CD3+ CD4+ CD69+. Gating strategy and representative plots can be found in online supplemental figure 5. (D) Levels of IFN-γ and IL-10 in tumor and lymph node.
Genetic knockout of complement C3 does not significantly alter tumor growth
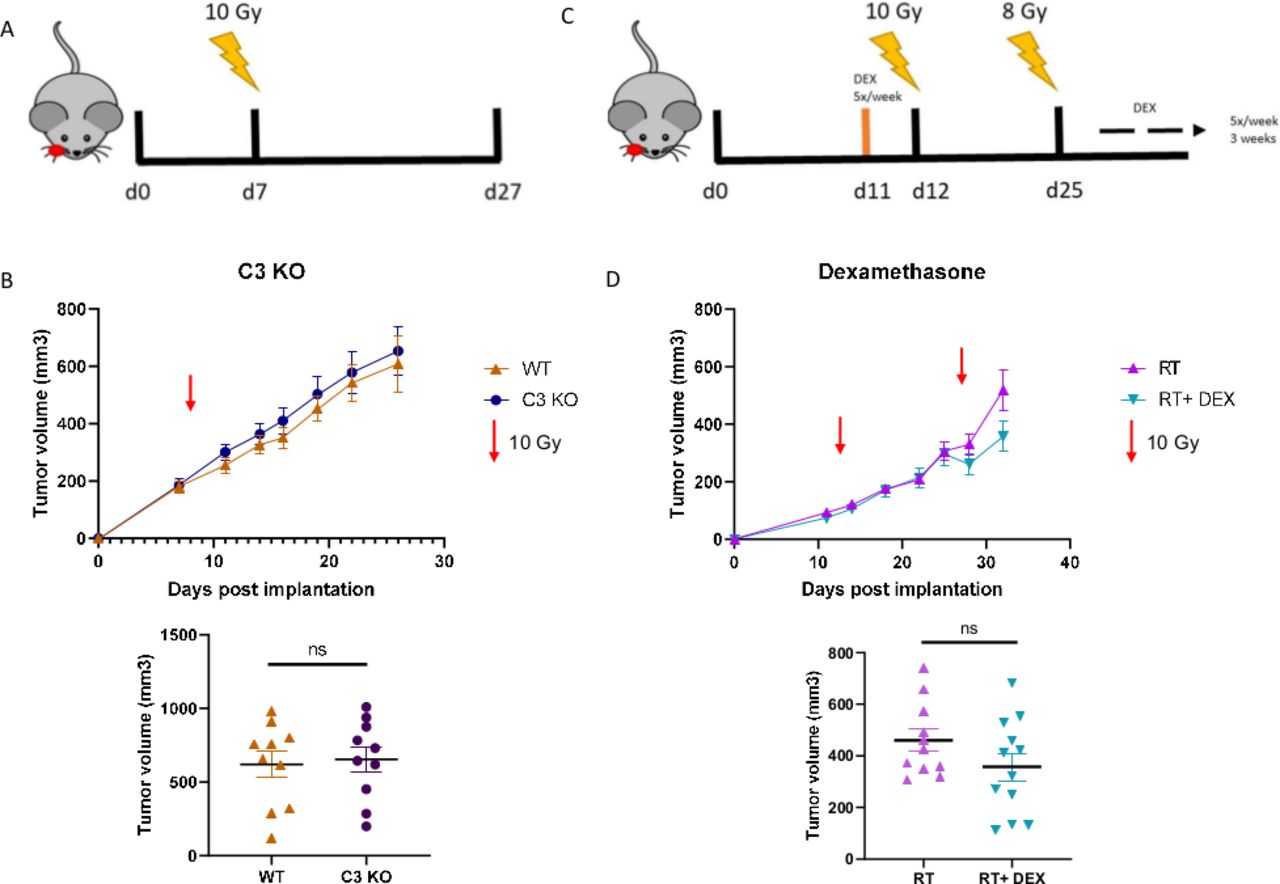
We next evaluated the tumor growth effect of complete complement inhibition via C3 genetic knockout mouse model. Wild type C57Bl/6 and C3 KO mice were orthotopically implanted with MOC2 cells (figure 5A). While the C3 KO mice did exhibit slightly larger tumors by the end of the study, the difference between groups was not significant (figure 5B). Furthermore, TCGA analysis in HPV-negative patients with HNSCC does not show a significant correlation between OS/DFS and C3 expression (online supplemental figure 6). Overall, these data conclude that complete abrogation of C3 does not have a substantial effect on HNSCC tumor growth results, unlike our pharmacological inhibitor results and the previously reported results of C3aR and C5aR1 inhibition.10 14 25

Neither genetic KO of complement C3 or inhibition via dexamethasone, a known complement inhibitor, significantly alter tumor growth. (A) Timeline and illustration of treatment schedule. Mice received 10 Gy RT on day 8 post implantation. (B) Tumor growth analysis of MOC2 implanted WT and C3 KO mice. Tumor volumes between groups on day 26, final day all mice were still alive. (C) Timeline and illustration of treatment schedule. Mice received DEX starting 1 day before RT. Mice received 10 Gy RT on day 12 and an additional 8 Gy RT on day 25. Dexamethasone was administered via gavage 5×/week, beginning 1 day before the start of RT, for the duration of the study. (D) Tumor growth analysis of LY2 (Balb/c) tumor bearing mice and tumor volumes on day 32.
The impact of dexamethasone, a known complement inhibitor, on tumor growth
Dexamethasone, a glucocorticoid with potent anti-inflammatory properties commonly prescribed to patients to palliate RT-related symptoms, is a known inhibitor of complement activation18 19 and has been shown in a previous study to limit the efficacy of RT.14 Given our results (figure 1), this begged the question of whether or not the administration of dexamethasone is detrimental to overall treatment efficacy of RT by inhibition of complement C3a and C5a signaling and accelerating tumor growth (figure 5C). Though dexamethasone can inhibit complement activation, it does not appear to provide inhibition sufficient enough to affect tumor growth (figure 5D). This result is of great translational significance due to the widespread use of dexamethasone to treat symptoms associated with RT.
Discussion
Despite preliminary analysis of complement expression indicating an inverse relationship between complement expression and survival outcome, complement activation appears to possess an opposing role in HNSCC. Our data show that inhibition of complement C3a and C5a receptor signaling influences the immunological makeup of the TME and is associated with increased tumor growth. This appears to be mediated, at least partly, through C3a and C5a signaling in CD4+ T lymphocytes.
The conversion of CD4+ T cells into Tregs in the absence of C3a and C5a receptor signaling has been observed in numerous studies.21 22 26 Circulating liver derived complement is pivotal for the proper clearance of foreign pathogens, whereas local, cell-derived complement harbor essential functions in regulating adaptive immunity.27 Locally produced C3a and C5a can provide costimulatory signals,28 restrict Foxp3 expression, and push-naive CD4+ T cell development towards TH1 and TH17 phenotypes.22 23 29 Foxp3 expression becomes elevated upon interruption of C3a and C5a signaling, resulting in a phenotypic shift and conversion of CD4+ T cells into CD4+ Foxp3+ regulatory T cells, and a corresponding increase in the immunosuppressive cytokine IL-10.22
The ablation of Treg populations using DEREG mouse model support our findings that an increase in Tregs were driving the accelerated tumor growth upon C3aR and C5aR1 inhibition. Depletion of Tregs reversed the effect of C3aR and C5aR1 inhibition, reducing tumor growth to below that of the untreated control group. Previous publications from our lab established using α-CD25 therapy to deplete Tregs increases treatment efficacy and induces a robust anti-tumor immune response when paired with RT.3 Reversed tumor growth and increase in effector T cell populations upon Treg depletion via DT reinforces the notion that Tregs dampen a robust immune response and effective tumor cell clearance. Furthermore, in models of lung11 and cervical cancer,10 C3aR and C5aR1 are associated with an increase in MDSCs in the tumor, limiting T cell effector functions. Inhibition of C3aR and C5aR1 signaling reduces influx of myeloid-derived suppressor cells (MDSCs) and helps restore effector T cell populations, producing a strong antitumor immune response. The significant reduction in tumor growth through the addition of C3aR and C5aR1 inhibitors suggests that complement inhibition could be a viable new immunotherapy to supplement existing treatment when used in conjunction with anti-Treg therapy.
While we observed an acceleration in tumor growth when inhibiting C3aR/C5aR1 signaling, the same effect was not reciprocated in genetic C3 KO mice, a rather puzzling result. C3 is arguably the most important component of the complement cascade as it is the converging step for all three induction pathways. Without C3, the cascade will stall shortly after induction, leading to impairment of opsonization, lysis of target cells, and importantly for this study, generation of C3a and C5a signaling molecules. Thus, it would be expected that effects of C3aR/C5aR1 inhibition would mimic that of complete abrogation of C3, and vice versa. Yet it does not. Why then does a knockout model devoid of the most essential complement component, and one that is necessary in the formation of C3a and C5a, fail to exhibit to same induction of tumor growth as seen with pharmacological inhibition of anaphylatoxin receptors?
As discussed earlier, while complement components are primarily produced in the liver, complement is also produced and secreted locally by many cell types,21 22 30 including cancer cells.14 31 Tumor bearing C3 KO mice will not be entirely deficient in C3, possibly allowing for local activation and proper continuation of the cascade, ultimately resulting in production of C3a and C5a. This raises the possibility that local C3a and C5a production via implanted tumor cells is sufficient to maintain regular homeostatic C3a and C5a signaling in T cells, restricting Foxp3 expression and subsequent Treg conversion. Another potential explanation could be that C5a signaling remained intact through C5 cleavage via coagulation cascade factors. Plasmin and thrombin, coagulation cascade proteases, can enzymatically cleave C3 and C5 into biologically active, functional fragments.32 Our data support the hypothesis that C5aR1 signaling is in fact the primary component behind the described conversion. Therefore, proteolytic cleavage of C5, either through tumor derived complement convertases or non-classical activation via the coagulation system may provide sufficient signaling to prevent conversion of CD4+ T cells into Tregs. Together, this could perhaps explain the discrepancies between our C3 KO and pharmacological inhibitor studies.
The administration of the glucocorticoid dexamethasone is commonplace to treat symptoms associated with RT. Surace et al demonstrated that dexamethasone administered during treatment with RT diminished the efficacy of the RT significantly. RT has been shown to transiently induce local expression and activation of complement,14 25 which taken with our results indicates that dexamethasone may be limiting the efficacy of RT. Clinically, this is of great importance given that RT is standard of care among patients with HNSCC and is vital in invigorating a robust immune response in these immunologically poor tumors. However, our results suggest that there is no significant decrease in efficacy because of dexamethasone. There is the potential that in a similar manner to our C3 KO model, because dexamethasone primarily inhibits the alternative pathway, C5a signaling remains intact and therefore does not exhibit the effector-Treg shift seen in using pharmacological C3aR and C5aR1 inhibitors. However, this could also suggest that the discrepancies may be specific to individual tumor models, rather than interactions among the complement-RT axis. Importantly, we have established that administration of dexamethasone in preclinical models receiving RT does not appear to instill any deleterious effects due to inherent inhibition of complement activation in HNSCC, though whether these results are context dependent based on tumor model and RT dosage remains to be seen.
Even though complete genetic knockout of C3 failed to elicit a similar effect, our data paints a picture of the effects of complement activation inside the TME in HNSCC. Originally proposed as a tumor reducing immunomodulatory agent, blockade of C3a and C5a signaling corresponds with enhanced expression of Foxp3 in CD4+ T cells, inducing conversion into regulatory T cells. The conversion of CD4’s into Tregs ultimately increases tumor growth in two different preclinical models of HNSCC. Complete ablation of Treg populations reverses this effect, reinforcing the idea that Tregs are the primary drivers behind the increased tumor growth. However, the contrasting effects between C3 KO and pharmacologic inhibition cannot be ignored, and points to an unknown compensatory mechanism yet to be elucidated. Reduced tumor growth in the absence of Tregs during C3aR and C5aR1 inhibition lends credence to the idea of complement inhibition being a potential new therapeutic strategy, capable of delivering durable tumor control when combined with anti-Treg therapy and RT.
Data availability statement
Data are available on reasonable request. All data relevant to the study are included in the article or uploaded as supplementary information. The data of this study are available from the corresponding author on request (sana.karam@cuanschutz.edu).
Acknowledgments
The University of Colorado Diabetes Research Center Flow Cytometry Core. NIDDK (P30-DK116073).
References
Supplementary materials
Supplementary Data
This web only file has been produced by the BMJ Publishing Group from an electronic file supplied by the author(s) and has not been edited for content.
Footnotes
TEB, LBD and MWK contributed equally.
Contributors JG was responsible for manuscript preparation and editing, experimental design and execution, and data analysis. TEB, MWK, and LBD were responsible for manuscript editing and data analysis. SB, MP, SB, DN, and VN were responsible for manuscript editing. BVC was responsible for experiments involving radiation. EKK and RAN provided council for experimental design and manuscript editing. SDK was responsible for project oversight, manuscript preparation and editing, experimental design, and data analysis. All authors approve the final manuscript.
Funding SDK is supported by the National Institutes of Dental and Craniofacial Research (R01 DE028529-01, R01 DE028282-01) and AstraZeneca for clinical trials unrelated to this research.
Competing interests None declared.
Provenance and peer review Not commissioned; externally peer reviewed.
Supplemental material This content has been supplied by the author(s). It has not been vetted by BMJ Publishing Group Limited (BMJ) and may not have been peer-reviewed. Any opinions or recommendations discussed are solely those of the author(s) and are not endorsed by BMJ. BMJ disclaims all liability and responsibility arising from any reliance placed on the content. Where the content includes any translated material, BMJ does not warrant the accuracy and reliability of the translations (including but not limited to local regulations, clinical guidelines, terminology, drug names and drug dosages), and is not responsible for any error and/or omissions arising from translation and adaptation or otherwise.