Article Text

Abstract
Background Numerous trials combining radiation therapy (RT) and immunotherapy in head and neck squamous cell carcinoma (HNSCC) are failing. Using preclinical immune cold models of HNSCC resistant to RT-immune checkpoint inhibitors, we investigate therapeutic approaches of overcoming such resistance by examining the differential microenvironmental response to RT.
Methods We subjected two HPV-negative orthotopic mouse models of HNSCC to combination RT, regulatory T cells (Treg) depletion, and/or CD137 agonism. Tumor growth was measured and intratumorous and lymph node immune populations were compared among treatment groups. Human gene sets, genetically engineered mouse models DEREG and BATF3–/–, flow and time-of-flight cytometry, RNA-Seq, Treg adoptive transfer studies, and in vitro experiments were used to further evaluate the role of dendritic cells (DCs) and Tregs in these treatments.
Results In MOC2 orthotopic tumors, we find no therapeutic benefit to targeting classically defined immunosuppressive myeloids, which increase with RT. In these radioresistant tumors, supplementing combination RT and Treg depletion with anti-CD137 agonism stimulates CD103+ DC activation in tumor-draining lymph nodes as characterized by increases in CD80+ and CCR7+ DCs, resulting in a CD8 T cell-dependent response. Simultaneously, Tregs are reprogrammed to an effector phenotype demonstrated by increases in interferonγ+, tumor necrosis factorα+, PI3K+, pAKT+ and Eomes+ populations as well as decreases in CTLA4+ and NRP-1+ populations. Tumor eradication is observed when RT is increased to an 8 Gy x 5 hypofractionated regimen and combined with anti-CD25+ anti-CD137 treatment. In a human gene set from oral squamous cell carcinoma tumors, high Treg number is associated with earlier recurrence.
Conclusions Regulating Treg functionality and DC activation status within the lymph node is critical for generating a T cell effector response in these highly radioresistant tumors. These findings underscore the plasticity of Tregs and represent a new therapeutic opportunity for reprogramming the tumor microenvironment in HNSCCs resistant to conventional radioimmunotherapy approaches.
- dendritic cells
- radioimmunotherapy
- t-lymphocytes
- head and neck neoplasms
- costimulatory and inhibitory t-cell receptors
Data availability statement
Data are available on reasonable request. The data that support the findings of this study are available from the corresponding author on reasonable request.
This is an open access article distributed in accordance with the Creative Commons Attribution Non Commercial (CC BY-NC 4.0) license, which permits others to distribute, remix, adapt, build upon this work non-commercially, and license their derivative works on different terms, provided the original work is properly cited, appropriate credit is given, any changes made indicated, and the use is non-commercial. See http://creativecommons.org/licenses/by-nc/4.0/.
Statistics from Altmetric.com
- dendritic cells
- radioimmunotherapy
- t-lymphocytes
- head and neck neoplasms
- costimulatory and inhibitory t-cell receptors
Introduction
The tumor microenvironment (TME) in HPV-negative head and neck squamous cell carcinoma (HNSCC) is known to be immunologically cold,1 rendering them difficult to treat with immunotherapies, even when combined with radiation therapy (RT).2 3 RT, a mainstay treatment for these tumors,4 can increase immune infiltration and make these tumors vulnerable to immunotherapy5 by promoting release of tumor antigens and danger-associated molecular patterns (DAMPs), increasing recruitment of antigen-presenting cells (APCs), and promoting their phagocytosis, thereby leading to T cell priming and antigen-specific recognition.6 As an immunogenic T-cell response is elicited, however, negative feedback mechanisms emerge to reduce effector T cell functions by recruitment of immunosuppressive regulatory T cells (Tregs) and myeloids to the radiated site by various cytokines.6 Methods to boost antitumor immunity induced by RT include strategies to counteract the immunosuppressive TME while recruiting and activating APCs and T cells, but such approaches vary depending on the TME.
In the current study, we report on how functional impairment of APC-Treg crosstalk may improve response to RT in immunologically cold preclinical HNSCC models characterized by poor T cell infiltration and poor therapeutic response to RT+ anti-PD-L1 combination.7 8 In one model, we find that RT+ anti-PD-L1 evokes T cell infiltration followed by a wave of Treg recruitment driving resistance that is overcome with Treg depletion strategies. In other similarly cold tumors, however, neither combination RT-immunotherapy nor RT-Treg depletion strategies yield meaningful T cell infiltration or tumor growth response. Instead, RT elicits a strong myeloid reaction characterized by macrophage and myeloid-derived suppressor cell (MDSC) infiltration. Targeting these myeloid populations, however, yielded no therapeutic benefit. As many of these cells were MHC-II expressing, we focused instead on the effect of enhancing antigen presentation, particularly dendritic cell (DC) agonists, to improve therapeutic response to RT. Achieving a durable and persistent antitumorous response required targeting both DCs and Tregs in the context of RT, as neither doublet combination was sufficient. We find that addition of both, Treg depletion with anti-CD25 and DC agonism with anti-CD137, to RT is necessary to achieve meaningful therapeutic response. During the tumor rejection phase, an increase in DC frequency is observed in the draining lymph nodes (DLNs) accompanied with an increase in T cell effector function. Pharmacological blockade of lymphocyte egression from lymphoid organs prevented tumor regression indicating that antitumor T cells are induced in the secondary lymphoid organs during the immune response. Our data also highlight that reprogramming of Treg function, not numbers, is critical to achieving antitumor immune response and underscores the fragility of this population of cells. Finally, we observe that further augmentation of DC agonism with toll-like receptor (TLR) agonist failed to improve response rates. However, pulsing the RT in a hypofractionated manner with the presence of anti-CD25 Treg targeted therapy and anti-CD137 DC agonism can result in tumor eradication. While anti-CD25 and anti-CD137 interventions are currently underway in clinical trials, they are not yet studied in combination with RT. These data have significant impact on clinical trial design for HNSCC resistant to conventional radioimmunotherapeutic approaches.
Results
High Tregs correlates with poor outcomes in oral cavity cancer, but response to Treg targeted therapy in preclinical models varies by tumor type
We have previously demonstrated that expression of Treg associated genes, FOXP3, interleukin (IL)-2RA and TGFB1, predict survival in HNSCC patients in TCGA.8 Here, we interrogated RNA sequencing and clinical data from pretreatment tumors of 40 locally advanced patients with oral cavity cancer (online supplemental table 1).9 In the same manner as previously,8 two groups of 20 patients were classified as Treg high and Treg low based on Treg-related genes. A significant benefit in disease-free survival was observed with a trend towards significance for overall survival benefit in the Treg low group (figure 1A,B).
Supplemental material

High Tregs correlates with poor outcomes in oral cavity cancer, but response to Treg targeted therapy in preclinical models varies by tumor type and does not respond to myeloid depletion strategies. (A) Disease-free survival of 40 human OSCC patients, split into two cohorts Treg high (n=20) vs Treg low (n=20) based on combined median splits of normalized levels of FOXP3, IL-2RA and TGFB1 transcript expression. (B) Overall survival of human OSCC patients, Treg high (n=20) vs Treg low (n=20). (C) Experimental procedure for RT +anti-CD25 treatment in LY2 and MOC2 tumor models. (D) Tumor growth curves for mice treated with RT (n=9) vs RT +anti-CD25 (n=10) in LY2 tumor model and replicate values 22 days postimplantation (p=0.0012, unpaired two-tailed t-test). (E) Tumor growth curves for mice treated with RT (n=9) vs RT +anti-CD25 (n=10) in MOC2 tumor model and replicate values 23 days postimplantation (p=0.0629 by unpaired two-tailed t-test). (F) t-SNE plots from CyTOF analysis of MOC2 tumors harvested 3 and 10 days post-RT compared with 0 Gy controls depicting expression of total singlet CD45+ cells; expression plot of MHC-II, CD11c, and F4/80; line chart for average proportion of TAM, DC, Treg and T cell populations (n=3 mice/group). (G) Heatmap of gene expression Z-scores of genes encoding costimulation and coinhibition markers from LY2 and MOC2 tumors harvested three or 7 days post-RT compared with 0 Gy controls (n=3 mice/group). (H) Experimental procedure for RT, anti-CSF1R, anti-CXCR2, anti-Gr-1 and/or anti-CD25 treatment in MOC2 tumor model. (I) Tumor growth curves for mice treated with RT, anti-CSF1R, anti-CXCR2, anti-Gr-1 and/or anti-CD25 in MOC2 tumor model (n=8 mice/group). (J) Tumor growth curves for mice treated with RT, anti-Gr-1 and/or anti-CD25 in MOC2 tumor model (n=8 mice/group). (K) Proportion of CD45+CD3+CD4+Foxp3+ cells in MOC2 tumors harvested 13 days post-RT with RT +/–anti-CD25 treatment (n=5 mice/group). (L) Proportion of CD45+CD3+CD4+Foxp3+ cells in MOC2 tumors harvested 13 days post-RT with RT +/–anti-CD25 treatment expressing indicated markers (n=5 mice/group, unpaired two-tailed t-test). CSF1R, colony-stimulating factor 1 receptor; CyTOF, cytometry by time-of-flight; DC, dendritic cell; IL-2, interleukin 2; RT, radiation therapy; TAM, tumor-associated macrophage; TGFB1, transforming growth factor-β 1; Treg, regulatory T cell; t-SNE, t-distributed stochastic neighbor embedding.
Targeting Tregs in the setting of RT has been demonstrated to restore response to radioimmunotherapy treatment in immunologically cold preclinical models of HNSCC.7 8 However, the response rate to anti-CD25 depletion varied by tumor model with a transient response in the MOC2 tumor model and incomplete intratumorous Treg depletion8 compared with near complete depletion of intratumorous Tregs and eradication in the LY2 tumors.8 We hypothesized that the failure to eradicate MOC2 tumors could have been due to a failure of the depleting antibody to penetrate the tumor. Therefore, we used the recently described anti-CD25 antagonistic antibody with optimized FCγR binding and antibody-dependent cell-mediated cytotoxicity, which has been shown to eradicate established tumors in subcutaneous models of colon and melanoma cell lines,10 by depleting Tregs in the tumor and not only in the blood and lymph nodes.10 In combination with RT (figure 1C), we again observed tumor eradication in LY2 (figure 1D), but, in contrast, only a small tumor growth regression was observed in the MOC2 tumors (figure 1E, online supplemental figure 1A,B).
Supplemental material
To understand how these tumor models differ, we conducted cytometry by time of flight (CyTOF) of both tumor models at an early time point (3–4 days post-RT) compared with 0 Gy controls. Both models are T cell-poor, myeloid-rich tumors (online supplemental figure 2A) in which T cell infiltration and activation appears to be unaffected by RT alone (online supplemental figure 2A,B). To explore how resistance may be developing in MOC2 tumors, we also examined the composition of intratumorous infiltrates at a later time point (10 days post-RT). High-dimensional clustering showed a similarly low T cell content but revealed an increase in tumor-associated macrophages (TAMs) (figure 1F). We also analyzed the gene expression profiles of LY2 and MOC2 tumors harvested 3 days and 7 days post-RT compared with 0 Gy controls. Expression of several coinhibitory markers known to be expressed on Tregs11 appeared elevated or unchanged in late (d7 post-RT) MOC2 tumors, including CTLA4, PD-1, T cell immunoreceptor with Ig and ITIM domains (TIGIT), TIM3, LAG3 and GITR (figure 1G). These data suggest that Tregs in these tumor models may have a differing phenotype that can explain the differential effect to Treg-targeting strategies.
Supplemental material
Tumors resistant to Treg targeted therapy with RT are myeloid dominated but do not respond to myeloid depletion strategies
Past analysis of Treg-depletion resistant tumors, such as the MOC2 tumors treated with RT +anti-CD25 antibody, showed persistent elevation of both macrophage and MDSC populations.8 These same populations were previously shown to decrease post-treatment in immunologically cold tumors such as LY2 that nevertheless eradicate with Treg depletion strategies.8 CyTOF analysis confirmed large proportions of Gr-1+ and F4/80+ cells in both tumor models, with a particularly large proportion of Gr-1+ cells in MOC2 tumors pre and post-RT (figure 1F, online supplemental figure 2A). We, therefore, hypothesized that pharmacological depletion of F4/80+ TAMs and Gr-1+ MDSCs may help overcome resistance to RT or RT +anti-CD25 treatment. We tested this hypothesis with depleting antibodies anticolony-stimulating factor 1 receptor (CSF1R), anti-CXCR2 or anti-Gr-1 alongside RT, with or without anti-CD25 (figure 1H). There was no effect observed in tumor growth between depleted and non-depleted groups (figure 1I,J, online supplemental figure 1C,D), suggesting that, while prevalent, targeting these immune subsets had no effect on restoring antitumor immunity in combination with RT in the MOC2 model.
As Foxp3+ Tregs were still present in MOC2 tumors after Treg targeted therapy with RT+ anti-CD25 treatment (figure 1K), we aimed to assess their immunosuppressive function post-treatment. Several changes occurred in functional markers on these Tregs (figure 1L). A significant drop was observed in Treg CD69 expression, a marker associated with Treg development and suppressive capability.12 This decrease was accompanied by trending decreases in Treg coinhibitory markers CTLA4 and TIGIT (figure 1L). The expression of neuropilin 1 (NRP-1), a marker of natural Tregs of thymic origin associated with poor prognosis,13 also decreased significantly (figure 1L).
Myeloids are enriched in MHC-II and neither RT nor RT with Treg depletion therapy is sufficient to enhance antigen presentation in myeloid-driven tumors
Given the failure to achieve any response with the addition of anti-CXCR2 and anti-CSFR1 treatments in various combinations (figure 1H–J), we refocused instead on examining the myeloid population within these tumors. We observed that many of these cells, including a number of TAMs, are MHC-II expressing (figure 1F), and reasoned that they were negatively targeted with myeloid depletion strategies. We hypothesized that while Treg suppressive function may be partially hindered by Treg-targeted therapy with RT+ anti-CD25, dysfunctional APCs in these myeloid-driven tumors were still failing to effectively prime conventional T cells necessary for tumor clearance. We focused on CD103+ DCs, as they have been previously demonstrated to function as transporters of antigens to the tumor draining lymph node (DLN), and therefore, essential for priming of tumor-specific CD8 T cells.14
RT alone, we observed, results in a slight decrease in the overall DC population 3 days post-RT while more readily sparing CD103+ DCs within that population (figure 2A–C), suggesting their relevance in early tumor surveillance in this model. We examined these DCs in the tumor and lymph nodes of MOC2 tumor-bearing mice after treatment with RT +anti-CD25 to see if any notable DC activation was occurring. No significant increase of MHC-II+ DCs or MHC-II+CD103+ DCs was observed in tumors or lymph nodes (figure 2D–G). In examining their functional status, no significant changes were observed in expression of costimulatory molecule CD80 nor in expression of CCR7(figure 2H,I), a marker on DCs indicative of enhanced antigen presentation15 as well as migratory capability.16 17 These data suggest no change in the maturity or migratory ability of these DCs after RT +anti-CD25 treatment. This conclusion is consistent with the observed lack of CD4 or CD8 T cell increases in tumors and lymph nodes (online supplemental figure 2C,D), as well as the lack of any increases in their expression of effector cytokines interferon (IFN)γ or tumor necrosis factor (TNF)α (online supplemental figure 2E–H).

Neither RT nor RT and Treg depletion therapy is sufficient to enhance antigen presentation in myeloid-driven tumors (A) proportion of CD45+F4/80–Ly-6G–CD11c+MHC-II+ DCs from MOC2 tumors harvested 3 days post-RT compared with 0 Gy controls (n=4 mice/group, p=0.0126, unpaired two-tailed t-test). (B) Proportion of CD45+F4/80–Ly-6G–CD11c+MHC-II+CD103+ DCs from MOC2 tumors harvested 3 days post-RT compared with 0 Gy controls (n=4 mice/group, p=0.2345, unpaired two-tailed t-test). (C) Proportion of CD45+F4/80–Ly-6G–CD11c+MHC-II+CD103+ DCs from MOC2 tumors harvested 3 days post-RT compared with 0 Gy controls (n=4 mice/group, p=0.0008, unpaired two-tailed T test). (D) Proportion of CD45+F4/80–Ly-6G–CD11c+MHC-II+ DCs in MOC2 tumors harvested 9 days post-RT with RT +/–anti-CD25 treatment (n=4 mice/group, p=0.3016, unpaired two-tailed t-test). (E) Proportion of CD45+F4/80–Ly-6G–CD11c+MHC-II+ DCs in MOC2 tumor draining lymph nodes harvested 9 days post-RT with RT +/–anti-CD25 treatment (n=5 mice/group, p=0.0904, unpaired two-tailed t-test). (F) Proportion of CD45+F4/80–Ly-6G–CD11c+MHC-II+CD103+ DCs in MOC2 tumors harvested 9 days post-RT with RT +/–anti-CD25 treatment (n=4 mice/group). (G) Proportion of CD45+F4/80–Ly-6G–CD11c+MHC-II+CD103+ DCs in MOC2 tumor draining lymph nodes harvested 9 days post-RT with RT +/–anti-CD25 treatment (n=5 mice/group). (H) Proportion of CD45+F4/80–Ly-6G–CD11c+MHC-II+CD103+ DCs expressing CD80, CCR7 or PD-L1 in MOC2 tumors harvested 9 days post-RT with RT +/–anti-CD25 treatment (n=4 mice/group, unpaired two-tailed t-test). (I) Proportion of CD45+F4/80–Ly-6G–CD11c+MHC-II+CD103+ DCs expressing CD80, CCR7 or PD-L1 in MOC2 tumor draining lymph nodes harvested 9 days post-RT with RT +/–anti-CD25 treatment (n=5 mice/group). DCs, dendritic cells; LNs, lymph nodes; RT, radiation therapy.
Adding DC agonists to tumors resistant to Treg targeted therapy with RT reduces growth
To address the lack of conventional T cell and DC activation as well as the presence of these persistent Tregs, we considered the addition of a DC agonist to the backbone of Treg depleting therapy and RT. Targeting CD137 has been previously shown to assist in the clearance of various tumor models18–20 by modulating Tregs21 and DCs.22 To assess CD137’s relevance in human HNSCC tumors, we consulted a dataset hosted on the UCSC Single Cell browser23 and analyzed single cell RNA-Seq data from 18 HNSCC patients. TNFRSF9 (CD137) is expressed particularly highly in human Tregs (defined by cells high in CD4, FOXP3 and IL-2RA expression), as well as in conventional CD4 and CD8 T cells (online supplemental figure 6). Similar CD137 expression was confirmed in MOC2 tumors by flow cytometry, with its expression appearing highest in Foxp3+ Tregs compared with CD4 and CD8 T cells, and complementary ligand CD137L expression appearing present on myeloid populations including F4/80–Ly6G–CD11c+ DCs and DCs expressing MHC-II (figure 3A).
Supplemental material
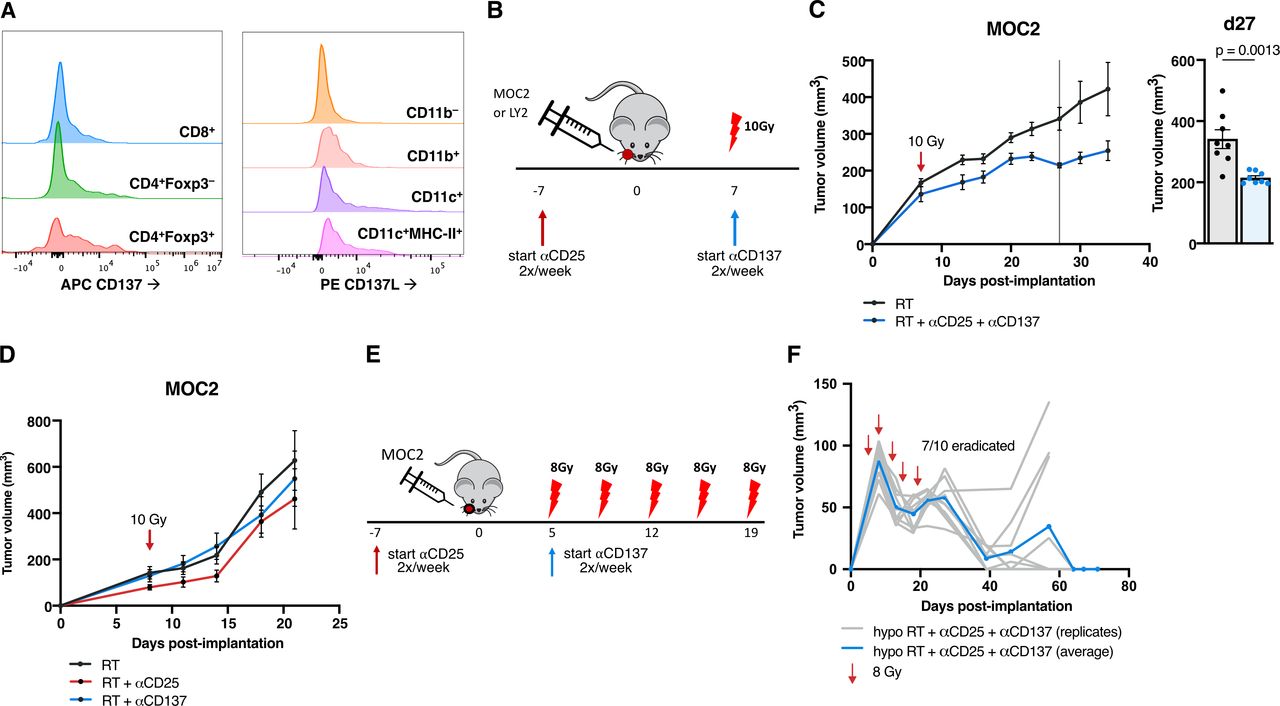
Adding DC agonists to tumors resistant to Treg targeted therapy with RT reduces growth (A) histograms depicting CD137 expression in CD45+CD3+CD4+CD8+ T cells, CD45+CD3+CD4+Foxp3– T cells and CD45+CD3+CD4+Foxp3- Tregs and CD137L expression in CD45+CD11b– cells, CD45+CD11b+ cells, CD45+F4/80–Ly-6G–CD11c+ cells and CD45+F4/80–Ly-6G–CD11c+MHC-II+ cells in MOC2 tumors harvested 9 days post-RT with only RT alone treatment. Each population is normalized to the same number of cells per histogram. (B) Experimental procedure for RT, anti-CD25 and anti-CD137 treatment in the MOC2 tumor model. (C) Tumor growth curves for mice treated with RT or RT+anti-CD25+anti-CD137 in the MOC2 tumor model and replicate values for all mice alive on day 27 postimplantation (n=8 mice/group, p=0.0013, unpaired two-tailed t-test). (D) Tumor growth curves for mice treated with RT, RT+anti-CD25 or RT+anti-CD137 in the MOC2 tumor model (n=8 mice/group). (E) Experimental procedure for hypofractionated RT, anti-CD25 and anti-CD137 treatment in the MOC2 tumor model. (F) Tumor growth curves for mice treated with hypofractionated RT+anti-CD25+anti-CD137 in the MOC2 tumor model in C57BL/6 mice (n=10 mice). DC, dendritic cell; RT, radiation therapy.
We, therefore, hypothesized that utilizing the CD137 agonistic antibody in the MOC2 model would reduce the regulatory effect of the Treg populations in the TME and also block deactivation of the DCs via CD137L reverse signaling, allowing for increased tumor surveillance. Our data show that the combination of RT +anti-CD25+anti-CD137 treatment (figure 3B) resulted in significant tumor growth delay (figure 3C, online supplemental figure 1E). However, in the absence of anti-CD25, doublet combination of RT and anti-CD137 alone failed to reduce tumor growth in the MOC2 model (figure 3D, online supplemental figure 1F) or tumor eradication in the LY2 model (online supplemental figure 1G,H).
Given that RT is needed for release of DAMPs,6 we hypothesized that increasing the total dose of RT using a fractionated regimen might improve response. Additionally, a hypofractionated dose might enhance this therapy not only by increased cytotoxic cell kill, but also through a number of mechanisms by which the immune response is stimulated by RT.6 Hallmark pathways24 from RNA-sequenced tumors harvested 3 days post-RT showed significant increases in inflammatory response and IFNγ response pathways as well as apoptosis pathway (online supplemental figure 7A,B) in both LY2 and MOC2 tumors, demonstrating this immune effect of RT. While a single 10 Gy fraction of RT+anti-CD25+anti-CD137 did not result in tumor eradication in MOC2 tumors, it consistently delayed tumor growth in repeated experiments. The same schedule, however, of antibody administration given with 5 fractions of 8 Gy given over the course of 14 days (figure 3E), resulted in tumor eradication in 7 of 10 mice (figure 3F).
Supplemental material
Adding DC agonists reprograms Tregs, induces a CD4 and CD8 T cell -specific immunity, and enhances DC antigen presenting function in the DLNs
The addition of anti-CD137 to RT+ anti-CD25 showed no significant change in the percent of intratumorous Tregs in the tumor or DLNs (figure 4A,B), but their surface marker expression included several significant changes. We observed significant intratumorous decreases in coinhibitory marker CTLA4, NRP-1 and a trending decrease in TIGIT expression (figure 4C), as well as a significant decrease in nodal expression of CD69 (figure 4D). RT+ anti-CD25+ anti-CD137 also showed increased effector function for Tregs. IFNγ and TNFα increased in Tregs in both tumor and lymph nodes (figure 4C,D), and these cytokines also exhibited increases systemically in the serum (figure 4E,F). Similarly, conventional T cell populations in tumor DLNs demonstrated increases in effector cytokines. Significant increases in IFNγ and TNFα expression in both Foxp3–CD4+ and CD8+ T cells were observed (figure 4G,H) alongside an increase in total proportion of CD4 T cells (figure 4I), suggesting T cell activation occurring in the lymph nodes.
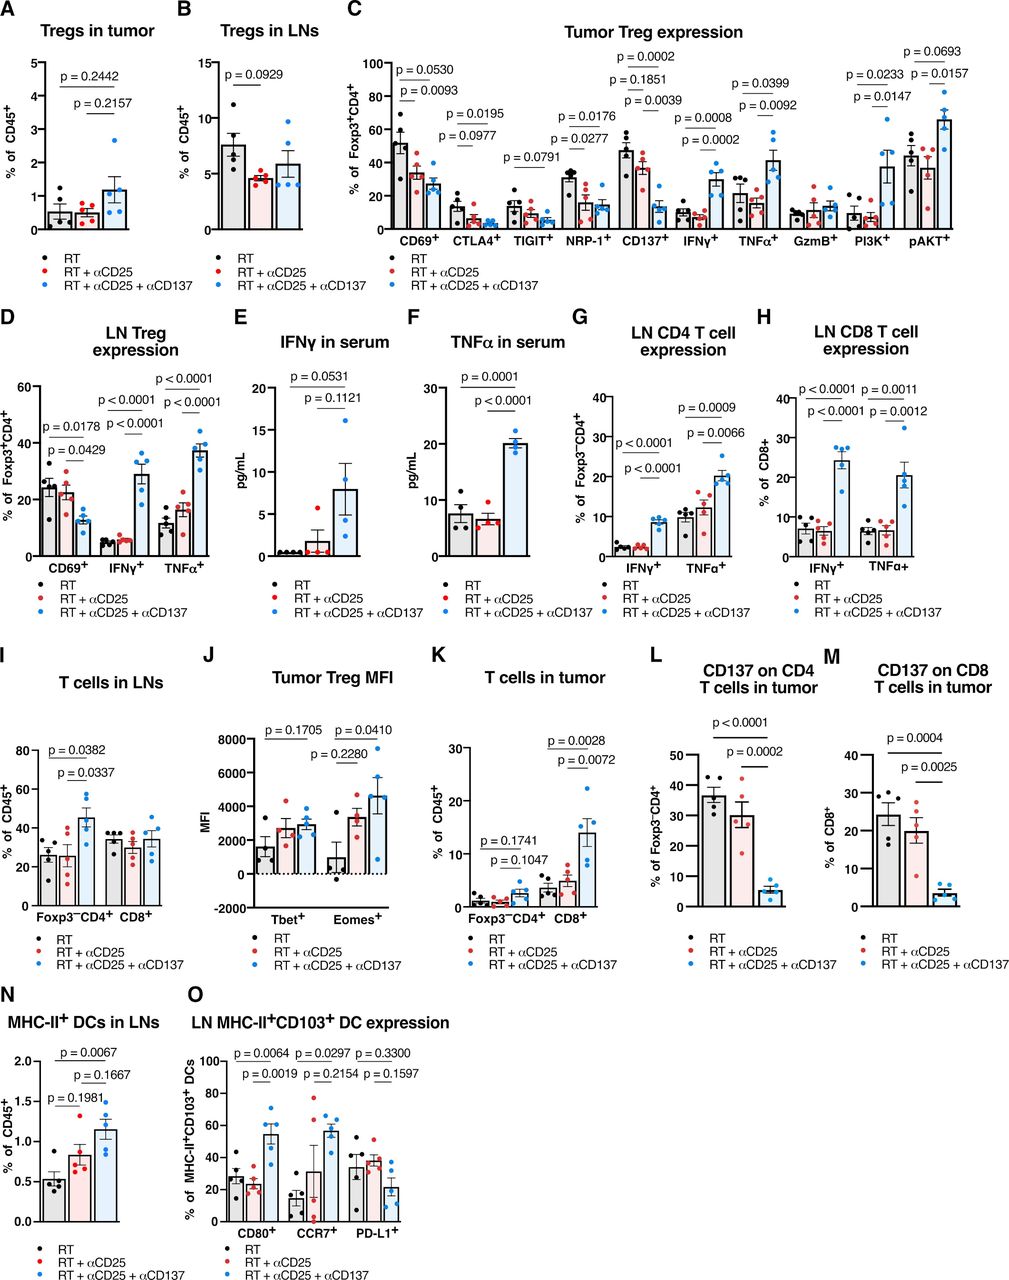
Adding DC agonists reprograms Tregs, induces a CD4 and CD8 T cell -specific immunity, and enhances DC antigen presenting function in the draining lymph nodes (DLN). (A) Proportion of CD45+CD3+CD4+Foxp3+ Tregs in MOC2 tumors harvested 9 days post-RT with RT, anti-CD25 and/or anti-CD137 treatment (n=5 mice/group, one-way ANOVA with Tukey test). (B) Proportion of CD45+CD3+CD4+Foxp3+ Tregs in MOC2 tumor DLNs harvested 9 days post-RT with RT, anti-CD25, and/or anti-CD137 treatment (n=5 mice/group, one-way ANOVA with Tukey test). (C) Proportion of CD45+CD3+CD4+Foxp3+ Tregs expressing CD69, CTLA4, TIGIT, NRP-1, CD137, IFNγ, TNFα, granzyme B, PI3K, or pAkt in MOC2 tumors harvested 9 days post-RT with RT, anti-CD25 and/or anti-CD137 treatment (n=5 mice/group, one-way ANOVA with Tukey test). (D) Proportion of CD45+CD3+CD4+Foxp3+ Tregs expressing CD69, IFNγ or TNFα in MOC2 tumor DLNs harvested 9 days post-RT with RT, anti-CD25 and/or anti-CD137 treatment (n=5 mice/group, one-way ANOVA with Tukey test). (E) Concentration of IFNγ from serum harvested 9 days post-RT with RT, anti-CD25, and/or anti-CD137 treatment (n=4 mice/group, one-way ANOVA with Tukey test). (F) Concentration of TNFα from serum harvested 9 days post-RT with RT, anti-CD25 and/or anti-CD137 treatment (n=4 mice/group, one-way ANOVA with Tukey test). (G) Proportion of CD45+CD3+CD4+Foxp3– T cells expressing IFNγ or TNFα in MOC2 tumor DLNs harvested 9 days post-RT with RT, anti-CD25, and/or anti-CD137 treatment (n=5 mice/group, one-way ANOVA with Tukey test). (H) Proportion of CD45+CD3+CD8+ T cells expressing IFNγ or TNFα in MOC2 tumor DLNs harvested 9 days post-RT with RT, anti-CD25, and/or anti-CD137 treatment (n=5 mice/group, one-way ANOVA with Tukey test). (I) Proportion of CD45+CD3+CD4+Foxp3– T cells and CD45+CD3+CD8+ T cells in MOC2 tumor DLNs harvested 9 days post-RT with RT, anti-CD25, and/or anti-CD137 treatment (n=5 mice/group, one-way ANOVA with Tukey test). (J) Mean fluorescence intensity of Tbet and Eomesodermin in CD45+CD3+CD4+Foxp3+ Tregs in MOC2 tumors harvested 9 days post-RT with RT, anti-CD25 and/or anti-CD137 treatment (n=5 mice/group, one-way ANOVA with Tukey test). (K) Proportion of CD45+CD3+CD4+Foxp3– T cells and CD45+CD3+CD8+ T cells in MOC2 tumors harvested 9 days post-RT with RT, anti-CD25 and/or anti-CD137 treatment (n=5 mice/group, one-way ANOVA with Tukey test). (L) Proportion of CD45+CD3+CD4+Foxp3– T cells expressing CD137 in MOC2 tumors harvested 9 days post-RT with RT, anti-CD25, and/or anti-CD137 treatment (n=5 mice/group, one-way ANOVA with Tukey test). (M) Proportion of CD45+CD3+CD8+ T cells expressing CD137 in MOC2 tumors harvested 9 days post-RT with RT, anti-CD25 and/or anti-CD137 treatment (n=5 mice/group, one-way ANOVA with Tukey test). (N) Proportion of CD45+F4/80–Ly-6G–CD11c+MHC-II+ DCs in MOC2 tumor DLNs harvested 9 days post-RT with RT, anti-CD25, and/or anti-CD137 treatment (n=5 mice/group, one-way ANOVA with Tukey test). (O) Proportion of CD45+F4/80–Ly-6G–CD11c+MHC-II+CD103+ DCs expressing CD80, CCR7, or PD-L1 in MOC2 tumor DLNs harvested 9 days post-RT with RT, anti-CD25, and/or anti-CD137 treatment (n=5 mice/group, one-way ANOVA with Tukey test). ANOVA, analysis of variance; DC, dendritic cell; IFNγ, interferon γ, RT, radiation therapy; TNF, tumor necrosis factor; Treg, regulatory T cell; pAKT, phosphorylated Protein kinase B.
These changes were accompanied by a significant increase in PI3K in intratumorous Tregs (figure 4C), a trending increase in phosphorylated Protein kinase B (pAKT) (figure 4C), as well as a significant increase in mean fluorescence intensity of T-box transcription factor Eomesodermin (Eomes) (figure 4J). Increased expression of Eomes after anti-CD137 administration has been demonstrated to play a role not only in CD8 and CD4 T cell -mediated cytotoxicity, but also in the reprogramming of Tregs to cytotoxic effectors.21 Given that these Tregs expressed increased effector cytokines in the tumor DLNs (figure 4D) and exhibited several changes in surface and intracellular markers in the tumor (figure 4C,J), these data suggest that a phenotypic switch occurred in Foxp3+ Tregs, reprogramming them to a potentially less immunosuppressive state.
While neither RT alone nor RT+ anti-CD25 increased T cell infiltration, the addition of anti-CD137 resulted in a significant increase of CD8 T cells in the tumor and an increasing trend for CD4 T cells (figure 4K). Both CD4 and CD8 T cells in the tumor showed significantly decreased expression of CD137 (figure 4L,M). Anti-CD137 also had a notable effect on DCs, which increased significantly in the tumor DLNs (figure 4N). Additionally, the nodal CD103+ DC subset showed increases in CD80 and CCR7 expression (figure 4O), suggesting increased maturity, migratory ability and presentation compared with both RT alone and RT+anti-CD25 groups.
Tumor growth delay effect with the addition of DC agonist is dependent on CD8 T cells and T cells’ ability to egress from the lymph nodes but is not enhanced with the addition of TLR agonist
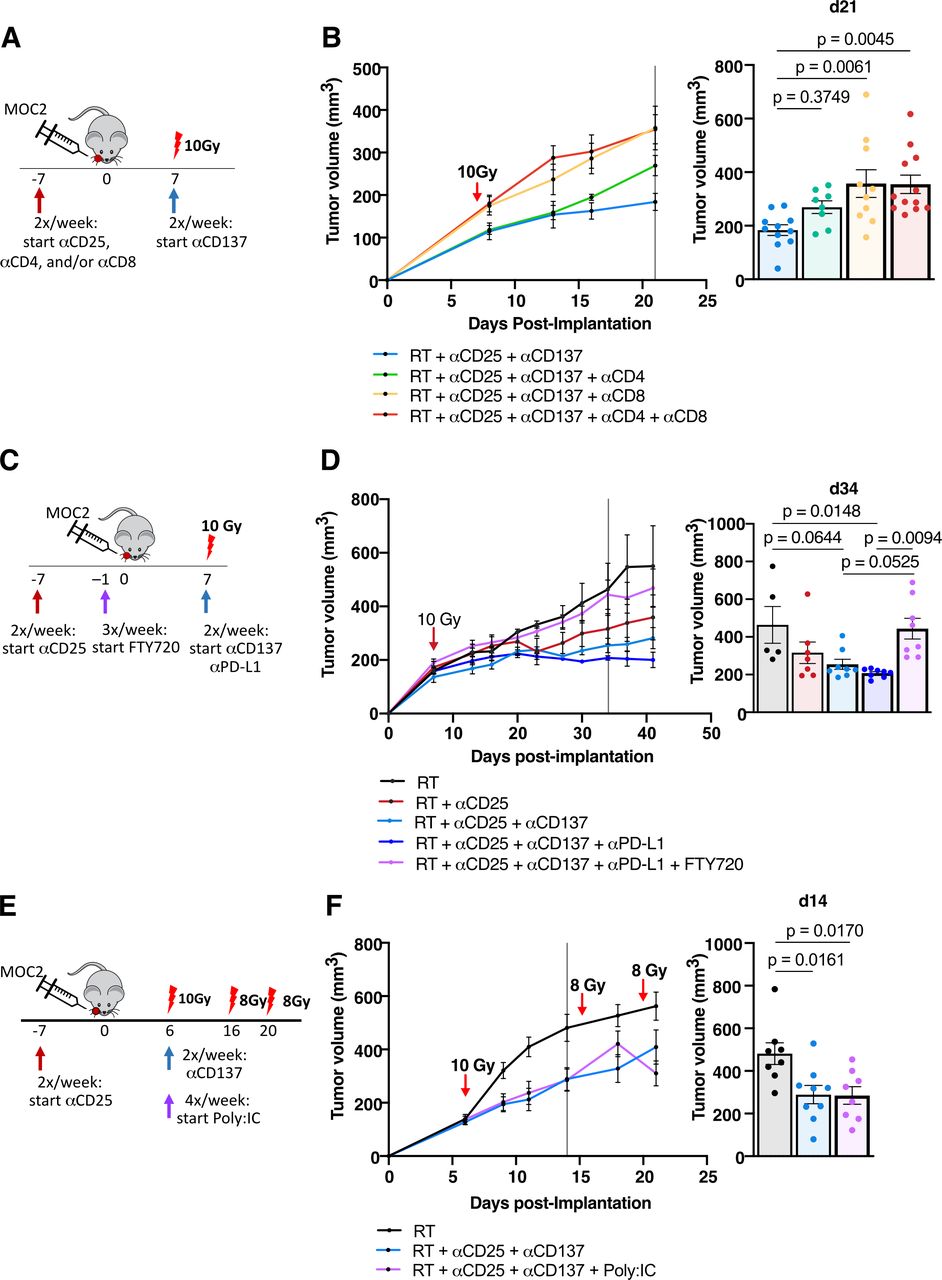
To test the dependence of the therapeutic effect that RT +anti-CD25+anti-CD137 has on T cell-mediated immunity, we treated the mice with upfront depleting antibodies to CD4, CD8, or both T cell populations prior to the administration of RT +anti-CD25+anti-CD137 treatments (figure 5A). Depleting CD4 and CD8 T cells or CD8 T cells alone, a significant increase in tumor growth was observed (figure 5B, online supplemental figure 1I). Depletion of CD4 T cells alone resulted in a trending increase in tumor growth, but this difference did not appear until 13 days postimplantation (figure 5B, online supplemental figure 1I). These findings suggest a strong dependence on CD8 T cells for tumor control at all stages, with possible dependence also exhibited by CD4 T cells.

Tumor growth delay effect with the addition of DC agonist is dependent on CD8 T cells, T cells’ ability to egress from the lymph nodes, but is not enhanced with the addition of TLR agonist (A) experimental procedure for RT, anti-CD25, anti-CD137, anti-CD4, and anti-CD8 treatment in the MOC2 tumor model. (B) Tumor growth curves for mice treated with RT+anti-CD25+anti-CD137 alone or with anti-CD4, anti-CD8 or anti-CD4+anti-CD8 in the MOC2 tumor model and replicate values for all mice alive on day 21 postimplantation (n=13 mice/group on day 0, one-way ANOVA with Tukey test). (C) Experimental procedure for RT, anti-CD25, anti-CD137, anti-PD-L1, and FTY720 treatment in the MOC2 tumor model. (D) Tumor growth curves for mice treated with RT, RT+anti-CD25, RT+anti-CD25+anti-CD137, RT+anti-CD25+anti-CD137+anti-PD-L1 or RT+anti-CD25+anti-CD137+anti-PD-L1+FTY720 in the MOC2 tumor model and replicate values for all mice alive on day 34 post-implantation (n=8 mice/group on day 0, one-way ANOVA with Tukey test). (E) Experimental procedure for RT, anti-CD25, anti-CD137, and Poly:IC treatment in the MOC2 tumor model. (F) Tumor growth curves for mice treated with RT, RT+anti-CD25+anti-CD137, or RT+anti-CD25+anti-CD137+Poly:IC in the MOC2 tumor model. Tumor volumes bar chart for all mice alive on day 14 post-implantation (n=9 mice/group on day 0, one-way ANOVA with Tukey test). ANOVA, analysis of variance; RT, radiation therapy; TLR, toll-like receptor.
Given the stimulatory effect of treatment on CD80 and CCR7 expression on MHC-II+CD103+ DCs, we sought to test whether presentation in the lymph nodes by DCs was necessary for tumor growth delay. We used Fingolimod hydrochloride (FTY720), which prevents antigen-primed T cells from egressing from the lymph nodes, to prevent any activated T cell populations from migrating to the tumor site and exerting effector functions. Additionally, for clinical relevance, we administered anti-PD-L1 antibody alongside treatment to seek further tumor clearance. The addition of anti-PD-L1 only added a marginal benefit in tumor clearance (figure 5C,D, online supplemental figure 1J). Notably, however, the addition of FTY720 completely reversed the benefit of treatment, with tumor sizes remaining nearly identical to mice treated with RT alone (figure 5D, online supplemental figure 1J). These findings suggest that T cells egressing from the lymph nodes play a key role in RT +anti-CD25+anti-CD137 therapy.
After demonstrating the importance of T cell-mediated effects of RT+anti-CD25+anti-CD137 treatment, we sought to determine whether enhancing DC uptake of tumor antigen would further promote T cell effector function. We used Poly:IC, a synthetic dsRNA known to stimulate TLR3 (a TLR present on DCs) to stimulate DCs and activate T cell immunity, and we used additional fractions of RT to stimulate cancer cell damage and antigen release. Addition of Poly:IC to RT+anti-CD25+anti-CD137 therapy revealed no significant additional tumor growth delay (figure 5E,F, online supplemental figure 1K).
Both DCs and Tregs are required for functional DC agonism with anti-CD137
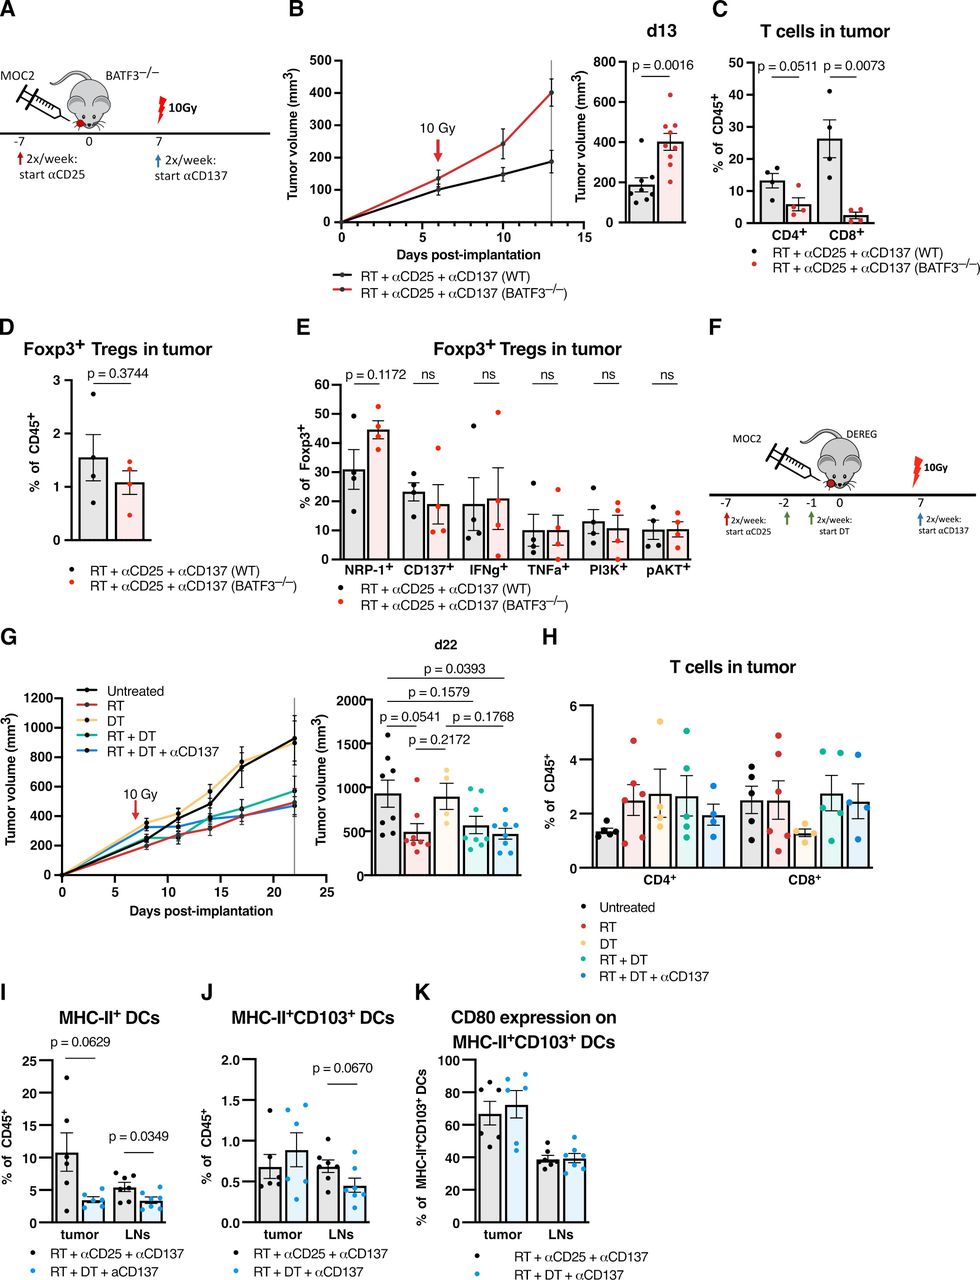
To test the hypothesis that anti-CD137 affects both Tregs and DCs to stimulate their respective differentiation toward reprogrammed effector T cells and activated, antigen-presenting DCs, we conducted targeted depletion of the relevant compartments using genetically engineered animal models. We first tested RT +anti-CD25+anti-CD137 in BATF3–/– mice to test the dependence of DCs on therapeutic efficacy (figure 6A). These mice have abolished BATF3 gene function and are deficient in BATF3-dependent, CD8+ cross-presenting conventional DCs and therefore are highly relevant to this CD8 T cell -dependent therapy. Treated BATF3–/– mice had significantly larger tumors by days 10 and 13 postimplantation compared with WT (figure 6B, online supplemental figure 1L).

Both DCs and Tregs are required for functional DC agonism with anti-CD137 (A) experimental procedure for RT, anti-CD25 and anti-CD137 treatment in the MOC2 tumor model using BATF3–/– mice and wildtype controls. (B) Tumor growth curves for mice treated with RT +anti-CD25+anti-CD137 in BATF3–/– mice versus wildtype controls in the MOC2 tumor model and replicate values for all mice alive on day 13 postimplantation (n=9 mice/group on day 0, one-way ANOVA with Tukey test). (C) Proportion of CD45+CD3+CD4+Foxp3– T cells or CD45+CD3+CD8+ T cells in MOC2 tumors from BATF3–/– mice versus wild-type controls 15 days post-RT with RT +anti-CD25+anti-CD137 treatment (n=4 mice/group, two-tailed unpaired t-test). (D) Proportion of CD45+CD3+CD4+Foxp3+ Tregs in MOC2 tumors from BATF3–/– mice versus wild-type controls 15 days post-RT with RT +anti-CD25+anti-CD137 treatment (n=4 mice/group, two-tailed unpaired t-test). (E) Proportion of CD45+CD3+CD4+Foxp3+ Tregs in MOC2 tumors from BATF3–/– mice versus wild-type controls expressing NRP-1, CD137, IFNγ, TNFα, PI3K or pAkt 15 days post-RT with RT +anti-CD25+anti-CD137 treatment (n=4 mice/group, two-tailed unpaired t-test). (F) Experimental procedure for RT, anti-CD25, anti-CD137 and dT treatment in the MOC2 tumor model using DEREG mice. (G) Tumor growth curves for mice treated with RT, DT, RT +DT, or RT +DT + anti-CD137 versus untreated controls in the MOC2 tumor model in DEREG mice and replicate values for all mice alive on day 22 postimplantation. (n=8 mice/group on day 0, one-way ANOVA with Tukey test). (H) Proportion of CD45+CD3+CD4+Foxp3– T cells or CD45+CD3+CD8+ T cells in MOC2 tumors from DEREG mice harvested 20 days post-RT with RT (n=5), dT (n=4), RT +DT (n=5) or RT +DT + anti-CD137 (n=4) treatments vs untreated controls (n=5). (I) Proportion of CD45+CD11c+MHC-II+ DCs in MOC2 tumors or tumor draining lymph nodes (LN) from DEREG mice harvested 8 days post-RT with RT +anti-CD25+anti-CD137 or RT +DT + anti-CD137 treatment (n=6 mice/group, two-tailed unpaired t-test). (J) Proportion of CD45+CD11c+MHC-II+CD103+ DCs in MOC2 tumors or tumor draining LNs from DEREG mice harvested 8 days post-RT with RT +anti-CD25+anti-CD137 or RT +DT + anti-CD137 treatment (n=6 mice/group, two-tailed unpaired t-test). (K) Proportion of CD45+CD11c+MHC-II+CD103+CD80+ DCs in MOC2 tumors or tumor draining LNs from DEREG mice harvested 8 days post-RT with RT +anti-CD25+anti-CD137 or RT +DT + anti-CD137 treatment (n=6 mice/group, two-tailed unpaired T test). ANOVA, analysis of variance; DC, dendritic cell; IFNγ, interferon γ; ns, not significant; RT, radiation therapy; TNFα, tumor necrosis factor α; Treg, regulatory T cell.
Analyzing flow cytometry on intratumorous populations, we observed that CD4 T cells trended toward a decrease, while CD8 T cell infiltration decreased significantly in BATF3–/– mice (figure 6C). CD4+Foxp3+ Treg infiltration appeared unchanged. (figure 6D), and their expression of surface markers NRP-1 and CD137 and intracellular markers IFNγ, TNFα, PI3K, and pAKT did not significantly change (figure 6E). The observed decrease of T cell infiltration in the DC-deficient BATF3–/– mice confirms that RT +anti-CD25+anti-CD137 stimulation of conventional T cell tumor infiltration is dependent on DCs, and the lack of reversal of the Treg phenotype switch suggests that this treatment may be sufficient to induce these changes in Treg phenotype intrinsically.
We next asked whether ablation of Treg populations would likewise reverse the tumor growth delay seen in RT +anti-CD25+anti-CD137 therapy. Anti-CD25 caused several changes in intratumorous Treg populations (figure 1L) but did not decrease the total proportion of Foxp3+ Tregs in the tumor (figure 1K). We chose to substitute this anti-CD25 antibody with genetic ablation of Treg populations to test whether complete Treg depletion would aid in tumor clearance. At the same time, this would isolate the effect of targeting Tregs while avoiding any effects that anti-CD25 might have on cell populations other than Tregs. We used DEREG mice expressing diphtheria toxin receptor upstream of the FOXP3 promoter to fully deplete Tregs from the mice. We proceeded with tumor implantation, substituting anti-CD25 therapy with administration of diphtheria toxin (DT). We chose to test Treg depletion alongside RT as well as with the addition of anti-CD137 (figure 6F).
While the addition of DT did not delay tumor growth compared with RT alone, notably, the addition of anti-CD137 to RT+DT did not improve response (figure 6G, online supplemental figure 1M). We hypothesized that complete ablation of Tregs reversed the stimulatory effect of anti-CD137 on Tregs, as a TME devoid of Tregs eliminates the possibility of reprogrammed Tregs aiding in the immune response or interacting with DCs. Analysis by flow cytometry showed no significant changes in CD4 or CD8 T cell infiltration with the substitute of DT for anti-CD25 (figure 6H). We also compared RT+DT + anti-CD137-treated DEREG mice with RT+anti-CD25+anti-CD137 treated mice to test for any changes in DC populations. A significant decrease in MHC-II+DCs was observed in lymph nodes with a trend down decrease in the tumor (figure 6I), no change was observed in intratumorous MHC-II+CD103+DCs (figure 6J), and a trending decrease was observed in lymph node MHC-II+CD103+DCs (figure 6J). No change was observed in CD80 expression on MHC-II+CD103+DCs in tumor or lymph nodes (figure 6K).
While RT +anti-CD25+anti-CD137 resulted in tumor growth delay compared with RT in previous experiments, substituting anti-CD25 with complete depletion of Tregs using DT reversed both T cell infiltration (figure 6H) as well as tumor growth delay (figure 6G, online supplemental figure 1M). The use of DT in place of anti-CD25 resulted in a decrease in DCs (figure 6I) but resulted in no change in the expression of CD80 on DCs (figure 6K). Taken together, these data suggest anti-CD137 modulates the CD137–CD137L action between Tregs and DCs. This is evidenced by the fact that ablation of the relevant populations in the BATF3–/– and DEREG models reverses the tumor delaying effects of anti-CD137 in the context of RT. While anti-CD137 may still induce some changes in Treg and DC phenotype, both populations are needed to translate to an activated CD8 T cell response.
RT + anti-CD25 + anti-CD137 is sufficient to reprogram Tregs into cytokine-producing cytolytic effectors
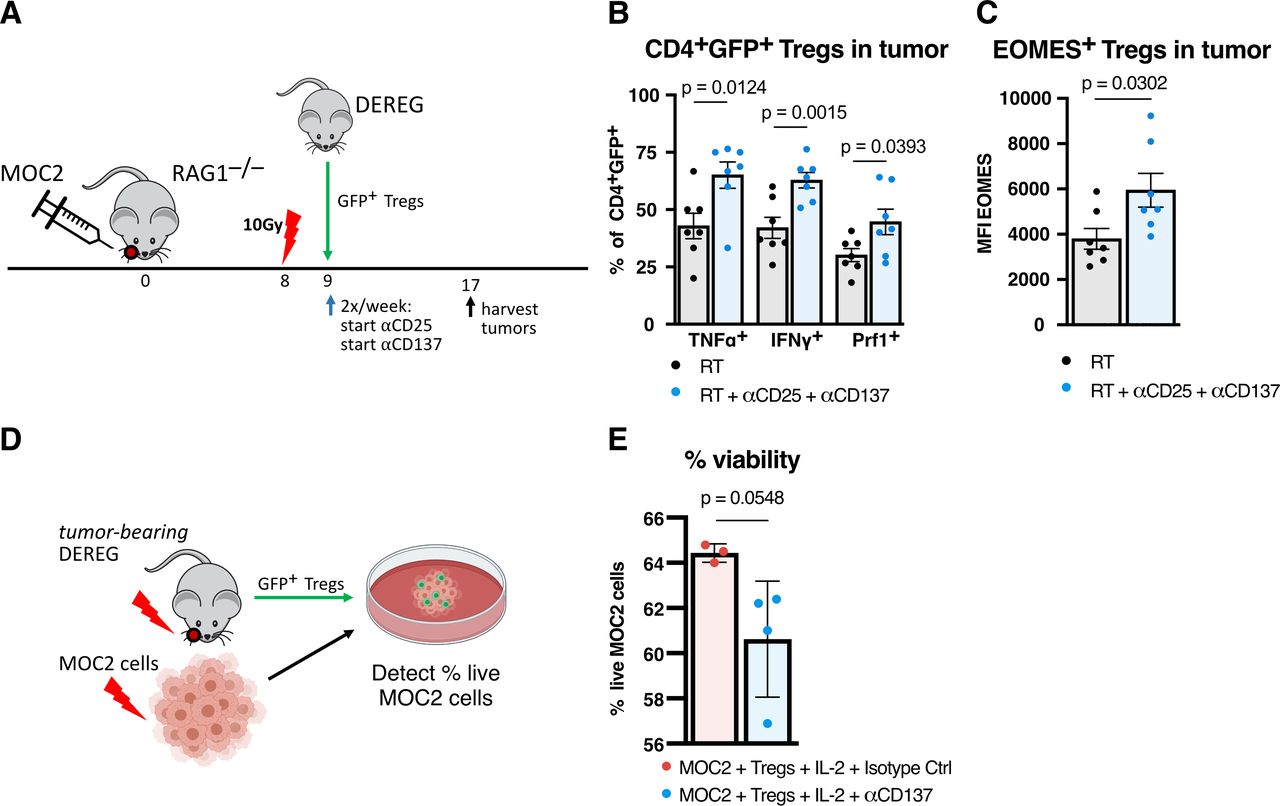
The substitution of anti-CD25 for complete ablation of Tregs with DT highlighted to importance of Tregs in the benefit of RT +anti-CD25+anti-CD137 therapy. Given these results, we sought to confirm that anti-CD137 acted specifically on Tregs. Considering that PI3K, pAKT, and transcription factor Eomes were increased in Tregs in addition to their increased production of IFNγ and TNFα (figure 4C,J), we also wanted to test the hypothesis that these cells had cytolytic function to aid in tumor clearance, as shown in other studies involving CD137 agonism.18 21 MOC2 tumors were implanted in RAG-1–/– mice, which completely lack functional T cells, and then were adoptively transferred GFP+ Tregs from untreated DEREG mice (figure 7A). RT +anti-CD25+anti-CD137 treatment was administered compared with RT alone to test the hypothesis that Foxp3+ Tregs were being converted to cytolytic effectors.

RT +anti-CD25+anti-CD137 is sufficient to reprogram Tregs into cytokine-producing cytolytic effectors. (A) Experimental procedure for adoptive transfer by tail vein injection of GFP+ Tregs from non-tumor-bearing DEREG mice into MOC2 tumor-bearing RAG1–/– mice followed by RT+anti-CD25+anti-CD137 treatment and harvesting of tumors for flow cytometric analysis. (B) Proportion of CD45+CD4+Foxp3+GFP+ Tregs expressing TNFα, IFNγ, or Perforin in MOC2 tumors from RAG1–/– mice following adoptive transfer of Tregs from DEREG mice and treatment of RT+anti-CD25+anti-CD137 harvested 9 days post-RT versus RT alone controls (n=7 mice/group, two-tailed unpaired T test). (C) Mean fluorescence intensity of Eomesodermin in CD45+CD4+Foxp3+GFP+ Tregs in MOC2 tumors from RAG1–/– mice following adoptive transfer of Tregs from DEREG mice and treatment of RT+anti-CD25+anti-CD137 harvested 9 days post-RT versus RT alone controls (n=7 mice/group, two-tailed unpaired t test). (D) Experimental procedure for Treg cytolytic assay using GFP+ Tregs harvested from tumor-bearing DEREG mice harvested 8 days post-RT with 10 Gy and MOC2 cells irradiated with 10 Gy 72 hours prior and stained with cell Tracker red. Cells were cultured in conditioned media from irradiated MOC2 cells with an 2:1 effector to target ratio for 4 hours at 37°C prior to detection of live cells by live/dead aqua viability dye. (E) Proportion of live MOC2 cells after incubation with Tregs harvested from tumor-bearing DEREG mice treated with IL-2 and anti-CD137 (n=4) compared with IL-2 and matching isotype control antibody (n=3). Each point represents technical replicates (p=0.0548, two-tailed unpaired t test). IFNγ, interferon γ; IL-2, interleukin 2; RT, radiation therapy; TNFα, tumor necrosis factor α; Treg, regulatory T cell.
Intratumorous Tregs in treated mice expressed significantly higher levels of IFNγ and TNFα effector cytokines (figure 7B). Tregs in treated mice expressed significantly higher expression of Perforin, suggesting a polarization to a cytolytic function in these Tregs (figure 7B). Tregs also showed higher mean fluorescence intensity of Eomes, suggesting that these changes in cytotoxicity were associated with a phenotypic change in the Tregs (figure 7C). These data were indicative of Treg fragility, whereby CD4 T cells retaining FoxP3 expression can function to enhance cancer cell kill.13 To further examine this cytotoxic phenotype, we cultured live GFP+ Tregs from MOC2 tumor-bearing DEREG mice treated with RT together with irradiated MOC2 cells (figure 7D). We observed a trend toward cell death when these cells were incubated in the presence of IL-2 and anti-CD137 compared with IL-2 and matching isotype control antibody (figure 7E). These results suggest that Tregs convert to an effector phenotype in MOC2 tumors after RT+ anti-CD25+ anti-CD137 treatment. Importantly, genetic ablation of these Tregs reversed the tumor growth delay conferred by anti-CD137 (figure 6G).
Discussion
Improving patient response to RT through use of currently available immunotherapies remains a tenuous goal for the field of oncoimmunology. Although RT triggers inflammatory signals that involve both innate and adaptive immune responses,25 the negative feedback loop that follows this inflammatory response can contribute to immunosuppression in this context. Resistance to RT and checkpoint blockade has been identified as being mediated through upregulation of various markers, such as CTLA4, TIM3 and STAT3, known to enhance suppressive functions of various immune populations.26 27 Here, we find that modulation of the DC-Treg axis in tumors resistant to RT+ immune checkpoint blockade acts within the TME to enhance antigen presentation in the lymph nodes and decrease Treg suppressive markers, reprogramming Tregs to exhibit cytotoxic function with retained Foxp3 expression after exposure to RT+ anti-CD25+ anti-CD137 therapy. The benefit of these reprogrammed Tregs is threefold: they coincide with a more activated DC (figure 4O), they express IFNγ and TNFα effector cytokines alongside increased Eomes (figure 4C,D,J) that are typically associated with T helper responses in promoting CD8 T cell function, and they express Perforin, suggesting potential cytotoxicity to the tumor (figure 7B). This not only suggests caution in the use of Foxp3 as the sole marker of inhibitory Tregs, but also identifies this combination approach as a mechanism of switching the dial from a tolerogenic to an inflammatory TME and inducing a more therapeutically active phenotype of Treg with cytotoxic abilities. Finally, we show that only by hypofractionating the RT to maximize antigen presentation and enhance the immune response, tumor eradication is achieved when combined with downregulation of Treg suppression and enhancement of DC maturation, migration, and activation (figure 3F).
Although pharmacological depletion of Tregs in combination with RT yields tumor eradication in some models,8 this does not appear to be an effective strategy across all immune cold, myeloid-enriched, HNSCC tumors. Based on the literature,28 we hypothesized that these monocytic and granulocytic myeloid populations are likely mediators of resistance. However, targeting with anti-CSF1R, anti-CXCR2 or both, as previously used in other tumor models,28 or even with anti-Gr-1, failed to achieve any benefit in tumor growth delay when combined with RT or RT +anti-CD25. CSF1R, CXCR2 and even Gr-1 have been reported to be involved in the development of monocytic lineages that can also drive the development of DCs, both plasmacytoid and conventional.29–32 We therefore rationalized that we might be decreasing antigen presentation ability in this tumor model, especially in light of our results that anti-CD25 failed to stimulate CD103+ DCs in the tumor or lymph nodes. Considering that DCs are one target of suppression by Tregs,21 33 CD137 agonism was an attractive option as it has been documented to both reprogram Tregs21 as well as suppress CD137L reverse signaling that may inhibit CD103+ DC differentiation,22 solving the issues of both persistent presence of Foxp3+Tregs as well as lack of CD103+ DC stimulation.
We find that activation of DCs and induction of their ability to mature and migrate—not just their mere presence or ability to withstand RT—is critical to the response to radioimmunotherapy. Only with the addition of anti-CD137 to RT+ anti-CD25 do we see an increase in MHC-II+ DCs in the lymph nodes and increases in CD80 and CCR7 expression on MHC-II+CD103+ DCs. Blair et al34 recently demonstrated that CD103+ DCs that survive RT were shown to exhibit higher levels of maturity markers such as CCR7 and CD80, but only in tumors they deemed radioimmunogenic. They noted that in poorly radioimmunogenic tumors, they could rescue RT-mediated activation of CD103+ DCs in the tumor DLNs using Poly:IC administration. Although they were able to stimulate CD103+ DCs in one poorly radioimmunogenic model, Panc02-SIY, our data show no benefit in the addition of TLR agonism in another poorly radioimmunogenic model, MOC2, suggesting that in this model, resistance cannot be reversed with DC agonism monotherapy alone. It must rather be supplemented with targeting of immunosuppressive Tregs. Here, we show a dual benefit of anti-CD137 to enhance DCs and reprogram Tregs.
Modulating the CD137-CD137L interaction in combination with RT +anti-CD25 contributed to significant destabilization of Tregs, reprogramming them into Foxp3+CD4+ T cells with cytolytic activity. Using anti-CD137 agonist to turn on the cytolytic program in Tregs has been previously shown in virally driven tumors.21 Here, we demonstrate a similar feature in poorly immunogenic tumors in the context of RT. This is likely partially induced by CD137 signaling on Tregs, as supported by our findings that a subpopulation of Foxp3+ Tregs transferred into RT +anti-CD25+anti-CD137 -treated RAG1–/– mice upregulate the expression of IFNγ, TNFα and Eomes. In the immunocompetent C57BL/6 MOC2 model, we observed significant reductions in NRP-1 and coinhibitory marker CTLA4, as well as the same increases of IFNγ and TNFα on Tregs as in the RAG1–/– transfer experiment. NRP-1 expression on Tregs is a known correlate of poor prognosis that has been shown to be a critical player in Treg fragility.13 Consistent with this study, the inflammatory environment triggered by increase in IFNγ and TNFα in the serum and on T cells and Tregs, along with this decrease in NRP-1, contributes toward this state that they describe as intratumorous Treg fragility.13
Suppressive Tregs have been shown to interact with tumor-associated DCs and inhibit their function.35–37 When Tregs are destabilized (eg, by disruption of pAKT, PI3K), the endogenous tumor-associated DCs can become highly activated following chemotherapy or immunotherapy.38 In one such model, the TME became dominated by immunogenic DCs that cross-presented tumor antigens and reactivated anergic T cells.39 Because cross-presentation of endogenous tumor antigens is dependent on the DC population in the tumor and its DLNs, removing Treg-mediated suppression of these DCs might enhance response to tumor antigens. In our model, we observe that the combination treatment RT +anti-CD25+anti-CD137 does indeed switch the DC to induce their maturation, migration, and activation as evidenced by the increase in CD80 and CCR7 on MHC-II+CD103+ DCs in the tumor DLNs. This requirement of DCs for anti-CD137’s ability to induce a T cell dependent response was evident by using BATF3–/– mice. In this model where CD8α+ cross-presenting DCs are genetically ablated, we observed no tumor growth delay, and poor infiltration of conventional CD4 and CD8 T cells when RT +anti-CD25+anti-CD137 was used in this model. Similarly, in the DEREG model, the use of DT appeared to have a deleterious effect on CD8 T cell infiltration. The observed increase when wildtype tumor-bearing mice were treated with RT +anti-CD25+anti-CD137 was effectively reversed when DT was substituted for anti-CD25 in the triple combination therapy in DEREG mice. This underscores the DC-Treg as an axis for anti-CD137’s action in the context of RT and anti-CD25.
Finally, the importance of enhanced antigen release is supported with data showing that hypofractionated RT was required for tumor eradication. Adding anti-PD-L1 or Poly:IC failed to achieve similar results or add any further benefit. These data suggest that maximal antigenic stimulation is achieved with hypofractionated RT, downregulation of Treg suppressive markers (such as CD69, CTLA4 and NRP-1) is achieved with anti-CD25, and enhancement of DC maturation, migration, and activation is achieved with the addition of anti-CD137. Any two of these three agents appear insufficient on their own in establishing tumor growth delay (or eradication) or reprogramming the DC-Treg axis.
In conclusion, these data represent an important therapeutic strategy in combating immune cold HNSCCs, which like the tumor models studied, are often HPV-negative, poorly T cell -infiltrated tumors of the oral cavity.1 We show that Tregs remain critical players in these myeloid-rich, cold, poorly immunogenic tumors but that overcoming their immunosuppressive action, in the context of RT, requires TME reprogramming. We show that this reprogramming is achievable by using combination RT+anti-CD25+anti-CD137, where each component of the therapy appears critical to enhancing an element of the immune cycle. The end result of this combination is a TME sustained in a more inflammatory and less tolerogenic state. We provide evidence that stimulation with combination of hypofractionated RT+anti-CD25+anti-CD137 induces the production of cytolytic molecules in Tregs while enhancing maturation and migration of DCs to the lymph nodes leading to T cell priming.
Methods
Cell lines and cell culture
Murine MOC2 and LY2 squamous cell carcinoma cell lines were used for in vivo studies. The MOC2 cell line obtained from Ravindra Uppaluri (Dana-Farber Cancer Institute) was derived from a C57Bl/6 mouse that developed SCC after exposure of the oral cavity to DMBA over 25 weeks. The LY2 cell line obtained from the lab of Nadarajah Vigneswaran (University of Texas Health Science Center) was derived from lymph node metastases that developed in BALB/c mice after inoculation of PAM 212 squamous cell carcinoma cells.40 Both lines exhibit wildtype expression of TP53 and EGFR. All cells were cultured at 37°C and 5% CO2 in appropriate media; DMEM-F12 supplemented with 10% FBS and 1% primocin/fungin (InvivoGen, San Diego CA) for LY2 and DMEM F12: IMDM (1:2) supplemented with 10% FBS and 1% primocin/fungin (InvivoGen, San Diego, California, USA), 1.75 µg EGF, 20 µg hydrocortisone, and 0.1% insulin solution (human) (Sigma Aldrich, St. Louis, Missouri, USA) for MOC2.
Animal tumor models
Orthotopic HNSCC models were established as previously described.5 Briefly, cell suspensions were mixed with equal volumes of Matrigel (10 mg/mL, BD Biosciences, San Jose, California, USA) and injected submucosally into the buccal mucosa at a final concentration of 1×10⁶/0.1 mL per animal for LY2 cells, 1×10⁵/0.1 mL per animal for MOC2 cells in C57Bl/6 and DEREG mice, and 1×10⁶/0.1 mL per animal for MOC2 cells in BATF3–/– mice. BALB/c (Charles River, Wilmington MA) and C57Bl/6 ((Jax Labs, Bar Harbor, Maine, USA)) mice were used for LY2 and MOC2 cell lines, respectively. Mice with a diphtheria toxin receptor-eGFP gene under the control of the FOXP3 promoter, or DEREG mice,41 on a C57Bl/6 background, were obtained through a collaborator (Edward Chan). BATF3–/– mice,42 deficient for CD8α+ cross-presenting DCs on a 129S background, were obtained through a collaborator (Beth Tamburini). Treatment was started when average tumor size reached 100 mm3 (6–8 days postinoculation). Tumor size was measured twice weekly with digital calipers and tumor volumes were estimated using the formula (V=A×B2/2 mm3), where A and B are the longer and shorter diameters of the tumor, respectively. Mice exhibiting signs of morbidity according to the guidelines set by the Institutional Animal Care and Use Committee (IACUC) were sacrificed immediately. Primary tumors and tumor DLNs were harvested on sacrifice. All protocols for animal tumor models were approved by the IACUC of the University of Colorado, Denver.
Antibodies and drugs
All antibody-based treatments were accompanied by the isotype equivalent as a control. For antibody depletion experiments, anti-CD25 (Clone: PC-61.5.3, Bio X Cell, Lebanon, New Hampshire, USA), Fc-optimized anti-CD25 (Clone: PC61, Evitria AG, Schlieren, Switzerland) anti-CD4 (Clone:GK1.5, Bio X Cell, Lebanon NH), anti-CD8a (Clone:53–6.7, Bio X Cell), anti-CD137 (4-1BB, Bio X Cell) (Clone:3H3, Bio X Cell, Lebanon NH) and anti-PD-L1 (10F.9G2, Bio X Cell) injected I.P at 10 mg/kg/dose twice weekly for the length of each experiment. For experiments using upfront anti-CD25 administered before implantation, Bio X Cell anti-CD25 antibody was used; for experiments using anti-CD25 concurrent with RT, Fc-optimized anti-CD25 antibody was used. Isotypes were used at the same dose, and in the same time frame. Diphtheria toxin (DT) was administered I.P. twice weekly to DEREG mice at a dose of 1 µg/mouse as previously reported.41 Poly:IC was administered at 10 ug in 30 uL intratumorally four times per week. Fingolimod hydrochloride (FTY720) (Cayman Chemical, Ann Arbor, Michigan, USA) was given at a dose of 2 mg/kg three times per week administered I.P.
Irradiation
RT was performed using the X-RAD SmART image-guided irradiator (Precision X-Ray, Branford CT) at 225kVp, 20mA with 0.3 mm Cu filter. During mouse buccal RT, mice were anesthetized with isoflurane and positioned in the prone orientation. CBCT scans of representative mice were acquired and Monte-Carlo simulations performed using SmART-ATP software (SmART Scientific Solutions, Maastricht, The Netherlands) to validate treatment plans. Mice were positioned using fluoroscopy to ensure accurate targeting prior to RT delivery at a dose rate of 5.6 Gy/min.
Statistical analysis
Statistical analysis was completed using one-way analysis of variance with Tukey correction for all comparisons with three or more groups and unpaired t-tests (two tailed) were used for all comparisons involving two groups with other tests used where described. For survival analysis, Kaplan-Meier curves were analyzed based on the log-rank (Mantel-Cox) test for comparison of all groups. All statistical analyses were performed in Prism software (GraphPad, V.8.4.2) or R programming language (V.3.6.1).
Figures
Figure 7D was created with BioRender.com.
Flow cytometry
Tumors were digested and strained into single-cell suspension. Briefly, tumors were finely cut and placed in Hanks' Balanced Salt Solution (HBSS) containing 200U of Collagenase III (Worthington, Lakewood, New Jersey, USA) for 40 min at 37°C with gentle shaking every 15 min. After the incubation period, tumor pieces were passed through a 70 um nylon mesh. The resulting cell suspension was centrifuged and resuspended in red blood cell lysis buffer for 5 min (InVitrogen, Carlsbad, California, USA). HBSS was added to inactivate RBC lysis buffer, cell suspensions were centrifuged, resuspended and counted using an automated cell counter. DLNs were also collected where described and processed into single-cell suspensions through mechanical separation. For intracellular flow cytometric analysis, 2×10⁶ live cells were plated in 6-well plates and cultured for 4 hours in the presence of monensin to prevent release of cytokines and PMA and ionomycin to stimulate cytokine production. After the incubation period, cells were incubated with a live/dead aqua viability stain kit (Invitrogen, Carlsbad, California, USA) for 30 min at 4°C. Cells were centrifuged then incubated with Fc block (anti-CD16/32 antibody) (Tonbo Biosciences, San Diego CA) for 20 min at 4°C Cells were centrifuged and resuspended in buffer containing staining antibodies and incubated at 4°C for 20 min. For analysis of immune cells, the following conjugated antibodies were used: PerCP-CD45 (Clone: 30-F11 BD Biosciences), BUV395-CD3 (Clone: 145-2 C11 BD Biosciences), PercP/Cy5.5-CD3 (Clone: 145-2 C11 BD Biosciences) SuperBright436-CD4 (Clone: GK1.5 Invitrogen), BrilliantBlue515-CD8 (Clone: 53-6.7 BD Biosciences), APC-CD137 (Clone: 17B5 Biolegend), PE-FoxP3 (clone: MF-14 Biolegend), AF488-FoxP3 (Clone: MF-14 Biolegend,), FITC-FoxP3 (Clone: 3G3 Millipore/Sigma), BV605 IFN-γ (Clone: B27 BD Biosciences), BV421-IFN-γ (Clone: B27BD Biosciences), efluor450-TNF-α (Clone: MP6-XT22Invitrogen), BV750 TNF-α(Clone: MP6-XT22 BD Biosciences), BV785-CD69 (Clone: FN50 BD Biosciences), BV711-CD25 (Clone: PC-61 BD Biosciences) BV605-CD25 (Clone: PC-61 BD Biosciences), APC-PD-1 (Clone: RMP1-30 BD Biosciences), PE/Cy7- NK1.1 (Clone: PK136 BD Bioscience), PE/Dazzle594-TIM3 (Clone: 7D3 BD Biosciences), PerCP/Cy5.5-CTLA4 (Clone: BNI3 BD Biosciences), FITC-TIGIT (Clone: GIGD7 Invitrogen), PE/Cy7-NRP-1 (Clone: 3E12 Biolegend), BV711-CD154/CD40L (Clone: MR1 BD Biosciences), AF700-SEMA4A (Clone:757129, R&D Systems), BV421-Tbet (Clone: 04–46 Biolegend), FITC-Granzyme-B (Clone: GB11 BD Biosciences), efluor450-EOMES (Clone: Dan11Mag Invitrogen), BUV737-CD11b (Clone: M1/70 BD Biosciences), APC-CD11c (Clone: HL3 BD Biosciences), APC/Cy7-F4/80 (Clone:BM8 Biolegend), AF488-iNOS (Clone: CXNFT Invitrogen), PE/Dazzle594-CD103 (Clone: 2E7 Biolegend), PE-CD137L (Clone: TKS1 Biolegend), BV421-MHC-I (Clone: 28-8-6 BD Biosciences), BV650-I-Ab (Clone: M5/114 BD Biosciences), BV480-CD80 (Clone: 16-10A1 BD Biosciences), PE/Cy7-PD-L1 (Clone: 10F.9G2 Biolegend), PercP efluor710-PD-L1 (Clone: MIH5 ebiosciences) efluor450-Ly6C (Clone: HK1.4 Invitrogen), BV785-Ly6G (Clone: 1A8 BD Biosciences), PerCP/Cy5.5-CCR7 (Clone: 4B12 Biolegend, San Diego CA), AlexaFluor647-PTEN (Clone: A2B1 BD Biosciences), BV421-pAKT (Clone: M89-61 BD Bioscience), PE-pi3K (Clone: PI3KY458-1A11 Invitrogen) Brilliantblue700- PD-1 (Clone: RMP1-30 BD Biosciences), BV480-PD-1 (Clone: J43 BD Biosciences), PE-Perforin (Clone: S16009A Biolegend San Diego CA) BV750-GR-1 (Clone: RB6-8C5 BD Biosciences). Flow cytometry samples were analyzed on an Aurora spectral cytometer (Cytek Biosciences) or a Yeti cell analyzer (Propel Labs) through The University of Colorado Cancer Center Flow Cytometry Shared Resource.
Time of flight cytometry
Tumors for CyTOF were prepared as single cell suspension as described above. For LY2 tumor-bearing mice, 10 Gy RT was performed 11 days post-implantation when tumors reached average volumes of approximately 100 mm3. For MOC2 tumor-bearing mice, 10 Gy RT was performed 10 days post-implantation when tumors reached average volumes of approximately 100 mm3. Irradiated LY2 and MOC2 tumors were collected 4 and 3 days post-RT, respectively. Barcoding was performed with the Cell-ID 20-Plex Barcoding Kit (Fluidigm, South San Francisco, California, USA) on combined LY2 samples separately on combined MOC2 samples to enable consistent analysis of fluorescence between samples. Cell surface staining was performed with the Maxpar Cell Surface Staining kit (Fluidigm), phospho-protein staining was performed with the Maxpar Phospho-Protein Staining kit (Fluidigm) and intracellular marker staining was performed with the Maxpar Nuclear Antigen Staining kit (Fluidigm). Panels for staining using Maxpar antibodies are provided in online supplemental tables 2 and 3 Samples were analyzed with the Helios Mass Cytometer through The University of Colorado Cancer Center Flow Cytometry Shared Resource. Debarcoding analysis was performed with the Single Cell Debarcoder standalone application (R2013b 8.2. for Mac, Nolan Laboratory, Stanford University) with a Mahalanobis cut-off of 30 and a separation cut-off of 0.1.
Supplemental material
Supplemental material
Flow and CyTOF analysis
Analysis of flow cytometry and CyTOF data was performed with Flowjo software (V.10.6.2, Flowjo, Ashland, Oregon, USA). Fluorescence minus-one controls were using to determine gating strategy for flow cytometry experiments, and positive controls using splenocytes were used to determine gating for CyTOF experiments.
Plots using t-Distributed Stochastic Neighbor Embedding (t-SNE) were created with R programming language (V.3.6.1) using the cytofkit package (V.1.11.3). Sample groups were gated for CD45+ singlets and concatenated for input to cytofkit. Parameters used were transformation method cytofAsinh, Rphenograph_k value 30, t-SNE perplexity 30, t-SNE max iterations 2000, FlowSOM_k 40, visualization method t-SNE, and cellular progression NULL.
RNA-Seq
Tumors for RNA-Seq analysis were harvested and immediately frozen in liquid nitrogen. Frozen tumors were stored at –80°C until time of analysis. RNA from tumors was harvested using an RNA miniprep kit (Zymo research, Irvine CA). Sequencing and library prep were performed by The Genomics and Microarray Shared Resource at University of Colorado Denver Cancer Center. PolyA selection was used for library prep and sequencing was performed on an Illumina NovaSEQ 6000 with 2×150 paired end reads at a depth of 20 million reads per sample.
Illumina adapters and the first 12 base pairs of each read were trimmed using BBDuk (BBMap - Bushnell B. - sourceforge.net/projects/bbmap/), and reads <50bp post-trimming were discarded. Reads were aligned and quantified using STAR (2.6.0a)43 against the Ensembl mouse transcriptome (mg38.p6 genome (release 96)). Lowly expressing genes were removed if mean raw count <1 or mean counts per million (CPM) <1 for the dataset. Reads were normalized to CPM using the edgeR R package.44 Differential expression was calculated using the voom function in the limma R package.45 Gene set enrichment analysis was performed using the full ranked list of genes by fold change for the indicated comparison and the fgsea R package46 using Hallmark gene sets from the Molecular Signatures Database.24 A heatmap was generated with the ComplexHeatmap R package following z-score transformation.47
Magpix cytokine analysis
Terminal bleeds were taken via heart stick on sacrifice. Serum from blood samples was acquired by collecting blood in BD microtainers (BD Biosciences) and incubating for 30 min at room temperature. Tubes were centrifuged at 6000 RPM for 2 min and serum was collected and stored at –80°C until time of analysis. Serum was subjected to a custom Magpix cytokine analysis kit (Luminex, Austin Texas, USA). All protocols were run as per manufacturer’s instructions. Magpix plate analyzed using a Magpix plate reader available through The University of Colorado Cancer Center Flow Cytometry Shared Resource.
Adoptive transfer of Tregs
Spleens and lymph nodes of donor DEREG mice harvested and Tregs were first isolated with an EasySep Mouse CD4+ T cell Isolation Kit (Stemcell, Cambridge, Massachusetts, USA) and then sorted using GFP signal encoded on the FOXP3 promoter on a Sony MA900 through The University of Colorado Cancer Center Flow Cytometry Shared Resource. Cells were combined and 5.0×10⁵ live Tregs were injected via tail vein into recipient RAG1–/– mice with previously established and irradiated MOC2 buccal tumors. Recipient mice were sacrificed 9 days after adoptive transfer and tumors and lymph nodes were harvested for flow cytometric analysis.
Treg cytolytic assay
Spleens, tumors and tumor DLNs were harvested from MOC2 tumor-bearing DEREG mice 8 days post-treatment with 10 Gy RT. Samples were processed to single cell suspension in same method as above flow cytometry samples. Total T cells and Tregs were first isolated with an EasySep Mouse T Cell Isolation Kit (Stemcell) and then sorted using GFP signal encoded on the FOXP3 promoter on a Beckman Coulter MoFlo XDP70 cell sorter through The University of Colorado Cancer Center Flow Cytometry Shared Resource. MOC2 cells were cultured and irradiated with 10 Gy and 72 hours later were stained with Cell Tracker Deep Red (Invitrogen) before being combined with sorted Tregs with a 2:1 ratio of Tregs to MOC2 cells with the irradiated conditioned media. Tregs and MOC2 cells were incubated at 37°C for 4 hours in the presence of mouse IL-2 recombinant protein (Invitrogen) at 2 ug/mL and anti-CD137 (4-1BB, Bio X Cell) (Clone:3H3, Bio X Cell) or isotype equivalent control (rat IgG2a isotype control, antitrinitrophenol)(Clone:2A3, Bio X Cell) at 10 ug/mL. Samples were stained with a live/dead aqua viability stain kit (Invitrogen) for 30 min at 4°C and then analyzed on an Aurora spectral cytometer (Cytek Biosciences, Fremont, California, USA). Representative gating is shown in online supplemental figure 9.
Supplemental material
Supplemental material
Supplemental material
Supplemental material
Supplemental material
Data availability statement
Data are available on reasonable request. The data that support the findings of this study are available from the corresponding author on reasonable request.
References
Supplementary materials
Supplementary Data
This web only file has been produced by the BMJ Publishing Group from an electronic file supplied by the author(s) and has not been edited for content.
Footnotes
Twitter @KaramLab
MWK and TEB contributed equally.
Contributors SDK, MWK, and TEB conceptualized and designed the study and all experiments. MWK, TEB, LBD, AJO, SBha, SBhu, MP, JG, ACM, DM and VN performed mouse studies. MWK and TEB ran flow cytometry experiments. BVC carried out mouse irradiation treatments. DGO performed flow sorting. XB and EDC provided DEREG mice and advised related studies. AG and SEF performed bulk murine RNA-Seq analysis. BAT provided BATF3–/– mice and BAT and MB advised related studies. CRP provided human OSCC RNA-Seq dataset and clinical data and advised analysis. ETC consulted on flow cytometry studies. MWK, TEB and LBD performed analysis. SDK, MWK and TEB wrote the manuscript. All authors discussed, revised and approved the final manuscript.
Funding SDK is funded by the NIDCR (R01 DE028529-01, R01 DE028282-01) and receives clinical trial funding from Astra Zeneca for work unrelated to this research. This study was partly supported by the National Institutes of Health P30CA046934 Cancer Center Support Grant, including the Bioinformatics and Biostatistics Shared Resource Core, the Cancer Center Flow Cytometry Shared Resource, and the Genomics and Microarray Shared Resource at the University of Colorado. This study was also partly supported by the Cancer League of Colorado.
Competing interests No, there are no competing interests.
Provenance and peer review Not commissioned; externally peer reviewed.
Supplemental material This content has been supplied by the author(s). It has not been vetted by BMJ Publishing Group Limited (BMJ) and may not have been peer-reviewed. Any opinions or recommendations discussed are solely those of the author(s) and are not endorsed by BMJ. BMJ disclaims all liability and responsibility arising from any reliance placed on the content. Where the content includes any translated material, BMJ does not warrant the accuracy and reliability of the translations (including but not limited to local regulations, clinical guidelines, terminology, drug names and drug dosages), and is not responsible for any error and/or omissions arising from translation and adaptation or otherwise.