Article Text

Abstract
An important component of research using animal models is ensuring rigor and reproducibility. This study was prompted after two experimenters performing virtually identical studies obtained different results when syngeneic B78 murine melanoma cells were implanted into the skin overlying the flank and treated with an in situ vaccine (ISV) immunotherapy. Although both experimenters thought they were using identical technique, we determined that one was implanting the tumors intradermally (ID) and the other was implanting them subcutaneously (SC). Though the baseline in vivo immunogenicity of tumors can depend on depth of their implantation, the response to immunotherapy as a function of tumor depth, particularly in immunologically ‘cold’ tumors, has not been well studied. The goal of this study was to evaluate the difference in growth kinetics and response to immunotherapy between identically sized melanoma tumors following ID versus SC implantation. We injected C57BL/6 mice with syngeneic B78 melanoma cells either ID or SC in the flank. When tumors reached 190–230 mm3, they were grouped into a ‘wave’ and treated with our previously published ISV regimen (12 Gy local external beam radiation and intratumoral hu14.18-IL2 immunocytokine). Physical examination demonstrated that ID-implanted tumors were mobile on palpation, while SC-implanted tumors became fixed to the underlying fascia. Histologic examination identified a critical fascial layer, the panniculus carnosus, which separated ID and SC tumors. SC tumors reached the target tumor volume significantly faster compared with ID tumors. Most ID tumors exhibited either partial or complete response to this immunotherapy, whereas most SC tumors did not. Further, the ‘mobile’ or ‘fixed’ phenotype of tumors predicted response to therapy, regardless of intended implantation depth. These findings were then extended to additional immunotherapy regimens in four separate tumor models. These data indicate that the physical ‘fixed’ versus ‘mobile’ characterization of the tumors may be one simple method of ensuring homogeneity among implanted tumors prior to initiation of treatment. Overall, this short report demonstrates that small differences in depth of tumor implantation can translate to differences in response to immunotherapy, and proposes a simple physical examination technique to ensure consistent tumor depth when conducting implantable tumor immunotherapy experiments.
- immunogenicity
- vaccine
- immunotherapy
- tumor microenvironment
- melanoma
- immunologic techniques
Data availability statement
Data are available upon reasonable request to the corresponding author, PMS.
This is an open access article distributed in accordance with the Creative Commons Attribution Non Commercial (CC BY-NC 4.0) license, which permits others to distribute, remix, adapt, build upon this work non-commercially, and license their derivative works on different terms, provided the original work is properly cited, appropriate credit is given, any changes made indicated, and the use is non-commercial. See http://creativecommons.org/licenses/by-nc/4.0/.
Statistics from Altmetric.com
Introduction
Scientific investigations conducted in an effective and reproducible manner are the mainstay of basic, translational, and clinical biomedical research. The National Institutes of Health (NIH) has implemented new guidelines in an effort to improve rigor and reproducibility in scientific research, with the goal of enhancing scientific integrity and transparency.1 In syngeneic implantable models for tumor immunotherapy, care is taken to control confounding factors. Subtle variances within these systems can lead to differing responses, despite holding constant as many factors as possible. Variations in diet, animal housing temperature, and even vendor source can affect the response to immunotherapy.2–4 These and other potentially unknown factors can result in differences in the tumor-immune microenvironment and may influence response to immunotherapy. Murine tumor immunology experiments can be plagued by high variability, making statistical evaluation difficult and hampering the ability to reliably extend and build on the published results of others.5 6
Previous work in vaccine development demonstrated that different cutaneous tissue planes can influence the degree of immune response to an implanted tumor.7 8 In studying the immunogenic EL4-OVA transfected tumor line, Joncker et al demonstrated that an EL4-OVA inoculum injected intradermally (ID) failed to develop, while the same tumor inoculum injected subcutaneously (SC) grew into a progressive and lethal tumor.9 The difference in response was due to a difference in the kinetics of dendritic cell (DC) migration and tumor-specific T-cell activation at the tumor-draining lymph node between the two tumor implantation depths, but only controlled the tumor in the ID space. In this setting, the stronger immune response in the ID space was sufficient to prevent growth of the EL4-OVA immunogenic tumor. However, less immunogenic (immunologically ‘colder’) tumor models may still be able to develop in both the ID and SC space, but retain a difference in baseline antitumor immune response. For these tumor models, immunotherapy is required to drive a sufficient antitumor response. Yet, the effect of depth of tumor implantation in the skin on response to immunotherapy has not been well studied in syngeneic murine models. This manuscript expands on Joncker et al’s published work by determining a role of tumor implantation depth in response to immunotherapy.
We have previously demonstrated that local external beam radiation therapy (RT) primes immune responses and synergizes with intratumoral injections of hu14.18-IL2 immunocytokine ((IC), an anti-disialoganglioside (GD2) antibody fused to interleukin 2 (IL2)) to achieve tumor control in an implantable, GD2-positive B78 syngeneic melanoma model that does not respond to immune checkpoint blockade therapy alone.10 This therapy was mechanistically T-cell dependent, and mice rendered disease free developed immunological memory, demonstrating that this RT+IC immunotherapy acts as an in situ vaccine (ISV). Yet, our group noted substantial interexperimenter variability in tumor response rates to ISV without a clear distinguishing cause. This study investigates the influence of tumor implantation depth on response to this ISV immunotherapy.
Methods
Syngeneic tumor cell line
B78-D14 (B78) murine melanoma (provided by Ralph Reisfeld, Scripps Research Institute, La Jolla, California) is a GD2-positive cell line distantly derived from B16-F10 melanoma, cultured as previously described.11 12 Unlike the B16 line, this tumor grows more slowly, has an encapsulated mass, and does not spontaneously metastasize.10
Animals and tumor models
Animals were cared for using a protocol approved by the University of Wisconsin-Madison Institutional Animal Care and Use Committee. Female, 6–8-week-old C57BL/6 mice from Taconic Biosciences (Rensselaer, New York) were inoculated after ~1 week with 2×10⁶ B78 cells in 100 μL phosphate buffered saline (PBS). For tumors intentionally implanted ID, the beveled tip of the needle was inserted face up at a <10° angle and advanced 2–3 mm into the tissue parallel to the skin while lifting the needle to create a tenting effect. This resulted in a well-demarcated weal and could be felt as pressure or resistance during injection. For tumors intentionally implanted SC, the needle was inserted at a ~20° angle and advanced 5–7 mm into the tissue while remaining superficial to the flank musculature. This created a less clearly observable weal, without strong resistance. Tumor volume ((width2×length)/2) was measured two times per week using calipers. Mice were randomized using a random number generator into treatment groups when tumors reached 190–230 mm3 and assigned to a ‘wave.’ One to two mice per wave were randomly assigned to receive PBS control treatment.
Tumor treatments
On day 1 post randomization, tumors received a single 12 Gy fraction of RT as previously described.10 On days 6–10 post randomization, 50 µg of hu14.18-IL2 IC (Apeiron Biologics, Vienna, Austria) was injected in 100 µL PBS intratumorally (figure 1A).
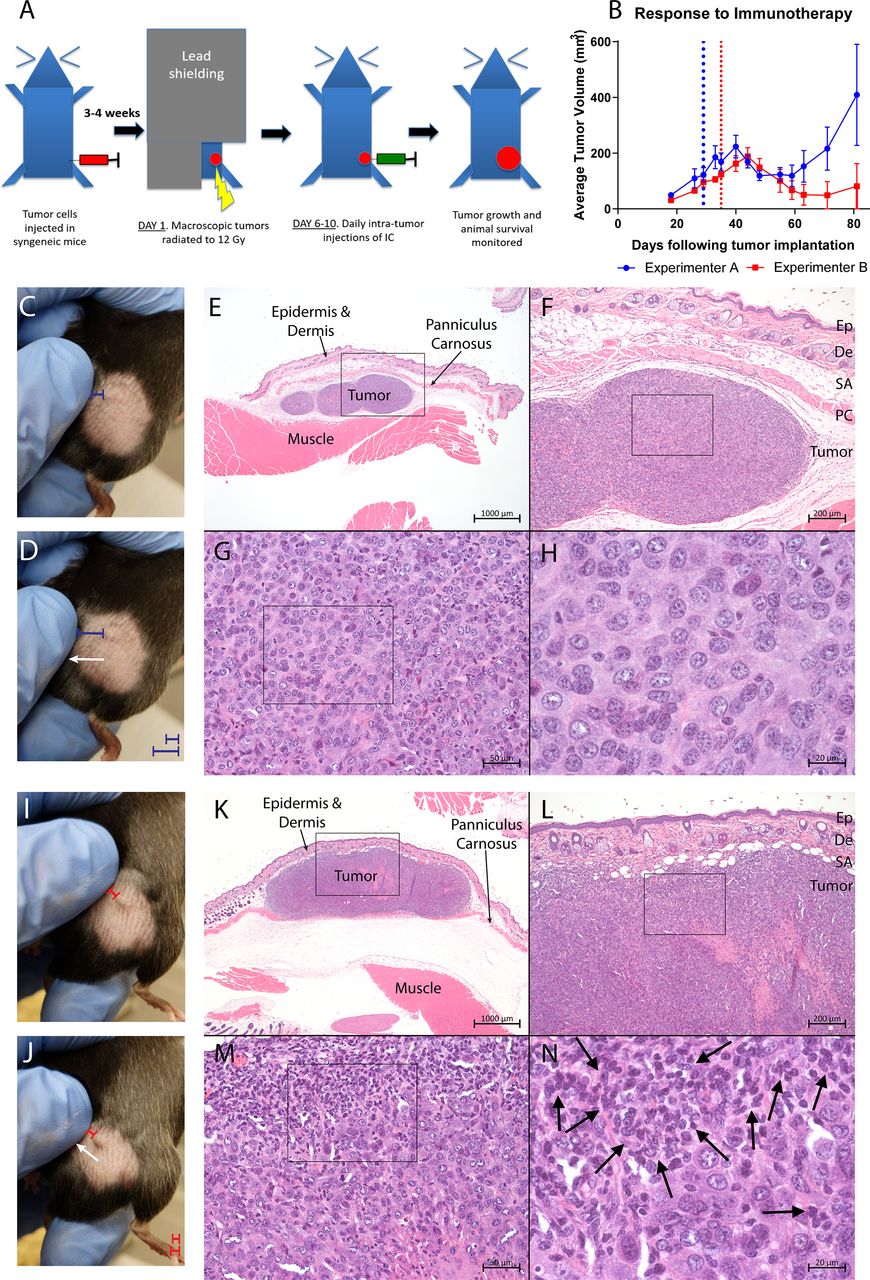
Different results obtained from two different researchers conducting the same experiment. (A) Schema of ISV treatment approach, as described in the ‘Methods’ section. (B) Average±SEM tumor volume of n=5 mice implanted with tumors by either experimenter A (blue) or experimenter B (red) and treated using the ISV described in (A). Both groups were treated and measured identically by experimenter A. Vertical dotted lines represent the day on which treatment began (when tumors reached ~150 mm3) for the mice implanted by experimenter A (blue) or by experimenter B (red). (C,D) Physical examination of tumors implanted by experimenter A reveals a distinct ‘fixed’ phenotype of the tumors in response to lateral displacement of the overlying skin. Note in (C) the short distance (blue bar) between the experimenters finger and the left margin of the tumor, in contrast note in (D) how the lateral leftward movement (white arrow) of the overlying skin increases the distance from the finger to the left margin of the tumor (blue bar), indicating that the tumor is not attached to the skin. (E–H) Histologic examination by H&E staining of ‘fixed’ tumors demonstrates the tumors reside deep to the cutaneous proper, which is delineated by the PC. (I,J) Physical examination of tumors implanted by experimenter B reveals a distinct ‘mobile’ phenotype of the tumors in response to lateral displacement of the overlying skin. Note in (I) the short distance (red bar) between the experimenters finger and the left margin of the tumor does not increase in (J) with lateral leftward movement (white arrow shown in (J)) of the skin that is attached to the ‘mobile’ tumor. (K–N) Histologic examination shows that ‘mobile’ tumors are either superficial to or invading the PC (seen in (K)) and reside in the true skin compartment. Further, qualitative assessment identifies distinct mononuclear cells, likely infiltrating lymphocytes, infiltrating the ‘mobile’ tumor ((N), marked by arrows). Online supplemental videos 1 and 2 demonstrate the ‘fixed’ and ‘mobile’ phenotypes shown in (C,D) and (I,J) in greater detail. De, dermis; Ep, epidermis; ISV, in situ vaccine; PC, panniculus carnosus; SA, subcutaneous adipose.
Supplementary video
Supplementary video
Tissue harvest, preparation, and histological analysis
Following CO2 asphyxiation, tumors were dissected en bloc to preserve anatomical relation to surrounding tissues. Specimens were fixed in 10% neutral buffered formalin for 48 hours. Samples were paraffin processed, sectioned into 5 μm slices, and stained with H&E. Sections were visualized under a SCOPE.A1 microscope (Zeiss), and images were captured using an AxioCam HR camera (Zeiss).
Statistical analysis
The data are presented as mean±SEM, except where noted. Time to treatment size and overall survival analyses was performed using the Kaplan-Meier method with comparisons using a log-rank test. Comparisons of tumor volume at treatment day 33 were done using a one-way analysis of variance with multiple comparisons conducted by the Sidak method. Comparison of growth rates between ID and SC tumors treated with ISV was done using linear mixed effects models of log-transformed data to estimate slopes. Statistical analyses were conducted using R and GraphPad Prism software (San Diego, California).
Results
Experimenters conducting the same experiment obtained disparate results associated with different tumor implantation depths
We noticed that the efficacy of ISV varied, especially when comparing results obtained by different experimenters. To test implantation technique as a possible reason for this variability, two cohorts of C57BL/6 mice were implanted with B78 tumor cells, one by experimenter A and another by experimenter B. Both experimenters injected tumors consistent with their understanding of a ‘subcutaneous’ injection. Once each cohort reached ~150 mm3 average, they were treated by experimenter A using our ISV regimen.10 Four out of five tumors implanted by experimenter B became tumor free following treatment, compared with only 1/5 implanted by experimenter A (figure 1B).
Examination of untreated tumors implanted by both experimenters revealed that most tumors implanted by experimenter A had a ‘fixed’ phenotype, where lateral displacement of the skin over the tumor did not result in tumor displacement. There was no apparent tumor connection to the skin, as it would move over the tumor (figure 1C,D). In contrast, most tumors implanted by experimenter B had a ‘mobile’ phenotype, where lateral displacement of the skin resulted in displacement of the tumor. These tumors appeared connected to, and moved freely with, the skin (figure 1I,J and online supplemental videos 1 and 2).
Histologic analysis confirmed that these ‘fixed’ and ‘mobile’ tumors occupied different tissue planes within the skin compartment. ‘Fixed’ tumors were deep to the thin layer of dermal striated muscle called the panniculus carnosus (PC), which is present in most mammals and separates the true skin compartment from underlying fascial layers (figure 1E,F).13 14 In contrast, ‘mobile’ tumors were either completely superficial to or invading/involved with the PC; they could be seen invading true skin compartment structures including the dermal white adipose tissue, dermis, and lymphatics (figure 1K,L). Together, these observations demonstrate that different experimenters with substantial mouse-handling experience can implant tumors at different depths in the skin, which may impact treatment outcome and contribute to increased variability.
Response rates to ISV are greater in ID versus SC tumors
The starting size of a tumor influences treatment response to ISV.15 To explore the effect of tumor implantation depth on response to ISV while controlling for tumor size, a staggered treatment start experiment was conducted. A cohort of mice was injected with B78 cells to intentionally be ID/mobile, while a second cohort was injected to be intentionally SC/fixed. Whenever tumors reached 190–230 mm3, they were grouped into a treatment ‘wave’ and treated with ISV (figure 1A), with 1–2 untreated control mice per wave.
In total, there were 10 distinct treatment ‘waves’ (figure 2). SC-implanted tumors grew faster, reaching treatment size in a median of 22 days post implantation, while ID-implanted tumors took a median of 36 days to reach treatment size (figure 2A). Consistent with figure 1B, ID-implanted tumors responded to ISV better than SC-implanted tumors (figure 2B, table 1). Median survival post treatment for ID-implanted tumors was significantly longer than SC-implanted tumors (figure 2B and table 1). Both SC-implanted and ID-implanted tumors had a prolonged survival following treatment compared with untreated controls (figure 2B, table 1). Overall, 11 out of 22 (50%) ID-implanted mice demonstrated a complete response to ISV and remained disease free, compared with 0/24 SC-implanted mice (figure 2C and D). Direct comparison of tumor volumes on post treatment day 33 demonstrated significant differences between all treated and untreated groups, with significantly lower average tumor volumes in the ID-treated compared with the SC-treated groups (figure 2E). In addition, linear mixed effects modeling predicted a growth factor of 0.42 (0.37–0.48) every 30 days for ID-implanted/treated tumors, while SC-implanted/treated tumors grew by a factor of 3.07 (2.64–3.53) every 30 days (p<0.0001). Lastly, response to ISV as measured by overall survival did not depend on treatment ‘wave’ for both ID-implanted (p=0.877) and SC-implanted (p=0.340) tumors (figure 2F and online supplemental figures 1 and 2).
Supplemental material
Supplemental material
Time-to-event comparisons corresponding to figure 2
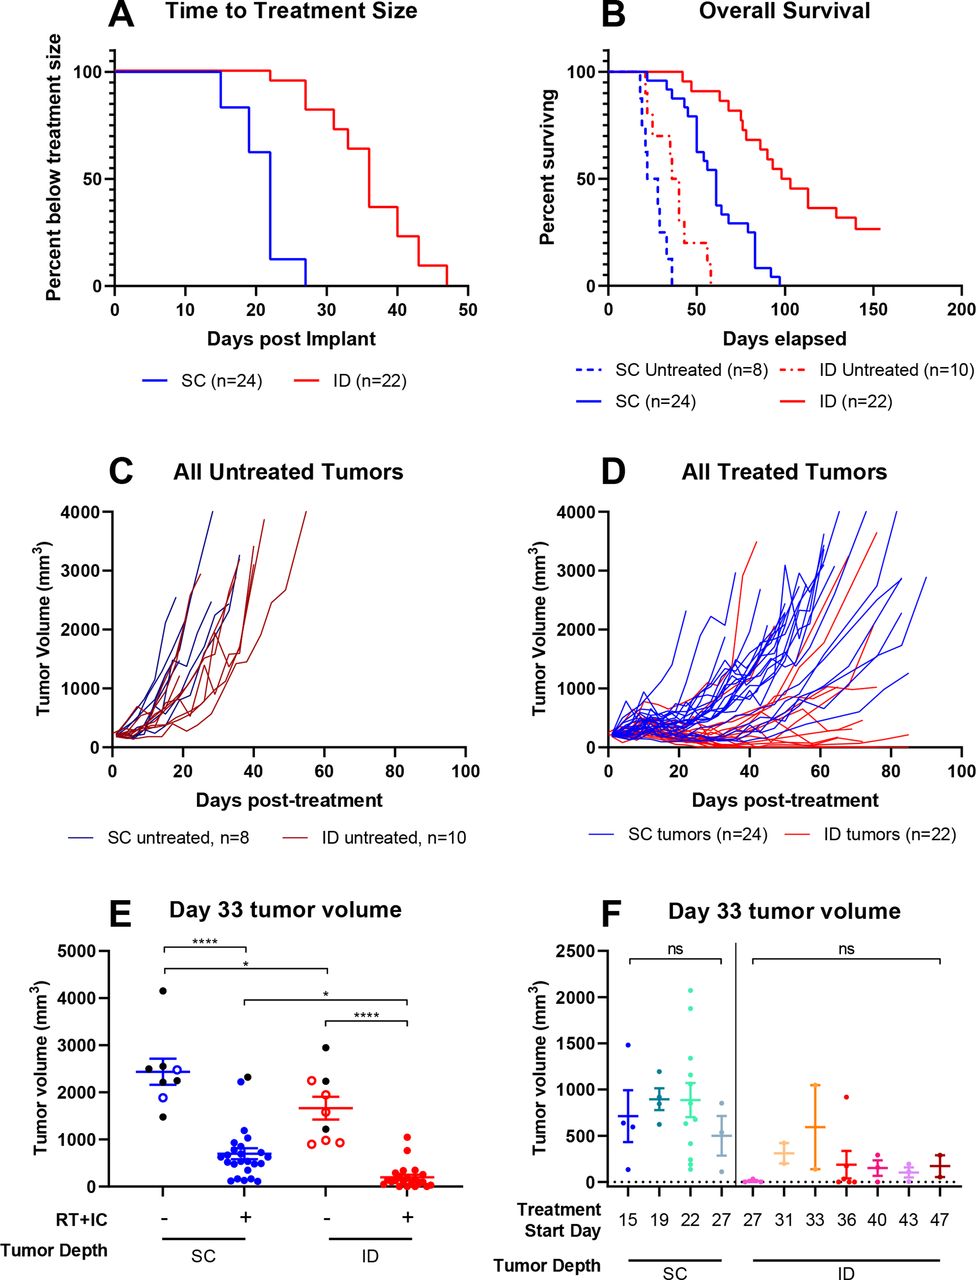
Intradermal tumors are more likely to respond to immunotherapy than subcutaneous tumors. Female, C57BL/6 mice were injected on the same day in the right flank intentionally aiming for either intradermal (ID, red) or subcutaneous (SC, blue) placement of the tumor. Mice were monitored weekly, and when tumors reached treatment size (190–230 mm3), they were collected into a ‘treatment wave’ and treated with either PBS control or our previously published in situ vaccine as described in the ‘Methods’ section. (A) Time to event analysis representing the time from tumor implantation to reaching treatment size. (B) Survival analysis representing the time from initiation of treatment (either PBS control or RT+IC ISV) to death or tumor meeting size criteria for sacrifice. Statistical comparisons for (A) and (B) were conducted using log-rank comparisons, with resulting p values presented in table 1. (C) Tumor volumes (mm3) were measured two times per week for all untreated tumors. (D) Tumor measurements for all treated tumors were also measured weekly. (E) Tumor volume at day 33 following treatment initiation for both treated and control mice. Data are presented as points representing individual tumor volumes and horizontal bars representing the mean±SEM tumor volume for each treatment group. Black dots represent tumors on mice that died before treatment day 33, with their last value carried forward and shown here. Statistical analysis was conducted by one-way analysis of variance with multiple comparisons using the Sidak method. (F) Tumor volume at day 33 of treatment for mice bearing ID or SC tumors, divided into treatment waves (defined by the day post tumor implant of treatment initiation). Ten different waves are included: waves at days 15, 19, and 22 for the SC tumors, a wave at day 27 for both SC and ID tumors, and waves at days 31, 33, 36, 40, 43, and 47 for the ID tumors. Shown here are only those waves that have two or more mice. A single additional wave (not shown here but included in online supplemental figures 1 and 2) included a single ID mouse starting treatment on day 22. Data are presented as points representing individual tumor volumes, with horizontal bars representing the mean±SEM tumor volume for each treatment group. *p<0.05, **p<0.01, ***p<0.001, ****p<0.0001. IC, immunocytokine; ISV, in situ vaccine; ns, not significant; PBS, phosphate buffered saline; RT, radiation therapy.
‘Mobile’ versus ‘fixed’ tumor status is associated with treatment outcome
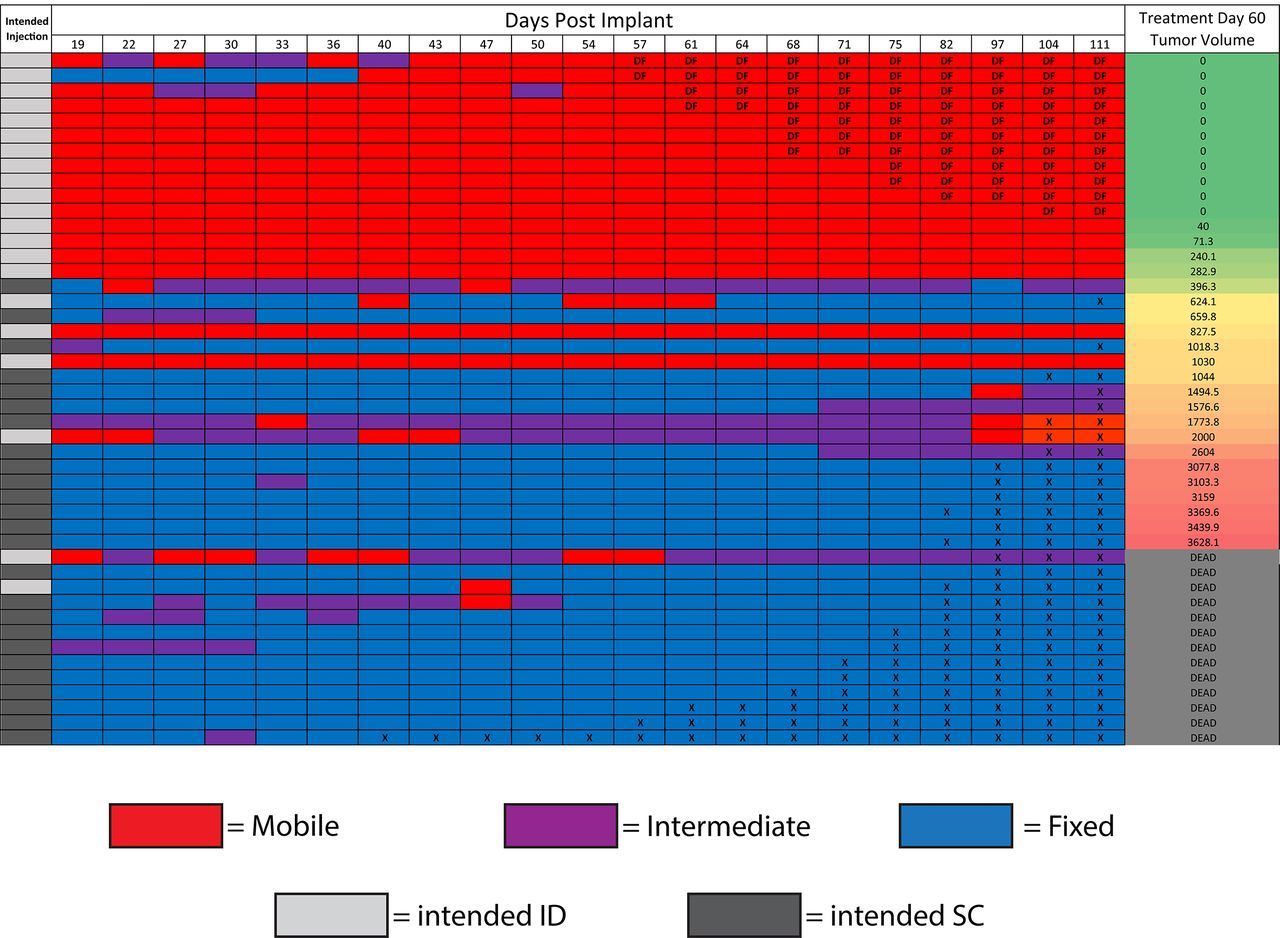
As a means of non-invasively confirming tumor implantation depth, the ‘fixed’ or ‘mobile’ status of each tumor was evaluated in a blind fashion. At each time point during this experiment, tumors were designated as entirely ‘fixed,’ entirely ‘mobile,’ or ‘intermediate’ if they had qualities of both, such as a bilobed or partially mobile phenotype (figure 3). Observed tumor status was largely consistent with the intended injection depth; the majority of ID-implanted mice developed ‘mobile’ tumors, and the majority of SC-implanted mice developed as ‘fixed’ tumors. A heat map was generated to track physical-examination status of the tumors over time. After ranking all mice based on the tumor volume at treatment day 60 (blind to intended implantation depth), a clear clustering phenomenon was observed (figure 3). All mice rendered disease free had a predominantly ‘mobile’ phenotype; all mice that died from tumor burden had predominantly ‘fixed’ or ‘intermediate’ phenotype. In general, mice with the smallest day 60 tumor volumes were ‘mobile,’ and those with the largest tumor volumes were ‘fixed.’ In addition, those tumors intended to be ID, but with ‘fixed’ phenotypes, behaved similarly to the other ‘fixed’ tumors. This implies a strong association between the response to ISV and depth of tumor implantation; the physical ‘fixed’ or ‘mobile’ status appeared more closely associated with treatment outcome than the original ‘intended’ treatment group.

Mobile/fixed status predicts response to RT+IC in situ vaccine. Female C57BL/6 mice used in the experiment described in figure 2 were evaluated by physical examination at each measurement time point. Each row in the figure above represents an individual mouse, and each column represents the measurement time point in days post tumor implantation. Mice with ‘mobile’ tumors (as described in figure 1, online supplemental video 1, and in the ‘Results’ section) were coded red, and mice with ‘fixed’ tumors (figure 1, online supplemental video 2, and the ‘Results’ section) were coded blue. Mice with mixed or intermediate physical examination findings (as described in the ‘Results’ section) were coded purple. Mice that were sacrificed due to tumor burden have an ‘X’ in their cells starting at the time of sacrifice, and mice that were rendered Disease Free (DF) by treatment have a ‘DF’ in their cell, starting at the time tumor was no longer detected. Mice were then ranked in the far-right column based on their tumor volume at treatment day 60 and listed as dead if they had died or been sacrificed prior to day 60. The ‘intended injection’ column on the left indicates which depth of tumor was intended on implantation (light gray for ID, dark gray for SC). IC, immunocytokine; ID, intradermal; SC, subcutaneous RT, radiation therapy.
Following these observations, four additional syngeneic tumor models and five immunotherapy regimens were investigated to determine the degree of applicability of these findings (online supplemental figures 3-6 and online supplemental tables 1-4). ‘Mobile’ and ‘fixed’ phenotypes were observed in each of these four additional tumor models. In murine models of CT26 colon adenocarcinoma, B16-GD2 melanoma, and MOC2 head and neck squamous cell carcinoma, SC-implanted tumors grew faster than ID-implanted tumors. The degree of response to multiple immunotherapies (detailed in online supplemental figures 3-6 and online supplemental tables 1-4) was substantially different between ID and SC tumors in the CT26, B16-GD2, and Panc02 pancreatic adenocarcinoma models as well.
Supplemental material
Supplemental material
Supplemental material
Supplemental material
Supplemental material
Discussion
Our findings highlight the need for detailed documentation of experimental methods and expand published studies indicating that tumor depth can influence antitumor immune response.8 9 B78 melanoma tumors grow at different rates in the ID versus SC space and show significant differences in response to ISV immunotherapy (figure 2). This phenomenon appears to extend to additional tumor models and other immunotherapy regimens as well (online supplemental figures 3-6). As reported by Joncker et al, OVA-antigen-laden DCs were detected in the draining lymph node of EL4-OVA tumors as early as 2 days post inoculation for ID-implanted tumors, but took 8 days for detection in SC-implanted tumors.9 Joncker et al used immunologically ‘hotter’ tumors: ID implantation failed to result in tumor growth. Our results here expand on this past work by including the immunologically ‘colder’ B78 melanoma model and others, which grow readily and avoid immune destruction even in the ID space. Further, we extend the difference in functional immunogenicity between the ID and SC space to include response to multiple distinct immunotherapy regimens. In this B78 model system, potent RT+IC ISV can cure some mice of ID tumors, but can only slow the growth of SC tumors (figure 2B and D). To our knowledge, this is the first explicit demonstration of implantation depth affecting not only tumor growth rate but also response to direct intratumoral immunotherapy.
We observed that mobile, ID-implanted tumors grew either in marginal association with or above the PC while deeper, fixed, SC-implanted tumors were deeper into or below the PC. The ID space is known to contain a higher density of DCs, with specialized blind-ended lymphatics connected to a superficial lymphatic plexus, whereas the SC space contains mostly monocytes and macrophages, with lymphatic vessels connecting to a deeper lymphatic plexus.16 17 This difference in lymphatic architecture may support Joncker et al’s observed differential kinetics of DC mobilization on tumor challenge in these two spaces.9 Clinically, tumors that have greater immune infiltrates at diagnosis seem to have a higher rate of response to immunotherapy and are considered immunologically ‘hotter.’18 This is likely consistent with both our and Joncker et al’s observations, given the greater potential tumor immune cell infiltrate in some ID versus SC tumors (figure 1N).9 Using this difference, future studies may be able to tune the immunologic ‘coldness’ of a given tumor line in mouse models through intentional differences in implantation depth. A more complete characterization of the mechanism of antigen recognition, effector immune cell recruitment and infiltration, tumor vascularization, and effector response to immunotherapy may be considered, though is beyond the scope of this report.
We identified that slight differences in depth of tumor implantation (~300 µm) can create substantial differences in response to immunotherapy. The NIH has asked researchers to be more transparent and explicit with their methodologic descriptions.19 Based on our experience, it is likely that in mouse experiments ‘subcutaneous’ is sometimes used as a common term to describe either SC or ID implantation; most published studies do not detail procedures for confirming the implantation depth of tumors used in their experiments. This study documents the importance of accurately and robustly describing the method and location of tumor implantation, as well as the means of confirming implantation depth. Using histologic and physical observations, we delineate between deeper, ‘fixed’ tumors and more superficial, ‘mobile’ tumors and propose incorporating this physical examination finding as an additional criterion for conducting consistent, reproducible implantable tumor immunotherapy experiments.
Data availability statement
Data are available upon reasonable request to the corresponding author, PMS.
Ethics statements
Ethics approval
The research contained in this manuscript does not use patient data in any form. Animal studies were conducted according to a protocol approved by the University of Wisconsin Institutional Animal Care and Use Committee.
Acknowledgments
The authors would like to thank Anna Hoefges, Alex Pieper, Alexa Heaton, and Taylor Aiken for thoughtful discussion.
References
Supplementary materials
Supplementary Data
This web only file has been produced by the BMJ Publishing Group from an electronic file supplied by the author(s) and has not been edited for content.
Footnotes
PMC and MM contributed equally.
Contributors PMC and MM were responsible for experimental design, execution, and analysis of data. PMC created final versions of all figures and drafted the manuscript. MR and CS collected and analyzed experimental data. VS collected tissue for histologic analysis and captured histology images. JB conducted and confirmed statistical analysis of experimental data. RBP, JH, ALR, and ZM contributed to experimental design, thorough edits, and review of the manuscript. AE contributed to experimental design, data collection, mouse colony maintenance, and literature research. PMS provided experimental design and review of data. All authors provided thorough review and editing of the manuscript draft.
Funding This work was supported by Midwest Athletes Against Childhood Cancer, Stand Up To Cancer, the St. Baldrick’s Foundation, the Crawdaddy Foundation, and the University of Wisconsin Carbone Cancer Center. This research was also supported in part by public health service grants TR002373, U54-CA232568, R35-CA197078, 5K08CA241319, 1DP5OD024576, P01 CA250972, and U01-CA2331 02 from the National Cancer Institute; the National Institutes of Health (NIH), and the Department of Health and Human Services. PMC was supported by National Cancer Institutes and the NIH award F30CA228315 and NIH award TL1 TR002375. The content is solely the responsibility of the authors and does not necessarily represent the official views of the NIH.
Competing interests None declared.
Provenance and peer review Not commissioned; externally peer reviewed.
Supplemental material This content has been supplied by the author(s). It has not been vetted by BMJ Publishing Group Limited (BMJ) and may not have been peer-reviewed. Any opinions or recommendations discussed are solely those of the author(s) and are not endorsed by BMJ. BMJ disclaims all liability and responsibility arising from any reliance placed on the content. Where the content includes any translated material, BMJ does not warrant the accuracy and reliability of the translations (including but not limited to local regulations, clinical guidelines, terminology, drug names and drug dosages), and is not responsible for any error and/or omissions arising from translation and adaptation or otherwise.