Article Text

Abstract
Background CD8+ tissue-resident memory T (TRM) cells, marked by CD103 (ITGAE) expression, are thought to actively suppress cancer progression, leading to the hypothesis that their presence in tumors may predict response to immunotherapy.
Methods Here, we test this by combining high-dimensional single-cell modalities with bulk tumor transcriptomics from 1868 patients enrolled in lung and bladder cancer clinical trials of atezolizumab (anti-programmed cell death ligand 1 (PD-L1)).
Results ITGAE was identified as the most significantly upregulated gene in inflamed tumors. Tumor CD103+ CD8+ TRM cells exhibited a complex phenotype defined by the expression of checkpoint regulators, cytotoxic proteins, and increased clonal expansion.
Conclusions Our analyses indeed demonstrate that the presence of CD103+ CD8+ TRM cells, quantified by tracking intratumoral CD103 expression, can predict treatment outcome, suggesting that patients who respond to PD-1/PD-L1 blockade are those who exhibit an ongoing antitumor T-cell response.
- biomarkers
- tumor
- CD8-positive T-lymphocytes
- gene expression profiling
- immunotherapy
- lymphocytes
- tumor-infiltrating
Data availability statement
Data are available in a public, open access repository. All data relevant to the study are included in the article or uploaded as supplementary information. All data from bulk RNA sequencing (RNAseq) of patients from the IMvigor210 clinical trial are available within the European Genome-Phenome Archive under accession number EGAS00001002556 and have also been previously published. The resulting data from mass cytometry analyses are deposited in Flowrepository.org. Single-cell RNA and TCR sequencing data used in these studies have previously been published and are available within EGA under studies EGAS00001003993 and EGAS00001003994 and datasets EGAD00001005464 and EGAD00001005465. The bladder tumor dataset obtained from Oh et al., 202061 is publicly available in the NCBI GEO database under accession GSE149652. Coordinates for generation of the UMAP were obtained from the authors. There are restrictions to the availability of bulk RNAseq datasets from patients enrolled in OAK and IMvigor211 clinical trials, but a normalized expression matrix for ITGAE and CD8A, the only genes included from these trials in these studies, is provided as a supplementary file.
This is an open access article distributed in accordance with the Creative Commons Attribution Non Commercial (CC BY-NC 4.0) license, which permits others to distribute, remix, adapt, build upon this work non-commercially, and license their derivative works on different terms, provided the original work is properly cited, appropriate credit is given, any changes made indicated, and the use is non-commercial. See http://creativecommons.org/licenses/by-nc/4.0/.
Statistics from Altmetric.com
- biomarkers
- tumor
- CD8-positive T-lymphocytes
- gene expression profiling
- immunotherapy
- lymphocytes
- tumor-infiltrating
Introduction
Checkpoint therapies can induce potent and durable clinical responses in subsets of patients with cancer across multiple indications. Treatment regimens targeting programmed cell death 1 (PD-1) or programmed cell death ligand 1 (PD-L1) disrupt an inhibitory signaling program in T cells that reduces their cytolytic activity.1 Thus, blockade of PD-1/PD-L1 binding has been hypothesized to result in the reinvigoration of these T cells and their subsequent killing of tumor cells. While a subset of patients achieve robust antitumor responses with these therapies, many do not, with minimal response rates of 20%–30% across indications such as melanoma, non-small cell lung, urothelial, head and neck, gastrointestinal, and hepatocellular cancers.2 As such, the variability in clinical response to checkpoint inhibitors has generated interest in the heterogeneity and function of the intratumoral T cells critical for efficacy.3 Much attention has been paid to an ‘exhausted’ population of CD8+ T cells that exhibit multiple checkpoint regulators and are presumed to have diminished effector function due to chronic antigen exposure.1 However, the relationship between exhaustion and response to checkpoint blockade is controversial. While some studies correlate exhaustion to poor clinical outcomes,4–9 others have defined a subpopulation of CD103+ CD8+ tissue-resident memory T (TRM) cells that appear exhausted, but are also proliferative and associate with cancer survival.10
TRM cells are a specialized population of T cells responsible for the rapid initiation of local immune responses within epithelial tissues, thereby providing protective immunity against invading microbes.11 TRM cells are broadly distributed in adult human tissues such as the skin, lungs, intestines, and brain.12 13 Furthermore, TRM cells have been implicated in mediating proinflammatory responses in autoimmune diseases such as psoriasis, alopecia areata, vitiligo, as well as ulcerative colitis.14 15 TRM cells are defined phenotypically by their expression of CD103 (integrin αE or ITGAE), which pairs with integrin β7 to form the αEβ7 heterodimer.16–18 αEβ7 is exclusively expressed in immune cells and binds to the epithelial protein E-cadherin, mediating intraepithelial lymphocyte localization.19
CD103+ TRM cells play an essential role in limiting tumor growth20 21 as well as in immune surveillance of solid tumors.22 23 Consistent with these observations, tumor infiltration with CD103+ TRM cells has been associated with better clinical outcomes in patients with lung, bladder, endometrial, gastric, and colorectal cancers receiving standard of care therapies.10 22 24–28 Furthermore, CD103+ CD8+ T cells have been shown to preferentially localize in tumor epithelium compared with the surrounding stroma, with better patient outcomes observed with elevated TRM cell frequency within tumor nests.28–30 Expression of CD103 by TRM cells is primarily induced by exposure to tissue-derived cytokines such as tumor growth factor β and interleukin-15.31–34 However, it has been reported that T-cell receptor (TCR) engagement is also necessary to induce CD103 upregulation.35 36 Thus, CD103+ tumor-infiltrating T cells may be the progeny of lymph node-activated and recirculating T effector (TEFF) or T stem-cell memory (TSCM) cells that have recently migrated into tumor tissues and differentiated as a result of exposure to these cytokines and tumor antigens.37
Elevated expression of immune checkpoint regulators such as PD-1 and TIM3 as well as enhanced proliferation (Ki-67) and activation (CD38) markers indicate that TRM cells have the potential to actively limit tumor growth and play a key role in the response to cancer immunotherapy.38 In addition, CD103+ CD8+ cells that coexpress CD39 (ENTPD1) have been found to be uniquely tumor reactive, while their CD39- counterparts are considered ‘bystander’ cells, often bearing TCRs specific for microbial antigens.35 39 However, this observation remains controversial as other studies have found shared TCR clonotypes across different CD8+ T-cell subsets, implying ongoing differentiation between phenotypes within the tumor.40 Importantly, CD39 expression also defines CD8+ T-cell clonotypes in tumors that are expanded and presumptively activated following anti-PD-1 therapy.39 41 It thus seems possible that CD103+ TRM cells are poised to respond to PD-1/PD-L1 blockade.42 One recent study has demonstrated an association between the presence of CD103+ CD8+ T cells in lung tumors and patient response to checkpoint blockade.43 However, the hypothesis that immune CD103 expression in tumors is predictive of response to cancer immunotherapy has not been comprehensively evaluated in large randomized clinical trials.
Our previous studies have identified clonally expanded CD8+ TEFF cells in blood with shared clonotypes across both tumor and adjacent non-neoplastic tissues, suggesting that antitumor immunity is characterized by a continuous production of reactive T cells at sites external to the tumor.44 These peripherally expanded TEFF cells shared clonotypes with tumor TRM cells, indicating differentiation of peripheral TEFF into TRM following migration into the tumor. Here, we expand on these studies by focusing on intratumoral TRM cells and probe the relationships between CD8+ T-cell tumor infiltration, phenotype, proliferation, and clonal expansion using multidimensional approaches. Our analysis of a cohort of 1868 patients treated with the anti-PD-L1 antibody atezolizumab reveals that CD103 expression does indeed closely correlate with response to immunotherapy and highlights CD8+ TRM as a critical player in the antitumor response.
Materials and methods
Human subjects
Samples analyzed from clinical trials were collected as prescreening biopsies obtained from archived paraffin-embedded tissue. Patients were required to have tissue sent to the central laboratory prior to entry into the study. Samples were processed at the time of screening. Tissue samples from three clinical trials were used for these analyses: (1) OAK (NCT02008227), a phase III randomized study comparing atezolizumab (anti-PD-L1 antibody, 1200 mg every 3 weeks) with docetaxel in patients with non-small cell lung cancer (NSCLC) after failure with platinum-containing chemotherapy; (2) IMvigor210 (NCT02108652), a single-arm phase II study investigating atezolizumab (1200 mg every 3 weeks) in patients with metastatic urothelial carcinoma (mUC); and IMvigor211 (NCT02302807), a phase III two-arm, randomized, controlled study comparing atezolizumab (1200 mg every 3 weeks) with chemotherapy (docetaxel, paclitaxel, or vinflunine) in subjects with locally advanced or mUC who have progressed during or following a platinum-containing regimen. Fresh tumor samples and matched adjacent non-cancerous tissues were procured from a commercial vendor (Discovery Life Sciences) as part of adult patients undergoing surgical resection. Online supplemental table S1 provides details for each individual sample such as age, gender, ethnicity, tumor stage, tumor histology subtype (if known), tumor area category (if known), extent of lymph node spread (if known), and metastatic status (if known). Adjacent tissue was required to be more than 0.5 cm away from the tumor and defined as being free of disease morphology at the discretion of the pathologist.
Supplemental material
Statistical analysis
Comparisons across patient subgroups for ITGAE or CD103 immunohistochemistry (IHC) across CD8+ infiltration status (desert, excluded, and inflamed) as well as ITGAE by PD-L1 levels on immune cells (IC score) were completed using a Kruskal-Wallis test with a Dunn post hoc test adjusted with Benjamini-Hochberg correction for multiple comparisons. For statistical analysis of markers measured by mass cytometry between CD103+ and CD103− CD8+ subpopulations, a two-way analysis of variance with Bonferroni correction for multiple comparisons was used. Correlation of PD-L1 by mass cytometry with various gates of CD8+ T cells was assessed by a Spearman rank test. Statistical significance of differences in overall survival (OS) between patient groups subdivided by gene (ITGAE and CD8A) or protein (CD103) expression was determined by Cox proportional hazard modeling. For all statistical analyses, a p-value of <0.05 was indicated by ‘*’, p<0.01 by ‘**’, p<0.001 by ‘***’, p<0.0001 by ‘****’ and lack of a significant difference by ‘n.s.’ (not significant).
Data and code availability
All data from bulk RNA sequencing (RNAseq) of patients from the IMvigor210 clinical trial were available within the European Genome–Phenome Archive (EGA) under accession number EGAS00001002556 and have also been previously published.45 The resulting data from mass cytometry analyses are deposited in Flowrepository.org. Single-cell RNA sequencing (scRNAseq) and single-cell T cell receptor sequencing (scTCRseq) data used in these studies have previously been published44 and are available within EGA under studies EGAS00001003993 and EGAS00001003994 and datasets EGAD00001005464 and EGAD00001005465. The bladder tumor dataset obtained from Oh et al46 is publicly available in the NCBI GEO database under accession GSE149652. Coordinates for generation of the uniform manifold approximation and projection (UMAP) were obtained from the authors. There are restrictions to the availability of bulk RNAseq datasets from patients enrolled in OAK and IMvigor211 clinical trials, but a normalized expression matrix for ITGAE and CD8A, the only genes included from these trials in these studies, is provided in online supplemental data file S2.
Supplemental material
Results
Cohort characteristics
Clinical and biomarker data were obtained from 1868 patients within three clinical trials in two cancer indications assessing the clinical benefits of PD-L1 blockade with atezolizumab: IMvigor210—a single-arm, phase II study of atezolizumab in patients with first-line (n=95) or second-line (2L+, n=259) locally advanced or mUC47; IMvigor211—a two-arm, phase III randomized study in patients with 2L+ locally advanced or mUC comparing atezolizumab to chemotherapy48; and OAK—a two-arm, phase III randomized study in patients with 2L+ NSCLC comparing atezolizumab to docetaxel.49 IHC for PD-L1 and CD8 as well as a bulk RNAseq analysis was performed on formalin-fixed paraffin-embedded (FFPE) tumor tissue obtained prior to administration of atezolizumab.
In parallel, independently of the clinical trials, six NSCLC and three endometrial tumor samples were procured as fresh tissue and both tumor and non-cancerous tumor-adjacent tissue were analyzed by mass cytometry, scRNAseq, and scTCRseq upon dissociation. Patient clinical and demographic information for these samples is detailed in online supplemental table S1.
Tumors with high CD8+ T-cell infiltration are enriched in CD103 (ITGAE) expression
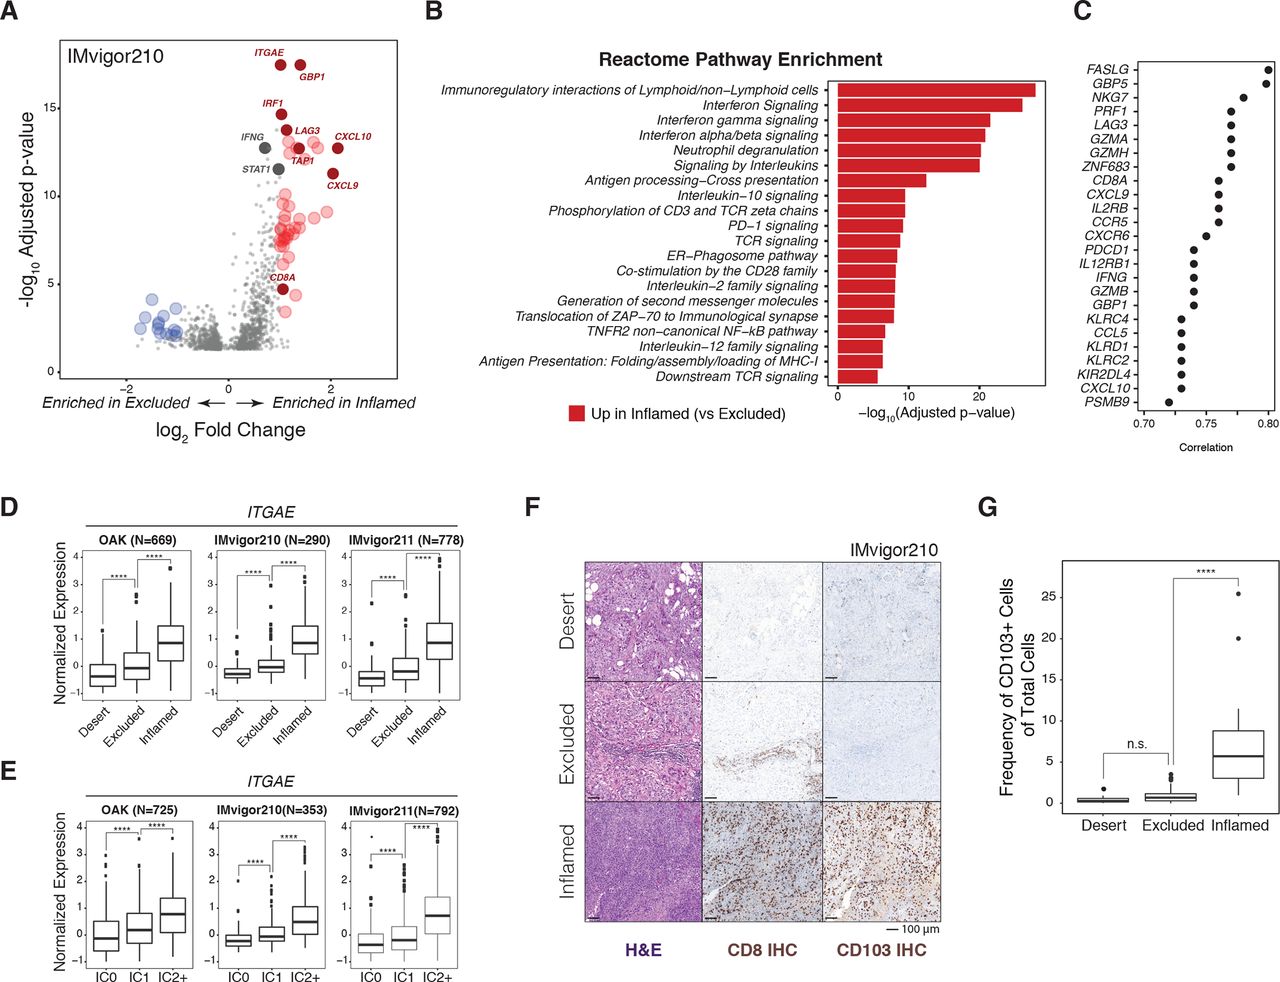
Solid tumors have been categorized into inflamed, excluded, and desert phenotypes based on CD8+ T-cell infiltration patterns.45 50 In inflamed tumors, CD8+ T cells penetrate tumor nests, while they are largely confined to the tumor stroma in excluded tumors. Tumors devoid of or with extremely low levels of CD8+ T cells are termed immune deserts. Transcriptional comparison of inflamed versus excluded tumors in IMvigor210 revealed 759 genes significantly overexpressed (adjusted p<0.05) in inflamed relative to excluded tumors, with ITGAE appearing as one of the most highly significant genes (p=3.35×10⁻¹⁸) (figure 1A and online supplemental data file S1). Other notable CD8+ T cell-associated genes such as CD8A, IFNG, and LAG3 were also upregulated in inflamed tumors. Expression of the hallmark interferon (IFN)-inducible gene GBP1 was also strongly associated with CD8 phenotype, indicative of ongoing IFN signaling in highly infiltrated tumors. Consistent with these findings and as expected, transcripts associated with T-cell cytokine production and activation pathways were significantly enriched in inflamed tumors, including type I and type II IFN as well as TCR and costimulation pathways (figure 1B).
Supplemental material

ITGAE/CD103 is upregulated in tumors exhibiting high CD8+ T-cell infiltration. (A) Volcano plot depicting differentially expressed genes between patients with inflamed versus excluded CD8+ T-cell infiltration phenotypes in tumors from the IMvigor210 clinical trial (mUC) (n=354). Colored dots indicate genes significantly (adjusted p value<0.05) upregulated (red, right) or downregulated (blue, left) greater than two-fold (log2FC≥1) in inflamed relative to excluded tumors. Select genes representative of cytotoxic T cells and IFN signaling are annotated. (B) Top 20 reactome pathways enriched in inflamed tumors relative to excluded tumors ranked by significance (−log10 (p-value) on x-axis). (C) Top 25 genes that correlate with ITGAE expression in a bulk RNAseq analysis of tumor samples from the IMvigor210 clinical trial. (D) Comparison of baseline ITGAE gene expression across patients categorized into desert, excluded, or inflamed subgroups based on CD8+ T-cell tumor infiltration patterns in three clinical trials: OAK (NSCLC, n=669), IMvigor210 (mUC, n=290), and IMvigor211 (mUC, n=778). Statistical analysis was conducted within each trial using the Kruskal-Wallis test with Dunn’s post hoc test adjusted with Benjamini-Hochberg correction for multiple comparisons. (E) Box plots depicting ITGAE gene expression in bulk RNAseq profiles of tumors from OAK (n=725), IMvigor210 (n=353), and IMvigor211 (n=792) clinical trials categorized by low (IC0), mid (IC1), or high (IC2/3) PD-L1 expression on immune cells (IC) as measured by IHC. (F) Representative tissue imaging of FFPE tumors obtained from a subset of IMvigor210 patients (n=91) stained with H&E for tissue architecture (left), as well as for CD8 (middle, brown) and CD103 (right, brown) by IHC. (G) Comparison of CD103 IHC between desert (n=26), excluded (n=45), and inflamed (n=20) tumor infiltration phenotypes. Statistical analysis was completed using a Kruskal-Wallis test with Dunn’s post hoc test adjusted with Benjamini-Hochberg correction for multiple comparisons. ****P<0.0001. FFPE, formalin-fixed paraffin-embedded; H&E, hematoxylin-and-eosin; IFN, interferon; IHC, immunohistochemistry; mUC, metastatic urothelial carcinoma; n.s., not significant; NSCLC, non-small cell lung cancer; PD-L1, programmed cell death ligand 1; RNAseq, RNA sequencing.
Identification of the top 25 transcripts correlated with ITGAE expression in IMvigor210 yielded key genes associated with the TRM phenotype as well as IFN-γ signaling (figure 1C). CD8A and ZNF683, which encodes HOBIT, a master regulator of TRM differentiation,18 51 were highly correlated with ITGAE, suggesting that CD8+ TRM cells are likely the primary source of ITGAE in bulk tumor transcriptomes. ITGAE was highly correlated with FASLG, which is associated with TCR activation and can also be transcriptionally induced by type I IFN signaling.52 Furthermore, ITGAE was also strongly correlated with the immune checkpoints LAG3 and PDCD1 (PD-1), as well as IFNG, the IFN-inducible gene GBP5, and IFN-γ-induced chemokines (CXCL9, CXCL10, and CCL5). Regulators of cytotoxic degranulation (NKG7) and genes encoding cytotoxic proteins (PRF1, GZMA, GZMH, and GZMB) were also associated with ITGAE.53
Increased ITGAE expression within inflamed tumors, relative to excluded and desert tumors, was observed in OAK (NSCLC, p=3.91e-42), IMvigor210 (mUC, p=1.78e-27), and IMvigor211 (mUC, p=8.58e-54) (figure 1D). ITGAE expression was also positively associated with PD-L1 levels on immune cells (IC score), a previously established biomarker of response to immunotherapy,49 in all three trials (figure 1E). These observations were confirmed at the protein level by IHC for CD103 in FFPE tumor biopsies taken from a subset of patients from IMvigor210. Figure 1F shows representative images of hematoxylin-and-eosin (H&E) stained slides, and IHC for CD8 and CD103 performed on adjacent sections from tumor biopsies that correspond to each infiltration phenotype. Automated image analysis was used to quantify the prevalence of CD103+ cells within manually annotated tumor regions of interest. Supporting transcriptional observations, we found that CD103 staining was enriched in inflamed tumors relative to immune desert and excluded tumors (figure 1G). In summary, tumors infiltrated with CD8+ T cells expressed elevated levels of ITGAE/CD103 and were enriched in genes associated with TCR activation.
Intratumoral CD103+ CD8+ T cells express multiple immune checkpoints and Ki-67
To assess the prevalence, distribution, and phenotypes of CD103+ immune cells, a 38-parameter mass cytometry panel (online supplemental table S2) was applied to freshly dissociated tumors as well as non-cancerous tumor-adjacent tissue from six NSCLC and three patients with endometrial cancer. CD45+ cells from NSCLC tumors were merged to create a single UMAP of the immune microenvironment (figure 2A, left). T cells, B cells, NK cells, dendritic cells, macrophages, and neutrophils were identified with manual gates and projected onto the UMAP as previously described.54 CD103 expression was primarily restricted to the CD8+ T-cell lineage but was also detectable in rare CD4+ T-cell and NK-cell subsets (figure 2A, right). Similar results were obtained for endometrial tumors (online supplemental figure S1A).
Supplemental material

CD103+ cells in tumors are predominantly CD8+ TRM cells and are characterized by Ki-67 and immune checkpoint expression. (A) NSCLC patient tumors (n=6) analyzed by mass cytometry, with resulting data for total CD45+ cells (8000 downsampled cells per sample) aggregated and visualized by UMAP (left). Immune subset identities were determined by manual gating and projected onto the UMAP. Expression of CD103 across total CD45+ cells from NSCLC tumors overlaid onto the UMAP (right). (B) Frequency of the indicated immune subpopulations of total CD103+ cells for all nine tumors (n=6 NSCLC (solid dots), n=3 endometrial cancer (open dots)). (C) Expression pattern for markers of activation and dysfunction for NSCLC tumors in aggregate projected onto the UMAP of CD8+ T cells. (D) Comparison of expression frequency of indicated markers within CD8+ T cells between CD103+ (red) or CD103− (blue) subsets in either tumor (left) or adjacent tissue (right) across all tumor samples (n=9, solid dots for NSCLC, open dots for endometrial). Statistical analysis was conducted using two-way analysis of variance with Bonferroni correction for multiple comparisons. *P<0.05, **P<0.01, ***P<0.001, ****P<0.0001. n.s., not significant; NSCLC, non-small cell lung cancer; PD-1, programmed cell death 1; TRM, tissue-resident memory T; UMAP, uniform manifold approximation and projection.
Manual gating analysis was performed on all tumors to quantify (1) the total immune cell composition for each tumor (online supplemental figure S1B, left), (2) the percentage of total CD103 expression attributable to each cellular lineage (figure 2B) and (3) the percent of cells expressing CD103 within each immune subpopulation (online supplemental figure S1B, right). As previously described in NSCLC42 and bladder cancer,24 while a small subset of NK cells and CD4+ T cells express CD103, CD8+ T cells accounted for the majority of CD103+ immune cells in the tumor microenvironment (mean of 74%, range of 67%–85%).
Given the predominant expression of CD103 in CD8+ T cells and recent evidence that TRM cells play a role in tumor immunity,55 CD8 subsets were further investigated. CD8+ T cells from all samples were manually gated and merged to create a UMAP, revealing two major CD8+ T-cell populations segregated by CD103 that were observed across all tumors analyzed (UMAPs by individual in online supplemental figure S1C, NSCLC tumors in figure 2C, and endometrial tumors in online supplemental figure S1D). Elevated expression of proliferation (Ki-67), activation (CD38), and immune checkpoint (CTLA-4, TIGIT, TIM3, and PD-1) markers was observed in CD103+ cells. In contrast, CD103− cells expressed higher levels of CD28, Eomesodermin (EOMES), and CD57. CD28 has been proposed as a marker of stem-like T cells based on TCF-1 and CD45RO expression in the context of renal cell carcinoma.40
We further quantified phenotypic differences between CD103+ and CD103− immune cells in tumors as well as non-cancerous tumor-adjacent tissue using manual gating analysis (figure 2D). CD103+ CD8+ T cells in the tumor were significantly enriched for Ki-67, CD38, CTLA-4, TIM3, and PD-1 expressing cells compared with CD103− CD8+ T cells. Few CD8+ T cells were found to express Ki-67, CD38, and CTLA-4 in adjacent tissue regardless of their CD103 phenotype, implying these markers may be associated with tumor-specific activation rather than exclusively being a result of their TRM lineage. On the other hand, PD-1 was also elevated in CD103+ cells from adjacent tissues, suggesting some markers represent a tissue-specific rather than tumor-specific phenotype. In contrast, expression of CD28, EOMES, and CD57 were enriched in CD103− relative to CD103+ cells in both tumor and tumor-adjacent tissues. CD28 and EOMES are hallmarks of an effector memory CD8+ phenotype, with EOMES suppressing TRM differentiation.18 34 The enrichment for EOMES and CD57 in CD103− cells that expressed lower levels of inhibitory receptors was still somewhat unexpected as these markers also typically signify exhausted3 and senescent56 states, respectively. While both exhaustion and senescence are characterized by reduced effector function, the molecular pathways involved in these programs have been shown to differ.57
The percentage of total CD8+ T cells was not significantly correlated with PD-L1 expression on immune cells (CD45+) (online supplemental figure S1E). However, the frequency of CD103+ CD8+ T cells, and especially Ki-67+ CD103+ CD8+ cells, was significantly correlated with PD-L1 positivity on tumor-associated immune cells (p=0.0214 and p=0.0013, respectively), suggesting that this subpopulation could be responsible for inducing PD-L1 expression in the tumor microenvironment, for example, via the release of effector cytokines (eg, IFN-γ) that drive its expression.58 59
The association of CD103 expression with these phenotypic markers was also analyzed for CD4+ T cells as well as NK cells in tumor and tumor-adjacent tissue (online supplemental figure S2A,B). A smaller fraction of CD4+ T cells expressed CD103 (mean of 8.55% in tumor, 13.3% in adjacent) relative to the levels found in CD8+ T cells, consistent with previous observations.60 In CD4+ T cells overall, Ki-67, CD38, CTLA-4, and TIGIT expressions were elevated in tumor relative to adjacent tissue, but these differences were not stratified by CD103 expression. Only EOMES and CD57 were elevated specifically in tumor CD103+ CD4+ T cells, the inverse of what was seen in tumor CD8+ T cells. NK cells were detected at low frequencies in tumor tissue and showed high variability in CD103 positivity (online supplemental figure S2B). CD57 was the only marker that matched what was observed for CD8+ T cells in the tumor for NK cells, where it was enriched in CD103− relative to CD103+ subpopulations; however, this was the case in adjacent tissue as well. In NK cells from adjacent tissue, significant differences based on CD103 expression were found for CD38, TIM3, and PD-1. Overall, CD8+ T cells were the most abundant CD103+ cell population we observed, and the presumably tumor-specific activated phenotype of CD103+ CD8+ T cells most likely reflects in vivo TCR triggering by tumor antigens.
Supplemental material
CD8+ TRM cells coexpress genes associated with dysfunction and cytotoxicity
In order to further characterize tumor CD8+ T-cell diversity and clonality, scRNAseq and scTCRseq were applied to a subset of the same samples analyzed by mass cytometry (NSCLC n=3, endometrial n=3). A UMAP was generated for tumor CD8+ T cells and annotated using cluster designations we previously defined (figure 3A).44 Eight clusters were identified, capturing effector T cells (TEFF, 8.1), effector memory T cells (TEM, 8.2), TRM cells (8.3a-c), cells experiencing chromatin remodeling (8.4), mitotic cells (8.5), and KLRB1-expressing cells (8.6). Cluster annotations were cross-referenced with previous publications that revealed similar subpopulations with well-correlated gene signatures.44 TRM cells were the predominant CD8+ cell type present in the tumor, with 52.6% of cells falling in the 8.3a-c clusters combined (figure 3B, left panel, individual frequencies depicted in the right panel). Hierarchical clustering was used to visualize differential gene expression between clusters (figure 3C). 8.1-TEFF cells were largely defined by the expression of the cytotoxic proteins GZMB, GZMH, and PRF1, as well as low levels of immune checkpoint regulators. Distinctively high levels of GZMK were observed in 8.2-TEM along with coexpression of TNF, CD27, CD28, and EOMES, indicative of an effector memory phenotype.61 The cluster identified as 8.4-Chrom was previously characterized as being involved in chromatin remodeling and ongoing histone modification, as evidenced by expression of chromatin remodeling enzyme CHD1 and long non-coding RNA MALAT1, which directly binds components of the chromatin remodeling complex.62 The 8.6-KLRB1 cluster exhibited uniquely high levels of KLRB1, along with TCF7, CCR7, and IL7R, indicating the possibility that this cluster represents TSCM cells, a population thought to be essential for response to checkpoint inhibition when harboring TCRs specific to tumor antigens.63 Importantly, 21% of cells in cluster 8.6 expressed the TRAV1-2 conserved TCR domain, which is a marker of the mucosal associated invariant T-cell lineage, thus suggesting even deeper phenotypic diversity within this cluster.64
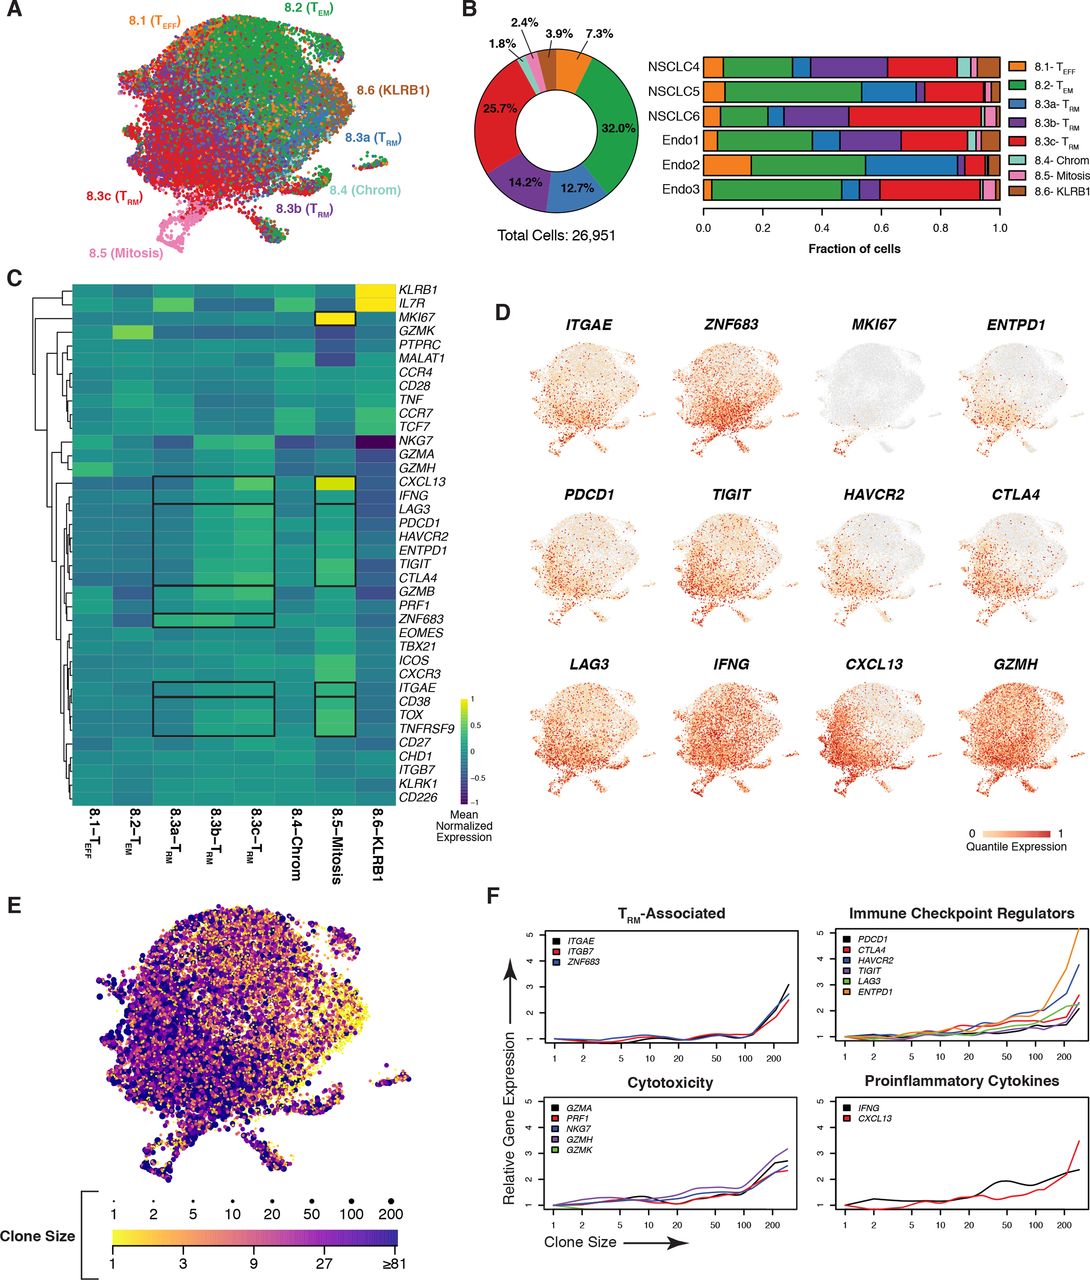
Tumor CD8 +TRM cells are clonally expanded and express genes associated with cytotoxicity and dysfunction. (A) UMAP of CD8+ T cells from NSCLC (n=3) and endometrial (n=3) tumor samples with clusters colored by subset identity as analyzed by scRNAseq. (B) Frequency of each CD8+ T-cell cluster among all tumors assessed with samples in aggregate (left) or by individual (right). (C) Heatmap depicting relative expression of T cell-associated genes, with a dendogram indicating results of hierarchical unsupervised clustering (left), across CD8+ clusters. Genes are globally scaled with an expression range from −1 (dark blue) to 1 (yellow). (D) UMAP overlay of genes associated with the TRM phenotype, proliferation, dysfunction, as well as genes correlated with ITGAE in the bulk RNAseq and heatmap analyses. Individual cells are colored on a scale of gray (0) to red (1) according to the quantile of their expression. (E) Extent of clonal expansion, as determined by scTCRseq, for each cell overlaid onto the UMAP (A). The breadth of TCR clonality is represented by dot size and by color, ranging from a clone size of 1 (yellow) to greater than 81 (purple). (F) Expression of indicated genes (y-axes) as a function of the size of a given clonotype (with clone size rank ordered on the x-axis) for resident memory T-cell phenotype, checkpoint regulator, cytotoxicity, and proinflammatory cytokine genes. NSCLC, non-small cell lung cancer; RNAseq, RNA sequencing; scRNAseq, single-cell RNA sequencing; scTCRseq, single-cell TCR sequencing; TCR, T-cell receptor; TRM, tissue-resident memory T; UMAP, uniform manifold approximation and projection.
Three distinct TRM clusters (8.3a-c) were found to be stratified by a stepwise increase in ITGAE along with immune checkpoint regulators, IFNG, CXCL13, and multiple cytotoxic proteins (figure 3C). ZNF683, the gene encoding HOBIT, was expressed in all three clusters but appeared highest in 8.3a and 8.3b. TRM cluster 8.3a could represent a transitional state between progenitor phenotypes and TRM differentiation as tissue residency and stem-like markers (eg, IL7R) overlapped in this population.33 Cluster 8.3a may also be resting TRM bystander cells. Relatedly, the transcription factor TOX has emerged as a master regulator of exhaustion; thus, its expression is capable of delineating chronically activated tumor antigen-specific T cells from bystanders.65 66 Importantly, TOX programming also inhibits clonal deletion, enabling cellular persistence.66TOX expression was absent in cluster 8.3a but increased progressively in clusters 8.3b and 8.3c. As anticipated by recent studies, TOX expression in 8.3b and 8.3c overlapped with phenotypic markers of T-cell dysfunction as well as the ATPase ENTPD1 (CD39), another putative marker of tumor-specific CD8+ T cells.35
Our mass cytometry analysis demonstrated that a subset of CD103+ CD8+ T cells displayed Ki-67 expression (figure 2C,D), suggesting a proliferative state. While cluster 8.3a-c did not express MKI67, a separate cluster 8.5 expressed high levels of MKI67 and also had the highest expression of ITGAE across all clusters, as well as robust expression of checkpoint molecules, TOX, and ENTPD1 (figure 3C). Importantly, these mitotic TRM cells also displayed elevated expression of IFNG, the TCR activation-specific marker TNFRSF9 (4-1BB), and CXCL13, which collectively may signify response to tumor antigens in vivo prior to tumor excision.
In order to precisely assess the relationship between CD103 and CD39 expression, mass cytometry was applied to a pair of matched NSCLC tumor and adjacent tissue samples (online supplemental figure S3A). Like Ki-67, CD39 was selectively expressed on intratumoral CD103+ cells, with fivefold less CD39+ CD103+ cells detected in the adjacent tissue (online supplemental figure S3B). Furthermore, manual gating analysis showed that CD39+ CD8+ T cells were a subset of CD103+ cells (online supplemental figure S3C). Ki-67 and checkpoint regulators were enriched in CD103+ CD39+ cells relative to CD103+ CD39- cells (online supplemental figure S3D,E). CD103− CD39− T cells exhibited the lowest frequency of positivity for these markers and instead were elevated in positivity for CD28, EOMES, and CD57 (online supplemental figure S3D,E).
Supplemental material
Transcript levels for specific genes of interest were displayed via UMAP in order to visualize their expression with single-cell resolution (figure 3D and online supplemental figure S4A). ITGAE, ZNF683, and ENTPD1 were most localized in the TRM and mitotic clusters. TRM clusters were enriched in checkpoint regulators, IFNG, CXCL13, and cytotoxicity mediators (eg, GZMH, GZMA, and GZMB), whereas MKI67 positivity was only observed in the mitotic subset of TRM (8.5). Conversely, GZMK was expressed outside of TRM clusters in TEM cells (online supplemental figure S4A). Online supplemental figure 4 depicts UMAP visualizations for additional genes of interest that were presented in our heatmap and mass cytometry analyses.
Supplemental material
Tumor TRM cells exhibit clonal expansion
Single-cell TCR clonality analysis was then performed to associate cellular phenotypes with patterns of clonal expansion. Overlaying clone size onto the UMAP (represented by both data point size and color), we observed that cells with high degrees of clonal expansion were mostly localized in the 8.3c-TRM cluster (figure 3E). Comparing gene expression to clone size in a quantitative manner, we found that TRM-associated genes (ITGAE, ITGB7, and ZNF683) were most expressed in expanded clonotypes (figure 3F). Expression of checkpoints, cytotoxic molecules, and proinflammatory cytokines appeared highest in these clones, although they were also detected to a lesser extent on smaller clonotypes. In contrast, GZMK (figure 3F) along with genes associated with a naive or stem-like T-cell state (IL7R, CCR7, and TCF7) (online supplemental figure S4B) were primarily expressed in cells with the least number of clones.
TCR clonotype sharing between clusters (light gray columns) was broadly observed, although with variable frequency, suggesting phenotypic plasticity (online supplemental figure S4C). Clusters 8.3b and 8.3c shared TCRs, indicating potential intratumoral lineage differentiation. However, some clones (black columns) were more restricted to specific clusters. Importantly, mitotic cluster 8.5 shared clonotypes primarily with the TRM clusters, further supporting the relationship between in vivo proliferation and the tissue-resident phenotype.
Taken together, this suggests that the previously identified TCR activation signatures in inflamed tumors (figure 1B) and CD8+ TRM-specific Ki-67 expression (figure 2D) can result in TRM cell proliferation in vivo. Furthermore, increased cytolytic protein expression in TRM cells as a function of clonal expansion may reflect the ability of these cells to control tumor growth, as has been described in preclinical models.20 21 These observations are aligned with previous scRNAseq analyses of the lung67 and skin68 69 tumor microenvironment with the additional insight provided here that the cell populations annotated as exhausted in these previous studies are most likely TRM cells.
Reanalysis of a recently published scRNAseq dataset of T cells in bladder cancer46 identified a CD8+ T-cell subpopulation expressing CD39 transcripts (annotated as CD8ENTPD1) that closely resembled the phenotype we observed in 8.3c-TRM cells (comparative cluster analysis in online supplemental figure S5A). In addition, this study also found a proliferative CD8+ population that correlated to the mitotic TRM cells in cluster 8.5 (online supplemental figure S5A,B). However, relative frequencies of the various CD8+ clusters differed from our observations in NSCLC (online supplemental figure S5C).
Supplemental material
ITGAE/CD103 expression predicts clinical response to immunotherapy
The association between ITGAE expression in pretreatment tumor biopsies and overall survival (OS) was assessed in the OAK, IMvigor210, and IMvigor211 cohorts. In OAK, increased OS was observed in ITGAEhigh tumors from patients treated with atezolizumab but not chemotherapy (figures 4A and online supplemental figure S6A), with CD8A behaving similarly. When looking at the prognostic capacity of ITGAE in mUC, we again observed that patients with ITGAEhigh tumors treated with atezolizumab had significantly increased OS relative to their ITGAElow counterparts (IMvigor210) (figure 4B and online supplemental figure S6B). Remarkably, high CD8A expression was not associated with increased OS in this cohort. In the randomized trial IMvigor211, ITGAEhigh tumors demonstrated a modest improvement in OS compared with ITGAElow tumors in patients treated with atezolizumab but not chemotherapy (online supplemental figure S6C), with the highest quartile demonstrating a trend toward increased OS in the atezolizumab-treated arm (online supplemental figure S6D), a phenomenon not observed with CD8A.
Supplemental material
CD103 IHC was then performed on a subset of tumors from IMvigor210 (n=91) to verify association with clinical outcome at the protein level. Based on the distribution of CD103+ cells in the tumor area across these patients, a ≥2% cut-off was selected for CD103 positivity (figure 4C). The frequency of CD103+ cells was correlated with ITGAE gene expression, as determined by bulk RNAseq (figure 4D). Patients were separated into CD103low and CD103high subgroups, based on the ≥2% cut-off identified. CD103high patients (median OS: 17.9 months) demonstrated improved OS (HR=0.53, p=0.045) relative to CD103low individuals (median OS: 9.5 months) (figure 4E). Thus, at both the transcriptional and protein levels, CD103 expression in tumors was associated with better OS in patients treated with atezolizumab.

ITGAE/CD103 expression is predictive of response to PD-L1 blockade. (A) Kaplan-Meier curves depicting the OS probability of patients with locally advanced or metastatic NSCLC cancer treated with atezolizumab (red) or chemotherapy (blue) (OAK) categorized by high (solid line) or low (dotted line) transcriptional expression (median cut-off) of either ITGAE (left panel) or CD8A (right panel). P-values are displayed within each panel. (B) Kaplan-Meier curves demonstrating OS in patients with mUC from IMvigor210 categorized by high (red) or low (blue) transcriptional expression (median cut-off) of either ITGAE (left panel) or CD8A (right panel). HRs and p-values are shown for each gene. (C) Distribution of CD103+ cells in the tumor area across a subcohort (n=91) of IMvigor210 biopsies stained for CD103 by IHC. The dotted line indicates the 2% cut-off defining CD103high and CD103low patient groups. (D) Correlation of gene expression of ITGAE, as measured by bulk RNAseq analysis (TPM, y-axis), to quantification of CD103 protein by IHC (frequency of positive events out of total cells in tumor area, x-axis) for the subset of IMvigor210 patient samples analyzed. The Spearman R correlation value is displayed on the graph. (E) Kaplan-Meier curves comparing OS for patients defined as CD103high and CD103low in (C). Statistical significance was determined by Cox proportional hazard modeling. The HR and p-value are displayed within. HR, hazard ratio; IHC, immunohistochemistry; mUC, metastatic urothelial carcinoma; NSCLC, non-small cell lung cancer; OS, overall survival; PD-L1, programmed cell death ligand 1; RNAseq, RNA sequencing; TPM, transcripts per million.
Discussion
Tumor infiltration by CD8+ T cells is an essential step of the cancer immunity cycle.70 Recent single-cell studies have identified multiple subsets of intratumoral CD8+ T cells, including TRM cells which express high levels of checkpoint regulators, leading to their characterization as being either exhausted9 or dysfunctional.69 The functionality of tumor-infiltrating CD8+ T cells is controversial, and the relationships between exhausted and tissue-resident T cells remain poorly understood.71 Here, we show that T-cell exhaustion is associated with a tissue resident phenotype. Based on these observations, we propose a model (figure 5) whereby in the development of antitumor immunity, tumor antigen presentation and lymph node activation of TSCM cells lead to TEFF cell egress from lymph nodes and circulation into tumor tissue via blood. In response to tumor antigens and cytokines present in the tumor environment, these cells differentiate into TRM cells and secrete IFN-γ, causing the upregulation of IFN-γ-inducible genes such as PD-L1.37 The interplay between tumor reactive TRM activity and the paracrine induction of PD-L1 in tumor and antigen-presenting cells thus forms the basis of PD-L1-dependent adaptive immune resistance59 72 and may act to prevent activation-induced T-cell death.66 As such, PD-L1 biomarker status may indicate the existence of an ongoing CD103+ CD8+ T-cell immune response, consistent with our observed correlation between the frequency of Ki-67+ CD8+ TRM and PD-L1+ immune cells (online supplemental figure S1E).

Activated tumor antigen-specific CD103+ TRM cells generate biomarker signals of immunotherapy response. PD-1, programmed cell death 1; PD-L1, programmed cell death ligand 1; TEFF, effector T; TRM, tissue-resident memory T; TSCM, stem cell memory T.
While TRM tumor reactivity can be inferred based on overt phenotypic signs of chronic stimulation, the presumed dysfunctionality of these cells makes it unclear whether TRM activity is a proximal or distal biomarker relative to the unknown precise mode of action of PD-1/PD-L1 blockade. In a ‘reinvigoration’ or reversible exhaustion model, PD-1/PD-L1 checkpoint inhibition should function optimally in tumors infiltrated with exhausted cells. However, multiple studies suggest the presence of an epigenetically programmed terminally exhausted state enforced by TOX that is induced early upon chronic stimulation and unlikely to be reversible.73 74 Alternatively, it has been shown in preclinical models that PD-1/PD-L1 checkpoint inhibition acts on self-renewing TSCM cells,75 76 but the precise differentiation state and physiological compartment that immune checkpoint inhibition targets for clinical efficacy remains obscure. Importantly, multiple functional studies suggest that simply the expression of immune checkpoint regulators such as PD-1, TIM3, and LAG3 is insufficient in identifying cells that are inert or terminally exhausted and that CD8+ T cells expressing these markers produce the same, if not more, inflammatory cytokines than cells lacking checkpoints.77–81 Furthermore, tumor CD8+ TRM cells uniquely expressed CXCL13 (figure 3C,D), which has been shown in multiple studies to be a distinct functionality of ‘exhausted’ CD8+ T cells.3 82 CXCL13 can contribute to tertiary lymphoid structure formation, which has been recently linked to immunotherapy response.83 Precise identification of the subset and phenotypic state that is most poised to directly respond to immunotherapy will require further investigation, though our study and others point to a potential role for tumor CD8+ TRM cells.
Recent studies have shown that following anti-PD-1 therapy, novel tumor antigen-specific (based on CD39 expression) TCR clones are expanded rather than clones that had been detected prior to treatment.41 The phenomenon of clonal replacement following checkpoint therapy does not preclude a ‘pre’ or ‘progenitor’ exhaustion model in which T cells that are clonally expanded in the tumor prior to treatment are still a relevant direct target of PD-1/PD-L1 blockade. Pre-exhausted cells may be ‘potentiated’ and rescued from terminal exhaustion by immune checkpoint inhibition. Rather than being reinvigorated, implying further clonal expansion, pre-exhausted TRM cells already proliferating and involved in tumoricidal activity could potentially break the cycle of adaptive immune resistance induced by PD-1 signaling without expanding dramatically in numbers post-treatment. Potentiated tumor lysis could provide new tumor antigens (epitope spread) for dendritic cell capture in draining lymph nodes, subsequently generating a systemic immune response resulting in tumor infiltration with novel TCR clones. It is possible that sustained TRM-mediated antitumor activity causes clonal replacement to be a constant feature of the cancer immunity cycle that is accelerated, rather than induced de novo, by immune checkpoint inhibition.
Importantly, tumor signatures of immune reactivity or ‘exhaustion’ have not universally correlated with improved clinical outcomes.4–8 Studies in melanoma found patients with high numbers of TCF-1+ TSCM cells and low numbers of exhausted cells to have better outcomes than patients in whom this ratio is inverted.9 However, the TSCM phenotype, in contrast to tumor TRM cells, does not overtly display hallmarks of cellular activation, and thus tumor reactivity cannot be assumed unless proven by other methods.71 In highly immunogenic tumors, it is possible that a large fraction of CD8+ T cells, including TSCM cells, are tumor antigen-specific and poised to respond to checkpoint inhibition, but it is as yet unclear whether tumor TSCM content can serve as a biomarker in indications other than melanoma. In contrast, the TRM phenotype, and CD103 specifically, has been associated with improved OS in several cancers.10 84 Our data revealed potential indication-specific differences in the predictive utility of ITGAE relative to CD8A (figure 4). This could reflect phenotypic differences in predominant CD8+ T cells between tumor types. In NSCLC, where both genes showed similar associations with OS (figure 4A), we observed a very high overlap of CD103 and CD8 (online supplemental figure S1B). In mUC, CD8+ CD103+ TRM cells were present at reduced frequencies relative to NSCLC (online supplemental figure S5C); thus, the elevated presence of CD8+ CD103− bystander cells may explain the superiority of ITGAE over CD8A as a biomarker of clinical response in this indication. As such, response to immunotherapy is not only connected to the extent of CD8+ T-cell infiltration in inflamed versus excluded tumors but also the quality and phenotype of the cells present. Our initial observation that classification as an inflamed tumor was closely tied to CD103 expression highlights these cells as key players in antitumor responses. The routine inclusion of CD103 as an immunotherapy biomarker will enable the extension of these observations to other indications that remain largely unexplored in this context such as pancreatic cancer, renal cell carcinoma, and lymphomas. Furthermore, we believe the quantification of proliferative (or Ki-67+) CD103+ TRM cells will have additional value in that these cells may be most proximal to the method of action of PD-L1 blockade and thus highly predictive of immunotherapy response.
Our studies have focused on TRM cells specifically within the primary tumor tissue. With the development and control of metastases being of significance to patient prognosis, a key question is whether CD103+ tumor antigen-specific TRM cells are able to leave the tumor and circulate to these secondary metastases or whether their tissue specificity is permanent. Recent preclinical evidence suggests that rather than being confined to tissue as a terminal state, TRM cells maintain plasticity and can rejoin the circulating pool of T cells as conventional memory cells.85 Identifying the phenotypes, clonality, and interplay of CD8+ T cells in these distant metastases will be of great importance in determining the long-term impact of TRM cells on cancer survival outcomes.
Overall, we have identified CD103 as a marker of CD8+ T-cell tumor infiltration, and demonstrated that these cells exhibit an activated and proliferative phenotype characterized by clonal expansion. CD103 expression, both at the transcriptional and protein levels, associates with better response to checkpoint blockade. Future studies will be necessary to determine whether TRM activity is a proximal or distal biomarker of immune checkpoint inhibition and how exactly these cells contribute to antitumor responses post-therapy. Further reading material are listed in the supplemental material provided.86–97
Data availability statement
Data are available in a public, open access repository. All data relevant to the study are included in the article or uploaded as supplementary information. All data from bulk RNA sequencing (RNAseq) of patients from the IMvigor210 clinical trial are available within the European Genome-Phenome Archive under accession number EGAS00001002556 and have also been previously published. The resulting data from mass cytometry analyses are deposited in Flowrepository.org. Single-cell RNA and TCR sequencing data used in these studies have previously been published and are available within EGA under studies EGAS00001003993 and EGAS00001003994 and datasets EGAD00001005464 and EGAD00001005465. The bladder tumor dataset obtained from Oh et al., 202061 is publicly available in the NCBI GEO database under accession GSE149652. Coordinates for generation of the UMAP were obtained from the authors. There are restrictions to the availability of bulk RNAseq datasets from patients enrolled in OAK and IMvigor211 clinical trials, but a normalized expression matrix for ITGAE and CD8A, the only genes included from these trials in these studies, is provided as a supplementary file.
Ethics statements
Ethics approval
The authors complied with all ethical standards of the Roche Ethics Committee. Informed consent was obtained from all sampled individuals.
Acknowledgments
We thank Valerie Quarmby, Hanjo Lim, Bartek Bossak, Jose Diaz, Paul Vu, Justin Low, Mehraban Khosraviani, and Mike Phan for mass cytometry reagent support. We acknowledge SMART-servier for provision of graphic components used in the generation of the model figure. We thank Mary Keir for discussions on Integrin αE. We also thank Suvasha Gupta, Susan Flynn, and the Biosample Repository and Human Tissue Labs for tissue sample logistical support. We thank David Oh for providing dimensionality reduction coordinates for the bladder data.
References
Supplementary materials
Supplementary Data
This web only file has been produced by the BMJ Publishing Group from an electronic file supplied by the author(s) and has not been edited for content.
Footnotes
RB and ASC contributed equally.
AS, TDW and NSP contributed equally.
SM, JG and WEO contributed equally.
Contributors Conceptualization: RB, ASC, SM, JG and WOG; validation, RB and WOG; formal analysis: RB, ASC, NSP, TDW, AA-Y, JCH, WZ, EAE-G, HK and WOG; investigation: ASC, AS, PdA, SM, AA-Y, CT, Y-JC and MDR; resources: TP, ZM, EEK and PC; writing of the original draft: WOG, ASC and RB; writing (review and editing): all authors; visualization: RB, ASC, AS, TDW, STE and AA-Y; supervision: PSH, IM, WRM, JMcB and TP; project administration: RN, MK, MMcM, WZ, SM. AS, TDW and NSP were co-second authors.
Funding The authors have not declared a specific grant for this research from any funding agency in the public, commercial or not-for-profit sectors.
Competing interests All authors except Thomas Powles are current or former employees of Roche.
Provenance and peer review Not commissioned; externally peer reviewed.
Supplemental material This content has been supplied by the author(s). It has not been vetted by BMJ Publishing Group Limited (BMJ) and may not have been peer-reviewed. Any opinions or recommendations discussed are solely those of the author(s) and are not endorsed by BMJ. BMJ disclaims all liability and responsibility arising from any reliance placed on the content. Where the content includes any translated material, BMJ does not warrant the accuracy and reliability of the translations (including but not limited to local regulations, clinical guidelines, terminology, drug names and drug dosages), and is not responsible for any error and/or omissions arising from translation and adaptation or otherwise.