Article Text

Abstract
Background Current therapy for osteosarcoma pulmonary metastases (PMs) is ineffective. The mechanisms that prevent successful immunotherapy in osteosarcoma are incompletely understood. We investigated the tumor microenvironment of metastatic osteosarcoma with the goal of harnessing the immune system as a therapeutic strategy.
Methods 66 osteosarcoma tissue specimens were analyzed by immunohistochemistry (IHC) and immune markers were digitally quantified. Tumor-infiltrating lymphocytes (TILs) from 25 specimens were profiled by functional cytometry. Comparative transcriptomic studies of distinct tumor-normal lung ‘PM interface’ and ‘PM interior’ regions from 16 PMs were performed. Clinical follow-up (median 24 months) was available from resection.
Results IHC revealed a statistically significantly higher concentration of TILs expressing immune checkpoint and immunoregulatory molecules in PMs compared with primary bone tumors (including programmed cell death 1 (PD-1), programmed death ligand 1 (PD-L1), lymphocyte-activation gene 3 (LAG-3), T-cell immunoglobulin and mucin domain-containing protein 3 (TIM-3), and indoleamine 2,3-dioxygenase (IDO1). Remarkably, these lymphocytes are excluded at the PM interface compared with PM interior. TILs from PMs exhibited significantly higher amounts of PD-1 and LAG-3 and functional cytokines including interferon-γ (IFNγ) by flow cytometry. Gene expression profiling further confirmed the presence of CD8 and CD4 lymphocytes concentrated at the PM interface, along with upregulation of immunoregulatory molecules and IFNγ-driven genes in the same region. We further discovered a strong alternatively activated macrophage signature throughout the entire PMs along with a polymorphonuclear myeloid-derived suppressor cell signature focused at the PM interface. Expression of PD-L1, LAG-3, and colony-stimulating factor 1 receptor (CSF1R) at the PM interface was associated with significantly worse progression-free survival (PFS), while gene sets indicative of productive T cell immune responses (CD8 T cells, T cell survival, and major histocompatibility complex class 1 expression) were associated with significantly improved PFS.
Conclusions Osteosarcoma PMs exhibit immune exclusion characterized by the accumulation of TILs at the PM interface. These TILs produce effector cytokines, suggesting their capability of activation and recognition of tumor antigens. Our findings suggest cooperative immunosuppressive mechanisms in osteosarcoma PMs including immune checkpoint molecule expression and the presence of immunosuppressive myeloid cells. We identify cellular and molecular signatures that are associated with patient outcomes, which could be exploited for successful immunotherapy.
- sarcoma
- tumor microenvironment
- pediatrics
- translational medical research
Data availability statement
Data are available upon reasonable request. All sequencing data available upon reasonable request to corresponding author.
This is an open access article distributed in accordance with the Creative Commons Attribution Non Commercial (CC BY-NC 4.0) license, which permits others to distribute, remix, adapt, build upon this work non-commercially, and license their derivative works on different terms, provided the original work is properly cited, appropriate credit is given, any changes made indicated, and the use is non-commercial. See http://creativecommons.org/licenses/by-nc/4.0/.
Statistics from Altmetric.com
Background
Osteosarcoma is the most common bone malignancy in children and young adults.1 While patients with localized disease have a cure rate approaching 70%, patients who develop metastatic disease have a 5-year overall survival of less than 25%,1 with most patients dying from pulmonary metastases (PMs).2 Unfortunately, the treatment paradigm for osteosarcoma has remained unchanged for approximately 30 years.3 Adjuvant chemotherapy offers no benefit for patients who suffer metastatic relapse,4 and new classes of therapeutics are urgently needed for this chemotherapy-insensitive disease.
Several pieces of evidence point to an important role for the immune system in the clearance of osteosarcoma,5 offering hope that tumor immunotherapy could be successful in osteosarcoma as it has been for many types of cancer.6 Furthermore, loss of human leukocyte antigen class 1 expression on tumor cells correlates with poor overall survival in patients with osteosarcoma, suggesting that evading immune recognition confers a survival advantage for tumor cells.7 While immune-based therapies have been successful in some sarcomas and other pediatric cancers,8 9 these beneficial findings have not been generalizable to many sarcomas, including osteosarcoma specifically.9–12
While immunotherapy has not changed outcomes for patients with osteosarcoma, correlative findings and preclinical studies show that the tumor microenvironment (TME) of osteosarcoma can be altered.13–16 Rigorous understanding of the mechanisms regulating the tumor–immune system interface is a crucial prerequisite for rationally designed therapies to alter the TME in a way that will allow immunotherapy to be effective in osteosarcoma. The TME of any cancer has different systems to prevent recognition and attack by the immune system, and instead promote tolerance,17 thus allowing tumor progression. Understanding the TME in PMs is crucial, and analyses derived from study of these specimens have resulted in controversial conclusions. One recent paper suggests that vascular dysfunction in metastatic osteosarcoma results in lower expression of a number of immune markers compared with primary tumors,18 while contrasting reports show that metastatic lesions have a higher number of tumor-infiltrating lymphocytes (TILs), higher expression of programmed death ligand 1 (PD-L1), and are marked by a number of immunosuppressive mechanisms.19 20 Nevertheless, a deeper and more granular understanding of the metastatic TME, particularly the precise regional distribution and interplay of immune cells along with the operative immunoregulatory signaling programs, are greatly needed.
We hypothesized that (1) the TME of osteosarcoma PMs is significantly different from that of the primary bone tumors, and (2) that a comprehensive analysis of the metastatic TME would reveal multifactorial determinants of osteosarcoma immune responsiveness. Herein, we undertook an orthogonal interrogation approach for studying the TME of metastatic osteosarcoma, implementing human tumor samples and freshly isolated TILs. Our analysis reveals that, compared with the relative ‘immune desert’ TME of primary bone tumors, the TME of metastatic osteosarcoma represents the ‘immune-excluded’ phenotype and suggests the engagement of an immunosuppressive host response which could be exploited for clinical benefit of patients.
Methods
Patient selection and tumor samples
This study was conducted in accordance with the ethical principles stated in the Belmont Report and the US Common Rule. Tumor tissue was collected prospectively and recalled from archived tissue blocks from patients with osteosarcoma at the Johns Hopkins Hospital (Baltimore, Maryland, USA). Demographic and clinical outcomes data were obtained by retrospective chart review of the electronic medical record. This study was conducted under a Johns Hopkins Institutional Review Board approved protocol (FWA00005752) with a waiver of consent for archived tissues and patients gave written informed consent for prospective tumor collection. All samples were obtained in accordance with the Health Insurance Portability and Accountability Act.
Immunohistochemistry (IHC)
Sixty-six formalin-fixed paraffin-embedded tissue blocks (28 untreated bone, 12 bone post-chemotherapy, 25 lung metastases, 1 soft tissue recurrence/metastasis) from 31 patients with osteosarcoma were cut into 5 µm sections and mounted onto glass slides. Each specimen was stained for H&E according to standard protocols, and for CD3, CD8, Foxp3, CD163, programmed cell death 1 (PD-1), and PD-L1 per online supplemental table 1). Additional staining for colony-stimulating factor 1 receptor (CSF1R), T-cell immunoglobulin and mucin domain-containing protein 3 (TIM-3), lymphocyte-activation gene 3 (LAG-3) and indoleamine 2,3-dioxygenase (IDO1) was performed on osteosarcoma PMs (online supplemental table 11). Whole slides were then digitally scanned to a magnification of 20x (Scanscope XT), analyzed (Halo imaging analysis software; Indica Labs, Corrales, New Mexico, USA) and densities scored as cells/mm2 (CD3, CD8, Foxp3, CD163, PD-1, LAG-3) or area percentage (PD-L1, CSF1R, TIM-3, IDO1). PD-L1 positivity was scored as a percentage of the total tissue area, including both tumor and immune cells, given the expression of PD-L1 on both cell populations in our samples. In PMs, the tumor-normal lung ‘interface’ (PM interface) region (when present in the available slide) was defined as a 400 µm width region where the tumor meets the lung tissue. Slides were reviewed with a pathologist (RA and EDT) to demarcate areas of tumor versus normal tissue and to confirm our digital image analysis.
Supplemental material
Laser capture microdissection and RNA extraction
Formalin-fixed paraffin-embedded tissue blocks and H&E-stained tissue sections (10 µm, mounted using RNA precautions) of 16 PMs were used for the laser capture microdissection (Leica LMD 7000 system). For each sample, tissues were microdissected from the PM interface region as well as the tumor interior (PM interior) region (online supplemental figure S1). For comparison, a single bone tumor and a single soft tissue recurrence/metastasis were also dissected in a similar manner. RNA was isolated with High Pure Paraffin Kit (Roche) following the manufacturer’s instructions.
Supplemental material
RNA sequencing and gene expression analysis
Transcriptome sequencing was performed using the AmpliSeq (Ion Torrent) RNA next-generation sequencing platform. This genomic analysis plugin aligns the raw sequence reads to a human reference genome that contains 20 802 RefSeq transcripts (hg19 Ampliseq Transcriptome_ERCC_V1.fasta) using the Torrent Mapping Alignment Program. Then, the number of reads mapped per gene is counted to generate raw counts files and normalized reads per gene per million mapped reads (RPM) files. On-target reads of greater than 60% were required for a library to pass quality control. Data were analyzed by unsupervised principal component analysis. Cell-type identification by estimating relative subsets of RNA transcripts (CIBERSORT) deconvolution with the leukocyte gene signature matrix LM2221 and xCell22 were used to analyze immune and other cell composition of our data. We also used gene set enrichment analysis (GSEA, Broad Institute) to analyze whether published and validated immune gene sets23–25 were significantly enriched in either the PM interface or PM interior region. A false discovery rate (FDR) of less than 25% was used as a cut-off for a gene set to be significantly enriched, and all gene sets discussed have FDR 15% or lower. xCell22 (UCSF Institute for Computational Health Sciences) is a high-resolution gene-signature-based method for cell-type enrichment for up to 64 cell types. We used xCell R package. xCell was run with the cell.types.use parameter to avoid overcompensation by the spillover correction.
cell.types.use was set to B cells, T cells, and myeloid cells to deconvolute the cellular heterogeneity within the TME from RNA sequencing data. For module visualization, we used Morpheus (Broad Institute), data were loaded as log transformed and normalized by subtracting each value from the row mean and divided by the row SD. We also specifically used Morpheus to display genes which contribute to GSEA leading edge subsets using gene expression levels to generate heatmaps. The UCSC Xena functional genomics explorer was used for generating box plots of myeloid-derived suppressor cell (MDSC) genes of interest.26
Tumor processing and multiparameter flow cytometry (MFC)
Twenty-five freshly harvested osteosarcoma tumors (15 primary bone tumors and 10 PMs) were digested using an enzymatic cocktail (0.1% DNase I and Liberase 400 µg/mL; Roche). Leukocytes were enriched and isolated by Percoll density gradient (GE Healthcare). Cells were then stored in liquid nitrogen until further analysis. MFC was performed with either an LSRII cytometer (BD Biosciences) or an Attune NxT cytometer (Thermo Fisher Scientific). TILs were stimulated in the presence of stimulation cocktail (phorbol-12-myristate-13-acetate+ionomycin; eBioscience) and GolgiStop (Monensin; BD Biosciences) according to the manufacturer’s instructions. Samples were then stained for CD45, CD3, CD4, CD8, PD-1, TIM-3, and LAG-3. Intracellular staining for cytokines and transcriptions factors was then performed for Eomesodermin (EOMES), Foxp3, T-bet, and IFNγ. Not all samples were stained for the entire MFC panel (online supplemental table 1).
Statistical analysis
IHC scoring of each histologic area (ie, primary bone tumors, PMs, and PM interface) and MFC were summarized and compared using means and scatterplots. Bone tumors and PMs were compared using the non-parametric Mann-Whitney U test, and PMs were compared with their corresponding PM interface region using the Wilcoxon matched-pairs signed-rank test. Welch’s t-test was used for comparing MDSC specific genes between PM interface and PM interior compartments. For clinical outcomes following resection of 30 PMs, time to progression was collected and defined as the number of months from the time of surgery until progression. Gene sets scores analyzed in relation to clinical outcomes were calculated based on RNA sequencing data using geometric mean. IHC and MFC measurement and gene sets scores associated with progression-free survival (PFS) were explored in patients using the univariate Cox proportional hazards model. To account for intracorrelations when multiple progressions occurred on the same patient, robust sandwich-type SE estimators were used.27 All statistical tests were two-sided, and statistical significance was set at p<0.05. Since this study was hypothesis-generating, we did not perform corrections for multiple comparisons.
Results
Higher immune cell infiltration and immune checkpoint molecule expression in PM compared with primary bone tumors, concentrated at tumor-normal lung interface region
After identifying and annotating areas of viable tumor tissue on pathologist review of H&E (online supplemental figure S2), we first quantified the immune cell infiltration of osteosarcoma by IHC and analyzed differences between primary bone tumors and PMs. Primary bone tumors had low infiltration of T cells (CD3+, CD8+ and Foxp3+) with relatively higher infiltration by myeloid cells (CD163+). CD163 is a scavenger receptor upregulated by alternatively activated macrophages (M2) or tumor-associated macrophages (TAM) characteristic of an anti-inflammatory TME.28 There was also very low expression of PD-1 and PD-L1 in bone tissue (figure 1A&C). There was no significant difference for these markers between untreated bone biopsies and resection of primary tumors following neoadjuvant chemotherapy (online supplemental figure S3). In contrast, our quantification demonstrated significantly higher infiltration by T cells in PMs. Furthermore, we identified two distinct compartments within the PMs: the immune cell-rich tumor-normal lung ‘interface’ region (PM interface) and the PM interior which was relatively devoid of immune cells (figure 1B). Both T cells and myeloid cells clustered at the PM interface, where PD-1 and PD-L1 expressions were predominant (figure 1B&C) (). While PD-L1 was primarily expressed by CD163+ myeloid cells at the PM interface, it was also expressed on tumor cells in the PM interior (figure 1D).
Supplemental material
Supplemental material

Immunohistochemistry (IHC) demonstrating high concentration of T cells and programmed cell death 1 (PD-1) in pulmonary metastases (PM), particularly at tumor-normal lung interface. Myeloid cells present throughout. (A) Primary bone tumor showing a low concentration of T cells (CD3+) and programmed death ligand 1 (PD-L1), but a higher concentration of CD163+ myeloid cells. (B) H&E with demarcation of tumor-normal lung interface (center green line) and area quantified as the ‘interface’ (IF, outer green lines). PM demonstrates a higher concentration of immune cells (CD3, CD8, CD163) and PD-1/PD-L1 at IF between lung tissue and the metastasis. (C) Quantification of infiltrating CD3+, CD8+, Foxp3+, CD163+ immune cells and PD-1/PD-L1 in osteosarcoma (B=primary bone tumor, PM=entire pulmonary metastasis, IF=PM interface). Gray box drawn to mean, bars showing SD. NS=p>0.05; *p<0.05; **p<0.01; ***p<0.001; ****p<0.0001. (D) IHCs depicting colocalization of CD163 myeloid marker and PD-L1 at the IF.
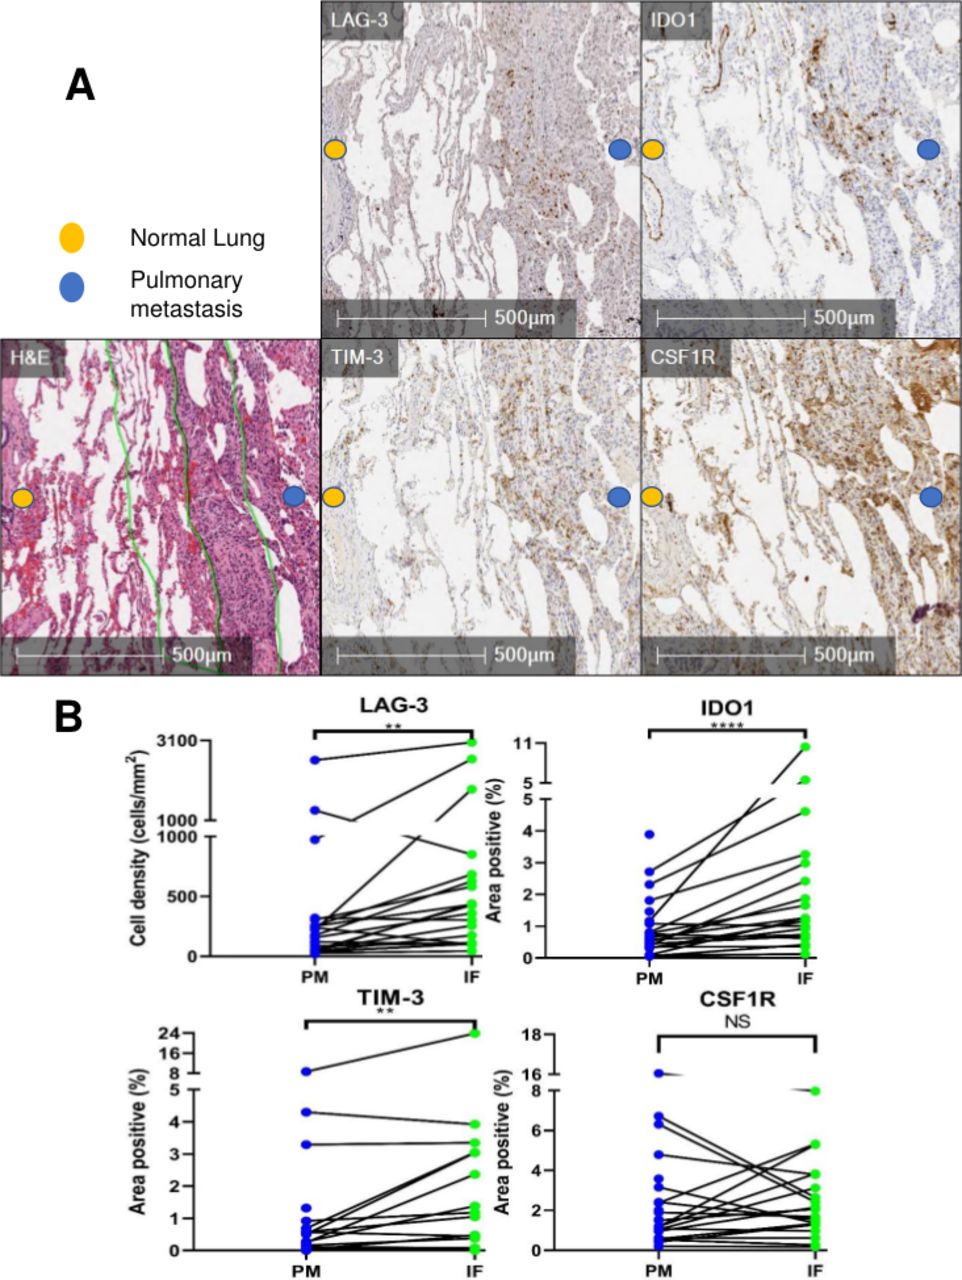
On finding increased immune cells and PD-1/PD-L1 expression in PMs which was concentrated at the PM interface, we expanded our investigation to additional targetable immunosuppressive molecules in PMs. Interestingly, we discovered that there was a higher expression of the immune checkpoint molecules TIM-3 and LAG-3, as well as the IFNγ-driven metabolic checkpoint IDO1 at the PM interface (figure 2A). Remarkably, CSF1R, which is the receptor for colony-stimulating factor 1 (a cytokine that controls the production, differentiation, and function of macrophages) was also present in PMs, but it did not exhibit the described clustering at the PM interface like the remainder of markers (figure 2A & B, online supplemental figure S4). In summary, PMs demonstrated a higher infiltration of T cells, particularly at the PM interface, accompanied by a higher expression of multiple immunoregulatory molecules. In addition, myeloid cells were present in both primary bone tumors and PMs, and in PMs they also accumulated at the PM interface.
Supplemental material

Immunohistochemistry (IHC) analysis reveals high expression of immunoregulatory molecules concentrated at the tumor-normal lung interface in pulmonary metastases (PM). (A) H&E with demarcation of tumor-normal lung interface (center green line) and area quantified as ‘interface’ (IF, outer green lines). PM demonstrating staining of TIM-3, LAG-3, IDO1, and CSF1R at the interface. (B) Quantification of immunoregulatory molecules in PM and particularly at the interface (PM=entire pulmonary metastasis, IF=PM interface). Line between points matches a specific IF with the entire PM from the same specimen. NS=p>0.05; **p<0.01; ****p<0.0001. CSF1R, colony-stimulating factor 1 receptor; IDO1, indoleamine 2,3-dioxygenase; LAG-3, lymphocyte-activation gene 3; TIM-3, T-cell immunoglobulin and mucin domain-containing protein 3.
Presence of activated and exhausted T cells in PM compared with primary bone tumors
We next questioned the immune responsiveness of T cells infiltrating PMs and analyzed them for signs of activation and exhaustion via MFC. We investigated checkpoint molecules and the corresponding intracellular cytokine expression profile of TILs in osteosarcoma specimens to further characterize functional immune properties based on tumor location (bone tumor vs PM). Our initial gating strategy is outlined in online supplemental figure S5. PMs displayed a significantly higher proportion of CD8+lymphocytes compared with primary bone tumors, and a small proportion of regulatory T cells (CD4+Foxp3+) was seen in both PMs and primary bone tumors (figure 3A). CD8+TILs in PMs expressed higher percentages of PD-1 compared with bone tumors, and these CD8+PD-1+TILs also expressed higher amounts of LAG-3 (figure 3B). Furthermore, these PD-1+TILs expressed significant amounts of the transcription factors T-bet and EOMES which are known to control the proliferation hierarchy of exhausted T cells (figure 3C). Finally, CD8+PD-1+TILs from PMs produced higher levels of the effector cytokine IFNγ indicating the cytotoxic potential of this T cell phenotype present in PM (figure 3D).
Supplemental material
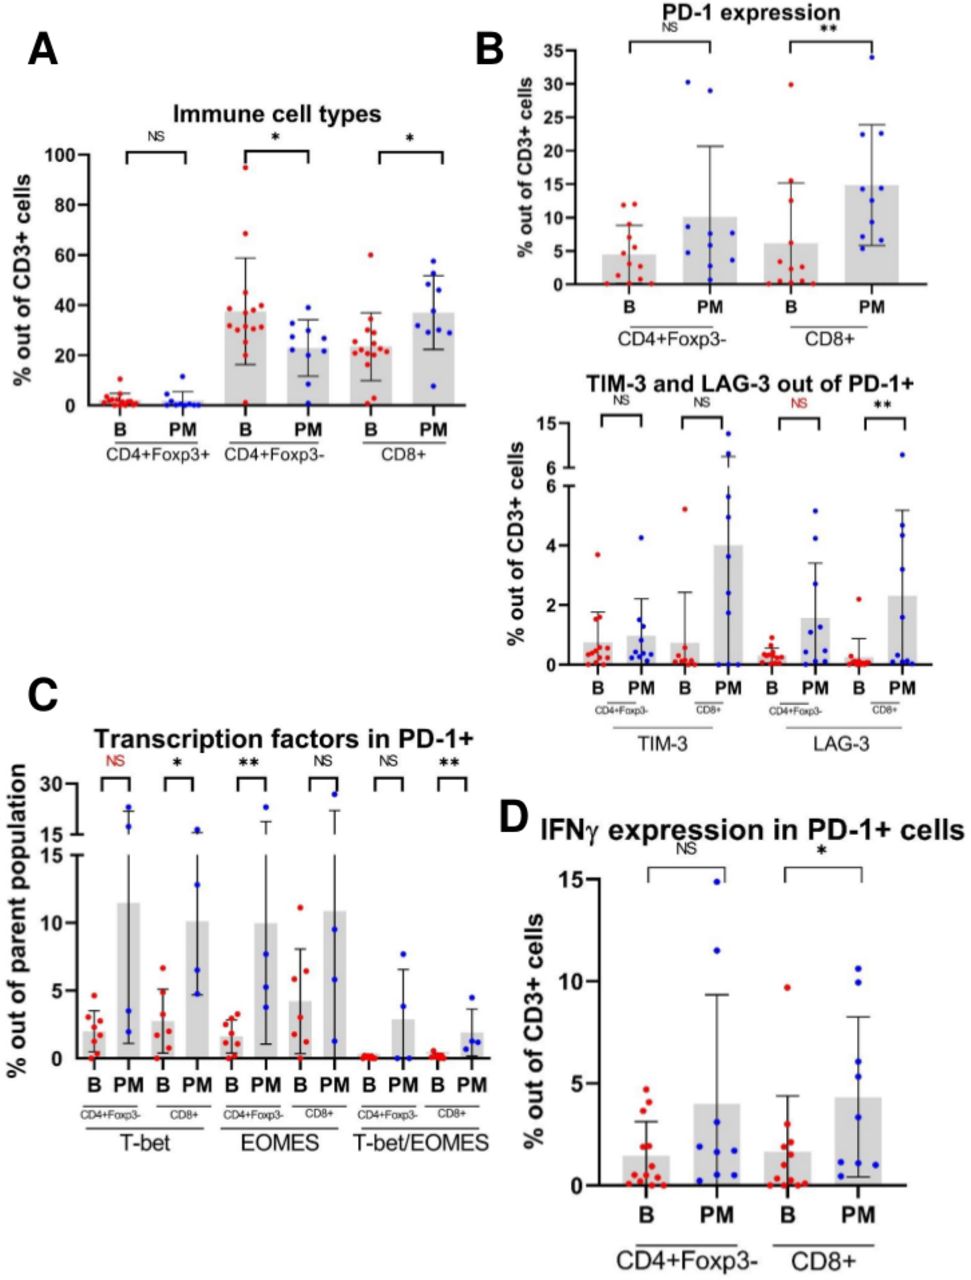
Multiparameter flow cytometry (MFC) scatterplots demonstrate that tumor-infiltrating lymphocytes (TILs) from pulmonary metastases (PM) express higher levels of checkpoint molecules, effector cytokines and transcription factors compared with primary bone tumors. (A) Relative proportions of CD4+Foxp3+ (regulatory T cell), CD4+Foxp3-, and CD8+TILs isolated from osteosarcoma primary bone tumors (B) and PM. (B) Expression of checkpoint molecules in TILs. Given the sequential manner in which TILs may express checkpoint molecules as they become progressively exhausted, TIM-3+ and LAG-3+ populations are gated out of PD-1+ positive population. Note: For CD4+Foxp3-PD-1+LAG-3+ cells, p=0.064. (C) Expression of the transcription factors T-bet and eomesodermin (EOMES) in PD-1+TILs. Note: For CD4+Foxp3-PD-1+T-bet+ cells, p=0.073. (D) Expression of effector cytokine IFNγ in PD-1+TILs. NS=p>0.05; *p<0.05; **p<0.01. IFNγ, interferon-γ; LAG-3, lymphocyte-activation gene 3; PD-1, programmed cell death 1; TIM-3, T-cell immunoglobulin and mucin domain-containing protein 3.
Paired transcriptomic analysis supports the presence of activated lymphocytes and expression of IFNγ- responsive genes at the PM interface region
Given the remarkable regional distribution of immune cells in PMs, we speculated that the transcriptomic profiling of different identified areas would shed light on the mechanisms responsible for the exclusion of T cells from the PM interior. To explore these questions, we performed laser capture microdissection on osteosarcoma PMs and separately dissected the immune cell-rich PM interface region and the immune-excluded PM interior region (online supplemental figure S1). After isolation of RNA from the respective regions, we performed RNA sequencing studies to determine differentially expressed genes predominating in the two distinct regions. Twenty-seven libraries (12 from the PM interface regions, 11 from the PM interior regions, and one each from bone tumor interior, bone tumor-normal bone interface, soft tissue recurrence/metastasis tumor interior, and one soft tissue metastasis tumor- normal muscle interface) passed quality control. Unsupervised principal component analysis was able to segregate the global transcriptome of the PM interface regions from the PM interior regions, and the sparsely infiltrated bone tumors tended to cluster with the PM interiors (online supplemental figure S6). Overall, fewer genes were consistently overexpressed in the PM interior, while a larger number of genes were overexpressed at the PM interface (online supplemental figure S7). We determined the cell-type abundance and expression from bulk tissues via different immune deconvolution platforms. CIBERSORT analysis comparing canonical immune genes at the PM interior to the PM interface regions revealed a predominance of CD8 T cells and CD4 memory resting T cells signatures at the PM interface (figure 4A). This also fits with our IHC observations of multiple immune checkpoint and immunoregulatory molecules, including the IFNγ-regulated molecules PD-L1 and IDO1, which were indicative of increased immune activity at the PM interface. In light of these findings, we explored gene sets associated with immunoregulatory pathways25 and found that indeed both stimulatory and inhibitory molecules stood elevated at the PM interface region compared with the PM interior (figure 4B). We then further expanded our analysis to IFNγ-driven genes related to antigen presentation, chemokine expression, cytotoxic activity, and adaptive immune resistance, which have been shown to be predictive of response to immune checkpoint blockade.24 These genes were also significantly upregulated at the PM interface region (figure 4C). Next, we sought to confirm that these genes were being preferentially expressed in T cells, which would further indicate that TILs were activated but restrained by expression of checkpoint molecules. To address this question, we analyzed our data via xCell22 to generate cell-type coefficient scores. These are indicative of the specific contribution of each immune cell compartment (ie, B cells, T cells, myeloid cells) to the expression of specific genes. With this approach, we ratified that the coefficient for genes associated with markers of T cell cytotoxicity/activation and immune checkpoint molecules were predominantly upregulated at the PM interface region by the T cell compartment (figure 4D).
Supplemental material
Supplemental material

Activated/exhausted lymphocyte, interferon-γ (IFNγ)-responsive and immune checkpoint molecule signatures upregulated at the pulmonary metastasis (PM) interface, but strong myeloid signature throughout the entire tumor. (A) Heatmap representing coefficients of analysis via CIBERSORT shows high CD8 T cell (p=0.0371) and CD4 memory resting T cell (p=0.002) signatures at the PM interface region. There is a slightly stronger M1 macrophage signature (statistically not significant, p=0.547) present at the interface compared with the tumor interior; however, both regions have a much stronger M2 macrophage signature overall. See online supplemental table 2 for raw data and full statistics. (B) Heatmap displaying significant genes that contribute to leading-edge of core enrichment subset via gene set enrichment analysis (GSEA) demonstrating higher expression of immune regulatory molecules at the interface compared with the tumor interior. (C) Heatmap depicting upregulated IFNγ-responsive genes present at the interface by GSEA. (D) Heatmap illustrating coefficients of xCell analysis shows higher expression of markers of cytotoxicity and activation, as well as multiple checkpoint molecules, at the PM interface, with evidence that they are being contributed chiefly by T cells. Intensity represents xCell coefficient, which corresponds to the amount that a particular region (PM interior or PM interface) or cell population (T cells, B cells, or myeloid cells) contributes to the expression of a specific gene. CIBERSORT deconvolution with the leukocyte gene signature matrix LM2221 and xCell22 were used to analyze immune and other cell composition of our data. For GSEA (B and C), genes displayed contribute to the leading-edge core enrichment subset. Expression levels were converted into heatmaps and colors quantitatively correspond to fold changes. FDR, GSEA false discovery rate q value. See online supplemental table 3 for raw rank metric scores for all genes included in GSEA and online supplemental table 4 for xCell coefficients. CIBERSORT, Cell-type identification by estimating relative subsets of RNA transcripts.
Supplemental material
Supplemental material
Supplemental material
A strong myeloid signature is present throughout the tumor, but genes associated with PMN-MDSCs are specifically upregulated at the PM interface region
Tumor-infiltrating myeloid cells constitute a heterogeneous population of cells that are characterized by their diversity and plasticity.29 Many tumor-infiltrating myeloid cells originate from circulating monocytes and granulocytes, which, in turn, stem from bone marrow–derived hematopoietic stem cells. How the composition, molecular state, and spatial interactions of myeloid cells within the TME control the repertoire and the quality of the tumor-antigen-specific T cell response is not well described. Our gene expression profiling of tumor infiltrating immune cells via CIBERSORT analysis comparing the PM interior to the PM interface region revealed an increased proportion of classically activated (M1) macrophages at the PM interface region and an increased proportion of naïve M0 macrophages in the PM interior, although these trends were not statistically significant. However, a strong M2 macrophage signature was present throughout both compartments (figure 4A). This validated our IHC findings that tumor-infiltrating myeloid cells, while concentrated at the PM interface, are also present throughout the PM interior. As we know that M2 macrophages are thought to play a key role in the maintenance of an anti-inflammatory niche leading to a tumor-permissive environment, we further analyzed specific gene sets related to myeloid cells with immune regulatory capacity. It is known that the CSF1/CSF1R axis is essential for differentiation and survival of immunosuppressive myeloid cells, that is, M2 macrophages, and thus we surveyed a set of genes associated with CSF1R responsiveness.23 Notably, this gene set was also enriched at the PM interface, although these gene transcripts were still expressed in the PM interior at lower levels (figure 5A).
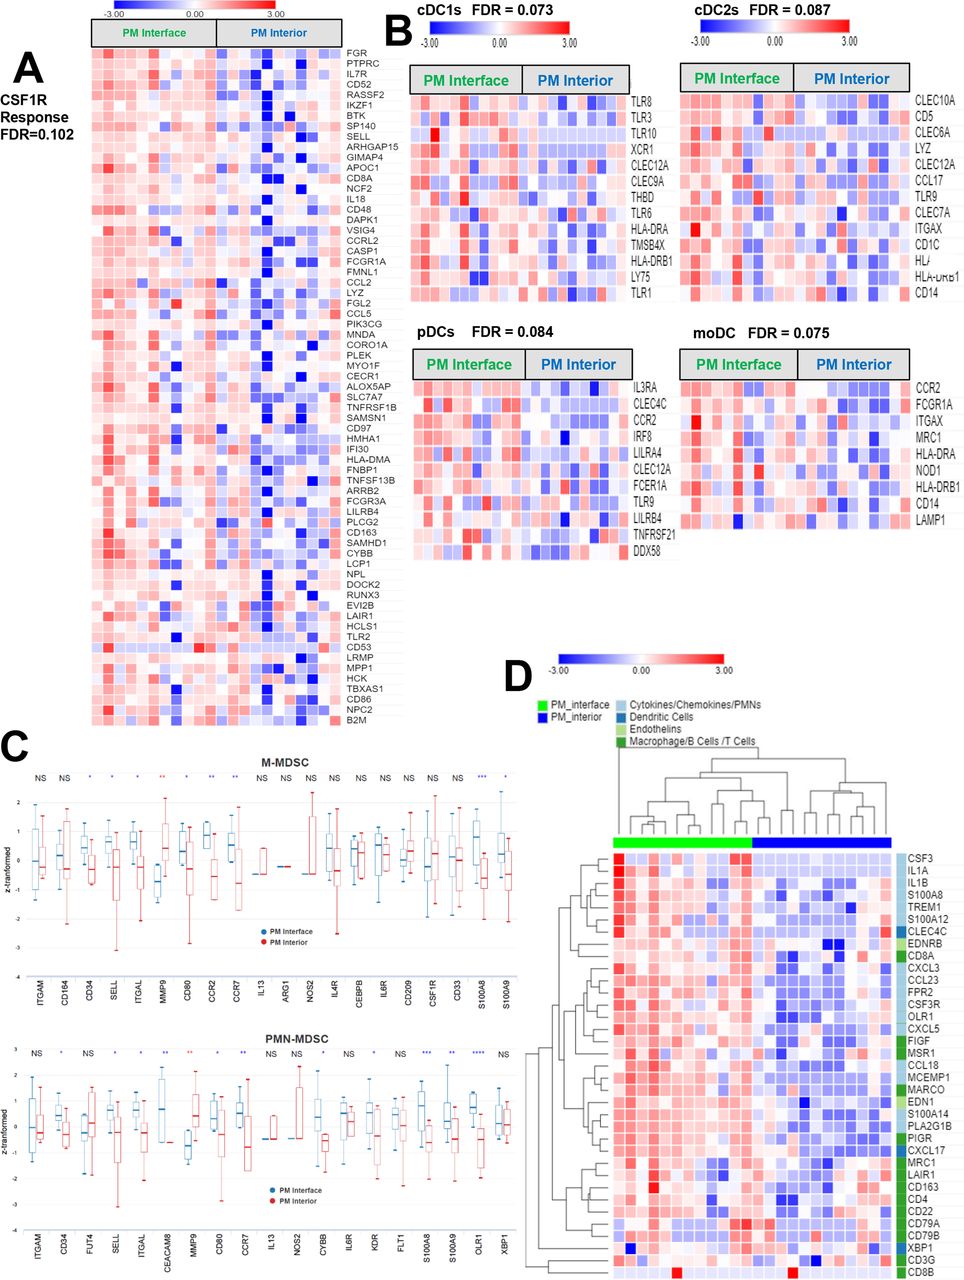
Strong expression of myeloid genes throughout pulmonary metastases (PM), with highest expression of genes related to dendritic cells (DCs) and myeloid-derived suppressor cells (MDSCs) at the tumor interface. (A) Genes associated with colony-stimulating factor 1 receptor (CSF1R) responsiveness plotted as a heatmap are more strongly expressed at the PM interface, but are also expressed throughout the PM interior. (B) By gene set enrichment analysis (GSEA), genes associated with multiple subclasses of antigen-presenting DCs are significantly upregulated at the PM interface (cDC1, conventional type 1 dendritic cell; cDC2, conventional type 2 dendritic cell; pDC, plasmacytoid dendritic cell; moDC, monocyte-derived dendritic cell). (C) Box-and-whisker plots of canonical genes associated with immunosuppressive monocytic myeloid-derived suppressor cells (M-MDSCs) and polymorphonuclear MDSCs (PMN-MDSCs) displaying upregulation at the PM interface. NS=p>0.05; *p<0.05; **p<0.01; ***p<0.001; ****p<0.0001 (red=upregulated in the PM interior; blue=upregulated at the PM interface). Z score transformed by subtracting mean from each value and dividing by SD. (D) Heatmap shows heightened expression of cytokines, chemokines and endothelin transcripts associated with development, recruitment and maintenance of PMNs and PMN-MDSCs at the PM interface compared with the PM interior. For GSEA (A and B), genes displayed contribute to the leading-edge core enrichment subset. Expression levels were converted into heatmaps and colors quantitatively correspond to fold changes. FDR=GSEA false-discovery rate q-value. See online supplemental table 3 for raw rank metric scores for all genes included in analysis.
Based on these results, it became clear that myeloid cells are an important component of the osteosarcoma TME. Thus, we conducted a more comprehensive examination of myeloid cells in the osteosarcoma TME, including dendritic cells (DCs) and MDSCs. Genes associated with functionally different DC lineages were more highly expressed at the PM interface (figure 5B). Furthermore, we also discovered that transcription factors and apoptotic regulators, immune-regulatory genes and molecules, and cytokines involved in the development of MDSC were also elevated at the PM interface (figure 5C).
Interestingly, we noted that several of the genes that are crucial for the development, accumulation and maintenance of polymorphonuclear MDSCs (PMN-MDSCs) were specifically upregulated at the PM interface, particularly CSF3, which plays a pivotal role in growth control of granulocytic progenitors (online supplemental figure S7). Human PMN-MDSC have a gene expression profile that distinguishes them from neutrophils in patients with cancer and from healthy donors.30 Thus, our analysis uncovered that a number of canonical chemokines, cytokines and chemoattractant genes associated with PMN-MDSCs recruitment were heightened at the PM interface, alongside genes that mark DCs and endothelial cells (figure 5D). Of note, we did not observe an accumulation of normal-appearing PMN cells by morphology on this PM IF area but rather myeloid cells with more immature features. Moreover, it was in this specific PM interface region where we identified a high presence of oxidized low density lipoprotein receptor 1 (OLR1), particularly in myeloid cells, which is one of the most overexpressed transcripts in and a specific gene marker of human PMN-MDSC associated with ER stress and lipid metabolism (figure 5D and online supplemental figure S8, online supplemental table 4). Indeed, higher expression of OLR1 has been associated with inferior survival in patients with different types of cancer.30
Supplemental material
The immune TME at the PM interface is associated with PFS
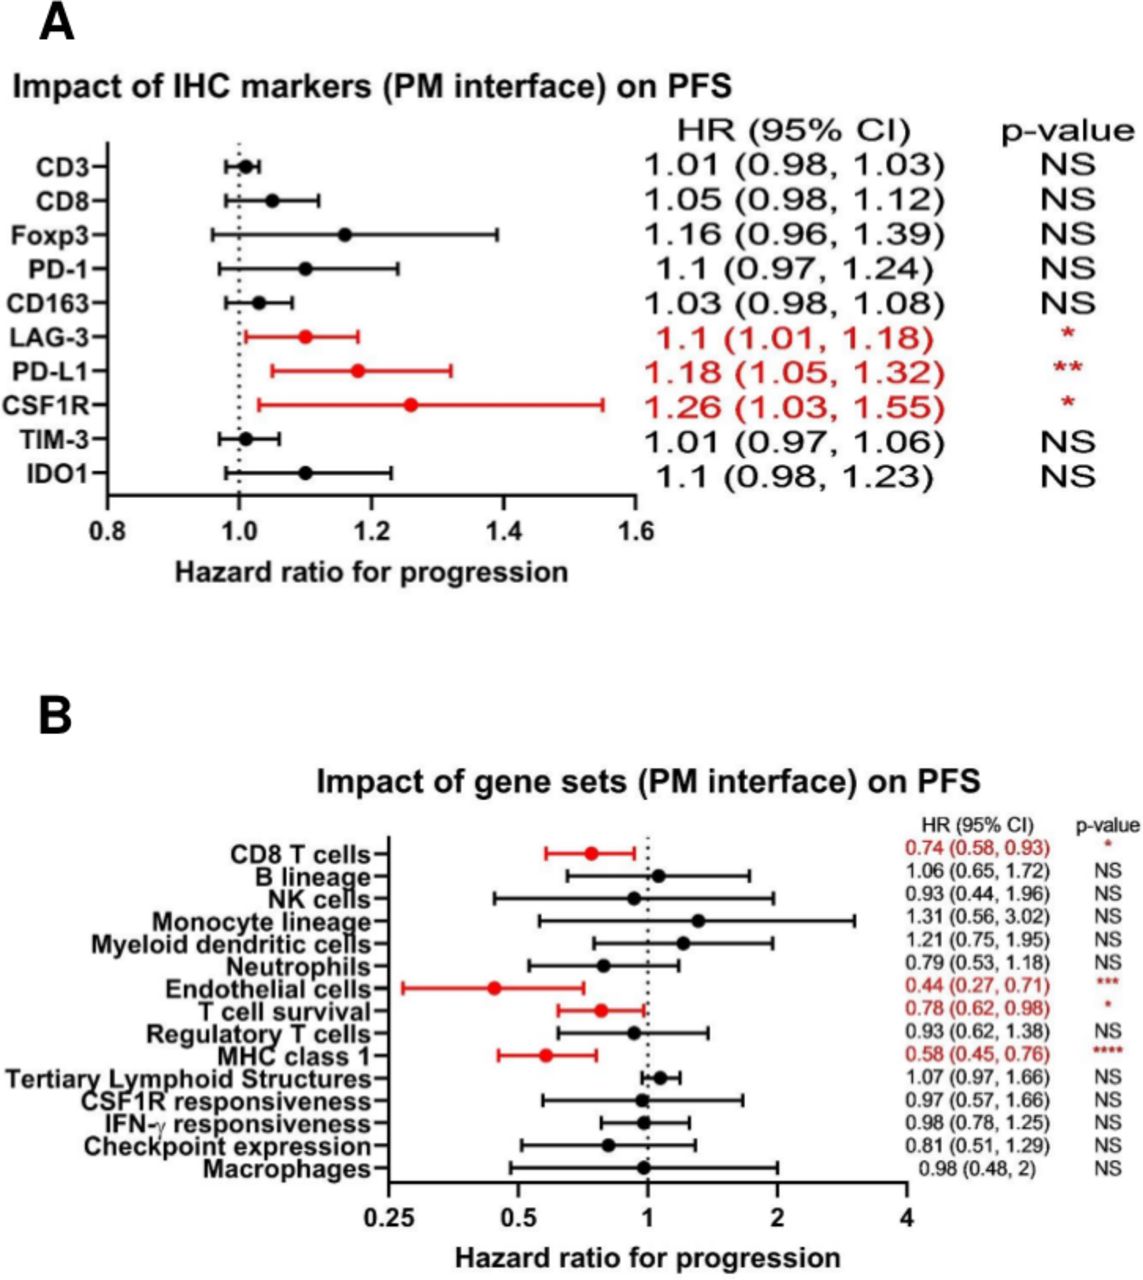
Given the numerous immunosuppressive pathways operant at the PM interface identified by our orthogonal interrogations, we then asked how the attributes of the immune TME we had discovered might affect clinical outcomes for patients with metastatic osteosarcoma. No MFC markers were found to be significantly associated with PFS in our cohort. However, we found that by IHC, a higher expression of the immune checkpoint molecules PD-L1 and LAG-3, as well as CSF1R, at the PM interface were all associated with inferior PFS (figure 6A). In contrast, expression of gene sets associated with effective immune response, including CD8 T cells, T cell survival, and major histocompatibility complex (MHC) class 1 expression,31 as well as endothelial cells, at the PM interface were associated with improved PFS (figure 6B). We also analyzed our IHC markers from primary bone tumors and found that the infiltration of CD8 cells and the ratio of CD8:CD163 cells were both significantly associated with improved PFS from both the diagnostic biopsy and from the definitive resection, while PD-L1 was associated with significantly inferior PFS from the diagnostic biopsy (all p<0.01).
Forest plots demonstrating that markers of the immune tumor microenvironment (TME) at the pulmonary metastasis (PM) interface correlate with progression-free survival (PFS). (A) HRs for immunohistochemistry (IHC) markers at the PM interface as they relate to PFS. For absolute count biomarkers (CD3, CD8, Foxp3, PD-1, CD163, and LAG-3) the unit is per 100 cells, and for percentage biomarkers (PD-L1, CSF1R, TIM-3, and IDO1), the unit is per 1%. (B) HRs for gene sets at the PM interface as they relate to PFS. NS=p>0.05; *p<0.05; **p<0.01; ***p<0.001; ****p<0.0001. CSF1R, colony-stimulating factor 1 receptor; IDO1, indoleamine 2,3-dioxygenase; IFNγ, interferon-γ; MHC, major histocompatibility complex; PD-L1, programmed death ligand 1; TIM-3, T-cell immunoglobulin and mucin domain-containing protein 3.
Discussion
Immunotherapy holds great hope for improving outcomes in patients with sarcoma. However, current immune-oncology approaches are ineffective in osteosarcoma and the underlying reasons for this are extraordinarily poorly understood. One of the major gaps in our understanding is a paucity of information on the metastatic TME, and PMs remain the major cause of cancer-related mortality in patients with osteosarcoma. For example, Wu et al20 performed an extensive analysis of publicly available osteosarcoma sequencing data, including samples from the International Cancer Genome Consortium (ICGC) and Therapeutically Applicable Research to Generate Effective Treatments (TARGET). While genomic approaches are important to amass sufficient data to draw meaningful conclusions, a key shortcoming of these publicly available datasets is that neither includes any samples from PMs. Furthermore, bulk sequencing does not permit an understanding of the regional distribution of immunosuppressive pathways which must be overcome for successful immune-based therapy. Our analysis represents a thorough interrogation of the osteosarcoma TME, and to our knowledge, the most comprehensive evaluation of the TME of PMs using multiple orthogonal approaches. Our analysis confirms that the TME of PMs is vastly different from that of primary bone tumors and suggests several possible mechanisms of immune evasion which must be overcome to allow for effective immunotherapy.
As demonstrated in other studies,32 33 we confirmed that primary bone osteosarcoma tumors were largely ‘immune deserts’, devoid of meaningful immune infiltrates which could be harnessed for antitumor effects. Indeed, tumor-infiltrating CD163+ myeloid cells were the predominant cells observed and may, in fact, contribute to tumor immune evasion. Interestingly, these immune infiltrates do not seem to be affected by standard neoadjuvant chemotherapy. Thus, an inciting event, similar to a surgical site infection5 34 or promoters of the innate immunity,35 may be necessary to attract TILs and initiate an inflammatory response in bone tissue. Notably, tumors that demonstrate increased CD8 T cell infiltration and decreased PD-L1 expression were associated with improved PFS, suggesting that even in these relatively cold tumors the degree of immune response may influence the patient’s outcome.
Recent reports have differed on whether osteosarcoma PMs are more highly infiltrated by immune cells compared with primary tumors,20 or if the opposite is true.18 Our data clearly support the former conclusion, and our study establishes a remarkable regional distribution of these immune cells. Furthermore, we present a comprehensive description of the immunosuppressive programs operative in these different tumor areas, which cause osteosarcoma PMs to exhibit an ‘immune-excluded’ TME which would provide a rationale for immunotherapy intervention. Osteosarcoma PMs were characterized by significant numbers of CD8+ lymphocytes which penetrated only into the edge of the tumor; indeed, our results highlight the importance of interrogating the entire tumor, including the periphery, rather than focusing analysis solely on specimens isolated from a core sample. Our MFC experiments showed that these TILs express markers of activation and exhaustion, supporting that these immune cells are not merely bystander lymphocytes but might represent tumor antigen-specific T cells. However, this initial infiltration of TILs seems to be arrested at the PM interface by a multitude of immune resistance mechanisms, including the upregulation of immune checkpoint molecules and the presence of suppressive myeloid cells.
It has been shown in other cancer types that the same IFNγ which initially drives/promotes T cell activation also turns on a negative regulatory feedback loop (adaptive immunosuppression) that results in upregulation of inhibitory molecules such as PD-L1 and IDO1.36 It has been suggested that a subset of osteosarcomas may express PD-L1,37 38 and indeed we do observe TAMs and tumor cells expressing PD-L1 colocalizing with CD8+ lymphocytes at the PM interface almost displaying a ‘shield’ to prevent further infiltration into the PM interior. This pattern of ‘adaptive immune resistance’ in the face of immune response has been well recognized in other cancer types.39 Furthermore, the checkpoint molecules TIM-3 and LAG-3 have been identified inside osteosarcomas,38 40 and our analysis revealed that in the PMs these checkpoint molecules are expressed on TILs at the PM interface. This coexpression of multiple immune checkpoints was confirmed by MFC. There are data from clinical trials showing that patients whose tumors have higher percentages of CD8+PD-1+ T cells that are negative for TIM-3 and LAG-3 may be more likely to respond to PD-1 inhibition.41 On the contrary, TILs that express multiple immune checkpoint molecules represent the ‘terminally differentiated’ subset of T cells that cannot be rescued with PD-1-directed checkpoint inhibition alone.42 As TILs in metastatic osteosarcoma exhibit expression of multiple immune checkpoint molecules at the PM interface, it is conceivable that single-agent anti-PD-1-directed checkpoint inhibition has not been sufficient in clinical trials to unleash the desired antitumor-directed effect.9 11 12 Combination checkpoint inhibition has shown promising effects for other cancer types, and combining investigational agents targeting TIM-3 and LAG-3 with conventional checkpoint inhibitors targeting either PD-1 and CTLA-4 has already entered early phase clinical testing.17 43 44 Thus, in osteosarcoma combinations of anti-PD-1 therapy with agents targeting TIM-3 or LAG-3 are rational candidates to evaluate.
In addition, we demonstrate that an altered myeloid compartment likely contributes to the exclusion and suppression of lymphocytes. We discovered that the T cell and M1 macrophage signatures present at the PM interface of osteosarcoma are dwarfed by the overwhelming accumulation of immunosuppressive myeloid cells throughout the entire tumor. While gene signatures of CSF1R were particularly enhanced at the PM interface, we also showed upregulation of pathways related to neutrophils, DCs, immature myeloid cells, chemokines/cytokines, and abnormal vasculature at the PM interface, whereas these were mostly absent in the PM interior. It is now well established that tumor-infiltrating myeloid cells are highly malleable based on the surrounding TME.29 In the absence of activation signals, persistent stimulation by tumor-derived factors incites monocyte and granulocyte progenitors to divert from their intrinsic pathway of terminal differentiation into mature macrophages, DCs or granulocytes. Instead, differentiation into pathological, alternatively activated immature myeloid cells is favored. Under pathologic conditions, immature myeloid cells are expanded and converted to immunosuppressive MDSCs.45 Morphologically and phenotypically MDSCs are similar to neutrophils and monocytes. The salient feature of MDSCs is their ability to inhibit T cell function, and they are associated with advanced stage and poor clinical outcomes.45–48 In this context, we were able to document the accumulation of immature and pathologically activated MDSCs that appear to be associated with potent immunosuppressive activity in metastatic osteosarcoma. PMN-MDSCs are important in supporting an immune-suppressive TME in cancers, as well as metastasis in a number of different cancer types via positive cytokine and chemokine feedback loops45–48 and it was one of the predominant immunosuppressive cell populations identified in the examination of our samples. Each of these aspects may contribute to TILs being detained at the PM interface region and correspond to mechanisms that can be clinically influenced. Thus, reversing this myeloid imbalance by combining myeloid and T cell-centric therapies may enhance antitumor immunity and may be necessary for effective immunotherapy in osteosarcoma. An interest of our group is to target the tumor metabolism as a means of augmenting responses to immunotherapy. In this setting, glutamine antagonism has been shown to increase T cell activation,49 reprogram TAMs into inflammatory macrophages with tumoricidal capacity, and inhibit MDSCs via reduction of CSF-3 from both tumors and TAMs,50 which in turn render the tumor more susceptible to killing by immunotherapy.
Importantly, despite the relatively small number of samples, we were able to identify an association between the respective tissue-based IHC and transcriptomic immune signatures and PFS of patients, supporting the notions of immune recognition and immune escape in osteosarcoma PMs. That the immune infiltrate at the PM interface region alone correlates with PFS substantiates that the immunosuppressive features present in that region should be targeted in prospective immune-based therapy trials. One limitation is the retrospective nature of our study, and thus any contribution of the immune biomarkers to patient outcomes must be confirmed by prospective studies.
In summary, we demonstrate that the TME of metastatic osteosarcoma is highly immunosuppressive, and while TILs which display markers of activation are present, they are unable to invade beyond the tumor periphery due to a barrier created by a combination of TAMs, MDSCs, and upregulation of multiple checkpoint molecules. We propose a number of rational targets based on these findings for further testing, although the examples illustrated here are by no means exhaustive. We believe that in order for osteosarcoma immunotherapy to be effective, we will need to combine T cell manipulation therapies with agents that act on myeloid cell plasticity over simple depletion and in that way promote the penetration of TILs into the PM interior to perform their cytotoxic effects. It is our hope that our data will directly inform the design of the next generation of clinical trials of immunotherapies for osteosarcoma by providing justification for rational and feasible combinations of agents.
Data availability statement
Data are available upon reasonable request. All sequencing data available upon reasonable request to corresponding author.
Ethics statements
Ethics approval
This study was conducted in accordance with the ethical principles stated in the Belmont Report and the US Common Rule. It was approved by the Johns Hopkins Institutional Review Board and all samples were obtained in accordance with the Health Insurance and Accountability Act. This study was conducted under an Institutional Review Board approved protocol with a waiver of consent for archived tissues and patients gave written informed consent for prospective tumor collection.
References
Supplementary materials
Supplementary Data
This web only file has been produced by the BMJ Publishing Group from an electronic file supplied by the author(s) and has not been edited for content.
Footnotes
Contributors JAL and NL conceived and designed the work; acquired, analyzed and interpreted the data; and drafted and revised the work. WC, GC, WF, AJT, RB, and EDT analyzed and interpreted the data EHCH acquired, analyzed and interpreted the data. TFO, NS, MHF, CDM, AL, DSR, CFM, and AS acquired data. BL, CAP, DMC, FH, and DMP conceived and designed the work RAA conceived and designed the work; and analyzed and interpreted the data. All authors other than JAL and NJL revised the work critically for important intellectual content. All authors made substantial contributions as above and give final approval of the version published and agree to be accountable for all aspects of the work in ensuring that questions related to the accuracy or integrity of any part of the work are appropriately investigated and resolved.
Funding This work was supported by Johns Hopkins Hospital, Bloomberg-Kimmel Institute for Immunotherapy; Bloomberg Philanthropies, St. Baldrick’s foundation, BMS II-ON, National Pediatric Cancer Foundation and Giant Food.
Competing interests GC is an employee/paid consultant for Compugen LTD. DMC reports grant support from AstraZeneca and Rainier Pharmaceuticals. DMP reports grant support from Bristol Myers Squibb.
Provenance and peer review Not commissioned; externally peer reviewed.
Supplemental material This content has been supplied by the author(s). It has not been vetted by BMJ Publishing Group Limited (BMJ) and may not have been peer-reviewed. Any opinions or recommendations discussed are solely those of the author(s) and are not endorsed by BMJ. BMJ disclaims all liability and responsibility arising from any reliance placed on the content. Where the content includes any translated material, BMJ does not warrant the accuracy and reliability of the translations (including but not limited to local regulations, clinical guidelines, terminology, drug names and drug dosages), and is not responsible for any error and/or omissions arising from translation and adaptation or otherwise.