Article Text

Abstract
Background Synovial sarcoma (SS) and myxoid/round cell liposarcoma (MRCL) are ideal solid tumors for the development of adoptive cellular therapy (ACT) targeting NY-ESO-1, as a high frequency of tumors homogeneously express this cancer-testes antigen. Data from early phase clinical trials have shown antitumor activity after the adoptive transfer of NY-ESO-1–specific T cells. In these studies, persistence of NY-ESO-1 specific T cells is highly correlated with response to ACT, but patients often continue to have detectable transferred cells in their peripheral blood following progression.
Method We performed a phase I clinical trial evaluating the safety of NY-ESO-1–specific endogenous T cells (ETC) following cyclophosphamide conditioning. Peripheral blood mononuclear cells (PBMCs) from treated patients were evaluated by flow cytometry and gene expression analysis as well as through ex vivo culture assays with and without IL-15.
Results Four patients were treated in a cohort using ETC targeting NY-ESO-1 following cyclophosphamide conditioning. Treatment was well tolerated without significant toxicity, but all patients ultimately had disease progression. In two of four patients, we obtained post-treatment tumor tissue and in both, NY-ESO-1 antigen was retained despite clear detectable persisting NY-ESO-1–specific T cells in the peripheral blood. Despite a memory phenotype, these persisting cells lacked markers of proliferation or activation. However, in ex vivo culture assays, they could be induced to proliferate and kill tumor using IL-15. These results were also seen in PBMCs from two patients who received gene-engineered T-cell receptor–based products at other centers.
Conclusions ETC targeting NY-ESO-1 with single-agent cyclophosphamide alone conditioning was well tolerated in patients with SS and those with MRCL. IL-15 can induce proliferation and activity in persisting NY-ESO-1–specific T cells even in patients with disease progression following ACT. These results support future work evaluating whether IL-15 could be incorporated into ACT trials post-infusion or at the time of progression.
- cytokines
- immunotherapy
- adoptive
- immunity
- cellular
- cell engineering
- antigens
- neoplasm
Data availability statement
Data may be obtained from a third party and are not publicly available. contact Seth.pollack@northwestern.edu for additional information.
This is an open access article distributed in accordance with the Creative Commons Attribution Non Commercial (CC BY-NC 4.0) license, which permits others to distribute, remix, adapt, build upon this work non-commercially, and license their derivative works on different terms, provided the original work is properly cited, appropriate credit is given, any changes made indicated, and the use is non-commercial. See http://creativecommons.org/licenses/by-nc/4.0/.
Statistics from Altmetric.com
Introduction
Synovial sarcoma (SS) and myxoid/round cell liposarcoma (MRCL) have poor clinical outcomes in the advanced setting, but may be ideal solid tumors for the development of adoptive cellular therapy (ACT) as they express the NY-ESO-1 target antigen with uniquely high frequency and homogeneity.1–3 Multiple trials have demonstrated response rates up to 50% using NY-ESO-1–specific T cells targeting the HLA A*0201 restricted NY-ESO-1157–165 epitope in these malignancies; however, few responses have been complete or durable.4–7 In addition to engineering autologous T cells with an NY-ESO-1–specific TCR gene, we and others have used activated endogenous NY-ESO-1–specific T-cell response through novel vaccination strategies,8 as well as by culturing endogenous T cells (ETC) with NY-ESO-1 specificity from the peripheral blood ex vivo for infusion.9 10
Although persistence of adoptively transferred cells is a key prognostic factor following NY-ESO-1–targeted ATC,7 some patients develop progression despite continued presence of transferred T cells in the peripheral blood.11 Furthermore, even patients without robust persistence do have rare persistent cells detectable by TCR sequencing.4–6 11 12 A cytokine therapy that could induce expansion of rare persistent NY-ESO-1–specific T cells post-infusion could make ACT more effective.
Here, we present the results of a phase I, pilot cohort of patients with SS and those with MRCL treated with NY-ESO-1–specific ETC. These were non-engineered cells cultured from peripheral blood mononuclear cells (PBMCs), sorted using MHC tetramers and expanded ex vivo prior to infusion following high-dose cyclophosphamide (Cy). Although all patients ultimately had disease progression, rare persisting NY-ESO-1–specific T cells remained detectable in peripheral blood in each case. In two of the four patients, post-treatment tumor was obtained and, as we and other groups have previously observed,6 10 NY-ESO-1 antigen was retained in both cases, suggesting that persisting T cells failed to recognise or respond to tumor antigen, or to persist at tumor sites. However, these cells could be induced to proliferate and kill tumor targets following ex vivo culture with IL-15. We confirmed that IL-15 also increased ex vivo activity of PBMCs from T-cell receptor (TCR)–engineered ACT trials performed at other centers.4 5 These data suggest that systemic, post-infusion IL-15 warrants further exploration as a strategy to improve ACT.
Materials and methods
Patients and clinical trial procedures
All patients provided informed consent in accordance with the Declaration of Helsinki. The ETC trial (NCT04177021) was approved by the Fred Hutchinson Cancer Research Center (FHCRC) Institutional Review Board (IRB). The primary objective was to assess the feasibility, safety and toxicity of treating of NY-ESO-1–specific ETC. Tolerability based on CTCAE V.4.0 was the primary endpoint. Response based on RECIST V.1.1 at 8–10 weeks and T-cell persistence based on tetramer (tet+) staining were secondary endpoints. Eligibility included advanced or metastatic SS or MRCL with at least one prior line of therapy, expression of HLA A*0201, ECOG performance status ≤1 and NY-ESO-1 expression in >25% of tumor cells by immunohistochemistry (for complete eligibility criteria, see online supplemental figure 1). Patients were labeled Cy1–Cy4 based on order of enrollment. Details regarding cell generation have been previously reported.9 Baseline imaging was performed approximately 2 weeks prior to infusion and an additional scan was performed 4 weeks afterwards. After their 8–10 week scan, patients were followed per standard of care with additional research blood collections. The patient who received ACT at the NCI (labeled “NIH”) consented for a blood/tissue collection protocol registered with the FHCRC IRB. The patient treated at UCLA (labeled “UCLA”) provided informed consent at UCLA and de-identified PBMC was analyzed at FHCRC under an IRB-approved minimal risk study.
Supplemental material
Flow cytometry and intracellular cytokine staining
Multicolor staining including Major Histocompatibility Complex (MHC) tetramers was as previously described.9 For cytokine staining, cells were stimulated with NY-ESO-1157–165 peptide (10 µg/mL) for 1 hour followed by addition of 1× Brefeldin A (BioLegend). For intracellular markers, cells were fixed using a 1:3 ratio of fixation and permeabilization (eBioscience). Data were collected using the BD FACS Symphony and analyzed with FlowJo. See online supplemental table 1 for a full list of antibody and clones.
Microarray and data analysis
RNA from sorted CD8+tetramer+ (tet+) was extracted using Qiagen AllPrep DNA/RNA Micro Kit. Gene-expression profiling was performed on the Affymetrix Clariom D Pico assay platform. Microarray data were normalized and analyzed by Limma. Repeated measure was applied to all patients to account for only time-dependent change. Gene sets were obtained from MSigDB Collections.
TCR Vβ deep sequencing
TCR Vβ sequencing and normalization was performed on tet+ cells sorted from patients’ PBMCs by Adaptive Biotechnologies (Seattle, WA, USA). The number of total cells, T cells, the T-cell fraction, the number of unique rearrangements and clonality were calculated for each sample as previously described.13
Serum cytokine measurement
Serum samples were collected before infusion and at different times post-infusion, then stored at −20°C. Samples were analyzed in duplicates at the same time using a Luminex microbead assay.
TIL isolation
Tumor specimens were cut into 1–2 mm fragments and cultured with 2000 U/mL IL-2 and cryopreserved. To liberate additional T cells from tumor, some frozen fragments were thawed, incubated in an enzymatic cocktail containing Type IV collagenase, DNase and hyaluronidase for 30 min at 37°C, then pressed through a 70 mm mesh cell strainer.
In vitro T-cell priming and 3D culture assay
PBMCs (1×10⁵) from each patient were cultured in the presence of NY-ESO-1157–165 peptide (10 µg/mL) and in STEMCELL-XF T expansion medium conditioned with IL-2, IL-15 and in some cases anti-PD-1. Half-media changes with conditioned media were performed on every alternate day until day 8 when PBMCs were harvested for flow cytometry. For the 3D culture assay, GFP-transduced 1765 MRCL cells were embedded in Collagen Type I in organoid chips (AIM Biotech) for coculture assays.14 Chips were imaged using the Leica SP8 microscope and analyzed using Imaris software (see online supplemental table 2 for information about reagents, concentrations and details regarding the 3D culture assay).
Statistical analyses
For multiple groups, statistical significance was calculated using one-way ANOVA, followed by Dunnet’s multiple comparison test to compare two groups within multiple groups. For only two groups, Student’s t-test was applied. ****p≤0.0001; ***p≤0.001; **p≤0.01; *p≤0.05.
Results
Clinical results following ACT
Patient demographics are included in table 1. Four patients were treated with NY-ESO-1–specific ETC at target cell doses of 1010/m2 on day 0 after receiving Cy (2 g/m2/day ×2 days) on days −3 and −2 as lymphodepleting conditioning (figure 1A). No unexpected, attributable toxicity was seen and all significant toxicity (grade ≥3) was attributed to Cy (complete toxicity data are included in online supplemental table 3). Patient Cy1 had small volume lung disease with only one RECIST-evaluable lesion with stable disease (SD), and slight regression from 11.5 mm to 10.9 mm following ACT. This lesion was resected 3 months after infusion allowing the patient to be free of detectable disease, but recurred after 1 year. Cy2 started with rapidly progressive disease (PD), but had a 20% reduction in a liver lesion at his 4-week scan (figure 1B) with SD overall. Cy3 had rapidly progressing pulmonary metastases pre-treatment, with baseline imaging demonstrating 62% increase versus prior scan 2 months earlier. The 4-week post-ACT scan showed SD with some smaller tumors. A subsequent scan showed PD and the patient went on to receive chemotherapy and eventually metastatectomy. Cy4 had rapidly progressing bulky disease but had SD with some tumors regressing post-ACT and improvement in his pain allowing him to discontinue opioids (clinical summaries are provided in online supplemental figure 2).

Clinical response and T-cell persistence. (A) Trial schema. (B) Response in liver lesion in patient Cy2. (C) NY-ESO-1 staining in a lung metastasis from patient Cy 4. (D) Serum IL-15 concentration. (E) Representative flow cytometry plots depicting gating of tet+ cells in peripheral blood of Cy1. (F) Percentage of tet+ cells of CD8 T cells before infusion and at various times post-infusion for 4 patients Cy1 (blue), Cy2 (red), Cy3 (green) and Cy4 (magenta). (G) Flow cytometry plots depicting tet+ cells in single cells isolated from blood and tumor digest from approximately 3 months after cell transfer from Cy1. (H) Persistence of dominant clone by T-cell receptor (TCR) sequencing (colors included are as in D). (I) Sequencing of TCRβ chain depicting different T-cell clones in different colors before infusion and at various times post-infusion for patient Cy2.

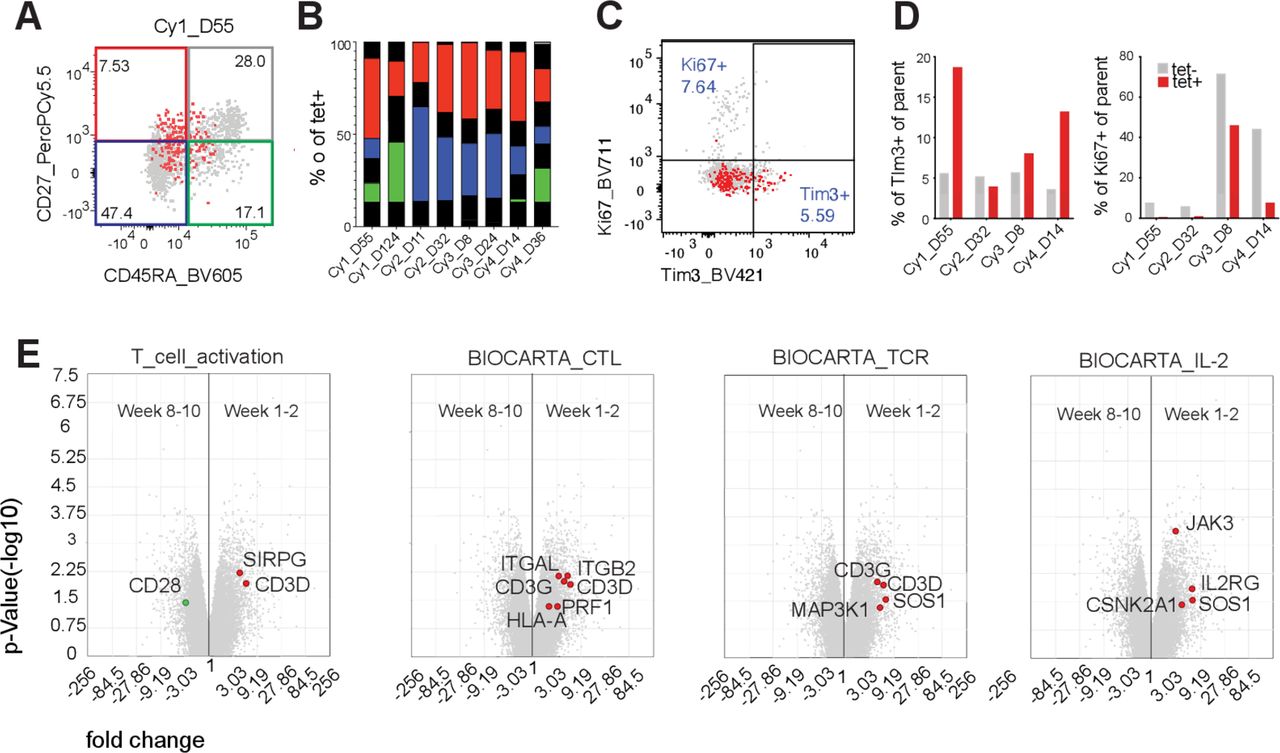
Phenotype of persisting cells. (A) Representative plots for expression of CD45RA and CD27 on tet+ cells (red) overlaid on tet− cells (gray). (B) Bars show the distribution of tet+ cells into CD45RA–CD27– (blue), CD45RA+CD27– (gray), CD45RA+CD27– (green) and CD45RA–CD27+ (red). (C) Representative plots for expression of Tim3 and Ki67 expression from mid-range time points (weeks 3–8) post-infusion on tet+ cells (red) overlaid on tet– cells (gray). (D) Bars show percentage Tim-3+ and Ki67+ cells of parent for tet+ (red) and tet– (gray) CD8+ T cells. (E) Scatter plot of microarray data depicting genes differentially expressed between transferred NY-ESO-1–specific T cells isolated at an early time point (weeks 1–2) and late time point (weeks 8–10) post-infusion. Gene set analysis depicting genes that are overexpressed in early (red dots) vs late time (green dots) point samples and belong to pathways reflective of T-cell activation, cytotoxic killing, TCR activation and IL-2 signaling (left to right). All genes differentially expressed that belong to the indicated pathway are represented in colored circles.
Clinical characteristics of patients receiving ACT as well as their cell dose, dominant Vβ-gene usage and short-term outcomes
Although each patient other than Cy1 had confirmed PD by their 8–10 week CT scan, all had evidence of anti-tumor activity in at least one tumor site at the 4-week scan, suggesting temporary activity of the infused cells given that these patients had prior treatment with ifosfamide and thus were unlikely to respond to Cy. The cohort was stopped after four patients, as alterations to the conditioning regimen were planned (NCT02319824). Retention of viable tumor with homogeneous NY-ESO-1 expression was confirmed for both patients with tumors resected post-ACT (Cy1 and Cy3; Cy3 shown in figure 1C). Serum IL-2 and IL-15 dropped after an initial post-Cy spike (IL-15 shown in figure 1D, IL-2 in online supplemental figure 3).
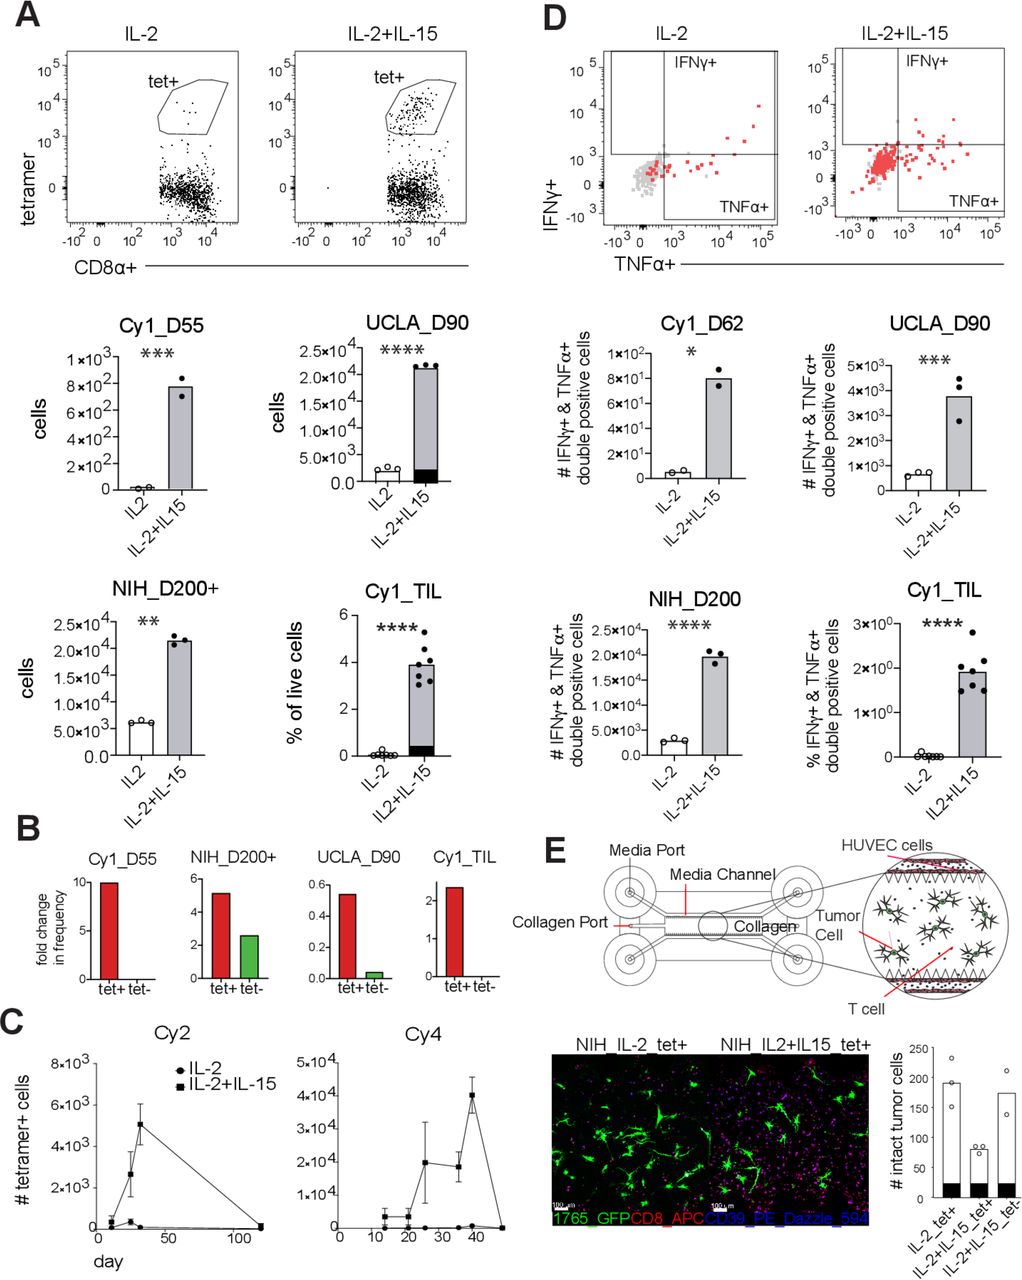
IL-15 expands and revives cytotoxicity of NY-ESO1-1–specific T cells. Peripheral blood mononuclear cells (PBMCs) and tumor-infiltrating lymphocytes from patients after 9 days of culture with NY-ESO-1 peptide in conditioned media. (A) Representative gating of tet+ cells applied to live CD8+ cells, and number of tet+ cells or percentage of tet+ of live cells, in cultures supplemented with IL-2 (clear bars with clear dots) or IL-2 plus IL-15 (gray bars with black dots). Each dot represents one technical replicate. (B) Fold change in the mean frequency of tet+ cells (red bars) from day 0 (ex vivo) to day 9 post-culture in IL-2 plus IL-15. Fold change for tet− (green) bars in shown for reference. (C) Graph depicting the counts of tet+ cells in IL-2 (circles) or IL-2 plus IL-15 (squares) supplemented cultures started from PBMCs of 2 patients isolated at various recovery times. Squares and circles represent the mean derived from 2 to 3 replicates and bars show SD. (D) Representative flow cytometry plots depicting the production of IFNγ and TNFα by tet+ cells (red) overlaid on tet− cells (gray) for reference. Number of IFNγ and TNFα double-positive tet+ cells, or percentage of double-positive cells of live cells, in cultures supplemented with IL-2 (clear bars with clear dots) or IL-2 plus IL-15 (gray bars with black dots) are shown. As in (A), each dot represents one technical replicate. (E) Illustration of the design of organoid chips prepared to measure killing of 1765 (MRCL cell line) by CD8 T cells. PBMCs of patient from NIH trial cultured with NY-ESO-1 peptide and supplemented with IL-2 or IL-2 plus IL-15 for 7 days and tet+ and tet− cells were sorted and injected into organoid chips. Number of GFP+1765 cells were counted 48 hours post–T-cell injection. One dot represents one organoid chip. For all panels where relevant: ****p<0.0001, ***p<0.001, **p<0.01, *p<0.05.
Persistence and phenotype of adoptively transferred cells
For each patient, the frequency and number of CD8+NY-ESO-1 tet+ cells in PBMC peaked at week 2 and then decreased (figure 1E and F) to low yet still detectable levels. In Cy1, whose tumor was resected 3 months after ACT, 2.9% of TIL were CD8+/tet+, 5× higher than in the PBMC at that time suggesting trafficking to the tumor (figure 1G). The early peak of dominant transferred clones was confirmed in TCRβ sequencing of PBMC at 1 day, ~2 weeks, ~1 month and ~2 months post-ACT (figure 1H). TCRβ sequencing was performed on tet+ cells sorted from similar time points. In Cy2 and Cy4 (Cy2 shown in figure 1I), the dominant clone in this tet+ sorted population remained dominant for at least 8–10 weeks. In Cy1 and Cy3, the dominant clone waned, and minority clones increased in frequency in the tet+ population (online supplemental figure 4).15
Consistent with prior reports,10 16 transferred cells in all patients predominantly had a memory phenotype (figure 2A and B)17 with very few cells that were double positive for CD39 and CD103. While few cells expressed PD-1, we also tested for Tim-3, an exhaustion marker that also suggests antigen experience (online supplemental figure 5), and there was a non-statistically significant trend toward higher expression on tet+ cells compared with tet− controls (most pronounced in Cy1, figure 2C and D). Given that at least two patients retained NY-ESO-1 expression post-ACT, we expected to observe proliferation and expansion of persisting cells. However, Ki67 expression was much lower on tet+ cells compared with tet− controls (figure 2D) suggesting a lack of proliferation. We performed gene expression analysis on flow sorted tet+ cells from 1 day, ~2 weeks and ~2 months after infusion (phenotype of infusion products has been previously described).9 Gene sets related to TCR signaling, T-cell activation, cytotoxic capacity and IL-2 pathway were more highly expressed at week 2 compared with weeks 8–10 post-infusion suggesting that transferred T cells lacked TCR stimulation post-ACT (figure 2E).
IL-15 induces secondary expansion of adoptively transferred T cells
Given that rare persisting cells failed to proliferate despite the presence of confirmed antigen-expressing tumor, we hypothesized that these cells might be stimulated with IL-15, which has been observed to stimulate inhibited memory T-cell populations.18 To test this, we cultured PBMCs from post-infusion samples with NY-ESO-1157–165 peptide and low-dose IL-2 alone, or with IL-15. The addition of low-dose IL-15 led to a significant increase in expansion of tet+ cells compared with control group by day 9 (figure 3A). Although IL-15 also induced expansion of CD8+ cells, the expansion of tet+ cells was significantly higher (figure 3B).
We also confirmed this effect in PBMCs from patients with SS treated with NY-ESO-1 TCR-engineered products at UCLA and the NIH who also had a low number of persisting tet+ cells.5 12 We found that IL-15 expanded tet+ cells from tumor-infiltrating lymphocytes (TILs) isolated from post-treatment biopsy from Cy1 (figure 3A). Neither anti-PD-1 nor higher doses of IL-15 further enhanced this effect (online supplemental figure 6). In patients Cy2 and Cy4, the effect of IL-15 in inducing T-cell expansion was higher in samples from intermediate time points compared with early or late time points suggesting that the effect of IL-15 may be time dependent for some patients (figure 3C).
IL-15 increases effector function of adoptively transferred T cells
To test if IL-15 increased the effector function of T cells, we stimulated cells with NY-ESO-1157–165 peptide following 9-day culture with IL-2 or with IL-2 and IL-15 and performed intracellular cytokine staining for IFNγ and TNFα. The number of cells positive for both IFNγ and TNFα was significantly higher in IL-15 supplemented cultures (online supplemental figure 7), and we confirmed these results in samples from patients treated with TCR-engineered products at UCLA, and the NIH, as well as TIL from Cy1 (figure 3D).
To more closely approximate in vivo biology, we performed T-cell tumor killing assays using a 3D culture system in which tumor cells and T cells are embedded in a collagen matrix lined by endothelial cells. Tet+ cells cultured with IL-15 had greater than twofold increase in their killing efficiency as compared with the control group. By 48 hours, the number of IL-15-treated tet+ cells were significantly higher than the control group, despite starting with the same number of cells suggesting that T cells continued to expand into the chips post-transfer (figure 3E; online supplemental figure 8). These results were observed in both products from patients treated at UCLA and the NIH.
Discussion
Here, we present a cohort of four patients with SS and MRCL who progressed following ETC targeting NY-ESO-1, despite detectable persistence of transferred T cells. Limitations to this study included the use of ex vivo cryopreserved samples, including TIL, which may have different phenotypic and functional properties compared with cells in vivo or freshly procured specimens. Although it is difficult to judge a cell therapy regimen based on only four patients, clinical responses were disappointing, possibly in part due to the absence of fludarabine conditioning which has been associated with improved responses following ACT in patients with SS treated with NY-ESO-1–specific T cells.6 Both active national ACT trials testing TCR-modified cells in patients with SS (NCT03967223 and NCT04044768) are currently incorporating fludarabine into lymphodepletion as these prior studies suggest it may play a critical role.
Increased lymphodepletion intensity and the addition of post-infusion IL-2 are established ways of modifying conditioning protocols to improve patient outcome, in part by increasing endogenously produced IL-7 and IL-15.19 However, it is important to recognize that nearly all patients with SS and MRCL who initially respond to ACT do not have complete responses and ultimately progress. There are also unique challenges for achieving sustainable T-cell trafficking and tumor recognition in SS and MRC, including the low levels of MHC class I expression and few infiltrating T cells in these tumors. Unfortunately, we could not address these issues here given this study’s small size.20 MHC expression and T-cell infiltration into these tumors can be increased by systemic IFNγ21; however, incorporation of cytokines into ACT regimens must be done with great care.10
Our data suggest that more could be done to support transferred T cells after the time of infusion, possibly using post-infusion IL-15, a cytokine known to support memory T cells.18 High IL-7 and IL-15 following lymphodepletion may aid responses for some patients, but as levels fall, transferred T cells may fall as well. Cellular products are being prepared in ways incorporating IL-15 during product expansion22 and T-cell products releasing IL-15 or with membrane-tethered IL-15 for trans-presentation have been designed to augment in vivo proliferation and persistence.23 Systemic IL-15 can be given safely, and could be incorporated into future ACT regimens either following cell transfer or planned prospectively for the time of progression.24 25
Data availability statement
Data may be obtained from a third party and are not publicly available. contact Seth.pollack@northwestern.edu for additional information.
References
Supplementary materials
Supplementary Data
This web only file has been produced by the BMJ Publishing Group from an electronic file supplied by the author(s) and has not been edited for content.
Footnotes
Twitter @pancsurg, @immunosarc
Contributors JC, RHP, RLJ, SRR, CY and SMP contributed to overall study conception and design. RLJ, EYK and SMP participated in clinical care for patients on study. LDC, MJW, DSH, HS and SMP contributed to clinical data collection. KK, LY, EAF, JC, RGB and SMP designed the experiments and collected data. KK, LY, SZ, JC, RHP, RGB and SMP contributed to data analysis and interpretation of results. TSN and AR provided critical reagents and materials. KK, SZ, BAS, RGB, DSH, VGP and SMP contributed to manuscript preparation. All authors reviewed the results and approved the final version of the manuscript.
Funding Funding for this trial was provided by the Gilman Sarcoma Foundation and CA180380. SMP was also supported by R01CA244872, CA180380 and a grant from the V Foundation.
Competing interests SMP receives research funding from Merck, EMD Serono, Incyte, Presage, Janssen, Oncosec and Juno. He has consulting, honoraria and advisory activity with GlaxoSmith Kline, Daiichi Sankyo and Blueprint Medicine. SRR has received equity, consulting fees and research funding from Juno Therapeutics/a BMS company and Lyell Immunopharma. He has received consulting fees and equity from Adaptive Biotechnologies.VGP receives research funding from Merck, AstraZeneca, and Ipsen. He has had consulting, honoraria and advisory activity with Merck, GlaxoSmithKline, Imvax, and Takeda. VGP receives research funding from Merck, AstraZeneca, and Ipsen. He has had consulting, honoraria and advisory activity with Merck, GlaxoSmithKline, Imvax, and Takeda.GlaxoSmithKline, Imvax, and Takeda.
Provenance and peer review Not commissioned; externally peer reviewed.
Supplemental material This content has been supplied by the author(s). It has not been vetted by BMJ Publishing Group Limited (BMJ) and may not have been peer-reviewed. Any opinions or recommendations discussed are solely those of the author(s) and are not endorsed by BMJ. BMJ disclaims all liability and responsibility arising from any reliance placed on the content. Where the content includes any translated material, BMJ does not warrant the accuracy and reliability of the translations (including but not limited to local regulations, clinical guidelines, terminology, drug names and drug dosages), and is not responsible for any error and/or omissions arising from translation and adaptation or otherwise.