Article Text

Abstract
Background Gamma-delta (γδ) T lymphocytes are primed to potently respond to pathogens and transformed cells by recognizing a broad range of antigens. However, adoptive immunotherapy with γδT cells has exhibited mixed treatment responses. Better understanding of γδT cell biology and stratifying healthy donors for allogeneic adoptive therapy is clinically needed to fully realize the therapeutic potential of γδT cells.
Methods We examine 98 blood samples from healthy donors and measure their expansion capacity after zoledronate stimulation, and test the migration and cytotoxic effector function of expanded γδT cells in 2D culture, 3D tumor spheroid and patient-derived melanoma organoid assays.
Results We find that γδT cell expansion capacity is independent of expansion methods, gender, age and HLA type. Basal γδT cell levels in Peripheral blood mononuclear cell (PBMC) correlate well with their expansion, migration and cytotoxic effector capacity in vitro. Circulating γδT cells with lower expression of PD-1, CTLA-4, Eomes, T-bet and CD69, or higher IFN-γ production expand better. γδT cells with central memory and effector memory phenotypes are significantly more abundant in good expanders. A cut-off level of 0.82% γδT cells in PBMC stratifies good versus poor γδT cell expansion with a sensitivity of 97.78%, specificity of 90.48% and area under the curve of 0.968 in a healthy individual. Donors with higher Vδ2 Index Score in PBMC have greater anti-tumor functions including migratory function and cytotoxicity.
Conclusions Our results demonstrate that the interindividual γδT cell functions correlate with their circulating levels in healthy donors. Examination of circulating γδT cell level may be used to select healthy donors to participate in γδT-based immunotherapies.
- immunotherapy
- adoptive cell therapy
- melanoma
- gamma delta T-lymphocytes
Data availability statement
All data relevant to the study are included in the article or uploaded as online supplemental information.
This is an open access article distributed in accordance with the Creative Commons Attribution Non Commercial (CC BY-NC 4.0) license, which permits others to distribute, remix, adapt, build upon this work non-commercially, and license their derivative works on different terms, provided the original work is properly cited, appropriate credit is given, any changes made indicated, and the use is non-commercial. See http://creativecommons.org/licenses/by-nc/4.0/.
Statistics from Altmetric.com
Introduction
Adoptive immunotherapy has shown unprecedented success.1 2 Adoptive T-cell transfer has so far focused mainly on using αβT cells, which is effective in certain patient populations.3 4 Unlike αβT cells, γδT cells manifest the features of both innate and adaptive immunity.5 γδT cells are pre-programmed to locate and destroy cells that are “stressed” by transformation, which makes them a good candidate for adoptive T-cell transfer.6 γδT cells differ from αβT cells by their TCR gene usage, tissue tropism and MHC-independent antigen recognition.7 In addition, tumors may not always need to be immunogenic in the conventional sense of activating naive αβT cells but may still be targets for γδT cells. Downregulation or loss of HLA class I or β2 microglobulin which makes tumor cells undetectable to αβT cells is unlikely to affect γδT cell recognition.6 An additional perquisite of using γδT cells for immunotherapy lies in their ability to cross present processed tumor antigen to αβT cell.8 Meta-analysis of gene expression signatures from ~18,000 human tumors across 39 malignancies indicated a tumor-associated γδT-cell profile as the best predictor of patient survival.9 Thus, γδT cells may represent a unique cell source for immunotherapy.
Human peripheral blood contains both Vδ1 and Vδ2 γδT cells, but the predominant γδT cells are the Vδ2 subset that co-expresses the Vγ9 chain, named Vγ9Vδ2 T cells.6 10 γδT cells account for less than 5% of total T cells, and given Vδ2 T cells are in relative abundance in peripheral blood, most γδT cell clinical trials to date have focused on the Vδ2 T cell subset. For most clinical trials and preclinical studies, zoledronate (ZOL, an FDA-approved drug) and anti-γδ TCR antibody have been used to selectively activate and expand γδT cells both in vitro and in vivo.11–13 Since Vγ9Vδ2 T cells are not MHC restricted, off-the-shelf allogeneic therapy using cells expanded from healthy donors is possible.14 15
Adoptive immunotherapy with γδT cells have been tested in hundreds of patients with various cancers14 16 and these clinic trials showed that γδT cell immunotherapy was well tolerated and safe17; however, despite complete remissions that were reported in patients with cancer,18 for the majority of patients, the efficacy was limited.19 20 The expansion capacity of γδT cells from patients with cancer was lower than that in healthy donors,18 and γδT cells derived from patients with cancer had dysfunctional effector cytokine production and cytotoxicity.21
The failure of current γδT-based therapies may be due to a highly variable capacity of the polyclonal γδT TCR repertoire to recognize tumors, functional instability, dysfunction or exhaustion of chronically activated γδT cells.22 The interindividual heterogeneity also manifests as a high degree of variation in γδT cell expansion capacity, despite the fact that the circulating γδT cell profile in an individual is stable over time after birth.23 Clearly, understanding the interindividual heterogeneity in γδT cells is critical for optimization of γδT cell–based therapies. In this study, we discover that basal Vδ2 lymphocyte concentration in the PBMC is a good predictor for γδT cell expansion and anti-tumor cytotoxic capacity. Using 0.82% of γδT cells in PBMC as a cut-off level, the assay has a sensitivity of 97.78% and specificity of 90.48% to determine whether γδT cells can be well expanded in a healthy individual. The screen method may be used to select healthy donors for allogeneic γδT cell–based immunotherapies.
Results
Significant interindividual heterogeneity in γδT cell expansion
Not all PBMC samples from healthy donors could be used to effectively expand γδT cells using ZOL.24 In the current study, 98 PBMC samples from 43 healthy donors were tested independently. Some of the donors had multiple samples collected at different time points during a period of 2 years. Consistent with published data, the purity of expanded γδT cells was shown to be one of the important indicators for γδT cell function.25 26 The purity of the expanded γδT cells by ZOL in all of the 43 donors is displayed in figure 1A. PBMCs from 17 donors were tested three times or more independently at different time points and the purity of expanded γδT cells from the same donor yielded similar results (online supplemental figure S1A). PBMCs from 13 donors were expanded by both ZOL and anti-γδT TCR antibody. ZOL expanded γδT cells significantly better than that of anti-γδT TCR antibody (figure 1B); however, both expansion methods showed a similar trend (online supplemental figure S1B). Anti-TCRγδ Ab expanded both Vδ2 and Vδ1 cells and the ratio of Vδ2:Vδ1 is 50%–250%, while ZOL preferentially expanded Vδ2 cells and the ratio of Vδ2:Vδ1 is 173%–3500% (online supplemental figure S1C).
Supplemental material
Supplemental material

Significant interindividual heterogeneity in γδT cell expansion. (A) Purity of expanded γδT cells. 98 PBMC samples from 43 healthy donors were tested independently after 10-day expansion with zoledronate (ZOL) (5 µM) and IL-2 (200 IU/mL). (B) Purity of γδT cells by different expansion methods. 32 PBMC samples from 13 healthy donors were tested independently after 10-day expansion by ZOL or anti-γδ TCR Ab supplemented with IL-2. A paired t-test showed a significant difference between ZOL and anti-γδ TCR Ab group, *p<0.05. (C) Cell number, expanded folds and viability of γδT cells after expansion. 98 PBMC samples were tested independently after 10-day expansion with ZOL (5 µM). **p<0.01. (D) Representative scatter plots of the time course of γδT cell expansion. (E) Time course of purity during γδT cell expansion. n=5, **p<0.01. (F) Time course of cell number during γδT cell expansion. n=5, **p<0.01. (G) Effect of age on γδT cell expansion.
These donors were separated into two groups, good expansion group (γδT cell purity ≥50%) and poor expansion group (γδT cell purity <50%), as previously reported.27 Absolute cell number, the fold change of expansion and the viability of expanded γδT cells in the two groups are illustrated in figure 1C. γδT cell expansion fold ranged from 200-fold to 5000-fold in the good expanders and 60-fold to 600-fold in the poor expanders. Purer γδT cells were accompanied by higher absolute γδT cell number and cell viability at day 10 after expansion (figure 1C). A more detailed analysis of γδT cell expansion showed that the difference between good and poor expanders appeared 6 days after expansion (figure 1D,F). Age (figure 1G), gender (online supplemental figure S1D) and HLA type (online supplemental table 1) of the donors were not significantly associated with γδT cell expansion capacity.
Interindividual γδT cell immune phenotypic heterogeneity after expansion
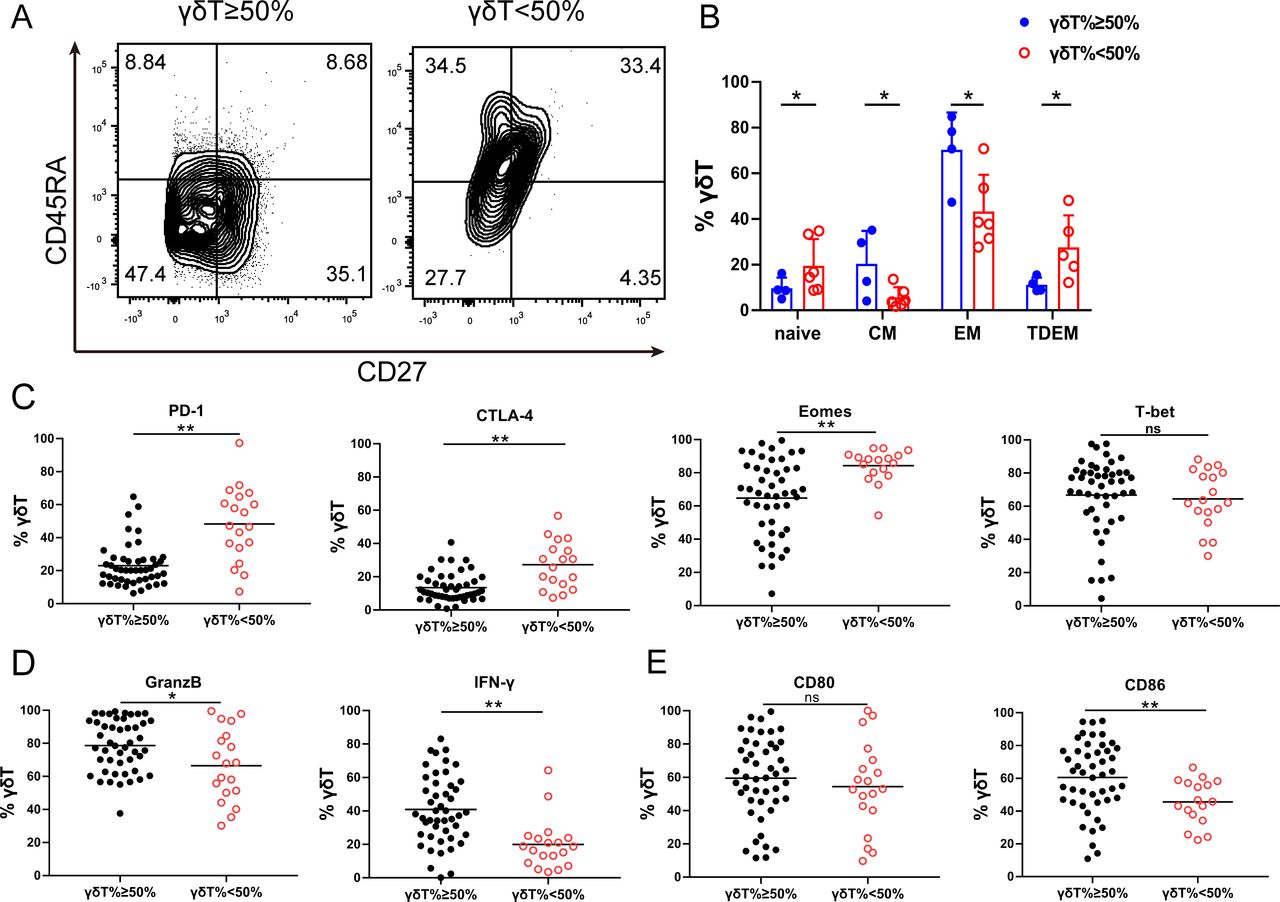
It has been shown that the immune phenotype of γδT cells may predict its function.28 29 To study the phenotypic difference in γδT cell in healthy donors, we examined CD27 and CD45RA expression on γδT cell after 10 days of expansion. These receptors distinguish effector memory (EM, CD45RA−CD27−) cells from naive (N, CD45RA+CD27+), central memory (CM, CD45RA−CD27+) or terminal-differentiated effector memory (TDEM, CD45RA+CD27−) cells (figure 2A). The proportion of the effector memory and central memory γδT cells were significantly higher in the good expanders compared with that in the poor expanders (figure 2B). We then examined the expression of immune checkpoint proteins in the expanded γδT cells (online supplemental figure S2). γδT cells in the good expanders showed significantly lower expression of exhaustion markers, PD-1, CTLA-4 and Eomes (figure 2C), but higher expression of effector cytokine, IFN-γ, Granzyme B (figure 2D) and costimulatory molecule of CD86 (figure 2E), compared with those in the poor expanders. There were no significant changes in T-bet and CD80 expression.
Supplemental material

Interindividual γδT cell immune phenotypic heterogeneity after expansion. (A) Representative CD27/CD45RA contour plots of expanded γδT cells. Effector memory (EM, CD45RA−CD27−), terminal-differentiated effector memory (TDEM, CD45RA+CD27−), naive (N, CD45RA+CD27+) and central memory (CM, CD45RA−CD27+) γδT cells. (B) Expanded γδT cell phenotypic subset distribution. The data are presented as mean±SD. n=6, *p<0.05. (C) Immune checkpoint protein expression in expanded γδT cells. Flow cytometry analysis of PD-1, CTLA4, Eomes and T-bet expression by expanded γδT cells at day 10. n=98, ns, no significant difference; *p<0.05; **p<0.01. (D) Flow cytometry analysis of GranzB and IFN-γ expression by expanded γδT cells at day 10. n=98, *p<0.05; **p<0.01. (E) Flow cytometry analysis of CD80 and CD86 expression by expanded γδ T cells at day 10. n=98, ns, no significant difference; **p<0.01.
Interindividual γδT cells display heterogeneous migratory and cytotoxic effector function after expansion
To study the migratory ability of the expanded γδT cells to tumor cells, we performed the transwell migration assays. Significantly enhanced migration of γδT cells toward A2058, A375 and UACC903 melanoma cells was observed in the good expansion group compared with that in the poor expansion group after 8 hours of incubation (figure 3A). Expanded γδT cells were mixed with tumor cells at the effector:target (E:T) ratio of 5:1. γδT cells in the good expansion group more effectively killed tumor cells than those in the poor expansion group (figure 3B). We further explored the migration and cytotoxic effector function of the expanded γδT cells using 3D melanoma spheroid assays. We examined spheroid integrity by monitoring their spheroid size and γδT cell infiltration by flow cytometry. A2058 and UACC903 melanoma spheroids were co-cultured with γδT cells for 48 hours. Melanoma spheroids had greater γδT cell infiltration and were significantly smaller when cultured with expanded γδT cells from good expanders than those from poor expanders (figure 3C,D). These data suggest that γδT cell expansion capacity is correlated with their anti-tumor capacity.
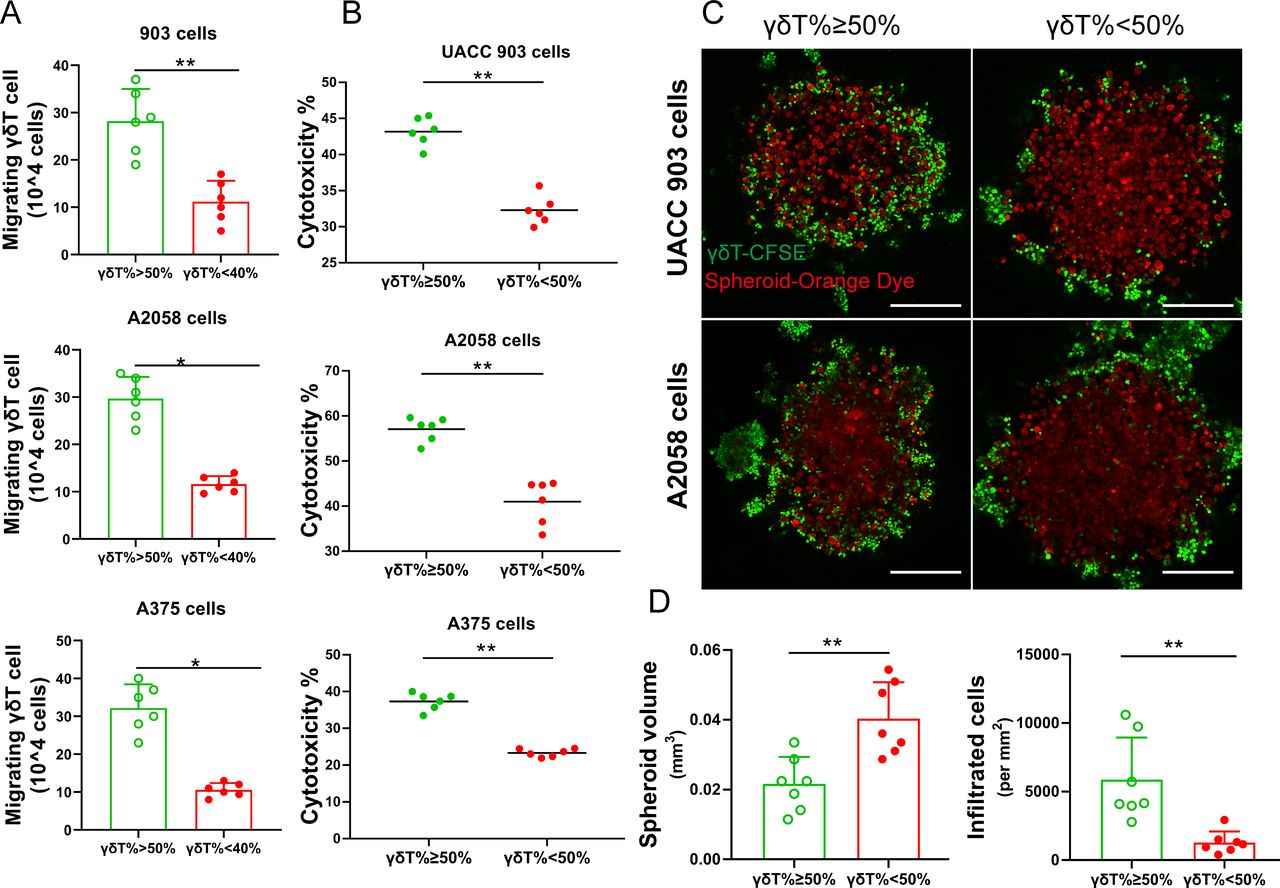
Interindividual functional heterogeneity of γδT cells after expansion. (A) γδT cell migration. Expanded γδT cells were tested in a transwell assay for their ability to migrate toward melanoma cells. n=6. *p<0.05; **p<0.01. (B) Cytotoxic function of γδT cells. Expanded γδT cells were incubated with different melanoma cell lines (A2058, A375 and UACC903). n=6. **p<0.01. (C) Representative immunofluorescence images of tumor spheroid assay. Melanoma tumor spheroids were formed using A2058 or UACC903 cells and then incubated with expanded γδT cells. The tumor cells were stained with CellTracker Orange CMRA Dye (red), and γδT cells were stained with CFSE (green). More γδT cells from good expanders were present in the center of the tumor spheroids and the tumor spheroids were smaller. Scale bar, 250 µm. (D) Statistical analysis of size of tumor spheroids and number of infiltrated γδT cells in spheroids. n=7. **p<0.01.
Basal γδT cell levels in PBMC predict their expansion capacity
We measured the basal levels of γδT cells in PBMC in 66 samples from 31 donors using flow cytometry (figure 4A). There was a significant correlation between basal Vδ2 T cells and γδT expansion capacity (figure 4B). Better expanders had a significantly higher basal Vδ2 T cells in the PBMCs (figure 4C). Using logistic regression and LASSO models, we calculated a baseline Vδ2 T cell cut-off of 0.82% to separate good expanders from poor expanders (figure 4D,E).

Initial Vδ2 T cell levels in PBMC predict their expansion capacity. (A) Circulating γδT cells. Initial percentage of Vδ2 T cells in 66 PBMC samples from 31 healthy donors was measured. (B) Pearson correlation of the initial percentage of Vδ2T cells in PBMC with purity of γδT cells after expansion. n=66, **p<0.01. (C) Initial γδT cell proportion in good or poor expanders. n=66, **p<0.01. (D) Representative scatter plots of the percentage of initial Vδ2 T cell and corresponding expanded Vδ2 T cells. (E) Correlation of the initial Vδ2 T cell percentage and corresponding expanded Vδ2 T cells. Each line connects the results for an individual donor. *p<0.05.
γδT cell–intrinsic characters determine their expansion capacity
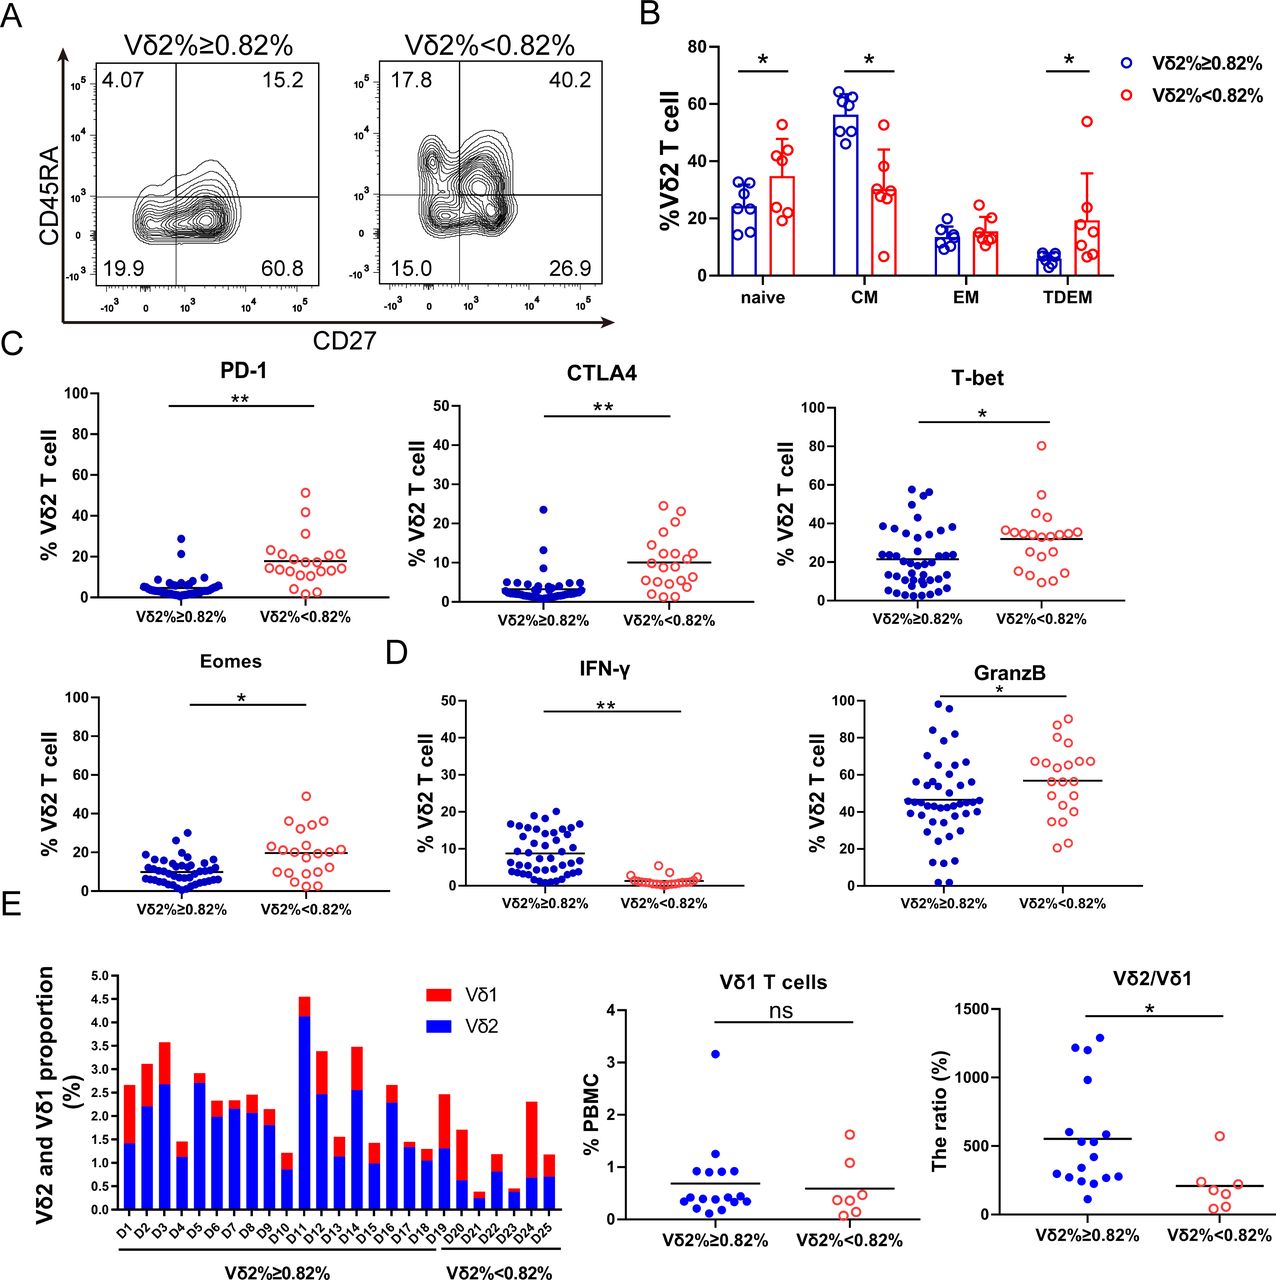
We then studied whether immune phenotypes of basal γδT cells in PBMC correlate with their expansion capacity. The results demonstrated more central memory (CD27+CD45RA−) and fewer terminally differentiated γδT cells (CD27−CD45RA+) in the Vδ2 T cells ≥0.82% group than those in the <0.82% group (figure 5A,B). Central memory cells have better proliferation capacity, while terminally differentiated cells display immediate effector functions with poorer proliferation capacity.13 In addition, PD-1, CTLA-4, Eomes and T-bet levels were significantly higher in the Vδ2 T cells <0.82% group than those in the ≥0.82% group (figure 5C). Vδ2 T cells with high PD-1 and CTLA-4 expression suppressed Vδ2 T cell proliferative responses and cytotoxic potential.30 Interestingly, γδT cells expressed less IFN-γ but more Granzyme B in the <0.82% group (figure 5D). Moreover, the activation marker CD69 and the cytotoxicity markers NKG2D and CD107a were also significantly higher in the <0.82% group. Inversely, the proliferation marker Ki67 was significantly lower in the <0.82% group, while other activation markers such as CD80, CD86 and CD277 showed no significant difference (online supplemental figure S3). Altogether, the γδT cells in the <0.82% group express markers of exhaustion and cytotoxicity, while those in the ≥0.82% group show memory-like phenotypes.
Supplemental material

γδT cell–intrinsic characters determine their expansion capacity. (A) Representative contour plots of the circulating Vδ2 T cell phenotypic subsets. (B) Circulating Vδ2 T cell phenotypic subset distribution. Effector memory (EM, CD45RA−CD27−), terminal-differentiated effector memory (TDEM, CD45RA+CD27−), naive (N, CD45RA+CD27+) and central memory (CM, CD45RA−CD27+) γδT cells. The data are presented as mean±SD. n=7, *p<0.05. (C) Immune checkpoint protein expression in circulating γδT cells. Flow cytometry analysis of PD-1, CTLA4, Eomes and T-bet expression in the circulating γδT. n=66, *p<0.05; **p<0.01. (D) GranzB and IFN-γ expression in the circulating γδT cells. n=66, *p<0.05; **p<0.01. (E) Proportion of Vδ2 T and Vδ1 T cells in circulation from 25 healthy individuals (D: Donor). Vδ1 T cells and the ratio of Vδ2:Vδ1 T cells are presented. ns, no significant difference; *p<0.05.
To study whether other cell components in PBMC impacted γδT cell expansion, we examined other immune cells in PBMC from 25 healthy individuals. In the good expansion group, we found that Vδ2 T cells comprised a larger percentage of all γδT cells. The Vδ1 T cells in different individuals varied but no significant difference was found in these two groups; however, the ratio of Vδ2:Vδ1 T cells was significantly different in these two groups (figure 5E). We measured CD3+, CD4+, CD14+, CD19+ and CD11b+ cell population in the PBMC (online supplemental figure S4A). CD4+ cell proportion in the ≥0.82% group was higher. However, CD3+, CD14+, CD11b+ and CD19+ cells showed no significant difference in these two groups (online supplemental figure S4B–D).
Supplemental material
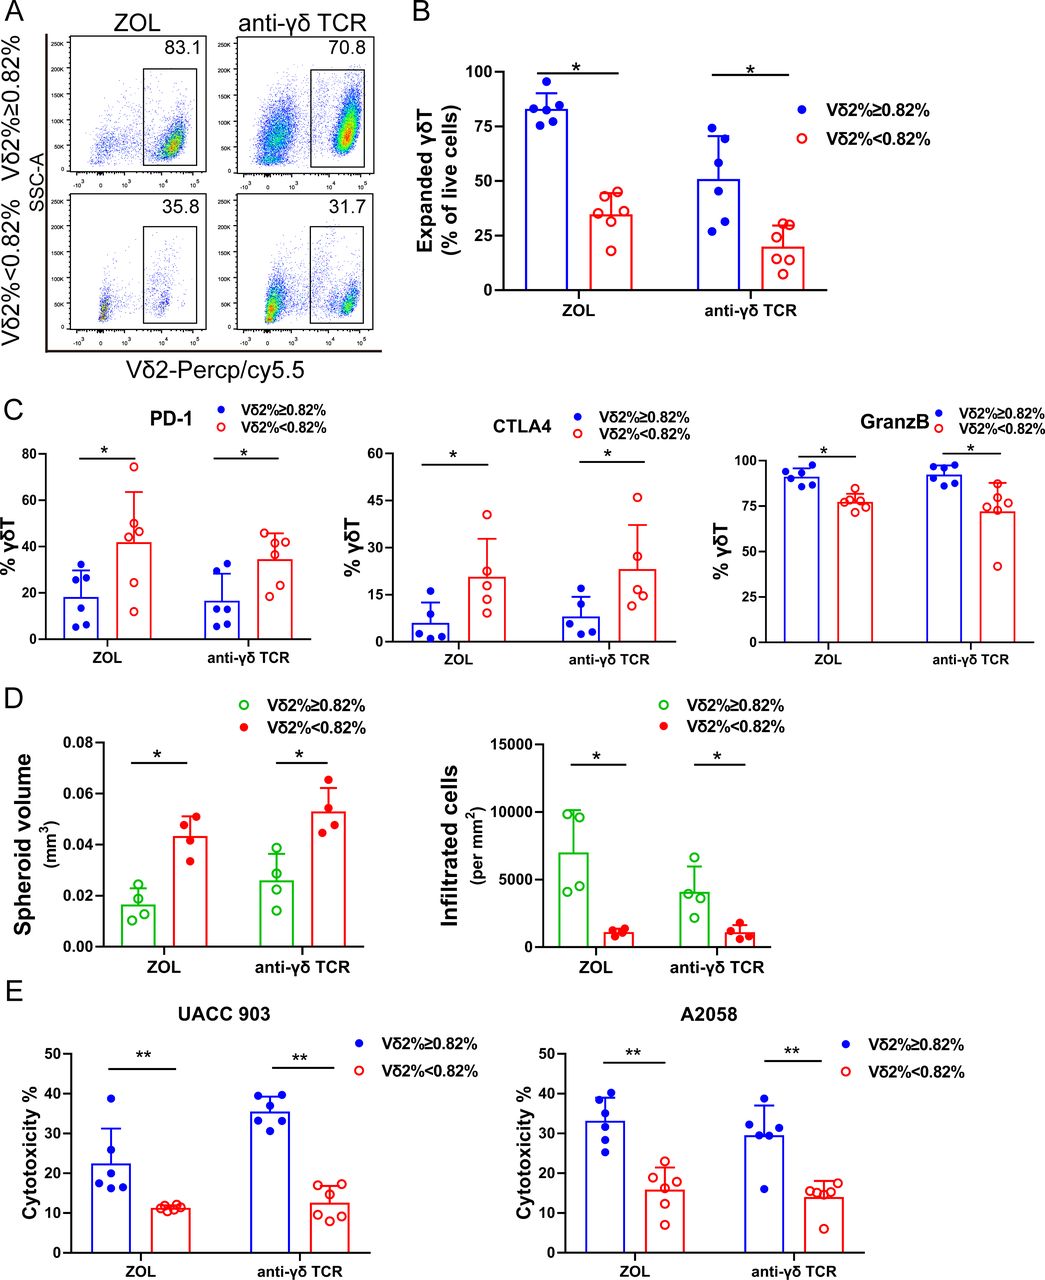
To study whether different culture methods influenced γδT cell expansion, we used ZOL or anti-γδ TCR antibody to expanded γδT cells from PBMC (n=6). Our data demonstrated that ZOL induced better expansion of γδT cells than anti-γδ TCR antibody. Nevertheless, similar to ZOL-induced γδT cell expansion, anti-γδ TCR antibody induced significantly better γδT cell expansion in the basal Vδ2 T cells ≥0.82% group than that in the <0.82% group (figure 6A,B). We also measured immune checkpoint protein expression on the anti-γδ TCR antibody-expanded γδT cells, and found that the Vδ2 T cells in the ≥0.82% group expressed lower PD-1 and CTLA-4 and higher Granzyme B than those in the <0.82% group (figure 6C), consistent with ZOL-expanded cells. The cytotoxicity of tumor spheroid assays in UACC903 and A2058 melanoma cells showed comparable results, regardless of whether ZOL or anti-γδ TCR antibody expansion was used (figure 6D,E and online supplemental figure S5). These data suggest that interindividual γδT expansion capacity is not related to expansion methods.
Supplemental material

γδT cell expansion capacity is independent of expansion methods. (A) Representative scatter plots of γδT cells expanded by zoledronate (ZOL or anti-γδ TCR antibody. (B) Purity of γδT cells from good and poor expanders expanded by ZOL or anti-γδ TCR antibody. n=6, *p<0.05. (C) Immune checkpoint protein and Granzyme B expression in γδT cells expanded by ZOL or anti-γδ TCR antibody. PD-1, CTLA-4 and GranzB expression in γδT cells from good and poor expanders expanded by ZOL or anti-γδ TCR antibody for day 10. n=6, *p<0.05, **p<0.01. (D) Melanoma spheroid assays with γδT expanded by ZOL or anti-γδ TCR antibody. Melanoma tumor spheroids were formed using UACC903 cells and then incubated with expanded γδT cells using ZOL or anti-γδ TCR antibody, respectively. More γδT cells from good expanders were present in the center of the tumor spheroids and the tumor spheroids were smaller. Melanoma sphere size and number of infiltrated γδT cells in spheroids was analyzed. n=6. *p<0.05. (E) Cytotoxicity of expanded γδT cells using ZOL or anti-γδ TCR antibody against A2058 cells and UACC903 cells. n=6, **p<0.01.
Anti-PD-1 or anti-CTLA-4 antibodies cannot rescue γδT cell expansion
Since PD-1 and CTLA-4 proteins are highly expressed in the γδT cells in the poor expanders, we tried to rescue these cells by adding anti-PD-1 (50 µg/mL) or anti-CTLA-4 (50 µg/mL) antibody in the culture medium during the expansion period. We examined γδT cell number, cell purity, CD107a, Granzyme B and IFN-γ expression in the γδT cells after expansion. However, we did not see any increase of γδT cell expansion nor improved cytokine expression after the treatment (online supplemental figure S6).
Supplemental material
Logistic regression models predict γδT cell expansion capacity: Vδ2 Index Score
To predict expansion capacity of γδT cells ex vivo, we developed two logistic regression models. The first predictive model is based solely on the Baseline γδT cell concentration in PMBC, from which each individual sample has a score calculated as:
Vδ2 Index Score=−8.23+10.25×Initial_γδT%
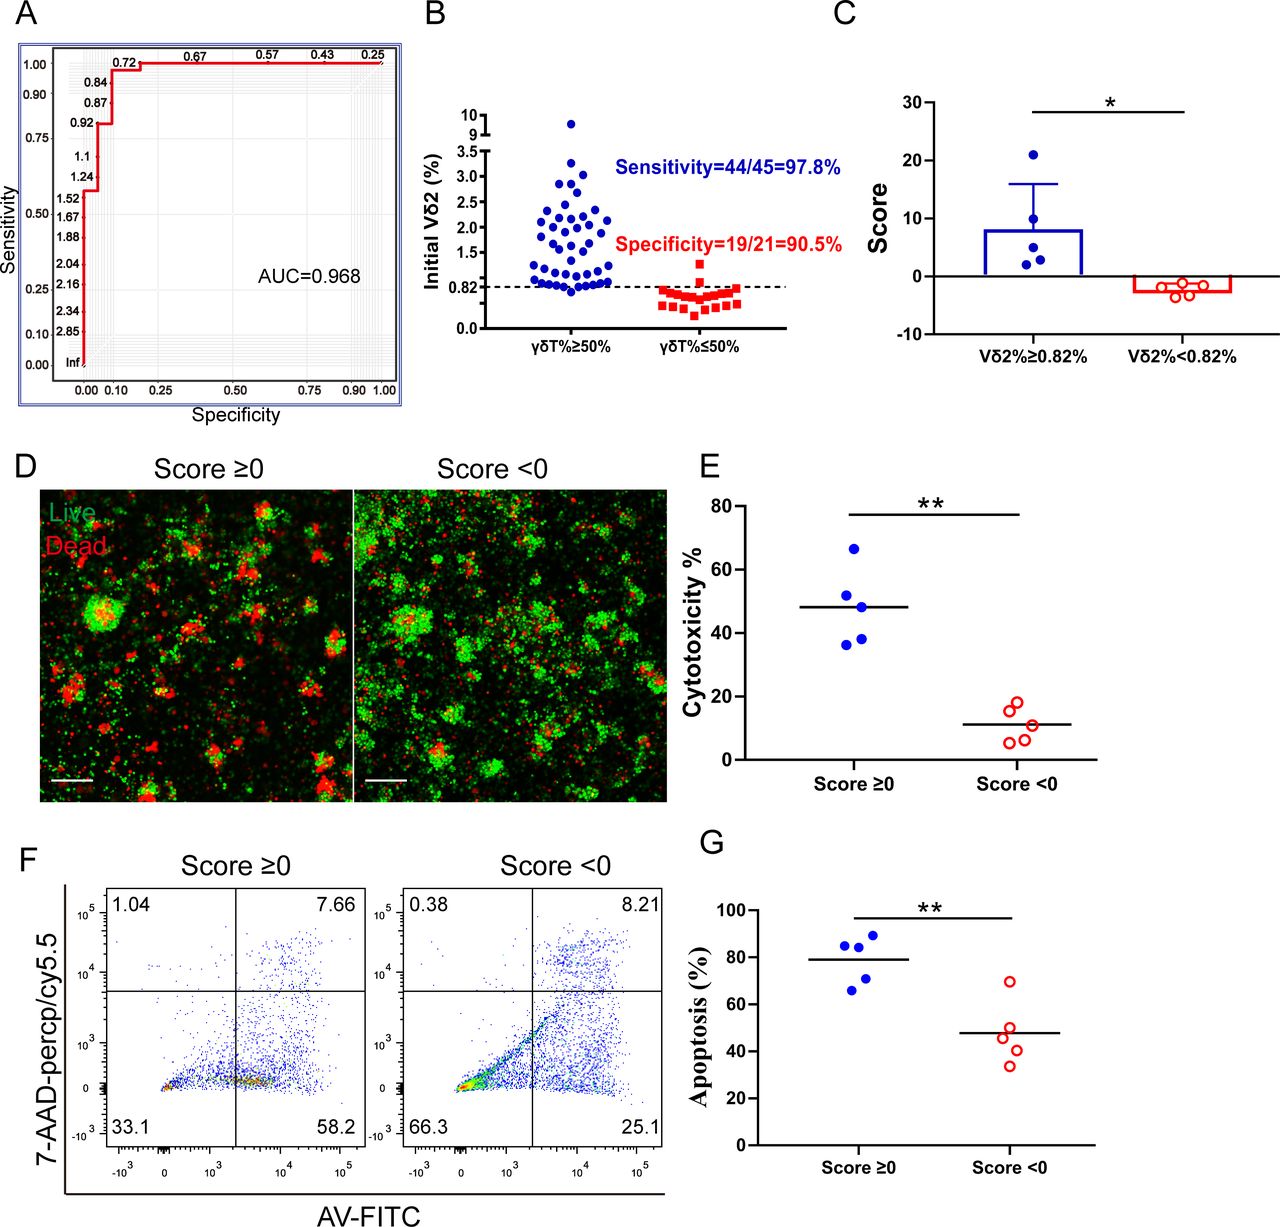
Using this model, a sensitivity of 97.78% and specificity of 90.48% is reached at cut point of 0.82% of the initial γδT%, with area under the curve (AUC)=0.968 (figure 7A,B). In the second comprehensive predictive model, we included the initial γδT cell level and surface marker expression of γδT cells. Each individual sample has a score from the established logistic regression model:

γδT cell prediction models and verification in patient derived melanoma organoids. (A) Logistic regression analysis of proportion of circulating Vδ2 cells in individuals is to determine the optimal cut-off value of 0.82% for γδT cell expansion with area under the curve (AUC)=0.968. (B) Plot showing that the cut-off point of 0.82% had significant difference with sensitivity of 97.8% and specificity of 90.5%. (C) Vδ2 Index Score. The score was calculated in the based on Vδ2 cell concentration in the PBMC. *p<0.05. (D) Representative live/dead staining image of organoids co-cultured with expanded γδ T cells from donors whose Vδ2 Index Score ≥0 or <0. Scale bar, 100 µm. (E) Cytotoxicity of expanded γδT cells co-cultured with organoids and the expanded γδT cells from donors whose Vδ2 Index Score ≥0 or <0. **p<0.01. (F) Representative flow charts show apoptotic cells after co-culturing organoids with expanded γδ T cells. (G) Statistical analysis of the apoptotic cells (contained early apoptotic and late apoptotic) in organoids after culturing with γδ T cells. n=5, **p<0.01.
The probability P that an individual’s γδT cells can be expanded ≥50% was calculated as

The optimal sensitivity of 95.56% and specificity of 95.24% is reached at cut point 0.74 of the Score, corresponding to P=0.678, with AUC=0.989 (online supplemental figure S7A). There is no significant difference of AUC between these two models (Delong’s test p value=0.3047).
Supplemental material
Confirmation of interindividual γδT cell functions using patient-derived melanoma organoids
Patient-derived cancer organoids retain the heterogeneity of original tumors and provide an opportunity for in vitro testing of human γδT cell therapy since good in vivo models are not available. To study whether our findings may predict effects of γδT cells on patient-derived melanoma organoids, we screened PBMC samples and used the 10 most recent samples. Vδ2 Index Score and Comprehensive Vδ2 Index Score were calculated and shown in figure 7C and online supplemental figure S7B, respectively. Fresh human melanoma tissues were obtained and processed to establish patient-derived melanoma organoids as previously described.31 Melanoma organoids grew well over time and few cells were positive for propidium iodide (PI, dead cells, red fluorescence) staining, which stains dead cells. Following γδT cell expansion, we co-cultured the expanded γδT with the organoids for 24 hours, and then cells were stained with acridine orange (AO; live cells, green) and PI (dead cells, red). Vδ2 Index Score ≥0 group exhibited significantly more cell death than the Vδ2 Index Score <0 group (figure 7D). The cytotoxicity assay showed similar results (figure 7E). FACS analysis of Annexin V (AV) and 7-amino actinomycin D (7-AAD) stained cells showed a greater number of apoptotic cells in the Vδ2 Index Score ≥0 group than that in the Vδ2 Index Score <0 group (figure 7F,G). These data support that the Vδ2 Index Score may be used to predict γδT anti-tumor function.
Discussion
Adoptive immunotherapy with Vδ2 T cells has been used in a variety of cancer treatments without severe toxicities,21 32 but the treatment outcomes were mixed,18 33 34 and clinical benefit rate was approximately 40%.35 γδT cells from patients face obstacles, such as exhaustion and immunosuppression, induced by the tumor microenvironment. Thus, researchers and companies have studied allogeneic γδT cell therapy in order to bypass these obstacles.36 However, the therapeutic efficacy of γδT cells derived from healthy individuals is still unsatisfactory.32 37 One of the underlying factors that determine the observed clinical responses in patients may be the interindividual heterogeneity in γδT cell levels.23 Indeed, our studies confirm that there is significant γδT cell interindividual heterogeneity in healthy donors and that basal γδT cell levels in the blood may be used to stratify their antitumor function. Our findings make it possible to screen and select healthy donors for γδT cell–based therapies, which may be crucial to fully realize the therapeutic potential of γδT cells.
It has been shown that the purity and absolute cell number of γδT cells are important for adoptive cell therapy.16 Our study shows similar results and finds that poorly expanded γδT cells demonstrate exhausted T-cell phenotypes with significantly elevated expression of PD-1, CTLA-4, Eomes and T-bet. These cells demonstrated inferior migratory and cytolytic activity to tumor cells in 2D culture and 3D spheroid assays. We discover that basal γδT levels and their immune phenotypes correlate with their expansion and cytotoxic effector potentials. High percentage of circulating γδT cells with effector memory type and central memory phenotype may predict better expansion and cytotoxic effector function, independent of expansion methods, age, gender or HLA type. Furthermore, circulating γδT cells in the good expansion group show significantly lower expression of exhaustion markers, PD-1, CTLA-4 and Eomes, and higher expression of IFN-γ and Granzyme B as well as costimulatory molecule of CD86 compared with those in the poor expansion group. It is unknown why circulating γδT cells in some healthy donors express higher levels of checkpoint proteins. This may be determined genetically or related to donors’ underlying medical conditions. Nevertheless, our results support that expression of higher levels of checkpoint proteins reflects impairment of γδT cell function. It is interesting that this defect cannot be overcome by addition of anti-PD-1 or anti-CTLA-4 antibody in the culture medium.
In our study, we found that basal Vδ2 T cells with a larger proportion of central memory and effector memory types expand better. Similar to the results seen in adoptive αβT cell transfer, a balanced distribution in Vδ2 T cell phenotype between central and effector memory vesus terminally differentiated effector Vδ2 T cells may ensure both immediate effector functions, while maintaining proliferative potential to improve long-term protection.27 38 Increased effector memory γδT cells are reported to correlate with objective clinical outcomes in patients treated with ZOL and IL-2.39 In contrast, the terminally differentiated effector Vδ2 T cells lose the proliferative potential and might tend to be functionally exhausted.40 Our data suggest that circulating γδT cells in healthy donors have intrinsic characters that impact their response to proliferation stimuli.
It has been shown that interindividual γδT cell phenotypic heterogeneity develops after birth without correlation with gender, age, country of birth or chronic stimulation in vivo,23 and that γδT cell concentrations in the PBMC were constant over time.41 Our results are consistent with these findings. Furthermore, we show that γδT cell expansion capacity is independent of HLA type and expansion methods. Importantly, we discover that the basal Vδ2 levels in PBMC correlate well with γδT cell purity after expansion, expansion ratio and absolute cell number. We develop a mathematical model to calculate a Vδ2 Index Score based on basal Vδ2 cell concentration in PBMC. Using Vδ2 Index Score of ≥0, it has a sensitivity of 97.78% and specificity of 90.48% with AUC of 0.968 to determine whether γδT cell can expand well in a healthy donor. By combining the initial Vδ2 cell concentration, exhaustion markers such as PD-1, CTLA4, Eomes and T-bet, activation markers such as IFN-γ and Granzyme B, and other costimulatory molecules such as CD80 and CD86 on the γδT cells, we develop a comprehensive Vδ2 Index Score with a sensitivity of 95.56% and a specificity of 95.24% with AUC of 0.989. Surprisingly, addition of other immune markers does not significantly further enhance the sensitivity and specificity of the initial Vδ2 Index Score. The utility of this Vδ2 Index Score was tested in patient-derived melanoma organoids. Since γδT cell function is independent of MHC recognition, patient-derived melanoma organoids are well suited to test anti-tumor functions of γδT cells ex vivo. γδT cells with a Vδ2 Index Score ≥0 have significantly better anti-tumor function than those with Vδ2 Index Score <0.
In summary, our study demonstrates that higher basal level of circulating γδT cells predicts better expansion and functions (online supplemental figure S7C). Checkpoint protein expression on γδT cells correlates with their function and may be used as a quality control method before γδT cell infusion in adoptive immunotherapy. Our findings can be used to stratify healthy donors for γδT cell–based therapy and potentially enhance the efficacy of this promising treatment modality.
Materials and methods
Isolation of PBMCs
Peripheral blood samples were collected from apheresis circuit of 43 healthy blood donors (23 men, 20 women, age range 21–55 years) through Human Immunology Core at the University of Pennsylvania with informed consent and IRB approval (protocol number 707906).
Expansion of γδT cells ex vivo
PBMCs were plated at 2×10⁶ cells per well in 24-well flat-bottomed plates at 37℃ in a humidified atmosphere of 5% CO2. The standard culture medium contains RPMI 1640 (Gibco), containing 10% FBS (Gibco), 2 mM L-glutamine (Gibco), 100 U/mL penicillin (Gibco), streptomycin (Gibco) and 200 IU/mL IL-2 (PeproTech, Rocky Hill, NJ).42 Zoledronic acid (5 µM; Sigma-Aldrich, St. Louis, MO, USA) was added into the culture medium at the first day and refreshed with medium containing IL-2 every 2 days. In some cases, 24-well plates were pre-coated with 0.5 µg/mL anti-γδ TCR Ab (Immunotech; Beckman Coulter, Fullerton, CA) and then PBMCs were added to the anti-γδ TCR Ab-coated wells and cultured in the standard culture medium mentioned previously. The viability and cell number of γδT cells were evaluated by the trypan blue staining assay, and the percentage of γδT cells counted by flow cytometry.23
Antibodies and flow cytometry analyses
Fluorochrome-conjugated antibodies were from eBioscience or BioLegend: CD3 (OKT3), CD4 (OKT4), CD14 (63D3), CD11b (ICRF44), CD19 (HIB19), CD27 (LG.3A10), CD45RA (HI100), CD107a (H4A3), TCR γ/δ (B1), Vδ2 (B6), Vδ1 (TS8.2), Granzyme B (QA16A02), IFN-γ (B27), PD-1 (EH12.1), CTLA4 (BNI3), T-bet (4B10), Eomes (WD1928), CD80 (2D10) and CD86 (IT2.2). For surface markers, expanded Vγ9Vδ2 T cells or PBMCs were stained with diluted fluorochrome-conjugated antibodies on ice and washed with FACS buffer; and for intracellular biomarkers, cells were permeabilized and stained with antibodies diluted in permeabilization buffer (BioLegend, San Diego, CA). Samples were acquired using a LSR-A flow cytometer (BD Biosciences, Baltimore, MD) and analyzed using FlowJo software (Tree Star, Ashland, OR).
Cytotoxicity assays
The CytoTox 96 Non-Radioactive Cytotoxicity Assay (Promega, Madison, WI) was applied to measure the cytotoxicity of expanded Vγ9Vδ2 T cells. In this respect, A375 (2×10⁴ cells/well), A2058 (2×10⁴ cells/well) and 903 (2×10⁴ cells/well) melanoma cells were used as target cells and seeded into a 96-round well plate, and expanded Vγ9Vδ2 T cells (1×10⁵ cells/well) that served as effector cells were directly added to individual wells and incubated overnight. The supernatants were collected and the lactate dehydrogenase activity was detected. Controls for spontaneous lactate dehydrogenase release from effector and target cells, the target maximum release, as well as the culture medium background were measured simultaneously.13
Chemotaxis assays
Chemotaxis assays of expanded Vγ9Vδ2 T cells were performed using 24-well transwell plates with 5 µm pore polycarbonate membrane inserts (Costar; Corning, NY). Briefly, expanded Vγ9Vδ2 T cells (2×10⁵ cells/well) suspended in 200 µl RPMI 1640 containing 0.5% FBS were placed in the upper chamber, and RPMI 1640 (600 µl) containing 10% FBS was added to the lower chamber of the transwell. The cells that migrated into the lower chambers and those left in the upper chambers were collected and counted separately after 8-hour incubation at 37℃, 5% CO2.
3D Spheroid assays
The 96-well plate was pre-coated with 50 µL 1.5% agarose (LONZA, Rockland, ME). Melanoma cells (A2058 and UACC 903 cells) were labeled with CellTracker Orange CMRA Dye (Thermo Fisher Scientific, Waltham, MA) and seeded at 2×10⁴ cells/well and allowed to form spheroids over 48 hours. Before starting the co-culture, PBMCs were stained with CFSE (Thermo Fisher Scientific) according to manufacturer procedure. Infiltrated spheroids were analyzed at 48 hours using a confocal microscope (Leica, Wetzlar, Germany). Spheroids were divided into single cells and CFSE+ cells infiltrating the spheroids were counted by flow cytometry.
Patient-derived melanoma organoid assays
Human melanoma samples were received from the Hospital of the University of Pennsylvania. Fresh tumor specimens were washed with PBS (containing 2% penicillin/streptomycin (P/S)) and minced into pieces of 1 mm. Fragments were enzymatically digested in DMEM (4.5 mmol/L glucose, 2% FBS, 100 U/mL collagenase type IV (200 U/mL); Sigma-Aldrich) and DNase I (50 U/mL; Sigma-Aldrich) for 20 min at 37℃. Samples were diluted in 25 mL media and pelleted, and resuspended in fresh DMEM and filtered over 100 µm strainers. Red blood cells were removed using RBC lysis buffer (Biolegend). Matrigel (Corning) and complete DMEM/F12 medium were mixed at 1:2 ratio and pre-seeded on 24-well plates to solidification. The cell mixture was seeded on the Matrigel layer and cultured for up to 10 days, and the medium was changed every 3 days. The culture medium was ADMEM/F12 composed of 1% P/S, 50% Wnt3a, RSPO1, Noggin-conditioned media (L-WRN, ATCC), nicotinamide (10 mM; Sigma), N-acetylcysteine (1 mM; Sigma), B-27 without vitamin A (1×; Invitrogen), A83-01 (0.5 mM; Tocris), EGF (50 ng/mL; Invitrogen), FGF (50 ng/mL; Peprotech) and Forskolin (10 ng/mL; Tocris).
Live/dead staining dual labeling was performed using ViaStain AOPI Staining Solution (Nexcelom, CS2-0106) following γδT cells co-cultured with organoids for 48 hours. The images were captured on Zeiss LSM 710 (Carl Zeiss, Thornwood, NY) after cell incubation with the dyes for 20 min at room temperature in the dark. Images were then analyzed using ZEN software.
Apoptosis of cells in the organoids was measured after γδT cell and organoid co-culture for 48 hours. Organoids were washed with cold PBS to remove the Matrigel and dissociated to single cells by trypsin (Gibco). Cells were washed twice with cold PBS and resuspended in 100 µL Annexin V Binding Buffer (FITC Annexin V Apoptosis Detection Kit; Biolegend). Then 5 µL of AV-FITC and 5 µL of 7-AAD solution were added and incubated for 15 min at room temperature in the dark. FACS was performed to measure AV and 7-AAD, yielding AV+/7-AAD− early apoptotic cells and AV+/7-AAD+late apoptotic/necrotic cells.
The cytotoxicity assays of γδT cells against organoids were also performed by the CytoTox 96 Non-Radioactive Cytotoxicity Assay. The lactate dehydrogenase activity released by organoids was detected and analyzed.
Statistics
Data are analyzed by Prism V.8.0 (GraphPad Software, San Diego, CA) and R software. The significant differences between two groups were analyzed by Mann-Whitney U non-parametric test for unpaired samples and several groups were assessed by one-way ANOVA with multiple comparisons. Correlation analyses were performed with the non-parametric Spearman rank order test. P values <0.05 were considered significant difference (*p<0.05; **p<0.01). Logistic regression models were applied to explore if initial γδT cell proportion, each surface marker expression of γδT cell or their combination would be useful to predict whether γδT cells can be well expanded ≥50% in an individual blood sample. Receiver operating characteristic (ROC) curves were generated based on the value of initial γδT cell proportion or index obtained from multivariate models. AUC of each model’s ROC with the optimal sensitivity and specificity were calculated. Delong’s test was applied to determine the difference on AUC between regression models. A total of 66 samples have complete data. Due to such small sample size, complex multivariate predictive models were not considered for the data analysis.
Data availability statement
All data relevant to the study are included in the article or uploaded as online supplemental information.
Ethics statements
Ethics approval
This study was approved by the Institution Review Board at the University of Pennsylvania.
References
Supplementary materials
Supplementary Data
This web only file has been produced by the BMJ Publishing Group from an electronic file supplied by the author(s) and has not been edited for content.
Footnotes
Contributors XX, LO, QL and XY designed the experiments and interpreted the data. LO and HW conducted experiments. XX, LO, HW, JZ, HL, LL, CS, SL, LD, YG, LH, JZ, YF and WG discussed the subject and experiments. LO performed flow cytometry and in vitro cytotoxicity assays and analysis. XX and LO selected the representative figures for publication. AH, GK, LS, RA and CZ were involved in patient tumor collection. XX and LO wrote the manuscript and every author reviewed the manuscript.
Funding The research was funded by the NIH grants CA224070, CA217489, CA210944 and CA170340.
Competing interests X.Xu, L.O., and H.W. are listed as inventors on a patent owned by the University of Pennsylvania related to this work.
Provenance and peer review Not commissioned; externally peer reviewed.
Supplemental material This content has been supplied by the author(s). It has not been vetted by BMJ Publishing Group Limited (BMJ) and may not have been peer-reviewed. Any opinions or recommendations discussed are solely those of the author(s) and are not endorsed by BMJ. BMJ disclaims all liability and responsibility arising from any reliance placed on the content. Where the content includes any translated material, BMJ does not warrant the accuracy and reliability of the translations (including but not limited to local regulations, clinical guidelines, terminology, drug names and drug dosages), and is not responsible for any error and/or omissions arising from translation and adaptation or otherwise.