Article Text

Abstract
Background The temporal response to checkpoint blockade (CB) is incompletely understood. Here, we profiled the tumor infiltrating lymphocyte (TIL) landscape in response to combination checkpoint blockade at two distinct timepoints of solid tumor growth.
Methods C57BL/6 mice bearing subcutaneous MC38 tumors were treated with anti-PD-1 and/or anti-CTLA-4 antibodies. At 11 or 21 days, TIL phenotype and effector function were analyzed in excised tumor digests using high parameter flow cytometry. The contributions of major TIL populations toward overall response were then assessed using ex vivo cytotoxicity and in vivo tumor growth assays.
Results The distribution and effector function among 37 distinct TIL populations shifted dramatically between early and late MC38 growth. At 11 days, the immune response was dominated by Tumor necrosis factor alpha (TNFα)-producing NKT, representing over half of all TIL. These were accompanied by modest frequencies of natural killer (NK), CD4+, or CD8+ T cells, producing low levels of IFN-γ. At 21 days, NKT populations were reduced to a combined 20% of TIL, giving way to increased NK, CD4+, and CD8+ T cells, with increased IFN-γ production. Treatment with CB accelerated this switch. At day 11, CB reduced NKT to less than 20% of all TIL, downregulated TNFα across NKT and CD4+ T cell populations, increased CD4+ and CD8+ TIL frequencies, and significantly upregulated IFN-γ production. Degranulation was largely associated with NK and NKT TIL. Blockade of H-2kb and/or CD1d during ex vivo cytotoxicity assays revealed NKT has limited direct cytotoxicity against parent MC38. However, forced CD1d overexpression in MC38 cells significantly diminished tumor growth, suggesting NKT TIL exerts indirect control over MC38 growth.
Conclusions Despite an indirect benefit of early NKT activity, CB accelerates a switch from TNFα, NKT-driven immune response toward an IFN-γ driven CD4+/CD8+ T cell response in MC38 tumors. These results uncover a novel NKT/T cell switch that may be a key feature of CB response in CD1d+ tumors.
- natural killer T-cells
- lymphocytes
- tumor-infiltrating
- programmed cell death 1 receptor
- CTLA-4 antigen
- T-lymphocytes
Data availability statement
Data are available on reasonable request.
This is an open access article distributed in accordance with the Creative Commons Attribution Non Commercial (CC BY-NC 4.0) license, which permits others to distribute, remix, adapt, build upon this work non-commercially, and license their derivative works on different terms, provided the original work is properly cited, appropriate credit is given, any changes made indicated, and the use is non-commercial. See http://creativecommons.org/licenses/by-nc/4.0/.
Statistics from Altmetric.com
- natural killer T-cells
- lymphocytes
- tumor-infiltrating
- programmed cell death 1 receptor
- CTLA-4 antigen
- T-lymphocytes
Introduction
The immune response against a developing tumor is complex and dynamic, involving a myriad of immune cell types that evolve over time.1–3 Fostering this endogenous response is the primary objective for many immunotherapies, including checkpoint blockade (CB), which results in remarkable and durable responses in a subset of patients across many indications.4 5 The first generation of CB agents have focused on the interruption of the PD-1/PD-L1 or PD-L2 axes or on blocking CTLA-4. Many of these agents are now Food and Drug Administration (FDA) approved, represent frontline therapies and have greatly improved clinical outcomes for several malignancies. This includes metastatic melanoma,6 7 Hodgkin’s lymphoma,8 and Merkel cell carcinoma,9 and others10 for single-agent nivolumab or pembrolizumab, and metastatic melanoma11 12 for single-agent ipilumumab or tremelimumab. Combination treatment with both anti-CTLA-4 and anti-PD-1 CB is even more efficacious, improving overall response rates and survival in metastatic melanoma.6 Despite this resounding success, our understanding of which immune populations respond to CB, and when they respond, lags behind our use of these life-saving agents. Many effector lymphocytes upregulate checkpoint receptors following activation-associated queues and are thus susceptible to suppression via checkpoint ligands.13–19 For PD-1, this upregulation occurs in response to TCR engagement, common gamma chain cytokines, or through activation-associated transcription factors FOXO1 and NFAT,20–23 whereas CTLA-4, constitutively present in intracellular pools, traffics to the cell surface following TCR engagement through a handful of complex mechanisms.24
Despite the broad range of effector or cytotoxic lymphocyte populations able to express PD-1 or CTLA-4, expansion of exhausted CD8+ T cells by anti-PD-1 treatment and the induction of TH1 CD4+ T cells by anti-CTLA-4 treatment were recently identified as the major CB-responding lymphocyte populations infiltrating murine and human solid tumors.25 This work, while groundbreaking, focused on fully established human tumors, or large, endpoint, murine tumors and did not report CB response in early tumor growth. Yet, there is precedent that CB response may occur in different sets of tumor infiltrating lymphocytes (TILs) as the tumor develops.26 This is likely concomitant with phenotypic changes associated with the now widely accepted model of immunoediting.27 28 In addition, the makeup of unconventional T cell populations, such as γδT cells and natural killer T cells (NKTs), along with innate effector cells such as natural killer cells (NKs), changes over the course of tumor growth.26 Importantly, these populations are also susceptible to CB in ways similar to conventional αβT cells,29–31 but how CB response changes over time has not been well characterized in these populations.
Here, we endeavor to expand our understanding of CB response among effector TIL by comparing CB-responding populations at both early and late time points of subcutaneous murine MC38 colon carcinoma. This analysis was conducted using a high-parameter flow cytometry assay focusing on the subphenotyping of lymphocytes with known cytotoxic or effector capability such as T cells, γδT cells, NK cells, and NKT cells along with markers of effector response. Our results corroborate previous findings that the expansion of specific subsets of CD4+ helper T cells (TH) cells and CD8+ cytotoxic T cells (TC) are among the major CB-responding elements in large well-established tumors and also identify a profound switch from a TNFα-driven NKT response early in tumor growth to an IFN-γ driven response in later tumor growth that is accelerated by CB. These findings reveal that the effects of CB are highly dynamic and time dependent, an important concept to consider as CB use broadens in the clinic and comes under consideration as an earlier intervention in cancer treatment.
Methods
Mice
Female C57BL/6 mice (6–8 weeks old) and NOD.Cg-Prkdcscid Il2rgtm1Wjl/SzJ (NSG) mice were obtained from The Jackson Laboratory (Bar Harbor, Maine, USA). Mice were housed in filter-topped cages with sterilized food and water and autoclaved corncob bedding changed at least once a week at the Animal Research Facility of the H. Lee Moffitt Cancer Center. Mice were humanely euthanized by CO2 inhalation, followed by cervical dislocation according to the American Veterinary Medical Association Guidelines. Mice were observed daily and humanely euthanized if a solitary tumor exceeded 200 mm in diameter or mice showed signs referable to metastatic cancer. All efforts were made to minimize suffering. These studies were carried out in strict accordance with the recommendations in the Guide for the Care and Use of Laboratory Animals of the National Institutes of Health.
Cell lines and lentiviral transductions
MC38 murine colorectal cancer cells were kept and maintained through serial passage in complete medium (CM) in a humidified chamber at 37°C and 5% CO2. CM consisted of RPMI media (Gibco) supplemented with 10% heat-inactivated fetal bovine serum (FBS), 0.1 mM non-essential amino acids, 1 mM sodium pyruvate, 2 mM fresh L-glutamine, 100 mg/mL streptomycin, 100 U/mL penicillin, 50 mg/mL gentamycin, 0.5 mg/mL fungizone (all from Life Technologies, Rockville, Maryland, USA), and 0.05 mM β-mercaptoethanol (Sigma-Aldrich, St. Louis, Missouri, USA). Empty vector (EV) and CD1d overexpressing (CD1dover) MC38 cells were maintained in CM with 0.5 µg/mL puromycin. To generate these derivative lines, lentiviral particles for murine CD1d (Myc-DDK-tagged; NM_007639) or control particles (pLenti-C-Myc-DDK-P2A-Puro) were obtained from OriGene Technologies Inc (Rockville, Maryland, USA) and used for transduction according to the manufacturer’s instructions.
51Chromium-release cytotoxicity assay
1×10⁶ target cells were labeled with 100 µCi of 51Cr for 2 hours at 37°C. Labeled cells were washed twice with RPMI, resuspended in CM, and plated in 96-well round bottom plates in triplicate at 1×10⁶ cells/mL. Effector cells (TIL) were added at 20∶1, 10∶1, 5∶1, 2.5∶1, 1.25:1, 0.625:1 and 0.3125:1 effector-to-target ratios and incubated at 37°C for 5 hours. Released 51Cr was measured in supernatants using a Trilux (PerkinElmer). Treatment with 5% Triton X gauged maximal killing, and target cells alone measured spontaneous 51Cr release. Triplicates were averaged, and percent lysis was calculated: % cytotoxicity = ((average of triplicated of test 51Cr release condition) – (average of spontaneous 51Cr release))/((average of maximal 51Cr release) − (average of spontaneous 51Cr release)) ×100. Cytotoxicty data are representative of at least three assays.
In vivo MC38 tumor growth and CB treatment
MC38 cells were washed and reconstituted in sterile PBS at 1×10⁶ cells/mL. 1×10⁵ (100 µL) MC38 cells (or derivative) were injected subcutaneously in the upper back of C57BL/6 or NSG mice. For CB treatment, C57BL/6 mice were randomized prior to intraperitoneal injection of 300 µg polyclonal Rat IgG (clone, LTF-2, BioXcell), anti-PD-1 (clone, RMP1-14, BioXcell), and/or anti-CTLA-4 (clone, 9H10, BioXcell). Mice were treated on days 3, 6, and 9 following MC38 inoculation. Mice were humanely euthanized 11 or 21 days post-tumor cell injection. Tumor size was measured with a caliper and recorded every 2 or 3 days. Tumor volume was calculated according to the following formula: volume=height × short diameter × long diameter × π/6.
Tumor dissociation and TIL isolation
Tumors excised postmortem were enzymatically dissociated in Hank’s Balanced Salt Solution containing 1 mg/mL collagenase, 0.1 mg/mL DNase I, and 2.5 units/mL of hyaluronidase (all from Sigma) and complete EDTA-free Protease Inhibitor Cocktail Tablets (Sigma) in gentleMACS C tubes placed in a gentleMACS Dissociator (Miltenyi Biotec, Bergisch Gladbach, Germany). Resulting single cell suspensions were passed in sequence through 100 µm, 70 µm, and then 40 µm cell strainers prior to being washed with PBS. Any residual red blood cells were then lysed with ACK lysis buffer (Gibco) for 5 min. CD90.2+ cells were then isolated according to the manufacturer’s instructions using CD90.2 MicroBeads with the AutoMACS system (Miltenyi Biotec, Bergisch Gladbach, Germany).
Immunofluorescent staining and flow cytometry acquisition
Non-specific staining was blocked for 30 min at 4°C with 300 µL 2% FBS in PBS per 1.0×10⁶ cells. The cells were then labeled with fixable Live/Dead Blue (Invitrogen) after thorough PBS washes. Cell-surface staining was accomplished by 30 min incubation at 4°C with the antibodies indicated in online supplemental table 1. Cells were then washed in PBS, and then fixed and permeabilized using BD Cytofix/Cytoperm solution (BD Biosciences, San Diego, California, USA) as per the manufacturer’s instructions. Intracellular staining was performed by adding the intracellular antibodies in online supplemental table 1 for 30 min at 4°C. Cells were then washed and resuspended in PBS containing 2% bovine serum albumin (BSA) for acquisition on a BD FACSymphony A5 harboring a custom configuration for the H. Lee Moffitt Cancer Center. Control samples included single color staining controls, unstained samples, and fluorescence-minus-one (FMO) controls. Spillover matrixes were calculated after acquisition using FlowJo Software V.10.5 (Becton, Dickinson and Company; Ashland, Oregon, USA).
Supplemental material
t-SNE analysis and hierarchical clustering of TIL populations
All .fcs files were concatenated, and the gating schema depicted in online supplemental figure 3 was applied. Resulting events were then exported as a new .fcs file to reduce file size and computation times by excluding data related to gated-out events. Parameters indicated in online supplemental table 1 were selected for clustering analysis with the following variable settings: iterations=1000; perplexity=60; theta=0.5; eta=200. Following the derivation of t-SNE parameters, TIL population gates were created as described in the main text using FMO data from online supplemental figures 2 and 4 as a guide. Percent positive and median fluorescent intensity (MFI) data from all clustering parameters (online supplemental table 1) were then exported in the context of original sample identification and population. Gate-based analyses, t-SNE, and export functions were performed using FlowJo Software V.10.5 (Becton, Dickinson and Company). For hierarchical clustering of defined TIL populations, each population was exported as aggregate data, and the MFI of each parameter was normalized to a percentile within the analysis range. Each population was then clustered to aid in identification using the one minus Kendall’s correlation method with complete linkage. This was performed on populations (rows) only and not on clustering parameters. Hierarchical clustering was performed using Morpheus software (Broad Institute; https://software.broadinstitute.org/morpheus). Following the derivation of populations, the data were separated back into the original samples so that population frequency and effector function markers could be subsequently analyzed therein.
Statistics
Data are presented as mean±SE. The statistical significance of comparisons between groups of non-parametric variables, such as population frequencies, was determined by Mann-Whitney tests, whereas the statistical significance of comparisons between groups of parametric variables, such as MFI, was determined by unpaired t-test. For 51CR-release cytotoxicity assays and for tumor volume, the area under the curve of each test/mouse was first determined, and Mann-Whitney tests were then used to gauge statistical significance of comparisons between groups. Differences with an associated p value of <0.05 were considered significant. All statistical analyses were performed using GraphPad Prism Software V.6.01 for Windows (GraphPad Software, La Jolla, California, USA).
Results
Identification of MC38 TIL populations with effector activity
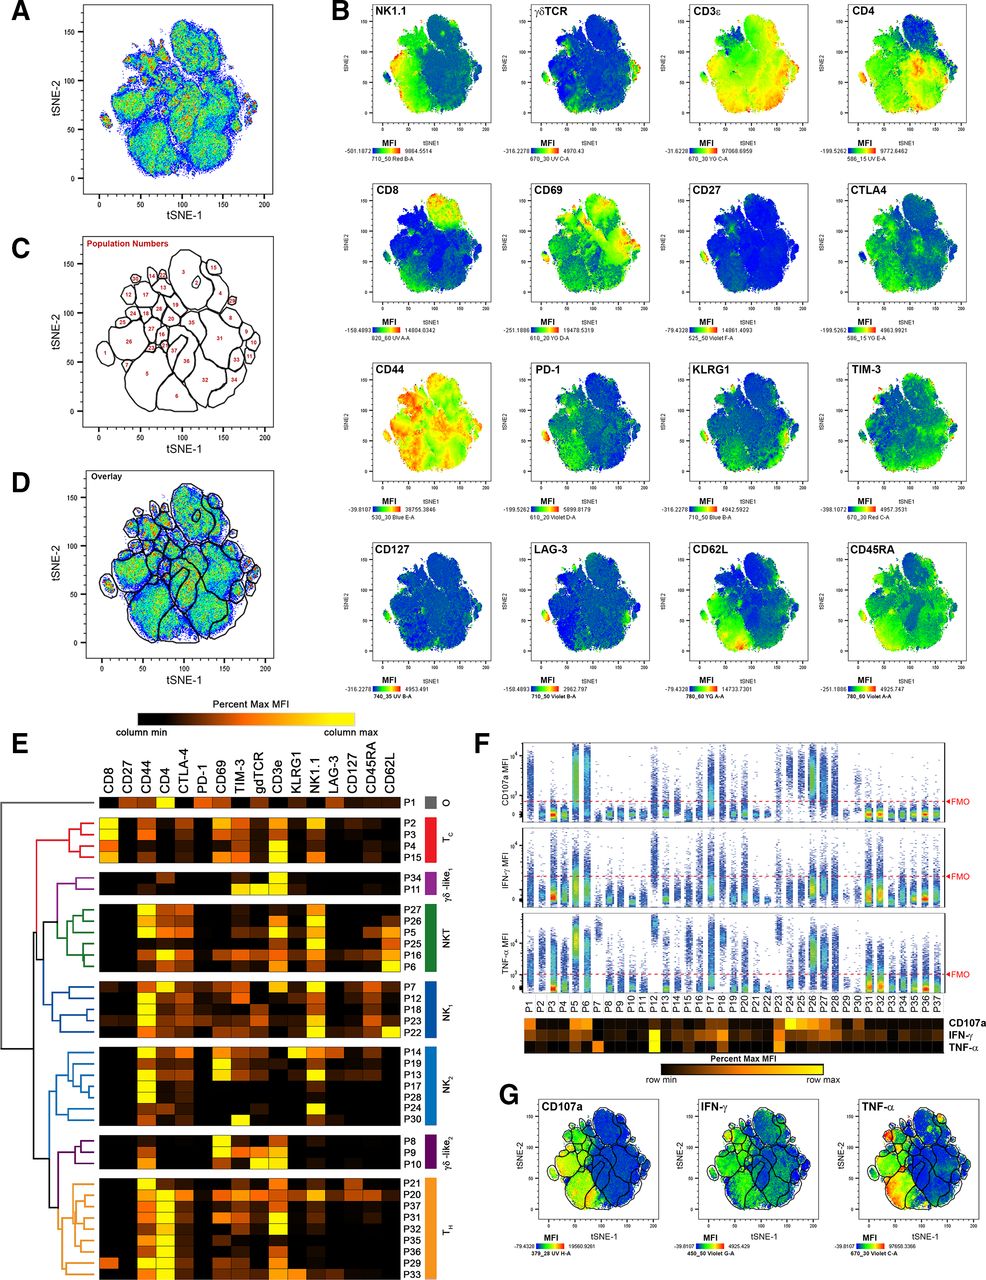
To identify TIL populations responding to CB, we enzymatically digested MC38 tumors resected 11 and 21 days after subcutaneous inoculation in mice treated intraperitoneally with anti-PD-1, anti-CTLA-4, combination (anti-PD-1 and anti-CTLA-4), or isotype control antibodies, which significantly reduced tumor growth in a manner consistent with previous studies25 32 (online supplemental figure 1). Digests were then stained with a panel of immunofluorescent antibodies designed to differentiate major effector lymphocyte populations along with three markers of effector function, intracellular IFN-γ, intracellular TNFα, and cell-surface CD107a (online supplemental table 1). Flow cytometry was used to acquire fluorescent intensities, and fluorescence-minus-one controls were used to assess background signal and guide gate placement (online supplemental figure 2). To focus on effector TIL, aggregates, debris, and non-viable cells were excluded, before CD45.1+ cells, and NK1.1+ and/or CD3ε+ cells were gated on for further analysis (online supplemental figure 3). To identify populations in an unsupervised, comprehensive manner, we applied the t-distributed stochastic neighbor embedding (t-SNE) algorithm,33 34 using CD3ε, CD4, CD8a, CD27, CD44, CD45RA, CD62L, CD69, CD127, CTLA-4, γδTCR, PD-1, KLRG1, LAG-3, NK1.1, and TIM-3 as clustering parameters. This was done on concatenated data such that all samples contributed toward the clustering and identification of TIL populations. We then created a series of gates around 37 distinct TIL populations using a combination of the resulting t-SNE plot (figure 1A), heat map overlays of clustering parameters (figure 1B), and positive event overlays and as determined by FMO controls (online supplemental figure 4). These populations were then arbitrarily numbered (figure 1C,D). To aid in identification, hierarchical clustering analysis was used post hoc to group populations according to their MFIs. Broadly, this analysis detected 4 populations of TC, 6 populations of NKT, 9 populations of TH, 11 populations of NK, 5 populations of γδ T cells, and 1 unidentified population (P1 ‘other’; figure 1E). Hierarchical clustering methodologies grouped populations based on their similarity across all clustering parameters. While most populations within each group expressed the archetypical markers expected for their identities, a few rare populations lacked some expected markers, clustering with their groups based on the sum similarities of other parameters. Examples include P27, which clustered with NKT cells despite low CD3ε expression, and P8 and P34, which clustered with γδ T cells despite lacking γδTCR expression.

t-SNE analysis of effector TIL populations identifies distinct, IFN-γ and TNFα-producing cells at early (day 11) and late (day 21) time points of subcutaneous MC38 growth. (A) Combined pseudocolored density plot of t-SNE parameters of viable, non-aggregate, CD45.2+, CD3ε+ and/or NK1.1+ cells from all time points and treatment conditions. (B) Heat map overlays of parameters used for t-SNE clustering with warm colors (red) representing higher staining levels and cool colors (blue) representing lower staining levels. Median fluorescent intensity (MFI) scales are noted for each parameter. (C) A map of population gates created using part A, part B, and fluorescence-minus-one controls (described in online supplemental figures 2 and 4). (D) Overlay of population gates and the combined pseudocolored density plot of t-SNE parameters. (E) MFI values of clustering parameters from identified TIL populations used in hierarchical clustering analyses. Major clustering groups were then broadly identified: TC, cytotoxic T cells; tH, helper T cells; γδ-like, γδ T cells or T cells clustering with γδ T cells; NK, natural killer cells; or O, other TIL. (F) Expression of effector molecules CD107a (top), IFN-γ (middle), and TNFα (bottom) among each identified TIL population. The extent of background signal for each effector molecule is denoted by a red dashed FMO line as determined by online supplemental figure 2. A heat map of effector molecule MFIs is displayed below the population names. (G) Heat map overlays of effector molecule expression for CD107a (left), IFN-γ (middle), and TNFα (right) over t-SNE parameters with populations gates included. MFI scales are noted for each parameter with warm colors (red) representing higher staining levels and cool colors (blue) representing lower staining levels. FMO, fluorescence-minus-one; t-SNE, t-distributed stochastic neighbor embedding; TIL, tumor infiltrating lymphocyte.
After differentiating TIL populations, we assessed the expression of cell surface CD107a, intracellular IFN-γ, and intracellular TNFα as indicators of effector activity. In this analysis, cell surface CD107a was largely restricted to NK and NKT populations, suggesting that large percentages of these cells are actively degranulating in MC38 tumors. IFN-γ production, which has become a standard for T cell activation and NK activity, was spread across the majority of MC38 TIL populations from all groups at low frequencies, and at moderate frequencies for TH populations P20, P31 and P32, TC populations P3 and P4, NK populations P12, P17, P18, P23, and P28, and NKT populations P5, P6, P16, P26, and P27. TNFα production was robust among NKT population P5, NK populations P7, P12, P18, and P23, and was moderate among NKT populations P6, P25, P26, and P27, NK populations P17, and P28, and TC populations P2 and P15 (figure 1F,G). Following tSNE analysis, data were separated so that the frequencies and effector markers expressions of each population could be analyzed at each time point and for each treatment group.
CB alters temporal dynamics among MC38 TIL populations
The makeup of TIL subpopulations shifted dramatically between early (day 11) and late (day 21) time points of MC38 tumor growth, with most populations exclusively associating with one time point or the other. In many cases, early and late populations appeared analogous, clustering differently based on minor MFI differences (online supplemental figures 5 and 6). Treatment with CB augmented or condensed specific subpopulations within each time point but did not overwhelmingly change any population’s association with either time point (figure 2A). A comprehensive analysis was performed to compare the frequencies of each population at each time point and each treatment that includes p values for significantly changed populations (online supplemental table 2), and the effects of CB on major populations are highlighted in figure 2B. In this study, the majority of TC were represented by two TIL populations: P3 (representing CD69+CD44+ TC) and P4 (TC lacking CD44 and CD69). P3 was restricted to the day 21 time point, constituting 29%±0.23% of TIL and was significantly reduced by half after anti-CTLA-4 or combination CB. P4, while less abundant than P3, is uniquely present at both time points. CB had divergent effects on P4, significantly increasing frequency from 2.±0.52% to over 4% with combination treatment at day 11, while significantly decreasing in frequency from 1.9±0.08% to under 1% with combination treatment at day 21.
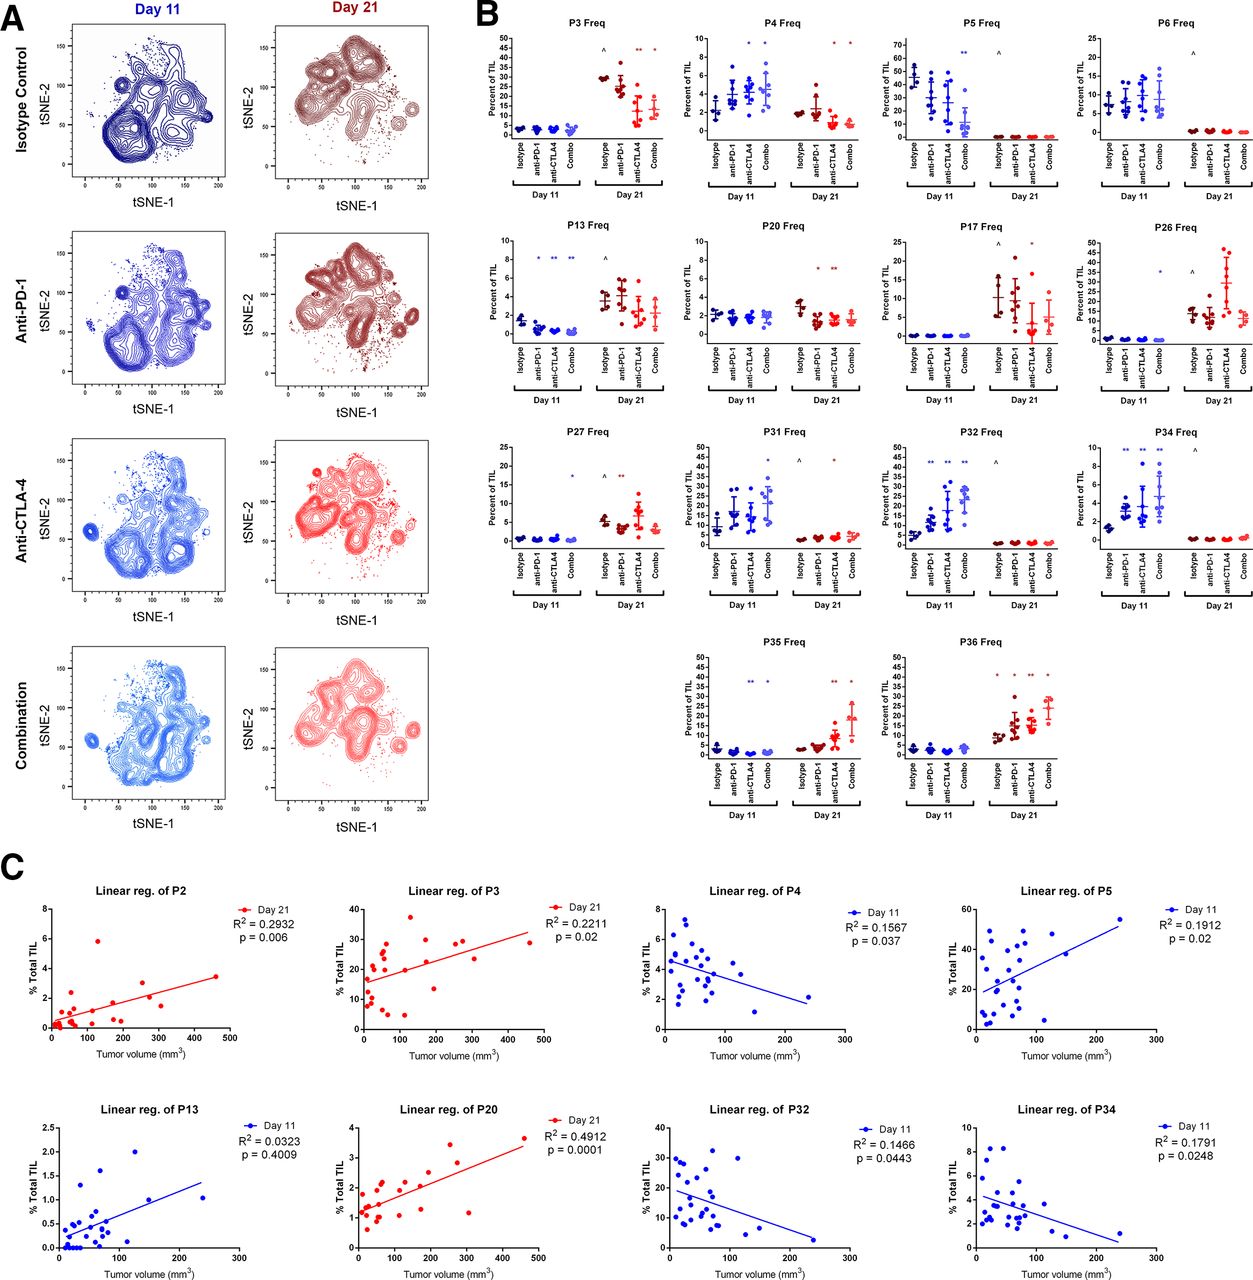
Changes in TIL population frequencies following treatment with checkpoint inhibitors at early (day 11) and late (day 21) time points. (A) t-SNE contour density plots of combined TIL samples from control (isotype treated) mice, or mice receiving anti-PD-1, anti-CTLA-4, or combination treatment (anti-PD-1 and anti-CTLA-4) at day 11 and day 21 of subcutaneous MC38 tumor growth. (B) TIL population frequencies from individual mice displaying prominent changes with CB (*p≤0.05 treatment vs isotype control; **p≤0.01 treatment vs isotype control; ˆp≤0.05 isotype control day 21 vs isotype control day 11). (C) TIL population frequencies from individual mice plotted against tumor volume at the time of resection demonstrating significant correlations. Linear regression best-fit lines are displayed with R2 and p values. Blue plots indicate data from day 11 time points, and red plots indicate data taken from day 21 time points. CB, checkpoint blockade; t-SNE, t-distributed stochastic neighbor embedding; TIL, tumor infiltrating lymphocyte.
Surprisingly, TIL in early tumor growth were not dominated by NK, TH, or TC, but rather by NKT, with population P5 representing nearly half of all day 11 TIL in isotype-treated control mice (46%±3.7%). This population was restricted to the day 11 time point and was significantly reduced with combination CB to 11%±3.9%. P5 differs from the other less prevalent day 11 NKT population P6 by higher CD44 expression and lower CD62L expression, suggesting this population may represent an effector memory (EM) phenotype. NKTs were far less prevalent later in MC38 growth, with P26 representing the largest day 21 NKT population at 14%±1.5% of TIL. Like P5, P26 differed from other day 21 NKT populations by higher CD44 expression and lower CD62L expression. CB did not significantly alter the frequency of P26 at day 21, although treatment with anti-CTLA-4 resulted in larger variability for P26 than other treatment groups or control mice (figure 2B).
Aside from a drastic reduction in NKT frequency during early tumor growth, CB had the largest effect on TH populations. The most prominent TH populations were P31 and P32 at day 11 and P35 and P36 at day 21. P31 appeared to be more activated than P32 at the day 11 time point based on higher CD69 and CD44 expression. Both displayed modest frequencies in isotype-treated control mice (9.2%±2.3% and 5.0%±0.9%, respectively) but were significantly increased following CB. This was particularly true for combination treatment, which increased both P31 and P32 to over 20% of all TIL at the day 11 time point. Similarly, combination CB increased both P35 and P36 at the day 21 time point from 2.8%±0.1% and 8.7%±0.96%, respectively, to around 20% of all TIL for each (figure 2B). P35 and P36 appeared similar in phenotype. Both exhibited an EM phenotype (CD44+CD45−CD27−CD62L−), differing slightly in CD69, TIM-3, and CD3ε, MFI.
Given the multitude of TIL populations that change in response to CB, we performed a comprehensive set of linear regression analyses for each population at each time point against tumor volume at the time of resection to identify populations correlating to tumor growth (online supplemental table 3). In total, six populations at the day 11 time point and four populations at the day 21 time point displayed statistically significant, positive correlations with tumor size, suggesting undesirable associations with tumor growth may exist for these TIL, while three populations at the day 11 time point displayed statistically significant, negative correlations with tumor size, suggesting beneficial associations with tumor growth may exist for these TIL (see online supplemental table 3 for p values). Importantly, these included positive correlations of the major TC population P3 at day 21 and the major NKT population P5 at day 11, both of which were significantly reduced by CB at their respective time points, as well as negative correlations of the major TC population P4 and the major TH population P32, both of which were significantly increased by CB at their respective time points (figure 2C). While these correlations do not prove any direct effect on tumor growth, they suggest a biologically relevant relationship for major NKT, TC, and TH populations.
CB reduces TNFα production and TNFα-producing TIL at both early and late time points in MC38 tumor growth
We next examined how CB affects TNFα production among TIL. Global TIL TNFα production was visualized by overlaying TNFα MFI heat maps over t-SNE plots of pooled TIL samples from both time points for isotype-treated control mice or mice treated with CB (figure 3A). During early MC38 tumor growth, TNFα production was driven by NKT populations P5 and P6. Comparatively modest TNFα production was seen in other day 11 populations, such as the TC population P4, and the TH population P31, or in rare populations such as the NK1.1low TC population P15 or the CD3ε−CD4+ undefined TIL population P1. A comprehensive set of analyses were performed comparing the frequency of TNFα production within each TIL population (online supplemental table 4) and the TNFα MFI of TNFα-producing cells within each TIL population (online supplemental table 5). In the aforementioned populations, CB significantly reduced the frequency of TIL producing TNFα and/or the TNFα MFI of TNFα+ TIL at the day 11 time point (figure 3B–F). Later in MC38 tumor growth, the NK population P12 displayed the strongest TNFα production, followed by the NKT population P26 at the day 21 time point (figure 3A). Except for P12, TNFα production at 21 days was globally lower compared to day 11, with modest TNFα expression among the TC populations P3 and P4, NK populations P17, P20, and P27, and the TH population P20. Treatment with anti-CTLA-4 significantly reduced TNFα MFI of TNFα+ P12 TIL, and treatment with anti-CTLA-4 or combination CB significantly reduced TNFα+ cells within P20 at 21 days (figure 3G-H). In total, 10 TIL populations at day 11 and four at day 21 displayed significantly less percentages of TNFα+ TIL following CB (see online supplemental table 4 for p values). Similarly, eight TIL populations at 11 days and one at 21 days displayed significantly reduced TNFα MFI among TNFα-producing TIL following CB (see online supplemental table 5 for p values). Only P12 displayed a small increase in TNFα+ cell frequency after anti-PD-1 treatment (94.73%±2.34% vs 99.4±0.60%) at 11 days, and P20 (a rare CD44+CTLA-4+CD69+TIM-3+γδTCRlowKLRG1+NK1.1lowLAG-3lowCD127+CD45RA+ TH population) displayed increased TNFα MFI among TNFα-producing TIL at 11 days. Overwhelmingly, CB globally reduced both TNFα+frequency and MFI among MC38 TIL, particularly during early tumor growth.

Changes in TNFα production among TIL populations following treatment with checkpoint inhibitors at early (day 11) and late (day 21) time points. (A) t-SNE plots with TNFα heat map overlays of combined TIL samples from control (isotype treated) mice, or mice receiving anti-PD-1, anti-CTLA-4, or combination treatment (anti-PD-1 and anti-CTLA-4) at day 11 and day 21 of subcutaneous MC38 tumor growth, with warm colors (red) representing higher staining levels and cool colors (blue) representing lower staining levels. A TNFα MFI scale is noted below. (B–H) Analyses of TNFα expression for P1 day 11 (B), P4 day 11 (C), P5 day 11 (D), P6 day 11 (E), P31 day 11 (F), P12 day 21 (G), and P20 day 21 (H). For each, the location of the population within the t-SNE analysis is depicted in the top left, a pooled TNFα dot plot versus CD45.2 expression in the top right, percentage of cells expressing TNFα (bottom left), and TNFα MFI of TNFα+ cells (bottom right) are shown. Data in blue colors denote the day 11 time point, while data in red colors denote the day 21 time point (*p≤0.05 treatment vs isotype control; **p≤0.01 treatment vs isotype control). MFI, median fluorescent intensity; t-SNE, t-distributed stochastic neighbor embedding; TIL, tumor infiltrating lymphocyte.
CB increases IFN-γ production and IFN-γ-producing TIL at both early and late time points in MC38 tumor growth
IFN-γ heat map t-SNE plot overlays of pooled TIL samples revealed dynamic changes in IFN-γ production as MC38 tumor growth progressed and after CB (figure 4A). A comprehensive set of analyses was performed comparing the frequency of IFN-γ production within each TIL population (online supplemental table 6) and the IFN-γ MFI of IFN-γ-producing cells within each TIL population (online supplemental table 7). During early MC38 tumor growth, IFN-γ production was spread across most TIL populations at modest to moderate levels in isotype-treated control animals, with day 11 NKT populations P5 (CD3ε+NK1.1+CD44highCD4lowCD62L+), P6 (CD3ε+NK1.1+CD44−CD4lowCD62L+), and the day 11 NK population P18 (CD3ε−NK1.1+CD44high) among the standout IFN-γ producers. More modest IFN-γ production was observed in other day 11 TIL populations such as TH populations P31 (CD3ε+CD4+CD44midCD69+), P32 (CD3ε+CD4+CD44lowCD69−), P34 (CD3ε+γδTCR−CD4low; clustered with γδ T cell population P11), P37 (CD3ε+CD4+CD44midCD69−), and the day 11 TC population P4 (CD3ε+CD8+CD44−CD69−). In a trend encompassing many TIL populations, CB significantly increased the frequency of IFN-γ+ cells or the IFN-γ MFI of IFN-γ+ cells. This was particularly true during early MC38 tumor growth in the day 11 TC population P4 (figure 4B) and in the day 11 TH populations P31, P32, P34, and P37 (figure 4C–F). At the day 11 time point, a total of nine TIL subpopulations displayed significant increases in IFN-γ+ cell frequency (see online supplemental table 6 for p values), and a total of three TIL subpopulations displayed significant increases in IFN-γ MFI of IFN-γ+ cells following CB (see online supplemental table 7 for p values), whereas only one population displayed a minor reduction in IFN-γ+ cell frequency following anti-PD-1 (P5; online supplemental table 6).

Changes in IFN-γ production among TIL populations following treatment with checkpoint inhibitors at early (day 11) and late (day 21) time points. (A) t-SNE plots with IFN-γ heat map overlays of combined TIL samples from control (isotype treated) mice, or mice receiving anti-PD-1, anti-CTLA-4, or combination treatment (anti-PD-1 and anti-CTLA-4) at day 11 and day 21 of subcutaneous MC38 tumor growth, with warm colors (red) representing higher staining levels and cool colors (blue) representing lower staining levels. A IFN-γ MFI scale is noted below. (B–H) Analyses of IFN-γ expression for P4 day 11 (B), P31 day 11 (C), P32 day 11 (D), P34 day 11 (E), P37 day 11 (F), P3 day 21 (G), and P12 day 21 (H). For each, the location of the population within the t-SNE analysis is depicted in the top left, a pooled IFN-γ dot plot versus CD45.2 expression in the top right, percentage of cells expressing IFN-γ (bottom left), and IFN-γ MFI of IFN-γ+ cells (bottom right) are shown. Data in blue colors denote the day 11 time point, while data in red colors denote the day 21 time point (*p≤0.05 treatment vs isotype control; **p≤0.01 treatment vs isotype control). MFI, median fluorescent intensity; t-SNE, t-distributed stochastic neighbor embedding; TIL, tumor infiltrating lymphocyte.
At 21 days, prominent IFN-γ production was seen among NKT population P26 (CD3ε+NK1.1+CD44midCD4−CD62L−), and among the day 21 NK populations P12 (CD3ε−NK1.1+CD44highCD45RAlow) and P17 (CD3ε−NK1.1lowCD44high). However, the impact of CB was more divergent after 21 days compared with early MC38 tumor growth. At day 21, TC was represented predominately by P3 (CD3ε+CD8+CD44midCD69+), while TH was represented predominately by P36 (CD3ε+CD4+CD44low). For both, CB augmented IFN-γ production in IFN-γ-producing TIL (figure 4G; online supplemental tables 6 and 7), suggesting that the benefit of CB seen in early MC38 tumor growth persists through 21 days. In contrast, IFN-γ production in some less frequent TIL populations was significantly reduced by CB later in MC38 tumor growth, including the day 21 TH population P20, the day 21 NKT populations P16 and P26 (online supplemental table 7), and for the day 21 NK populations P12 (figure 4H and online supplemental table 6) and P13 (online supplemental table 7).
CB induces little change in CD107a expression among TIL MC38 TIL populations
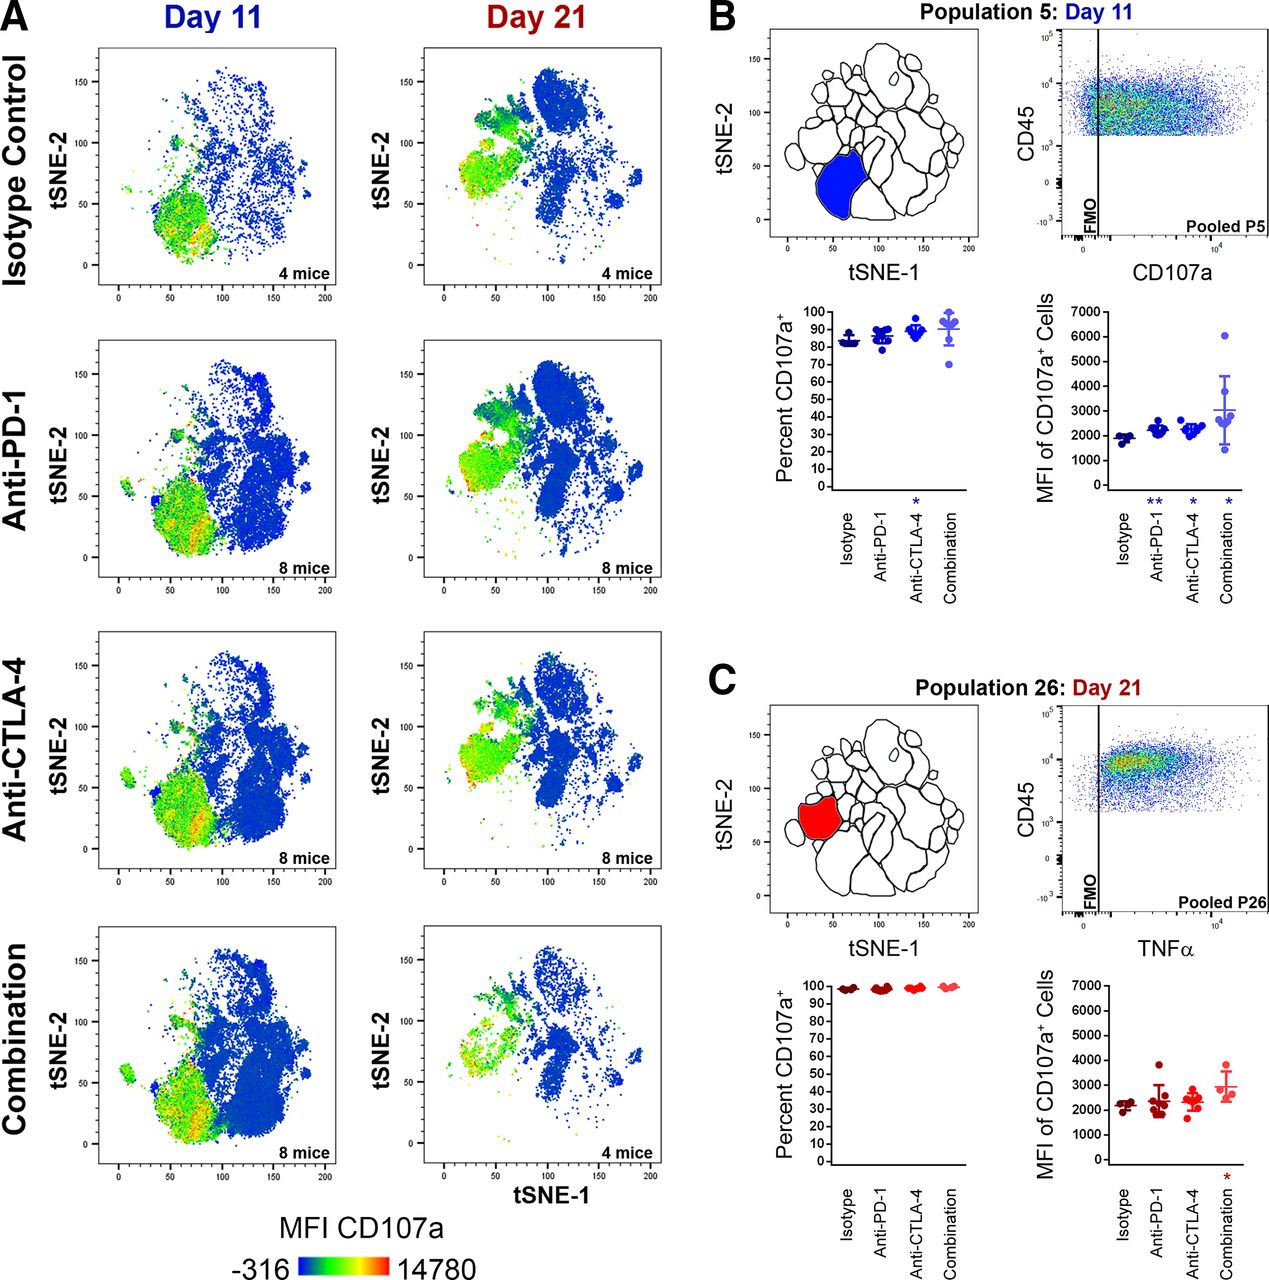
In contrast to TNFα and IFN-γ production, CB had a minimal effect on cell surface CD107a expression. CD107a heat map t-SNE plot overlays of pooled TIL samples showed cell surface CD107a was restricted to NKT populations and most NK populations (figure 5A) and was only observed at low frequencies and MFI among TC, TH, and γδT cells. CB elicited a minor increase in both CD107a cell surface expression and MFI for the major NKT population P5 at the day 11 time point (figure 5B), and in MFI for the day 21 NKT population P26 (figure 5C). Only day 21 NK populations P13, P16, and the unidentified day 11 T cell population P1 demonstrated reduced frequencies of CD107a+ cells following CB (online supplemental table 8). There was a pattern of mild CD107a MFI increase seen among five day 11 TIL populations and among three day 21 TIL populations (online supplemental table 9). However, with the exceptions mentioned previously, cell surface CD107a expression remained overwhelmingly static following CB and was largely ubiquitous among NK and NKT populations (figure 5).

Changes in cell-surface CD107a expression among TIL populations following treatment with checkpoint inhibitors at early (day 11) and late (day 21) time points. (A) t-SNE plots with CD107a heat map overlays of combined TIL samples from control (isotype treated) mice, or mice receiving anti-PD-1, anti-CTLA-4, or combination treatment (anti-PD-1 and anti-CTLA-4) at day 11 and day 21 of subcutaneous MC38 tumor growth, with warm colors (red) representing higher staining levels and cool colors (blue) representing lower staining levels. A CD107a MFI scale is noted below. (B–H) analyses of CD107a expression for P5 day 11 (B) and P26 day 21 (C). For each, the location of the population within the t-SNE analysis is depicted in the top left, a pooled CD107a dot plot versus CD45.2 expression in the top right, percentage of cells expressing CD107a (bottom left), and CD107a MFI of CD107a+ cells (bottom right) are shown. Data in blue colors denote the day 11 time point, while data in red colors denote the day 21 time point (*p≤0.05 treatment vs isotype control; **p≤0.01 treatment vs isotype control). MFI, median fluorescent intensity; t-SNE, t-distributed stochastic neighbor embedding; TIL, tumor infiltrating lymphocyte.
NKT populations display cytotoxic potential but likely serve as cytokine producers in MC38 tumors
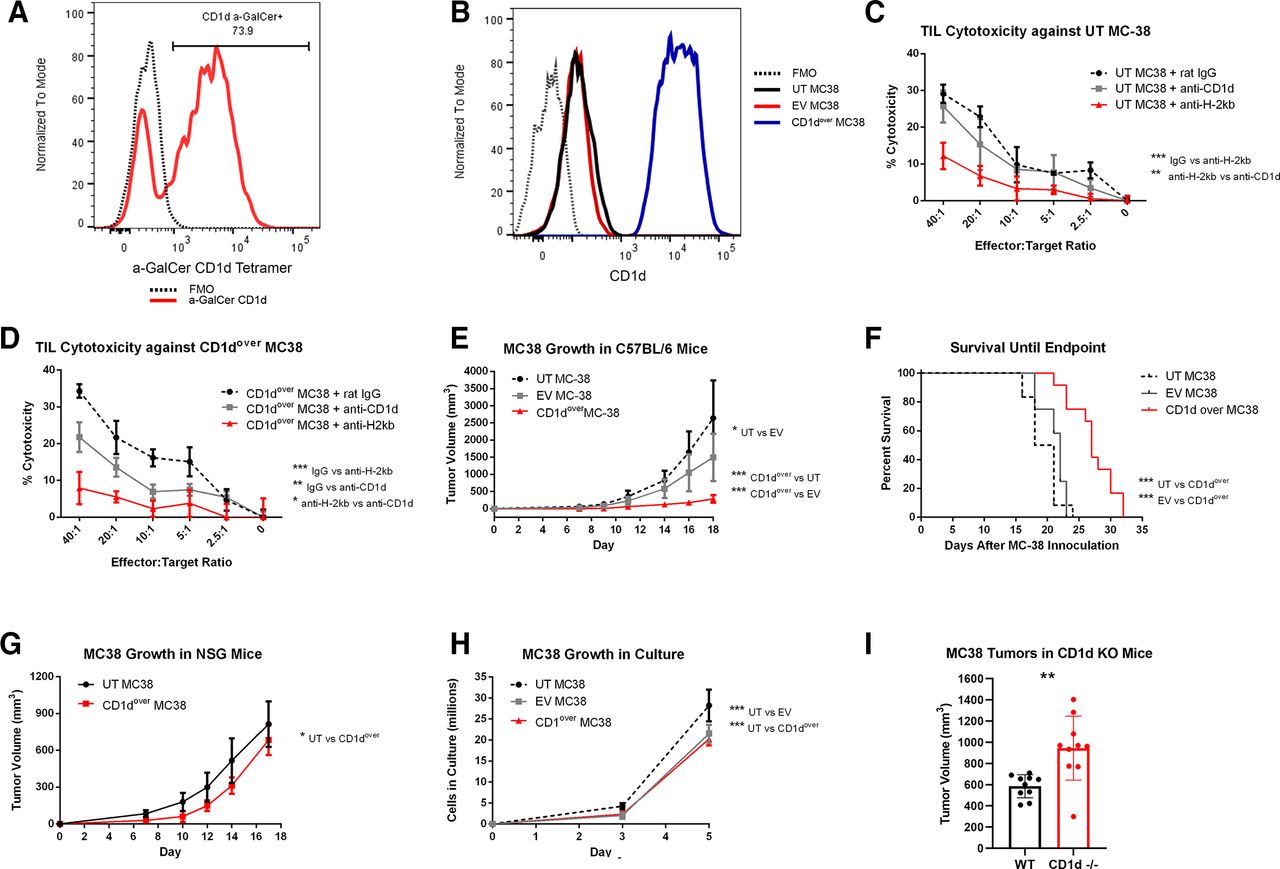
NKT cells are able to recognize lipid antigens presented in the context of CD1d, with the most widely characterized subset expressing an invariant T cell receptor (TCR) recognizing CD1d-restricted alpha-galactosylceramide (α-GalCer; iNKT).35–37 The majority of NKT cells within MC38 tumors bound α-GalCer-loaded CD1d tetramer (figure 6A), indicating MC38 NKTs are largely iNKT. While iNKTs are known for heavy cytokine production, they have also demonstrated lytic potential in a variety of contexts, including cancer.38–40 For conventional T cells and NK cells, CD107a has served as a reliable biomarker of cytolytic activity.41–43 While CD107a has also been correlated to cytotoxic degranulation in NKT cells in vitro,44 the use of CD107a as a surrogate for NKT cytotoxicity is less well established, and so strong cell-surface staining of CD107a on MC38 NKT populations led us to investigate their lytic potential against MC38 targets. Toward this end, we compared the cytotoxicity of TIL isolated from resected MC38 tumors against either untransduced MC38 target cells (UT MC38), which expressed low levels of CD1d, or against MC38 target cells overexpressing CD1d (CD1dover) (figure 6B). Cytotoxicity against UT MC38 was significantly impaired by blocking H-2Kb but not by blocking CD1d (figure 6C), whereas cytotoxicity against CD1dover MC38 target cells was significantly reduced by blocking CD1d, although not to the extent of blocking H-2Kb (figure 6D). In a similar manner, subcutaneous MC38 tumor growth was significantly reduced, and overall survival significantly improved, for CD1dover MC38 cells compared with UT MC38 or EV-transduced control MC38 (EV MC38) (figure 6E,F). These effects required the presence of an intact immune system as evidenced by tumor growth studies in NSG mice (figure 6G). Modified MC38 displayed only minor differences regarding in vitro growth kinetics (figure 6H). We also compared MC38 tumor growth in wild-type (WT) C57BL/6 mice and mice genetically lacking CD1d (CD1d−/−), which fail to develop both iNKT and type II NKT cells.45 MC38 tumors grew significantly larger in CD1d−/− mice by day 14 postinoculation (p=0.0024; figure 6I). Taken together, these studies indicate that while MC38 NKTs have the potential for cytolytic activity against MC38 target cells, they may not meaningfully contribute to the overall cytotoxicity seen by MC38 TIL against untransduced MC38 cells. This is despite a clear ability of infiltrating NKT cells to slow MC38 tumor growth, which likely assert effector response through secreted cytokines such as TNFα instead of through direct cytotoxicity against MC38 cells.

Functional analysis of CD1d overexpression in MC38 tumors. (A) Detection of NKT cells recognizing the CD1d a-GalCer tetramer among MC38 TIL by flow cytometry. Events were gated so as to exclude aggregates, debris, and non-viable cells, before CD45.2+ cells were selected in a similar manner to online supplemental figure 3, with the exception that only CD3ε+NK1.1+ double-positive events were selected for analysis. An FMO control sample lacking the α-GalCer tetramer is depicted by a dashed black line, while α-GalCer tetramer among MC38 NKT cells is shown is red. (B) CD1d expression as measured by flow cytometry on untransduced (UT) MC38 (black), empty vector (EV) control MC38 (red), or CD1d overexpressed (CD1dover) MC38 (blue). FMO control samples lacking CD1d staining is depicted by a black dashed line. (C and D) TIL isolated from MC38 tumors were placed in coculture with 51CR-labeled UT (C) or CD1dover (D) MC38 target cells at increasing effector-to-target ratios, and percent cytotoxicity was determined by 51CR release after 4 hours in the presence of blocking antibodies against CD1d (gray), H-2Kb (red), or control irrelevant IgG antibody (dashed black). Representative of three experiments. (E and F) Subcutaneous MC38 tumor growth (E) and overall survival until endpoint (F) of C57BL/6 mice inoculated in the flank with UT (dashed black), EV (gray), or CD1dover (red) MC38 cells (n=12). (G) Subcutaneous MC38 tumor growth in NSG mice inoculated in the flank with UT (black) or CD1dover (red) MC38 cells. (H) In vitro growth kinetics of UT (dashed black), EV (gray), or CD1dover (red) MC38 cells. (I) MC38 tumor growth in wild-type control mice or in CD1d−/− mice at day 14 postinoculation (n=10). *p≤0.05; **p≤0.01; ***p≤0.001; ****p≤0.0001 for indicated comparisons. FMO, fluorescence-minus-one; NKT, natural killer T cell; TIL, tumor infiltrating lymphocyte.
Discussion
The immune profiling of CB-responsive TIL revealed two contrasting landscapes of effector lymphocytes at 11 and 21 days of MC38 tumor growth. At the earlier time point, effector function appears to hinge on highly inflammatory NKT cell populations, producing copious amounts of TNFα, and make up a combined majority of all TIL, whereas significantly less NKT cells persist at the later time point, which produce lower levels of TNFα. This is concurrent with increased frequencies of TC cells and more activated phenotypes and IFN-γ production among both TC and TH populations. Importantly, treatment with CB appears to hasten this switch, reducing TNFα across many TIL populations, greatly reducing NKT cell frequencies while augmenting TC and TH frequencies and IFN-γ production. This is particularly true for TH populations, many of which increase frequency by factors of 2–5 following CB. NK cells appear to be less dynamic between early and later time points and appear less affected by CB. These results provide an important temporal context of a NKT-T cell switch that may represent a key milestone at which the antitumor immune response turns from an inflammation-driven axis and toward an adaptive axis (online supplemental figure 7). Thus, CB may have an additional benefit in shortening early-stage tumor-associated inflammation, which is widely recognized as a hallmark of tumor progression.
The scope of this analysis, while in depth, was limited to the spectrum of tumor-infiltrating NK, NKT, and T cells. Recent advances in the field have highlighted the importance of tumor-infiltrating B cells as regulators of tertiary lymphoid structure function46–48 and antigen presenting cells within the tumor microenvironment.49 This is added to the myriad of other immune cells affecting antitumor immunity, including macrophage, dendritic cells, and suppressive populations such as regulatory T cells and myeloid-derived suppressor cells. CB is known to reduce the frequency of immune suppressive populations including Treg.25 32 While the immune phenotyping panel employed here was limited by the lack of a functional Treg marker, it is likely that TH populations representing Treg are among those that produce little or no TNF-α or IFN-γ due to the propensity of Treg to produce anti-inflammatory or suppressive cytokines and not type I interferons or proinflammatory factors.50 Possible Treg populations include P33, which had no detectable TNF-α or IFN-γ at either time point or following any treatment or control. While not highlighted in figure 2, P33 was significantly reduced by CB (online supplemental table 2). Temporal studies such as the one performed here that include markers for suppressive populations and other lymphocyte populations such as B cells may provide further context or insight regarding the NKT/T cell switch identified here, reveal additional immune response shifts and broaden our understanding of how CB response can change over time.
This study reveals that a surprising proportion of the overall immune response is represented by NKT cells during early MC38 tumor growth. The potential of NKT cells, and in particular iNKT cells, to lyse tumor cells has been well described,38–40 yet NKT cells are not widely regarded as major contributors to tumor clearance, with some subpopulations implicated in tumor-induced immune suppression due to the production of soluble suppressive factors or by modulating dendritic cell function.51 52 Here, we demonstrate that NKT populations within MC38 TIL can recognize and lyse MC38 target cells when CD1d is overexpressed, suggesting that cognate lipid antigen is produced by MC38 and presented by CD1d. However, low levels of CD1d expressed on parent MC38 are insufficient to meaningfully induce NKT cytotoxicity. In some cases, NKT cells may be able to lyse target cells independently of CD1d through NK-like mechanisms such as NKG2D engagement,44 and thus non-TCR mediated cytotoxicity from MC38 NKT calls cannot be ruled out. However, blockade of H-2Kb clearly demonstrates that most cytotoxic pressure from MC38 TIL comes from conventional T cells. Nevertheless, MC38 NKT cells appear highly activated and produce large amounts of TNFα, raising the possibility that a significant portion of the early immune response may be mediated by inflammation secondary to CD1d-restricted NKT activation. This is reinforced by greatly impaired MC38 tumor growth following CD1d overexpression and increased tumor burden in mice genetically lacking CD1d. The role of TNF has been called paradoxical,53 owing to observations that it can be both protumor54 55 and antitumor56–60 depending on context in the tumor microenvironment. Importantly, TNFα has been shown to upregulate PD-L1 in the tumor microenvironment,61 and in this way, its blockade overcomes resistance to CB in melanoma.62 While early control of MC38 tumor growth may benefit from NKT-mediated TNFα production, this study suggests that acquiescence of this response may be a provisional condition permissive to conventional TH and TC adaptive immunity and adds to the reciprocal nature of TNFα and immune checkpoint axes.
Previous reports have identified exhausted-like TC populations, as well as ICOS+ TH populations as the major TIL subtypes responding to CB at 21 days.25 32 Here, we report a significant increase in the frequency of P4, a TIM-3+ TC population lacking central memory markers. This population may be analogous to the exhausted-like TC previously described.25 Among MC38 TIL, we observed a greater heterogeneity in TH cells compared with TC cells, and these include the highly activated TIM-3+ EM-like population P31 and the less activated P35 and P36. While it is possible these populations are analogous to the CB-responding follicular-like TH cells previously described in MC38 tumors,25 additional transcription factor data are needed to draw more definitive parallels.
Due to heavy immune cell infiltration, the MC38 tumor model has been widely used to study response to immunotherapies. Yet, the involvement of NKT cells in this model has not been investigated, possibly due to the temporal nature of the NKT response described here. By day 21, a time point representative of most in vivo MC38 studies, NKT effector response is diminished in favor of conventional T cell response. These studies do not address NKT involvement in other tumor models, although the conclusions drawn here would suggest that other CD1d-expressing tumors may experience a similar NKT/TNFα to T cell/ IFN-γ switch. An important question raised by these studies is whether an analogous switch occurs in CD1d− tumors. NKT cells are not the only effector cells capable of TNFα production, and it is possible that populations analogous to these cells may exist in early tumor growth in other models. Likewise, other cells in the tumor microenvironment, such as dendritic cells, may express CD1d and present lipid antigen to infiltrating NKT cells, thereby eliciting antitumor immunity.63 Therefore, temporal analysis of effector immune response in both CD1d-expressing and CD1d− tumors represents important future directions to better understand the NKT/TNFα to T cell/ IFN-γ switch and how it relates to CB response.
Data availability statement
Data are available on reasonable request.
Ethics statements
Ethics approval
All animal protocols were reviewed and approved by the Institutional Animal Care and Use Committee at the University of South Florida.
References
Supplementary materials
Supplementary Data
This web only file has been produced by the BMJ Publishing Group from an electronic file supplied by the author(s) and has not been edited for content.
Footnotes
Contributors SA, AWM, and JJM conceived of the project, designed experiments, and interpreted results. AWM wrote the manuscript with assistance from SA, PP-V, and JJM; SA, RN, SN, PP-V, and AWM developed methodologies, and SA and PP-V executed animal experiments, cytotoxicity assays, and some flow cytometry assays. AM developed and acquired the main flow cytometry panel with assistance from SA, RN, SN, and PPV; AM performed t-distributed stochastic neighbor embedding (t-SNE) analysis and subsequent statistical analyses. AWM created figures with assistance from SA and PP-V.
Funding This work was supported by the Flow Cytometry Shared Resource at the H. Lee Moffitt Cancer Center and Research Institute, a National Cancer Institute (NCI)-designated Comprehensive Cancer Center (P30-CA076292). This work was funded by the NCI-NIH (1R01 CA148995, 1R01 CA184845, P30 CA076292, P50 CA168536, and R21 CA214285-01A1), Cindy and Jon Gruden Fund, Chris Sullivan Fund, V Foundation, and Dr. Miriam and Sheldon G. Adelson Medical Research Foundation.
Competing interests None declared.
Provenance and peer review Not commissioned; externally peer reviewed.
Supplemental material This content has been supplied by the author(s). It has not been vetted by BMJ Publishing Group Limited (BMJ) and may not have been peer-reviewed. Any opinions or recommendations discussed are solely those of the author(s) and are not endorsed by BMJ. BMJ disclaims all liability and responsibility arising from any reliance placed on the content. Where the content includes any translated material, BMJ does not warrant the accuracy and reliability of the translations (including but not limited to local regulations, clinical guidelines, terminology, drug names and drug dosages), and is not responsible for any error and/or omissions arising from translation and adaptation or otherwise.